
Back to Journals » Clinical Ophthalmology » Volume 19
Central Macular Thickness and Foveal Avascular Zone are Indicators of Early Diabetic Retinopathy
Received 27 June 2025
Accepted for publication 9 September 2025
Published 22 September 2025 Volume 2025:19 Pages 3505—3514
DOI https://doi.org/10.2147/OPTH.S544037
Checked for plagiarism Yes
Review by Single anonymous peer review
Peer reviewer comments 4
Editor who approved publication: Dr Yousef Fouad
Qingquan Wei,1 Wenying Wang,2 Qinghua Qiu1,3,4
1Department of Ophthalmology, Tongren Hospital, Shanghai Jiao Tong University School of Medicine, Shanghai, People’s Republic of China; 2Institute of Ophthalmology, Beijing Tongren Hospital, Capital Medical University, Ophthalmology Center, Beijing, People’s Republic of China; 3High Altitude Ocular Disease Research Center of People’s Hospital of Shigatse City and Tongren Hospital Affiliated to Shanghai Jiao Tong University School of Medicine, Shigatse, People’s Republic of China; 4Department of Ophthalmology, Shigatse People’s Hospital, Shigatse, Xizang, People’s Republic of China
Correspondence: Qinghua Qiu, Department of Ophthalmology, Tong Ren Hospital, Shanghai Jiao Tong University School of Medicine, 1111 Xianxia Road, Shanghai, People’s Republic of China, Tel +86 13386259756, Email [email protected] Wenying Wang, Institute of Ophthalmology, Beijing Tongren Hospital, Capital Medical University, Ophthalmology Center, Beijing, People’s Republic of China, Email [email protected]
Purpose: Diabetic retinopathy (DR) is one of the most common complications in diabetic patients, and early diagnosis and intervention are crucial for slowing disease progression. This study aims to investigate the changes in central macular thickness (CMT) and foveal avascular zone (FAZ) area in healthy individuals, patients with no apparent diabetic retinopathy (NDR), and patients with non-proliferative diabetic retinopathy (NPDR), and to explore the potential risk factors for early DR.
Methods: This cross-sectional study included 60 healthy individuals, 60 patients with no DR, and 60 patients with mild NPDR. All participants underwent comprehensive ophthalmic examinations. Central macular thickness (CMT) was measured using optical coherence tomography (OCT), and the FAZ area was measured using optical coherence tomography angiography (OCTA). The potential associations between CMT and FAZ area and systemic risk factors for early DR (including duration of diabetes, body mass index (BMI), glycated hemoglobin (HbA1c), lipid profile, and blood pressure) were analyzed.
Results: Significant differences in CMT and FAZ area were observed in both the right and left eyes of the NPDR and NDR groups compared to the control group (p< 0.05). The CMT and FAZ area also showed significant differences between the NPDR and NDR groups (p< 0.05). Additionally, CMT was positively correlated with the duration of diabetes, BMI, total cholesterol (TC), triglyceride (TG), systolic blood pressure, and diastolic blood pressure (p< 0.05). FAZ area was positively correlated with the duration of diabetes and BMI (p< 0.05).
Conclusion: The increase in CMT and the reduction in macular perfusion may be the earliest retinal structural changes in diabetic patients, and both changes are closely related to systemic factors. These findings provide important structural and metabolic indicators for the early identification and intervention of diabetic retinopathy.
Keywords: diabetic retinopathy, central macular thickness, foveal avascular zone, optical coherence tomography angiography
Introduction
Diabetic retinopathy (DR), a common microvascular complication of diabetes mellitus, is a leading cause of vision loss and blindness worldwide.1 Diabetic retinopathy is the leading cause of new blindness among diabetic patients.2,3 In 2020, over 103 million people with diabetes worldwide were affected by this disease, and this number is projected to increase to 160 million by 2045.1 Without effective prevention and management, the burden of diabetic retinopathy will continue to grow, putting more patients at risk of severe vision-damaging complications such as diabetic macular edema (DME) and proliferative diabetic retinopathy.
In its nascent stages, DR frequently progresses insidiously without overt symptoms, yet if left unchecked, it can precipitate severe visual impairment.4 DME, marked by the pathological accumulation of fluid in the macula, stands as a pivotal factor in vision loss among DR patients.5 Early alterations in central macular thickness (CMT) and the foveal avascular zone (FAZ) serve as particularly salient indicators of disease progression and visual prognosis.6–8 Thus, delineating the relationship between these structural changes and systemic risk factors is imperative for early detection and intervention.
Systemic risk factors, encompassing chronic hyperglycemia, diabetes duration, elevated HbA1c levels, hypertension, and dyslipidemia, have been extensively implicated in the pathogenesis of DR.9–11 These factors may compromise retinal microvascular integrity and hemodynamics, thereby engendering measurable changes in CMT and FAZ.4,12,13 Advances in imaging modalities, particularly optical coherence tomography (OCT) and optical coherence tomography angiography (OCTA), have enabled precise quantification of these structural and vascular alterations, affording valuable insights into the early pathophysiology of DR.14–16
Our previous pilot study preliminarily examined the relationship between systemic risk factors and changes in CMT in patients with early DR, but it did not explore alterations in the FAZ or their associations with these risk factors.17 Building on this earlier work, the present investigation incorporates FAZ metrics to comprehensively evaluate the concomitant impact of multiple systemic risk factors on both CMT and FAZ. By identifying potential risk predictors and linking them to early structural changes, this study aims to inform the development of targeted diagnostic and therapeutic strategies, ultimately improving clinical outcomes for patients at risk of DR progression.
Materials and Methods
Ethical Approval
This cross-sectional study was conducted in the Department of Ophthalmology at Tong Ren Hospital, affiliated with Shanghai Jiao Tong University School of Medicine. The study was approved by the Research Ethics Committee of Tong Ren Hospital, Shanghai Jiao Tong University School of Medicine, Shanghai, China. All procedures complied with the principles outlined in the Declaration of Helsinki. Informed consent was obtained from all patients who participated in the examinations and procedures.
Participants and Grouping
This study recruited 180 participants aged 40 years or older between January 1, 2023, and January 1, 2025, and divided them into three groups: a control group of 60 healthy individuals (Group 1), a NDR group of 60 patients without signs of diabetic retinopathy (Group 2), and a NPDR group of 60 patients with mild NPDR (Group 3). Inclusion criteria required participants to have at least one year of type 2 diabetes history, no DR or mild NPDR, and a first visual acuity of 6/10 or better. The NDR group showed no signs of diabetic retinopathy, including microaneurysms, hemorrhages, and exudates. The fundus of the mild NPDR group showed signs of mild NPDR, including a few microaneurysms and/or a few hemorrhages. Exclusion criteria encompassed participants with clinically significant diabetic macular edema (CSME), any neurodegenerative disorders, any pre-existing ocular pathologies, history of refractive or ocular surgical interventions, prior laser photocoagulation or other retinal procedures, type 1 diabetes mellitus, systemic conditions such as anemia and cardiovascular diseases, tobacco smoking history, and those on medications beyond those used for diabetes and hypertension management.
Ophthalmological Examinations
Each patient underwent a detailed examination by a professional ophthalmologist for both eyes and had a detailed medical history review. Measured items included first visual acuity (VA), best corrected visual acuity, intraocular pressure, anterior segment, axial length, and posterior segment examination and fundus examination. Macular thickness measurements were performed using an OCT imaging system (BM-400 K BMizar, Tupai Medical Technology, China) after pupil dilation, with scanning area of 6 mm × 6 mm (400,000 A-scans/second), centered on the macula. OCTA (BM-400 K BMizar, Tupai Medical Technology, China) was performed using a 6 mm × 6 mm (400,000 A-scans/second) Angio Retina protocol centered on the macula. We employed the ETDRS grid-based segmentation method to ensure the consistency of the measurements. The CMT and FAZ was automatically measured by the software.
Laboratory Tests
Patients were diagnosed with type 2 diabetes mellitus of blood samples were collected from patients after fasting for 12 hours in the morning to measure the concentrations of glycated hemoglobin (HbA1c), lipid profile, total cholesterol (TC), and triglycerides (TG) using an auto-analyzer (high-performance liquid chromatography, ADVIA-1650 Chemistry System, Bayer Corporation, Germany).
Statistical Analysis
Based on our pilot data (mean between-group difference ≈ 22 μm, SD ≈ 18 μm for CMT; mean difference ≈ 0.05 mm², SD ≈ 0.04 mm² for FAZ area), and setting α = 0.05 with 80% power, G*Power 3.1 indicated a minimum of 26 participants per group. To account for an anticipated 10% dropout rate, we enrolled no fewer than 30 participants per group, ensuring adequate statistical power for the primary endpoints. Data are expressed as mean ± standard deviation (SD). Statistical analyses were performed using SPSS V.19.0 for Windows (SPSS, Chicago, Illinois, USA). Comparisons of means between groups were analyzed by analysis of variance (ANOVA), and data that did not conform to a normal distribution were analyzed using a nonparametric test (Mann–Whitney U-test). When exploring the correlation between central macular thickness (CMT) and foveal avascular zone (FAZ) area and systemic risk factors, appropriate analysis methods were selected based on the distribution of the data: the Pearson correlation coefficient was used if the data followed a normal distribution, while the Spearman correlation coefficient was applied if the data did not conform to a normal distribution. A p value of less than 0.05 was considered statistically significant.
Results
Basic Characteristics of the Study Population
In our study, a total of 180 participants were recruited and categorized into three distinct groups: Group 1 consisted of 60 healthy individuals without DR; Group 2 included 60 patients with diabetes mellitus but without any signs of DR; and Group 3 comprised 60 patients with NPDR. The detailed clinical and laboratory characteristics of these three groups are presented in Table 1.
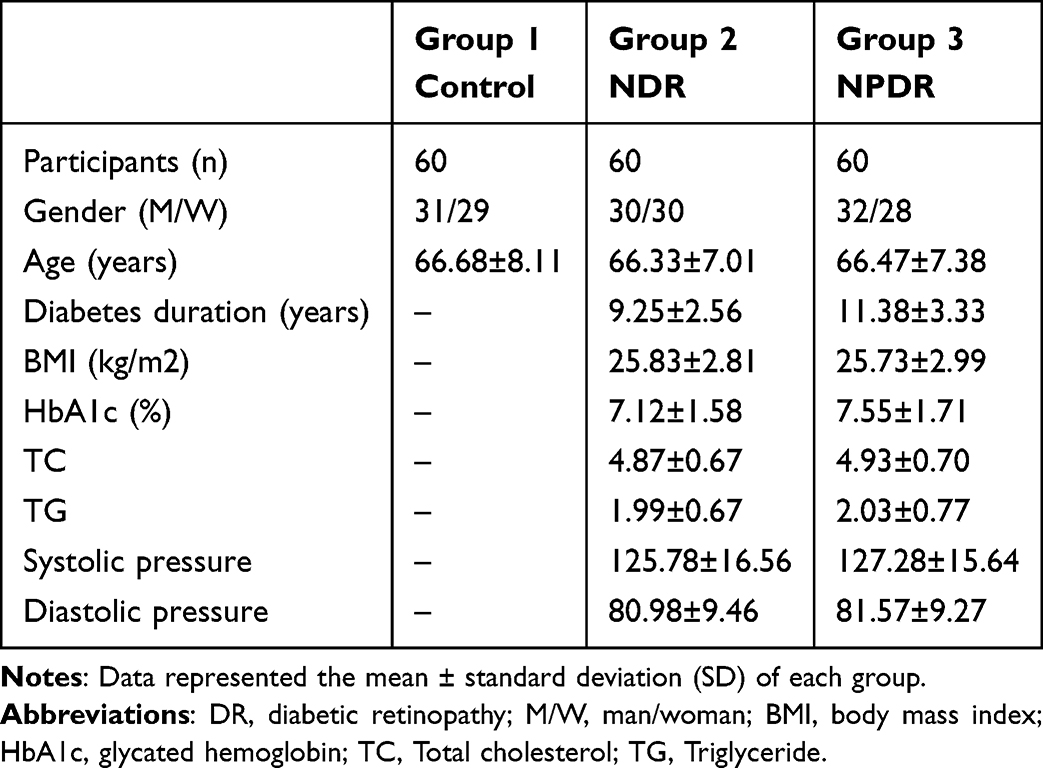 |
Table 1 Comparisons of Characteristics According to Three Groups |
CMT and FAZ Area in Different Groups
In the NPDR cohort, the mean CMT was 263.2 ± 11.48 µm in the right eye and 263.9 ± 12.51 µm in the left eye. Within the NDR group, the mean CMT was 256.57 ± 18.61 µm in the right eye and 256.07 ± 19.24 µm in the left eye. In the normal control group, the mean CMT was 237.90 ± 15.53 µm in the right eye and 240.45 ± 18.92 µm in the left eye. Statistically significant differences in CMT were observed between the NPDR and control groups, as well as between the NDR and control groups. Additionally, a significant difference in CMT was noted between the NPDR and NDR groups (Table 2).
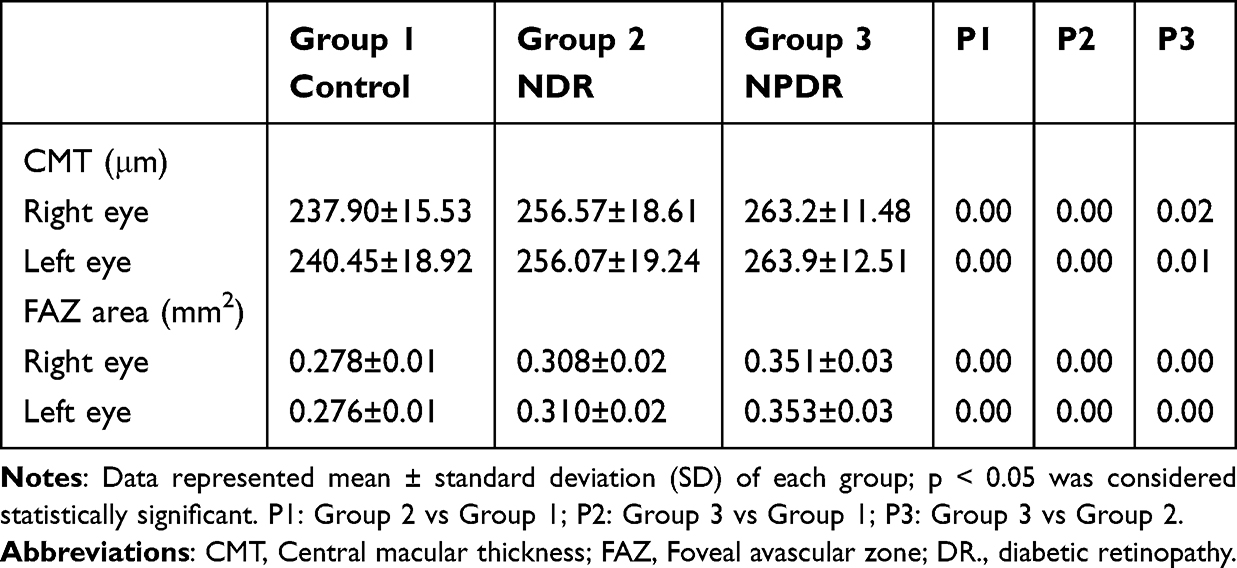 |
Table 2 CMT and FAZ Area of Subjects in Three Groups |
Regarding the FAZ area, the NPDR group exhibited a mean FAZ area of 0.351 ± 0.03 mm² in the right eye and 0.353 ± 0.03 mm² in the left eye. The NDR group had a mean FAZ area of 0.308 ± 0.02 mm² in the right eye and 0.310 ± 0.02 mm² in the left eye. In the normal control group, the mean FAZ area was 0.278 ± 0.01 mm² in the right eye and 0.276 ± 0.01 mm² in the left eye. Significant differences in FAZ area were detected between the NPDR and control groups, as well as between the NDR and control groups. Furthermore, a significant difference in FAZ area was observed between the NPDR and NDR groups (Table 2).
CMT and FAZ Area and Systemic Risk Factors for Diabetic Retinopathy
The CMT in both eyes was positively correlated with the duration of diabetes, BMI, TC, TG, systolic blood pressure, and diastolic blood pressure (Table 3 and Figures 1–3). In addition, the FAZ area in both eyes was positively correlated with the duration of diabetes and BMI (Table 3 and Figure 4).
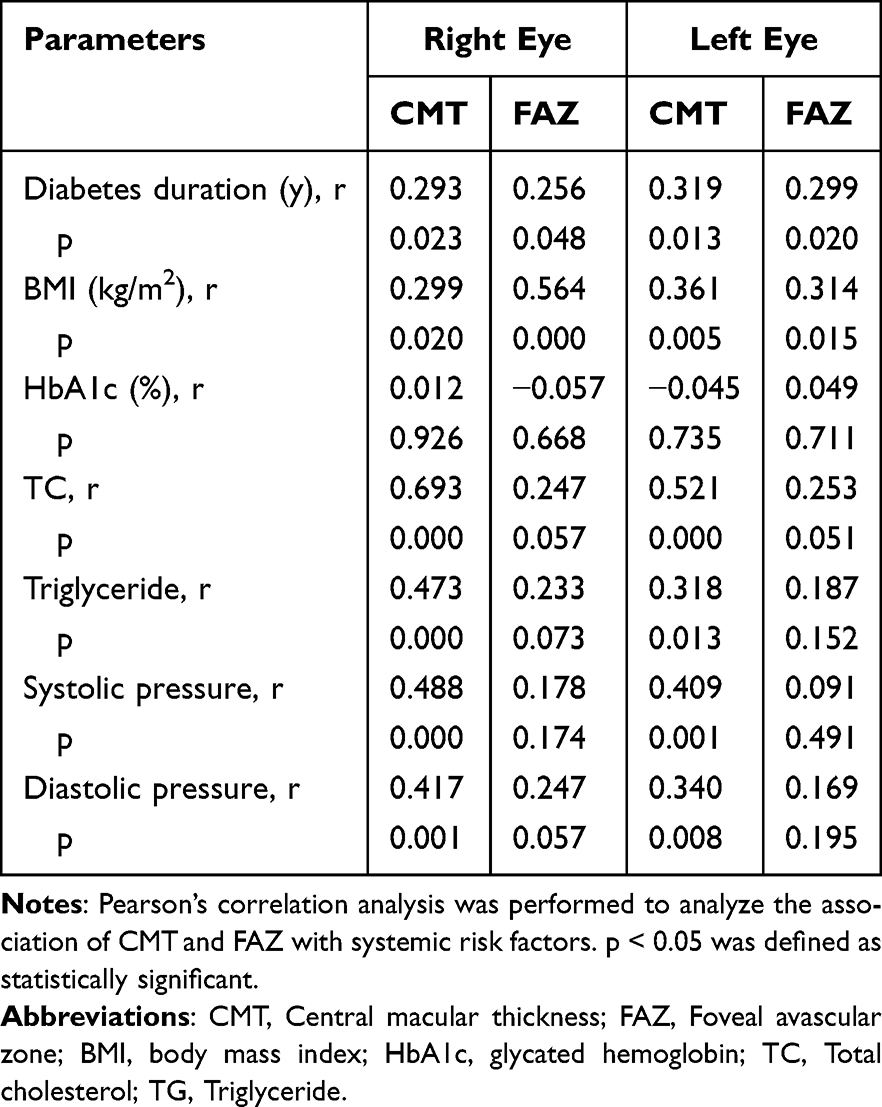 |
Table 3 Correlation Analysis of CMT and FAZ Area with Systemic Risk Factors |
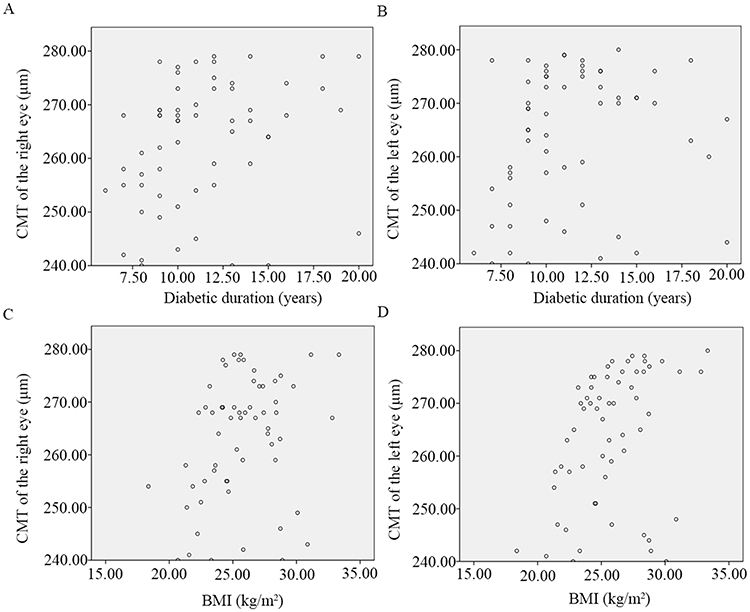 |
Figure 1 Scatter plot of the correlation between CMT and diabetes duration in right (A) and left (B) eyes and the correlation between CMT and BMI in right (C) and left (D) eyes. |
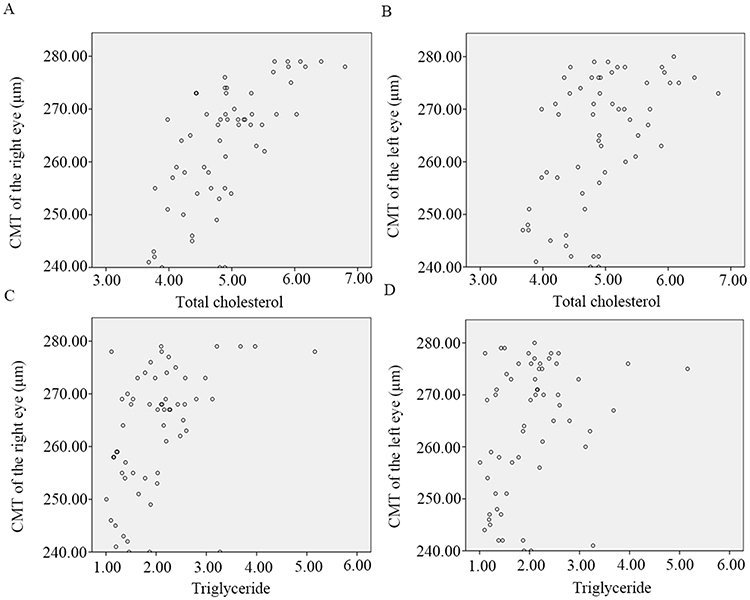 |
Figure 2 Scatter plot of the correlation between CMT and total cholesterol in right (A) and left (B) eyes and the correlation between CMT and triglycerides in right (C) and left (D) eyes. |
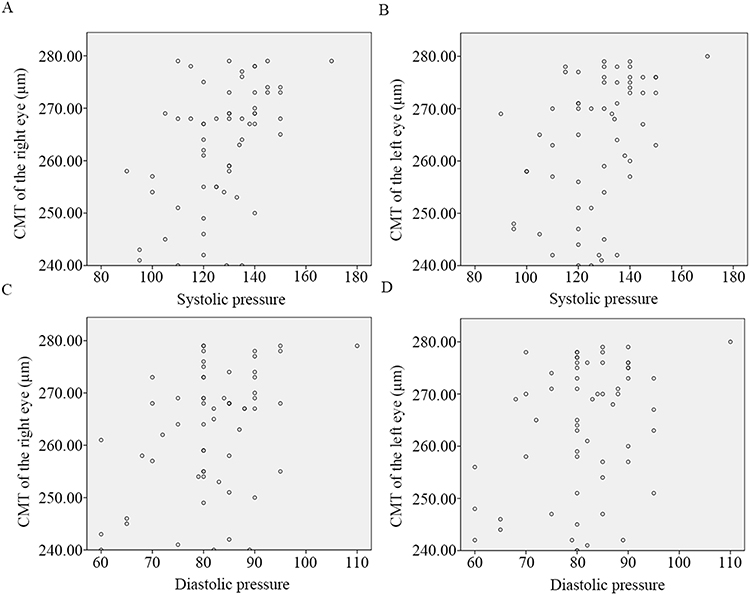 |
Figure 3 Scatter plot of the correlation between CMT and systolic pressure in right (A) and left (B) eyes and the correlation between CMT and diastolic pressure in right (C) and left (D) eyes. |
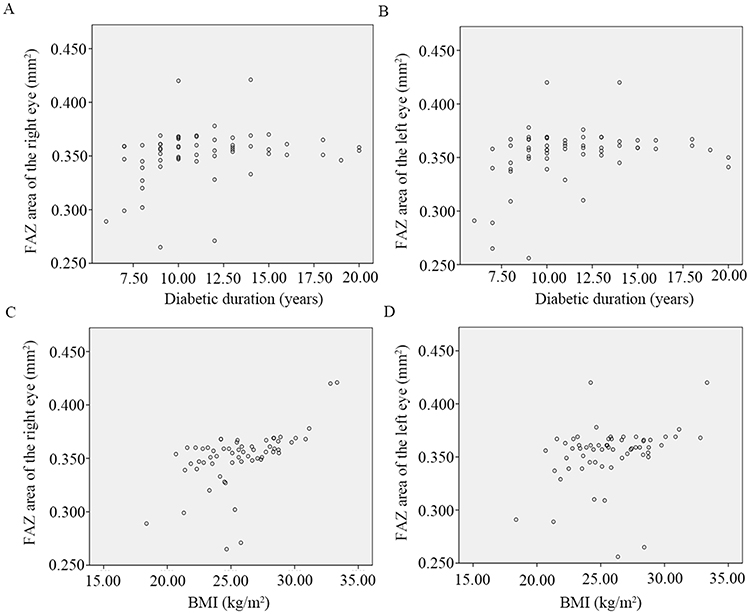 |
Figure 4 Scatter plot of the correlation between FAZ area and diabetes duration in right (A) and left (B) eyes and the correlation between FAZ area and BMI in right (C) and left (D) eyes. |
Discussion
This study focuses on NPDR, NDR, and healthy controls, comparing differences in CMT and FAZ area to elucidate early macular structural changes in diabetic retinopathy and their associated systemic risk factors. Results show that the NPDR group had significantly higher CMT and FAZ area than the NDR group, which in turn had significantly higher values than the healthy controls (Table 2). Correlation analysis revealed that CMT was positively correlated with diabetes duration, body mass index (BMI), TC, TG, systolic and diastolic blood pressure (Table 3 and Figures 1–3); FAZ area was positively correlated with diabetes duration and BMI (Table 3 and Figure 4).
Although our previous study focused on the changes in macular thickness (MT) in patients with early DR,17 the current study expands this research area by also examining the FAZ area, providing a more comprehensive understanding of the early retinal structural changes associated with DR. This expansion not only enhances our understanding of the early stages of diabetic retinopathy but also offers a new perspective for early diagnosis and intervention.
Recent research has identified macular thickening as a key link between diabetes and vision loss.18,19 Early intervention for macular edema has been proven effective in reducing retinal thickness and improving vision to varying degrees, highlighting the importance of developing early diagnostic methods for macular edema.20,21 This study found that an increase in CMT occurs in the early stages of DR. Specifically, the CMT in the NDR group were significantly lower than in healthy controls, while the NPDR group had significantly higher values than the NDR group (Table 2). These findings indicate that OCT can detect retinal thickening invisible to the naked eye, which progressively worsens with DR advancement. These results provide strong evidence for early DME diagnosis and support early preventive and treatment measures to mitigate visual function damage in patients.
The FAZ, a capillary-free area surrounding the fovea, directly and significantly impacts visual quality through its structural integrity.22 FAZ vascular density is a key indicator of macular perfusion, with capillary loss and non-perfusion at the FAZ edge leading to decreased visual function.7,23,24 OCTA, an emerging imaging technology, enables full retinal layer capillary visualization and identifies the earliest microvascular changes in DR and its complications, offering quantitative assessment.25 This technique achieves non-invasive three-dimensional retinal microvasculature visualization, effectively overcoming the invasive limitations of traditional fluorescein angiography and providing a new tool for exploring layer-specific vascular changes in DR.15 Existing studies have shown a significant correlation between FAZ area and DR progression, with significant differences in deep FAZ area between proliferative diabetic retinopathy (PDR) and mild NPDR.8 This study further explores the relationship between FAZ and NPDR, NDR, and healthy controls, revealing significant differences in FAZ area between NPDR and NDR. Notably, even in diabetic patients without clinically visible DR, FAZ area is already larger than in healthy eyes (Table 2). These results suggest that an enlarged FAZ area may serve as an early warning indicator for DME diagnosis, aiding in the prevention of diabetic and other ocular complications through early intervention. This conclusion aligns with previous findings that DR and DME patients have larger FAZ areas than non-DME patients.7 However, another study indicated that in the early stages of DME, there may be no obvious clinical symptoms, but compensatory increased macular perfusion can occur, manifested as a reduced FAZ area. As DME progresses, FAZ area increases and macular perfusion decreases.26 Future researches should focus on conducting large-scale prospective studies to further explore the factors influencing FAZ area reduction and elucidate its potential role in DR progression.
In terms of correlation analysis, this study found that central macular thickness was positively correlated with diabetes duration, BMI, TC, TG, systolic and diastolic blood pressure (Table 3 and Figures 1–3). Prolonged diabetes duration means patients are in a state of chronic hyperglycemia, which can damage retinal vascular endothelial cells, increase vascular permeability, and subsequently cause retinal edema and thickness increase.4,11 Obesity (measured by BMI) may induce insulin resistance, further exacerbate diabetes, and adversely affect the cardiovascular system, indirectly impacting retinal blood circulation and microvascular structure.27,28 Elevated TC and TG levels, often associated with lipid metabolism disorders in diabetic patients, can worsen vascular lesions, affect retinal blood supply, and negatively impact macular structure.29,30 Elevated systolic and diastolic blood pressure can stress retinal vessels, increase vascular wall burden, lead to vascular lesion development, and affect macular blood perfusion and tissue structure.31–33 These findings suggest that these biochemical indicators can be used to predict early changes in macular thickness, providing a basis for clinical early intervention. Conversely, retinal thickening detected by OCT in the macular area may also indicate the presence of early systemic complications, offering clues for early diagnosis of systemic diseases.
Additionally, FAZ area was positively correlated with diabetes duration and BMI (Table 3 and Figure 4). The prolonged duration of diabetes can lead to gradual retinal microvascular occlusion and the formation of new blood vessels, thereby enlarging the FAZ area.15,34 An increase in BMI, which is related to the degree of obesity in diabetic patients, can cause insulin resistance, further exacerbate diabetes, and have adverse effects on the cardiovascular system, potentially indirectly affecting retinal blood circulation and microvascular structure.35,36 Notably, incorporating OCTA indicators further enhances the ability to distinguish and calibrate the progression of DR and the occurrence of DME, providing more precise tools for clinical diagnosis and treatment.
We did not detect a significant association between HbA1c and either CMT or FAZ, possibly for four reasons: (1) all participants had early-stage DR, so the narrow range of HbA1c values weakened any potential correlation; (2) OCTA captures instantaneous retinal structure and perfusion, whereas HbA1c reflects average glycaemia over the preceding 8–12 weeks, and this temporal discrepancy may attenuate the relationship; (3) early DR-related macular alterations are driven by multiple concurrent factors—such as blood pressure, lipids, and inflammatory mediators—limiting the explanatory power of a single HbA1c metric; and (4) the present sample size may be insufficient to detect subtle effects. Larger, long-term longitudinal studies are therefore warranted to clarify this association.
This study has certain limitations. First, the relatively small sample size may lead to insufficient statistical power, making it difficult to detect subtle differences. Future studies will increase the sample size to improve the reliability of the results. Second, incomplete data collection prevented analysis of the relationship between VA and macular thickness, which will be a focus in future research. Additionally, the cross-sectional design limits causal inferences on CMT and FAZ changes over time. Future studies should use longitudinal designs to explore their links with risk factors. Lastly, FAZ irregularity was not assessed, which is important for early microvascular changes, and future research should further investigation in future studies.
The findings of this study hold significant importance for clinical applications. By identifying early macular structural changes and their associated systemic risk factors, we can develop more effective strategies for early diagnosis and intervention. However, translating these research findings into clinical practice faces several challenges, including cost, regulatory hurdles, and issues of batch consistency. To overcome these obstacles, future research should focus on conducting large-scale prospective studies to further validate the clinical application value of these findings. Additionally, we need to collaborate with regulatory agencies to ensure that the clinical application of these new technologies meets safety and efficacy standards. Through these efforts, we can better prevent and manage diabetic retinopathy, thereby improving patient outcomes.
Conclusions
In conclusion, in the early stages of diabetic retinopathy, significant changes occur in central macular thickness and FAZ area, which are closely related to factors such as diabetes duration, lipid levels, blood pressure, and BMI. Specifically, CMT was positively correlated with the duration of diabetes, BMI, total cholesterol (TC), triglyceride (TG), systolic blood pressure, and diastolic blood pressure. FAZ area was positively correlated with the duration of diabetes and BMI. These results suggest that the increase in CMT and the reduction in FAZ area may be the earliest retinal structural changes in diabetic patients, and these changes are closely related to systemic metabolic status. Therefore, in clinical practice, diabetic patients, especially those with longer disease duration, abnormal lipid levels, elevated blood pressure, and obesity, should undergo enhanced macular examination and monitoring to detect signs of retinal lesions early and promptly implement comprehensive treatment measures, including blood glucose, lipid, and blood pressure control, and weight reduction, to slow disease progression.
Ethics Approval and Consent to Participate
All procedures of this study were in accordance with the tenets of the Declaration of Helsinki and approved by the medical ethics committee.
Patient Consent for Publication
All Patients declare that they consent for publication.
Acknowledgments
We would like to thank all patients and healthy people who participated in this study.
Funding
This study was supported by the Changning District Health and Family Planning Commission Fund (No. 2022QN04), Shanghai Municipal Health Commission Clinical Research Program (No. 20244Y0213), the Research Fund of Shanghai Tongren Hospital, Shanghai Jiaotong University School Medicine (No. TRYJ2024LC07), the Norman Bethune Public Welfare Foundation’s “Bright Vision, Bathing in Light” Project (No. BCF-KH-YK-20240906-12), Scientific Research Fund of Compound Chinese Medicine for the Treatment of diabetes Microangiopathy (No. Z-2017-26-2302), Major Science and Technology Project of Yunnan Provincial Science and Technology Department — Biomedical Specialization(No. 202402AA310074), National Natural Science Foundation of China (82371072), the Shanghai Jiao Tong University “Jiao Tong Star” Program – Medical-Engineering Cross Research Fund (No. 2023DHYGJC-YBA06 and YG2024LC13), and High Altitude Ocular Disease Research Center of People’s Hospital of Shigatse City and Tongren Hospital Affiliated to Shanghai Jiao Tong University School of Medicine, P. R. China.
Disclosure
The authors declare that they have no competing interests in this work.
References
1. Teo ZL, Tham Y-C, Yu M. et al. Global Prevalence of Diabetic Retinopathy and Projection of Burden through 2045: systematic Review and Meta-analysis. Ophthalmology. 2021;128(11):1580–1591. doi:10.1016/j.ophtha.2021.04.027. Epub 2021/05/04. Cited in: Pubmed; PMID 33940045.
2. American Diabetes Association Professional Practice. Retinopathy, Neuropathy, and Foot Care: standards of Care in Diabetes-2024. Diabet Care. 2024;47(Suppl 1):S231–S243. doi:10.2337/dc24-S012. Epub 2023/12/11. Cited in: Pubmed; PMID 38078577.
3. Kang EY, Chen TH, Garg SJ, et al. Association of Statin Therapy With Prevention of Vision-Threatening Diabetic Retinopathy. JAMA Ophthalmol. 2019;137(4):363–371. doi:10.1001/jamaophthalmol.2018.6399. Epub 2019/01/11. Cited in: Pubmed; PMID 30629109.
4. Wong TY, Cheung CM, Sharma S, Simo R. Diabetic retinopathy. Nat Rev Dis Primers. 2016;2:16012. doi:10.1038/nrdp.2016.12. Epub 2016/05/10. Cited in: Pubmed; PMID 27159554.
5. Daruich A, Matet A, Moulin A, et al. Mechanisms of macular edema: beyond the surface. Prog Retin Eye Res. 2018;63:20–68. doi:10.1016/j.preteyeres.2017.10.006. Epub 2017/11/12. Cited in: Pubmed; PMID 29126927.
6. Deak GG, Schmidt-Erfurth UM, Jampol LM. Correlation of Central Retinal Thickness and Visual Acuity in Diabetic Macular Edema. JAMA Ophthalmol. 2018;136(11):1215–1216. doi:10.1001/jamaophthalmol.2018.3848. Epub 2018/09/08. Cited in: Pubmed; PMID 30193350.
7. Liu J, He Y, Kong L, et al. Study of Foveal Avascular Zone Growth in Individuals With Mild Diabetic Retinopathy by Optical Coherence Tomography. Invest Ophthalmol Vis Sci. 2023;64(12):21. doi:10.1167/iovs.64.12.21. Epub 2023/09/12. Cited in: Pubmed; PMID 37698529.
8. Sun Z, Tang F, Wong R, et al. OCT Angiography Metrics Predict Progression of Diabetic Retinopathy and Development of Diabetic Macular Edema: a Prospective Study. Ophthalmology. 2019;126(12):1675–1684. doi:10.1016/j.ophtha.2019.06.016. Epub 2019/07/31. Cited in: Pubmed; PMID 31358386.
9. Hou X, Wang L, Zhu D, et al. China National Diabetic Chronic Complications Study G. Prevalence of diabetic retinopathy and vision-threatening diabetic retinopathy in adults with diabetes in China. Nat Commun. 2023;14(1):4296. doi:10.1038/s41467-023-39864-w. Epub 2023/07/19. Cited in: Pubmed; PMID 37463878.
10. Bethel MA, Diaz R, Castellana N, Bhattacharya I, Gerstein HC, Lakshmanan MC. HbA(1c) Change and Diabetic Retinopathy During GLP-1 Receptor Agonist Cardiovascular Outcome Trials: a Meta-analysis and Meta-regression. Diabet Care. 2021;44(1):290–296. doi:10.2337/dc20-1815. Epub 2021/01/15. Cited in: Pubmed; PMID 33444163.
11. Perais J, Agarwal R, Evans JR, et al. Prognostic factors for the development and progression of proliferative diabetic retinopathy in people with diabetic retinopathy. Cochrane Database Syst Rev. 2023;2(2):CD013775. doi:10.1002/14651858.CD013775.pub2. Epub 2023/02/24. Cited in: Pubmed; PMID 36815723.
12. Stitt AW, Curtis TM, Medina RJ, et al. The progress in understanding and treatment of diabetic retinopathy. Prog Retin Eye Res. 2016;51:156–186. doi:10.1016/j.preteyeres.2015.08.001. Epub 2015/08/25. Cited in: Pubmed; PMID 26297071.
13. Johannesen SK, Viken JN, Vergmann AS, Grauslund J. Optical coherence tomography angiography and microvascular changes in diabetic retinopathy: a systematic review. Acta Ophthalmol. 2019;97(1):7–14. doi:10.1111/aos.13859. Epub 2018/09/22. Cited in: Pubmed; PMID 30238633.
14. Antonetti DA, Silva PS, Stitt AW. Current understanding of the molecular and cellular pathology of diabetic retinopathy. Nat Rev Endocrinol. 2021;17(4):195–206. doi:10.1038/s41574-020-00451-4. Epub 2021/01/21. Cited in: Pubmed; PMID 33469209.
15. Waheed NK, Rosen RB, Jia Y, et al. Optical coherence tomography angiography in diabetic retinopathy. Prog Retin Eye Res. 2023;97:101206. doi:10.1016/j.preteyeres.2023.101206. Epub 2023/07/28. Cited in: Pubmed; PMID 37499857.
16. Szeto SK, Lai TY, Vujosevic S, et al. Optical coherence tomography in the management of diabetic macular oedema. Prog Retin Eye Res. 2024;98:101220. doi:10.1016/j.preteyeres.2023.101220. Epub 2023/11/10. Cited in: Pubmed; PMID 37944588.
17. Wei Q, Qiu W, Liu Q, Jiang Y. Relationship Between Risk Factors and Macular Thickness in Patients with Early Diabetic Retinopathy. Int J Gen Med. 2022;15:6021–6029. doi:10.2147/IJGM.S366348. Epub 2022/07/13. Cited in: Pubmed; PMID 35818578.
18. Suciu CI, Suciu VI, Nicoara SD. Optical Coherence Tomography (Angiography) Biomarkers in the Assessment and Monitoring of Diabetic Macular Edema. J Diabetes Res. 2020;2020:6655021. doi:10.1155/2020/6655021. Epub 2021/01/26. Cited in: Pubmed; PMID 33490283.
19. Lam C, Wong YL, Tang Z, et al. Performance of Artificial Intelligence in Detecting Diabetic Macular Edema From Fundus Photography and Optical Coherence Tomography Images: a Systematic Review and Meta-analysis. Diabet Care. 2024;47(2):304–319. doi:10.2337/dc23-0993. Epub 2024/01/19. Cited in: Pubmed; PMID 38241500.
20. Vujosevic S, Aldington SJ, Silva P, et al. Screening for diabetic retinopathy: new perspectives and challenges. Lancet Diabetes Endocrinol. 2020;8(4):337–347. doi:10.1016/S2213-8587(19)30411-5. Epub 2020/03/03. Cited in: Pubmed; PMID 32113513.
21. Zayed MG, Karsan W, Peto T, Saravanan P, Virgili G, Preiss D. Diabetic Retinopathy and Quality of Life: a Systematic Review and Meta-Analysis. JAMA Ophthalmol. 2024;142(3):199–207. doi:10.1001/jamaophthalmol.2023.6435. Epub 2024/02/01. Cited in: Pubmed; PMID 38300578.
22. Cheung CMG, Fawzi A, Teo KY, Fukuyama H, Sen S, Tsai WS. Diabetic macular ischaemia- a new therapeutic target? Prog Retin Eye Res. 2022;89:101033. doi:10.1016/j.preteyeres.2021.101033. Epub 2021/12/14. Cited in: Pubmed; PMID 34902545.
23. Duffy BV, Castellanos-Canales D, Decker NL, et al. Foveal Avascular Zone Enlargement Correlates with Visual Acuity Decline in Patients with Diabetic Retinopathy. Ophthalmol Retina. 2024. doi:10.1016/j.oret.2024.12.015. Epub 2024/12/16. Cited in: Pubmed; PMID 39675475.
24. Balaratnasingam C, Inoue M, Ahn S, et al. Visual Acuity Is Correlated with the Area of the Foveal Avascular Zone in Diabetic Retinopathy and Retinal Vein Occlusion. Ophthalmology. 2016;123(11):2352–2367. doi:10.1016/j.ophtha.2016.07.008. Epub 2016/10/25. Cited in: Pubmed; PMID 27523615.
25. Durbin MK, An L, Shemonski ND, et al. Quantification of Retinal Microvascular Density in Optical Coherence Tomographic Angiography Images in Diabetic Retinopathy. JAMA Ophthalmol. 2017;135(4):370–376. doi:10.1001/jamaophthalmol.2017.0080. Epub 2017/03/17. Cited in: Pubmed; PMID 28301651.
26. Gu Q, Pan T, Cheng R, et al. Macular vascular and photoreceptor changes for diabetic macular edema at early stage. Sci Rep. 2024;14(1):20544. doi:10.1038/s41598-024-71286-6. Epub 2024/09/05 Cited in: Pubmed; PMID 39232012.
27. Jensen ET, Rigdon J, Rezaei KA, et al. Progression, and Modifiable Risk Factors for Diabetic Retinopathy in Youth and Young Adults With Youth-Onset Type 1 and Type 2 Diabetes: the SEARCH for Diabetes in Youth Study. Diabet Care. 2023;46(6):1252–1260. doi:10.2337/dc22-2503. Epub 2023/04/13. Cited in: Pubmed; PMID 37043887.
28. Sasongko MB, Widyaputri F, Sulistyoningrum DC, et al. Estimated Resting Metabolic Rate and Body Composition Measures Are Strongly Associated With Diabetic Retinopathy in Indonesian Adults With Type 2 Diabetes. Diabet Care. 2018;41(11):2377–2384. doi:10.2337/dc18-1074. Epub 2018/09/15. Cited in: Pubmed; PMID 30213883.
29. Li X, Tan TE, Wong TY, Sun X. Diabetic retinopathy in China: epidemiology, screening and treatment trends-A review. Clin Exp Ophthalmol. 2023;51(6):607–626. doi:10.1111/ceo.14269. Epub 2023/06/29. Cited in: Pubmed; PMID 37381613.
30. Azad N, Bahn GD, Emanuele NV, et al. Association of Blood Glucose Control and Lipids With Diabetic Retinopathy in the Veterans Affairs Diabetes Trial (VADT). Diabet Care. 2016;39(5):816–822. doi:10.2337/dc15-1897. Epub 2016/03/24. Cited in: Pubmed; PMID 27006510.
31. Tomic M, Vrabec R, Ljubic S, Prkacin I, Bulum T. Patients with Type 2 Diabetes, Higher Blood Pressure, and Infrequent Fundus Examinations Have a Higher Risk of Sight-Threatening Retinopathy. J Clin Med. 2024;13(9):2496. doi:10.3390/jcm13092496. Epub 2024/05/11. Cited in: Pubmed; PMID 38731024.
32. Do DV, Han G, Abariga SA, Sleilati G, Vedula SS, Hawkins BS. Blood pressure control for diabetic retinopathy. Cochrane Database Syst Rev. 2023;3(3):CD006127. doi:10.1002/14651858.CD006127.pub3. Epub 2023/03/29. Cited in: Pubmed; PMID 36975019.
33. Azad N, Agrawal L, Bahn G, et al. Eye Outcomes in Veteran Affairs Diabetes Trial (VADT) After 17 Years. Diabet Care. 2021;44(10):2397–2402. doi:10.2337/dc20-2882. Epub 2021/07/01. Cited in: Pubmed; PMID 34187839.
34. Komatsu H, Onoguchi G, Silverstein SM, et al. Retina as a potential biomarker in schizophrenia spectrum disorders: a systematic review and meta-analysis of optical coherence tomography and electroretinography. Mol Psychiatry. 2024;29(2):464–482. doi:10.1038/s41380-023-02340-4. Epub 2023/12/12. Cited in: Pubmed; PMID 38081943.
35. Ozgur G, Gokmen O. Associations between body mass index and choroidal thickness, superficial and deep retinal vascular indices, and foveal avascular zone measured by OCTA. Photodiagnosis Photodyn Ther. 2023;42:103515. doi:10.1016/j.pdpdt.2023.103515. Epub 2023/03/17. Cited in: Pubmed; PMID 36924979.
36. Ding Q, Wu H, Wang W, et al. Association of Body Mass Index and Waist-to-Hip Ratio With Retinal Microvasculature in Healthy Chinese Adults: an Optical Coherence Tomography Angiography Study. Am J Ophthalmol. 2023;246:96–106. doi:10.1016/j.ajo.2022.09.012. Epub 2022/10/15. Cited in: Pubmed; PMID 36240858.
 © 2025 The Author(s). This work is published and licensed by Dove Medical Press Limited. The
full terms of this license are available at https://www.dovepress.com/terms
and incorporate the Creative Commons Attribution
- Non Commercial (unported, 4.0) License.
By accessing the work you hereby accept the Terms. Non-commercial uses of the work are permitted
without any further permission from Dove Medical Press Limited, provided the work is properly
attributed. For permission for commercial use of this work, please see paragraphs 4.2 and 5 of our Terms.
© 2025 The Author(s). This work is published and licensed by Dove Medical Press Limited. The
full terms of this license are available at https://www.dovepress.com/terms
and incorporate the Creative Commons Attribution
- Non Commercial (unported, 4.0) License.
By accessing the work you hereby accept the Terms. Non-commercial uses of the work are permitted
without any further permission from Dove Medical Press Limited, provided the work is properly
attributed. For permission for commercial use of this work, please see paragraphs 4.2 and 5 of our Terms.
Recommended articles

The Association of Axial Length with Macular Microvascular Changes in Chinese Diabetic Retinopathy Patients
Zhang Q, Yang L, Xu X, Lan X, Wang Z, Sun Y, Fu S, Xiong Y
International Journal of General Medicine 2022, 15:3895-3902
Published Date: 8 April 2022
Non-Linear Relationship Between Fasting C-Peptide and Retinopathy in Patients with Type 2 Diabetes Mellitus - A Retrospective Study
Ma J, Han C, Lv Y, Cai H
Diabetes, Metabolic Syndrome and Obesity 2025, 18:1035-1045
Published Date: 7 April 2025
Serum Apolipoprotein B and B/A1 Ratio as Early Negative Biomarkers for OCT- and OCTA-Detected Retinal Changes in Diabetic Macular Edema
Soedarman S, Julia M, Gondhowiardjo TD, Kurnia KH, Prasetya ADB, Triyoga IF, Sasongko MB
Clinical Ophthalmology 2025, 19:2165-2178
Published Date: 9 July 2025
Association Between Vitamin D and Microvascular Changes in Early Diabetic Retinopathy in Patients with Type 2 Diabetes
Wei Z, Wang K, Liu Y, Liu P, Tang Y, Chen L, Hou X, Yan F
Diabetes, Metabolic Syndrome and Obesity 2025, 18:4085-4095
Published Date: 8 November 2025