Back to Journals » Journal of Hepatocellular Carcinoma » Volume 12
CDCA3 Regulates Tumor-Associated Macrophages Polarize to Promote the Malignant Progression of Hepatocellular Carcinoma
Authors Lyu S ![]() , Wang E, Lyu J, Xu H, Zhang D, Fang Z, Zhang L
, Wang E, Lyu J, Xu H, Zhang D, Fang Z, Zhang L
Received 27 August 2025
Accepted for publication 19 December 2025
Published 28 December 2025 Volume 2025:12 Pages 3029—3047
DOI https://doi.org/10.2147/JHC.S559772
Checked for plagiarism Yes
Review by Single anonymous peer review
Peer reviewer comments 5
Editor who approved publication: Prof. Dr. Imam Waked
Shanmei Lyu,1,* Enqin Wang,2,* Juan Lyu,1 Hongkun Xu,1 Daochang Zhang,1 Zhijun Fang,1 Lihong Zhang1
1Clinical Laboratory of Shaoxing People’s Hospital, The First Hospital of Shaoxing University, Shaoxing, 312000, People’s Republic of China; 2Department of Pathology, Wuchuan Country People’s Hospital, Zunyi, 564300, People’s Republic of China
*These authors contributed equally to this work
Correspondence: Lihong Zhang, Clinical Laboratory of Shaoxing People’s Hospital, The First Hospital of Shaoxing University, Shaoxing, 312000, People’s Republic of China, Email [email protected]
Background: Tumor-associated macrophages (TAMs) are pivotal components of the immune cell infiltrate in tumors and cell division cycle-associated protein-3 (CDCA3) is associated with tumor progression. The role of CDCA3 in regulating TAM polarization remains uncharacterized in hepatocellular carcinoma (HCC).
Methods: CDCA3 expression, its correlation with immune cell infiltration, and prognostic significance in HCC were analyzed using the TCGA and TIMER databases. Functional enrichment analyses, including Gene Ontology (GO), Kyoto Encyclopedia of Genes and Genomes (KEGG), and Gene Set Enrichment Analysis (GSEA), were performed to predict CDCA3-related pathways. The knockdown efficiency of CDCA3 in HCC cell lines was confirmed by RT-qPCR and Western blotting. Functional assays, including CCK-8, wound healing, and flow cytometry, were used to assess the role of CDCA3 in cell proliferation, migration, and apoptosis. Immunohistochemistry (IHC) was applied to evaluate the correlation between CDCA3 expression and M2 macrophage markers in clinical tissue samples.
Results: Bioinformatic analysis revealed that CDCA3 was significantly upregulated in HCC tissues, and its high expression was associated with advanced clinical stage, higher tumor grade, and poor prognosis. CDCA3 expression also correlated strongly with the level of immune infiltration. Notably, CDCA3 showed high diagnostic potential for HCC, with an area under the curve (AUC) of 0.869, cut-off value of 189.03 pg/mL, sensitivity of 81.9%, and specificity of 77.8%. Experimentally, CDCA3 knockdown significantly suppressed malignant phenotypes of HCC cells and inhibited M2 macrophage polarization.
Conclusion: Our findings suggest that CDCA3 promotes the malignant progression of HCC by driving M2-like TAM polarization, potentially through the upregulation of cytokines such as TGF-β 1, VEGFA, CD40, CXCL1, and CXCL5. CDCA3 thus represents a promising diagnostic biomarker and therapeutic target for HCC.
Keywords: hepatocellular carcinoma, CDCA3, tumor-associated macrophages, malignant progression
Introduction
Hepatocellular carcinoma (HCC) is the predominant type of liver cancer, accounting for approximately 90% of all primary liver cancer.1 The major risk factors for HCC include chronic hepatitis B (HBV) and hepatitis C (HCV) infections. A range of other etiological factors also contribute to HCC pathogenesis, such as excessive alcohol intake, smoking, dietary exposure to aflatoxin, liver fluke infections, and metabolic disorders including non-alcoholic steatohepatitis (NASH), obesity, type 2 diabetes, and metabolic syndrome.2–4 In recent decades, substantial progress has been made in HCC management through surgical, interventional, radiotherapeutic, and systemic medical approaches, leading to improved survival outcomes and a reduction in the global burden of the disease.5 Nevertheless, the overall survival of HCC patients remains unsatisfactory, largely owing to high frequencies of recurrence and metastatic spread following treatment.6 In such a predicament, it is imperative to gain a deeper understanding of the molecular basis of HCC progression to identify critical diagnostic markers and interventional targets for improved therapies.7
Cell division cycle-associated protein 3 (CDCA3, also known as Tome-1), is a 29 kDa protein encoded by a gene on chromosome 12p12. Predominantly localized in the cytoplasm, CDCA3 serves as an essential regulator of mitotic progression.8 It modulates the expression of diverse signaling molecules—including cytokines and hormones—thereby influencing multiple physiological and pathological processes. Consequently, dysregulation of CDCA3 is implicated in uncontrolled cellular proliferation and tumor development.9
The tumor microenvironment (TME) is a highly dynamic and complex ecosystem, comprising tumor cells, immune cells, cancer-associated fibroblasts (CAFs), stromal components, vasculature, and a network of cytokines and chemokines.10 It plays a fundamental role in promoting tumor growth, local invasion, and metastatic dissemination.11 Among the immune cells infiltrating the TME, tumor-associated macrophages (TAMs) are particularly abundant and exhibit considerable functional plasticity.12 Macrophages can undergo polarization into pro-inflammatory M1 phenotypes, which have anti-tumor effects, or anti-inflammatory M2 phenotypes, which promote tumor progression and immunosuppression.13,14 Given their central involvement in modulating the TME, TAMs—especially in the era of emerging chimeric antigen receptor macrophage (CAR-M) therapies—are being investigated as promising cellular therapeutics in oncology.14,15 Therefore, elucidating the molecular mechanisms that regulate macrophage polarization and their crosstalk with tumor cells is essential for developing novel treatment strategies for hepatocellular carcinoma (HCC).16
In this study, we investigated the role of CDCA3 in macrophage polarization during hepatocellular carcinoma (HCC) progression and elucidated its underlying mechanisms. Integrated bioinformatics analyses revealed that CDCA3 is upregulated in HCC tissues and correlates with advanced clinicopathological features and poor prognosis. Immune infiltration analysis further demonstrated a significant association between CDCA3 expression and the immunosuppressive tumor microenvironment (TME). Functionally, CDCA3 expression in HCC cells promoted the secretion of multiple cytokines and chemokines, driving macrophage polarization towards an M2-like phenotype, which, in turn, enhanced the proliferation and migration of HCC cells. These findings highlight CDCA3 as a key regulator of tumor-favorable immunity in HCC and suggest its potential as a therapeutic target for liver cancer intervention.
Methods
Data Acquisition and Processing
Data on gene expression, corresponding somatic mutations, and clinical information for patients with HCC were acquired from The Cancer Genome Atlas (TCGA) database (https://portal.gdc.cancer.gov/).17 RNA-sequencing data encompassing both pan-cancer and HCC-specific cohorts were acquired from TCGA. CDCA3 mRNA expression levels were evaluated across these datasets, with statistical analysis and visualization performed using the ggplot2 package in R. For the TCGA-LIHC (HCC) project, RNA-seq data and corresponding clinical records were retrieved. We excluded non-malignant tissue samples and cases with missing essential clinical information. Patients were subsequently stratified into high- and low-CDCA3 expression groups based on the median normalized expression value from the TCGA cohort. Following the exclusion of HCC patients with incomplete genomic data, a final cohort of 371 patients with complete clinical and genomic profiles was established for analysis.
Inclusion and Exclusion Criteria: Patients were included if they had: 1) complete clinicopathological data, 2) available somatic genomics data, and 3) data for key variables (eg, tumor stage, genetic mutations). Patients with any missing information in these categories were excluded.
To validate our findings, we collected tumor tissues from 88 patients with liver cancer who underwent surgical resection at Shaoxing People’s Hospital, along with 30 pathologically confirmed normal liver tissue samples. Additionally, serum samples were collected from 90 liver cancer patients, 45 patients with benign liver diseases (including chronic hepatitis B, hepatic hemangioma, cirrhosis, and fatty liver), and 45 healthy individuals. This study was conducted in accordance with the Declaration of Helsinki and was approved by the Ethics Committee of Shaoxing People’s Hospital (approval no. 2023–034-01). Written informed consent was obtained from all the participants, and all experiments were performed in accordance with the relevant guidelines and regulations.
Kaplan–Meier Survival Analysis
The prognostic value of CDCA3 expression in HCC was assessed using Kaplan–Meier survival analysis. Patients were stratified into high- and low-CDC A3 expression groups according to the median expression value. A Log rank test was then employed to compare the overall survival (OS) curves between the two groups, with a p-value of less than 0.05 considered statistically significant.
Time-Dependent Receiver Operating Characteristic (ROC) and Logistic Regression Analyses
To evaluate the prognostic potential of CDCA3, time-dependent receiver operating characteristic (ROC) analysis was performed at 1, 3, and 5 years of overall survival (OS). The area under the ROC curve (AUC) was computed to assess the biomarker’s predictive accuracy. The optimal expression cutoff was determined by the Youden Index (J), and statistical significance was defined as p < 0.05.18
Cox Risk Regression Analyses
Univariate and multivariate Cox regression analyses were conducted to identify independent prognostic factors for overall survival (OS). The variables examined included the pathological stage, TNM stages, and CDCA3 expression. A p-value of less than 0.05 was considered statistically significant for all analyses.
Gene Ontology (GO) Term and Kyoto Encyclopedia of Genes and Genomes (KEGG) Pathway Enrichment Analysis Using KEGG and Gene Set Enrichment Analysis (GSEA)
Functional annotation of the DEGs was performed using the “ClusterProfiler” package for Gene Ontology (GO) and Kyoto Encyclopedia of Genes and Genomes (KEGG) pathway analyses.19,20 Differentially expressed genes (DEGs) between high- and low-CDCA3 HCC groups were identified using the “limma” R package, with the thresholds set at an adjusted P < 0.05 and |Log2(Fold Change)| > 1. Subsequently, the cluster Profiler package was utilized to perform Gene Set Enrichment Analysis (GSEA)analysis.21 Results from functional enrichment and GSEA were visualized using bar plots and dot plots generated with the enrichplot package in R. All GSEA results were plotted using the “ggplot2” package, with pathways satisfying *p* < 0.05 or FDR < 0.25 considered statistically significant.
Immune Infiltration Analyses
The tumor microenvironmental features, including Stromal, Immune, and ESTIMATE scores, were calculated for each hepatocellular carcinoma (HCC) sample based on gene expression data using the R ESTIMATE package.22 The correlation between CDCA3 expression and the abundance of specific immune cell types was further assessed via the CIBERSORT algorithm. In addition, the TIMER (https://cistrome.shinyapps.io/timer/) was employed to validate the association of CDCA3 expression with levels of immune cell infiltration in HCC.23
Western Blotting
HCC cells were lysed using RIPA buffer supplemented with protease and phosphatase inhibitors. Protein extracts were separated by SDS‒PAGE and electrophoretically transferred to a PVDF membrane (Millipore). After blocking with 5% skim milk, the membrane was incubated overnight at 4 °C with primary antibodies CDCA3 (1:1000, ab167037, abcam) diluted in TBST (Tris-buffered saline with 0.05% Tween 20). The membrane was washed with TBST and incubated with HRP-conjugated secondary antibodies for 2 h at room temperature in next day. Protein bands were visualized using an enhanced chemiluminescence (ECL) detection system.
RNA Extraction and Real-Time Quantitative Polymerase Chain Reaction
Total RNA from THP-1 and HCC cells or tumor tissues using TRIzol reagent. Subsequently, 1 μg of RNA was reverse-transcribed into complementary DNA (cDNA). Quantitative PCR was carried out in a 10 μL reaction system consisting of 1 μL cDNA, 0.25 μM of each forward and reverse primer, 5 μL SYBR Green qPCR Master Mix, and nuclease-free water to adjust the volume. GAPDH was used as the internal control for normalization. The relative expression of target genes was determined using the 2−ΔΔCT method.
Immunohistochemistry Staining (IHC)
Tumor tissues were embedded in paraffin and sliced into 5μm thick sections. Tissue sections were dewaxed in xylene, rehydrated through a graded ethanol series, and subjected to antigen retrieval in a heated water bath. After blocking with goat serum, the slides were incubated overnight at 4 °C with primary antibodies against CD163 and CDCA3. Subsequently, the sections were incubated with corresponding secondary antibodies for 20 minutes at room temperature, and immunoreactivity was visualized using a 3,3′-diaminobenzidine (DAB) chromogen substrate. Staining intensity was scored as follows: 0 (unstained), 1 (weak), 2 (moderate), or 3 (strong). The percentage of stained tumor cells was graded as: 0 (none), 1 (5–25%), 2 (26–50%), 3 (51–75%), or 4 (>75%). A final immunohistochemistry score was derived by multiplying the intensity and percentage scores. Samples with a product ≥2 were considered positive.
Enzyme-Linked Immunosorbent Assay (ELISA)
Serum samples collected from patients and healthy controls were analyzed by enzyme-linked immunosorbent assay (ELISA). A standard curve was generated using serial dilutions of the reference standard at concentrations of 25, 50, 100, 200, and 400 pg/mL. All samples were diluted fivefold before loading. After incubation at 37 °C for 30 min, the plates were washed five times. Subsequently, horseradish peroxidase (HRP)-conjugated detection antibody was added and incubated at 37 °C for another 30 min. Color development was initiated by adding chromogenic substrates A and B, and the optical density (OD) at 450 nm was measured. Sample concentrations were determined by interpolation from the standard curve.
Cell Culture and Treatment
The human hepatocellular carcinoma (HCC) cell lines Huh7 and HepG2, along with THP‑1 (a human monocytic leukemia cell line) were obtained from the Cell Bank of the Chinese Academy of Sciences. Huh7 and HepG2 cells were maintained in complete DMEM and MEM medium, respectively, each supplemented with 10% fetal bovine serum (FBS) and 1% penicillin–streptomycin. THP‑1 cells were cultured in RPMI‑1640 medium containing 10% FBS and 1% penicillin–streptomycin. All cell lines were incubated at 37 °C in a humidified atmosphere of 5% CO2.
To induce differentiation of THP‑1 cells into M0‑like macrophages, the cells were treated with 20 ng/mL phorbol 12‑myristate 13‑acetate (PMA) for 24 h. Subsequently, the culture supernatant from HCC cells was added to the differentiated THP‑1 cells for an additional 24 h prior to further experimental assays.
Cell Transfection
A lentiviral overexpression vector for CDCA3 was constructed by cloning the full-length CDCA3 sequence into the GV943 vector. For CDCA3 knockdown, three distinct short hairpin RNA (shRNA) sequences targeting CDCA3 were designed and inserted into the GV943 backbone, generating the following recombinant lentiviral constructs:
CDCA3-RNAi-1: 5′‑GAGCAACTGGAGGGTCTTAAA‑3′;
CDCA3-RNAi-2: 5′‑CTGGGTACCCAGTTATCTGTT‑3′;
CDCA3-RNAi-3: 5′‑AAGCAAGACAGCCCACAGAAA‑3′.
Transfection efficiency was evaluated by RT‑qPCR 48 h after lentiviral transduction.
Cell Proliferation Analyses
Cell proliferation was assessed using the Cell Counting Kit-8 (CCK-8) assay. HCC cells were seeded into 96-well plates at a density of 2000 cells per well and cultured for 0h, 24h, 48h, and 72 h. At each time point, 10 μL of CCK-8 reagent was added to each well, followed by incubation at 37°C for 2 hours. The absorbance of each well was then measured at a wavelength of 450 nm.
Wound Healing Assay
The wound healing assay is one method to study cell migration in vitro. After 24 hours of the indicated treatment or transfection, when cells reached approximately 90% confluence, a straight wound was created in the monolayer using a sterile pipette tip. The dislodged cells were gently removed by washing with PBS. Images of the wound area were acquired immediately (0 h) under an inverted microscope, and again after 24 and 48 hours of incubation. The migration rate was quantified by analyzing the wound closure area using ImageJ software.
Flow Cytometry Analyses
After 48 h of treatment or transfection, 5×10⁴ HCC cells were harvested and washed with PBS, followed by incubation with Annexin V/PI for 30 min. The data were analyzed using a Navios flow cytometer (Beckman Coulter Diagnostics).
Olink Proteomic Analysis
Proteomic analysis was performed using the Olink Target platform (Olink Immuno-Oncology panel) on conditioned media from three biological replicates each of the HepG2-sh-CDCA3 and HepG2-NC groups. The Olink proteomic analysis was performed using three biological replicates per group, as indicated in the figure legends. Differential expression between groups was assessed using a Welch Two Sample t-test, with results reported as p value and Adjusted p value. P value < 0.05 were considered significantly altered, with the complete quantitative data provided in Table S1.
Statistical Analysis
All statistical analyses were performed GraphPad Prism 8.0. Data obtained from three independent experiments are presented as mean ± standard deviation (SD). Prior to comparative analysis, the normality of data distribution was confirmed for all groups using the Shapiro–Wilk test (p > 0.05), validating the subsequent use of parametric tests (t-test and ANOVA). Comparisons between two groups were performed using the two-tailed Student’s t-test, while comparisons among multiple groups were assessed by one-way analysis of variance (ANOVA). A p-value of less than 0.05 was considered statistically significant.
Results
CDCA3 Is Significantly Upregulated in Hepatocellular Carcinoma
An analysis of CDCA3 gene expression was performed using 371 HCC and 50 normal tissue samples from the TCGA database, which revealed significant upregulation of CDCA3 in tumor tissues relative to normal controls (Figure 1A). A comparable elevation in CDCA3 expression was also detected in 50 paired HCC samples compared with adjacent non-tumor tissues (Figure 1B). Kaplan–Meier survival analysis showed that high CDCA3 expression was associated with poorer overall survival (OS) compared with the low-expression group (Figure 1C). Furthermore, time-dependent ROC curve analysis for predicting 1-, 3-, and 5-year OS based on CDCA3 expression produced AUC values of 0.714, 0.644, and 0.595, respectively (Figure 1D).
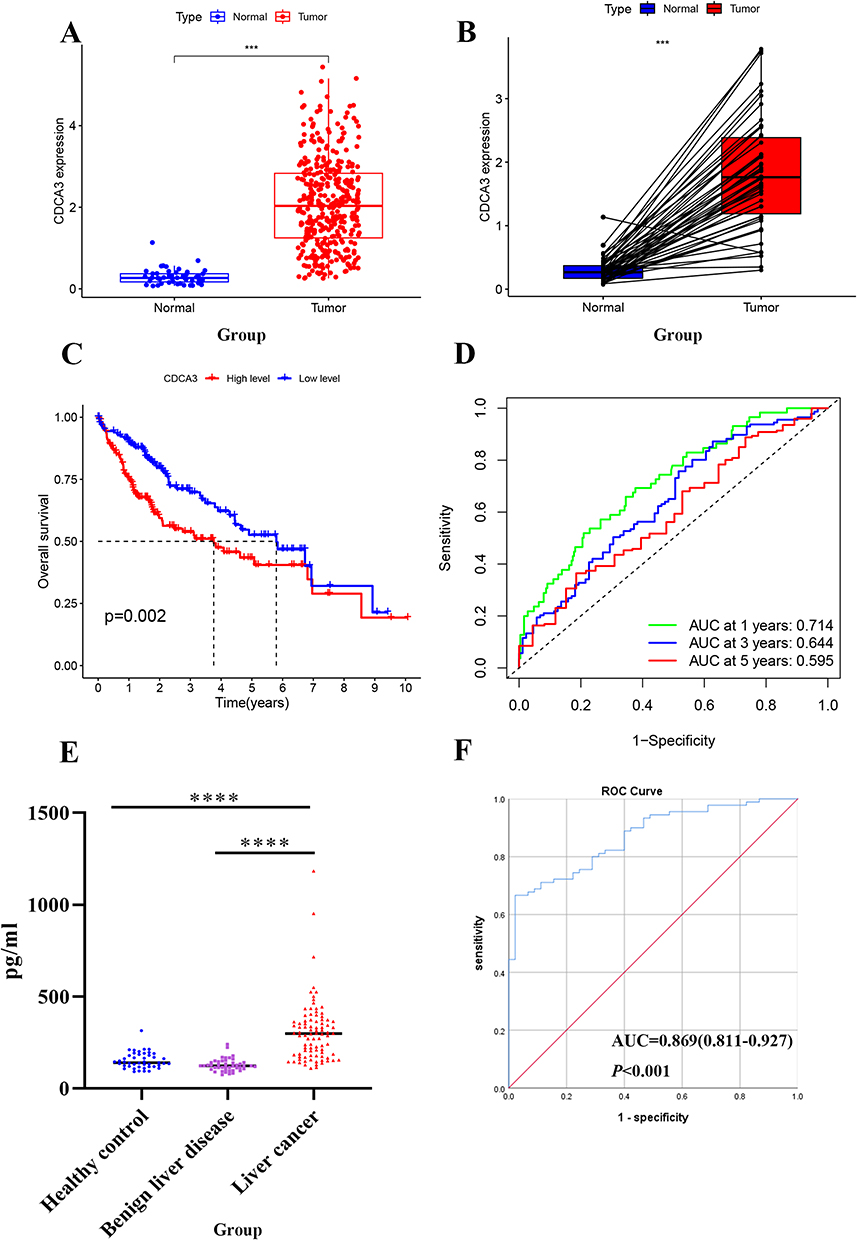 |
Figure 1 CDCA3 is significantly upregulated in HCC. (A) CDCA3 expression in HCC tissues in the TCGA database. (B) CDCA3 mRNA expression in paired tumor and adjacent normal tissues of HCC patients in the TCGA database. (C) Kaplan–Meier survival curve analysis of CDCA3 in GC from TCGA. (D) The 1-year, 3-year, and 5-year ROC curves of CDCA3 in HCC patients from the TCGA database. (E) Expression of CDCA3 in serum of our hospital HCC. (F) ROC Curve of CDCA3 in our hospital HCC patients. (***p < 0.001, ****p < 0.0001). |
CDCA3 levels in the peripheral blood of patients with HCC, benign liver disease, and healthy controls were measured using an ELISA assay. The results indicated a significant upregulation of CDCA3 in HCC patients (298.8, range: 182.5–368.5) relative to those in benign liver disease (122.9, range: 105.7–144.0; P < 0.001) and healthy controls (137.6, range:118.6–166.5; P < 0.001; Figure 1E). We performed a chi-square analysis to evaluate the association between CDCA3 expression and the clinicopathological characteristics of HCC patients. The results indicated that high CDCA3 expression was significantly associated with age (P < 0.001) but not with gender (P = 0.221; Table 1). The diagnostic value of CDCA3 was examined using ROC curve analysis. The area under the receiver operating characteristic (ROC) curve (AUC) of CDCA3 was AUC = 0.869 (95% CI:0.811–0.927); sensitivity = 81.90%; specificity = 77.80%), and the cut-off value was 189.03pg/mL (Figure 1F).
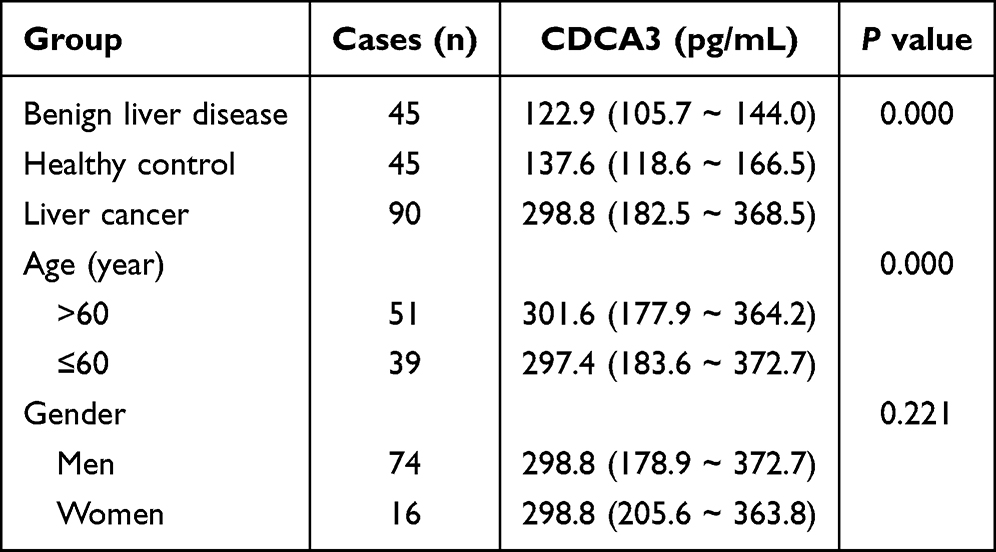 |
Table 1 Serum CDCA3 Levels Among Three Groups P50 (P25-P75) |
Using an independent cohort of 59 HCC and 30 normal liver tissues collected from our hospital, we confirmed the significant upregulation of CDCA3 in liver cancer. Furthermore, its expression level showed no significant correlation with key clinicopathological parameters, including patient age, gender, AFP level, pathological grade, smoking or alcohol history, hepatitis background, or tumor size (Table 2). This indicates that the expression of CDCA3 may be a relatively independent molecular event.
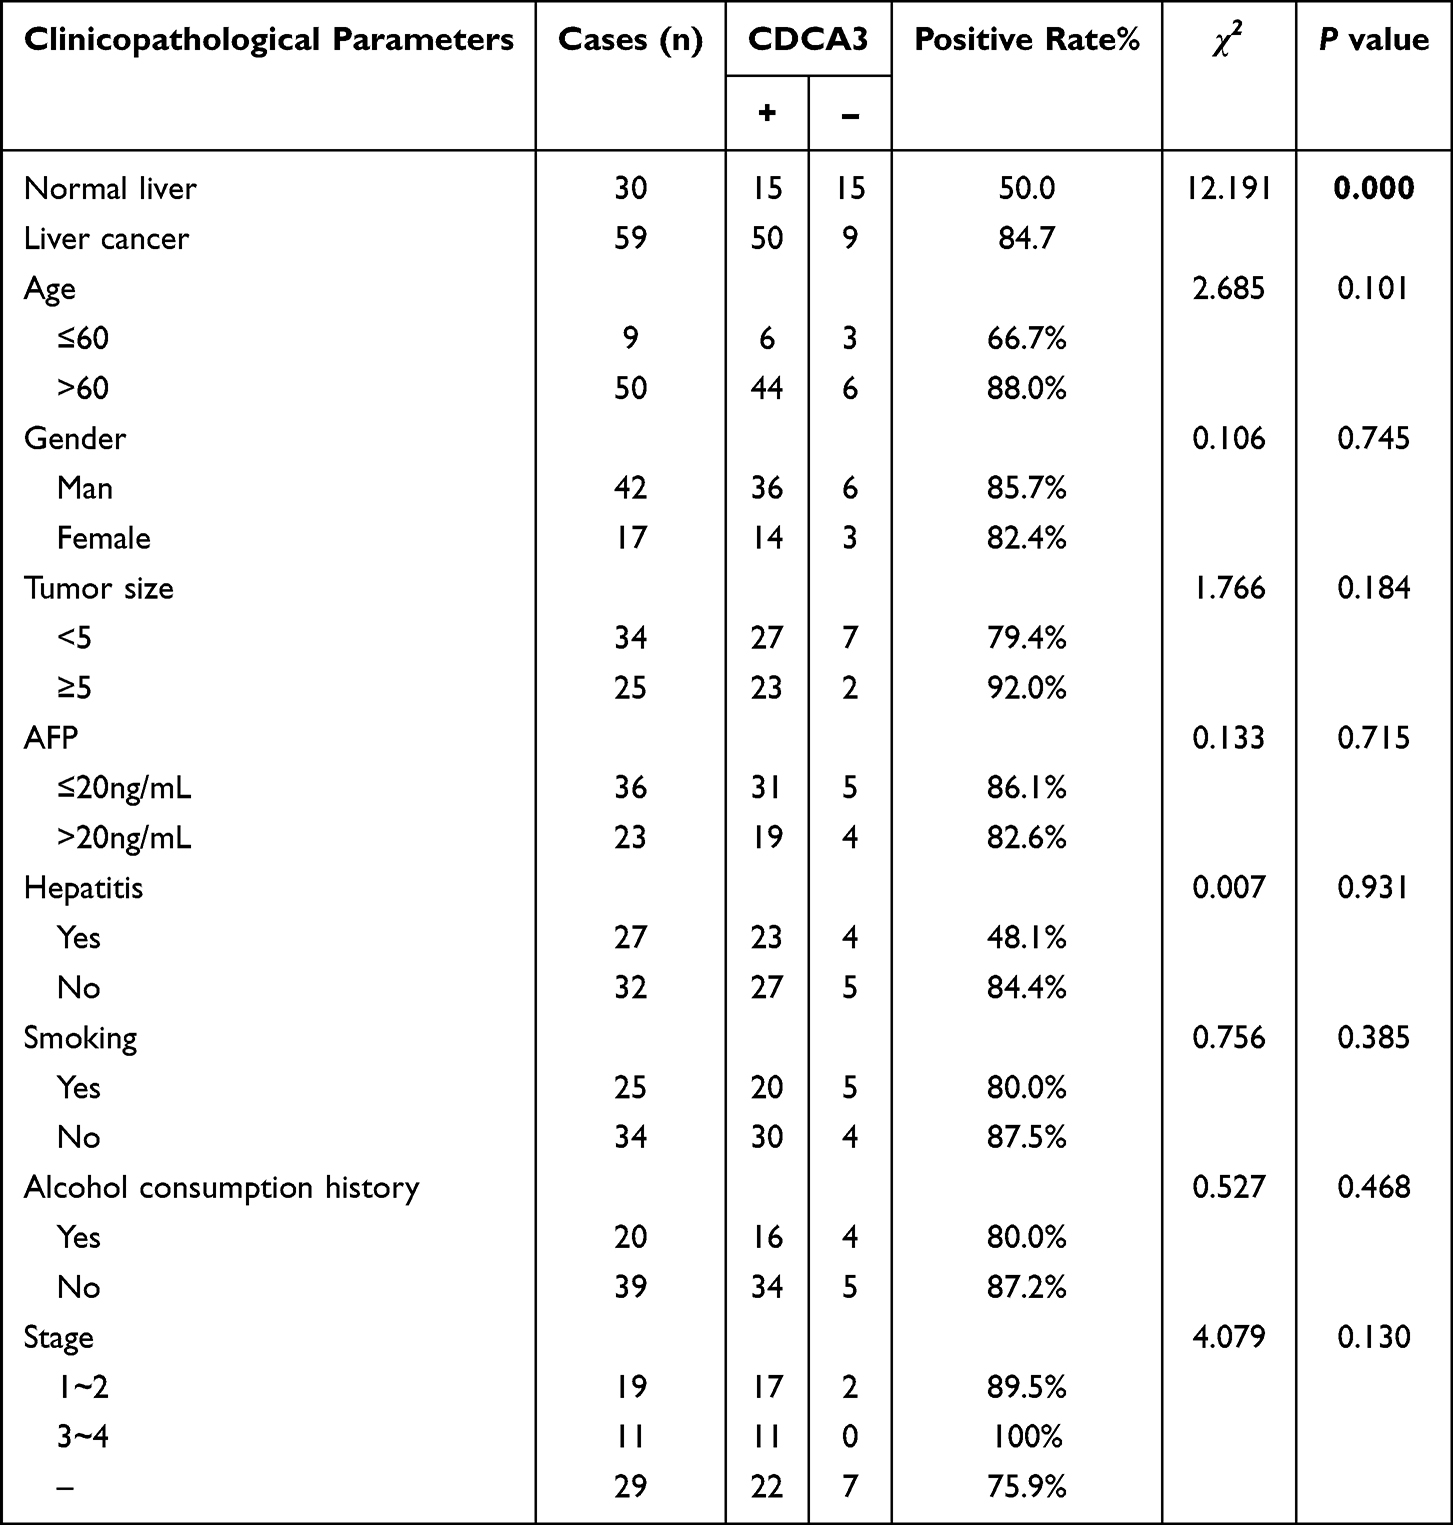 |
Table 2 Correlation Between CDCA3 Expression and Clinical Features in HCC Tissues |
CDCA3 Expression Correlates with Patient Clinicopathologic and Poor Outcome in HCC
Associations between CDCA3 expression levels and clinicopathological characteristics of HCC patients from the TCGA database were evaluated. Analysis revealed significantly elevated CDCA3 expression in patients with advanced T stage, older age, and higher pathologic stage. In contrast, no significant correlations were observed between CDCA3 expression and sex, N stage, or M stage (Figures 2A–H). Furthermore, the prognostic significance of CDCA3 expression along with age, gender, grade, and pathologic stage was assessed. Both univariate and multivariate Cox regression analyses identified CDCA3 as an independent prognostic factor for overall survival in HCC (Figures 2I and J).
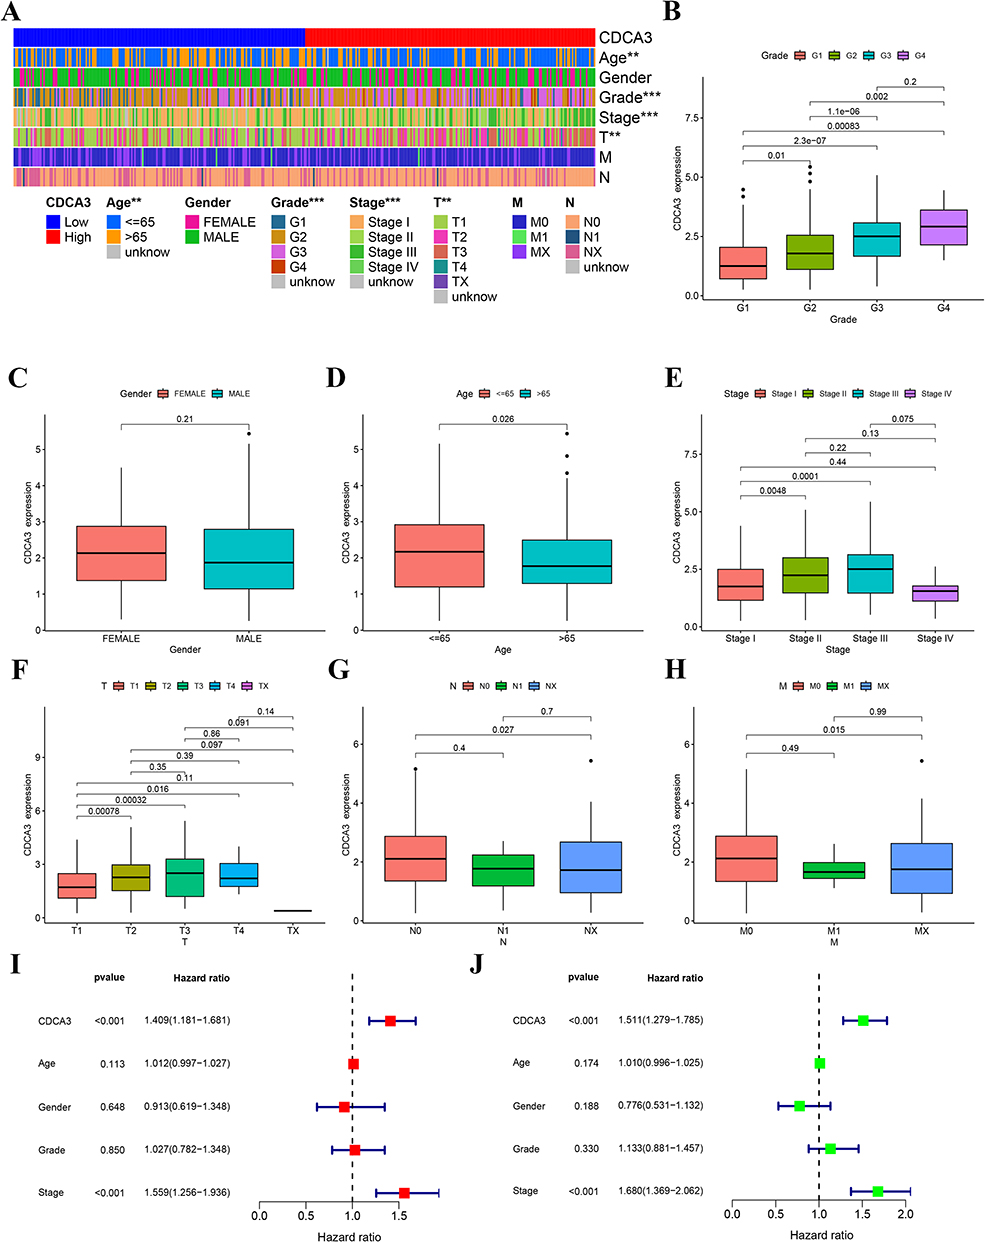 |
Figure 2 CDCA3 expression correlates with clinicopathologic parameters and poor outcome. (A) The heatmap of the relationship. (B) Grade. (C) Gender. (D) Age. (E) Stage. (F) T. (G) N. (H) M. (I) Multivariate cox regression analysis for CDCA3 in TCGA. (J) Univariate cox regression analysis for CDCA3 in TCGA. (**p < 0.01, ***p < 0.001). |
Functional Analysis of CDCA3
To investigate the potential mechanisms by which CDCA3 influences HCC progression, we used TCGA database to analyze gene expression differences between high and low expression of the CDCA3 group. The heat map shows positive and negative genes associated with CDCA3 in HCC (Figure 3A). GO analysis of co-expressed genes implied that CDCA3 is closely related to organelle fission, chromosomal regions, and monoatomic regions (Figure 3B and C). KEGG pathway analysis indicated that aberrant CDCA3 upregulation was enriched in processes including neuroactive ligand-receptor interaction and cell cycle regulation (Figure 3D). Moreover, GSEA demonstrated significant associations between CDCA3 expression and multiple metabolic pathways, notably complement and coagulation cascades, fatty acid metabolism, primary bile acid biosynthesis, tryptophan metabolism, and degradation of valine, leucine, and isoleucine (Figure 3E). These findings suggest that CDCA3 may play a critical role in HCC progression, potentially by enhancing tumor cell migration and invasion through modulation of cell division and metabolic reprogramming.
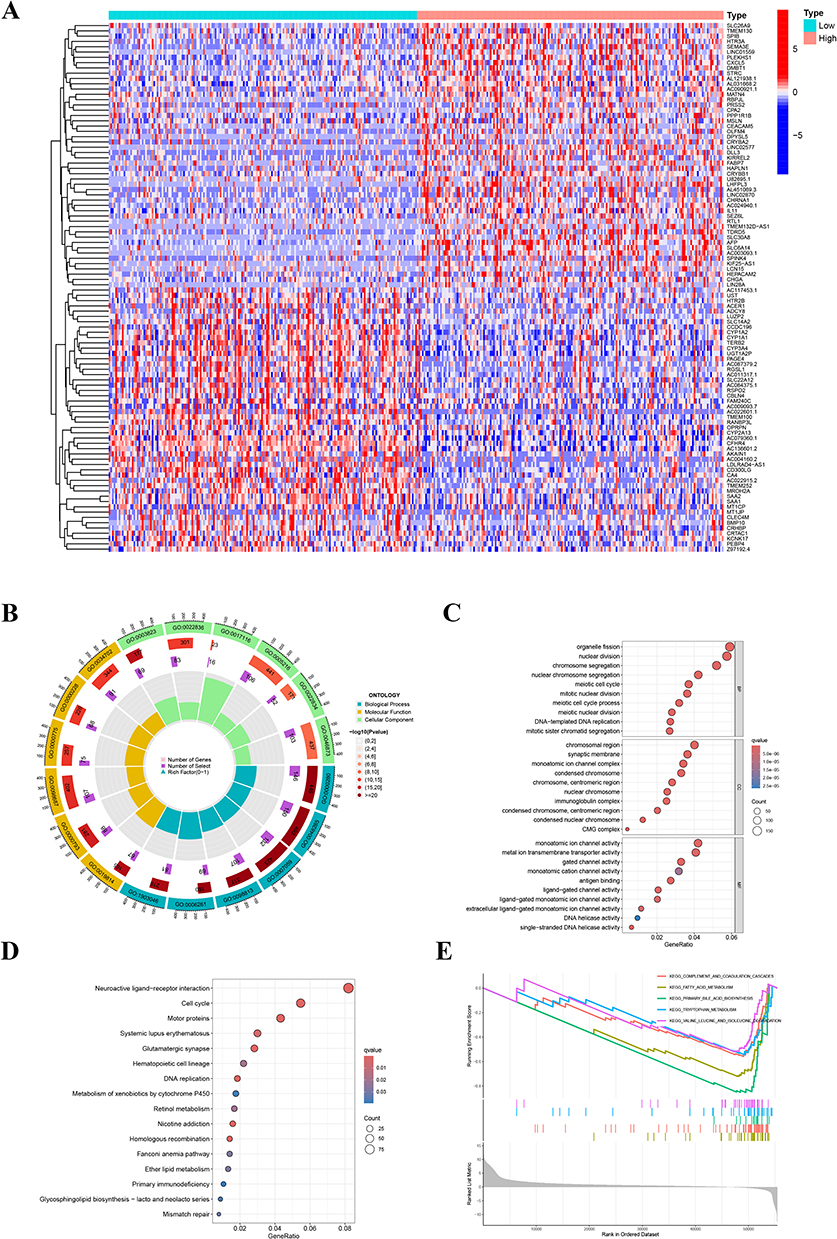 |
Figure 3 Functional analysis of CDCA3. (A) Heatmap of differential gene expression between high and low CDCA3 expression groups. (B and C) GO analysis of differential genes of CDCA3. (D) KEGG analysis. (E) GSEA analysis of differential genes related to CDCA3. |
Relationship Between CDCA3 Expression and Tumor-Infiltrating Immune Cells
To investigate the mechanism underlying the association between elevated CDCA3 expression and poor prognosis in HCC, we assessed the correlation of CDCA3 levels with immune cell infiltration in liver cancer tissues using the TIMER database. The analysis demonstrated a positive correlation between CDCA3 expression and the infiltration levels of B cells, CD4⁺ T cells, neutrophils, macrophages, and dendritic cells (Figure 4A). Subsequent correlation analysis indicated that CDCA3 expression was significantly associated with stromal scores, but not with immune or ESTIMATE scores (Figure 4B). Additionally, R software was employed to evaluate the relationship between CDCA3 expression and immune checkpoint genes (Figure 4C). In addition, we used immunohistochemistry to detect the expression of CDCA3, CD68 (M1 macrophage marker) and CD163 (M2 macrophage marker) in hepatocellular carcinoma tissue samples (Figure 4D). The results showed that the expression of CDCA3 and CD163 was positively correlated (P = 0.022, γ = 0.424), and the infiltration of M1 macrophages was decreased in HCC tissues with high CDCA3 expression levels.
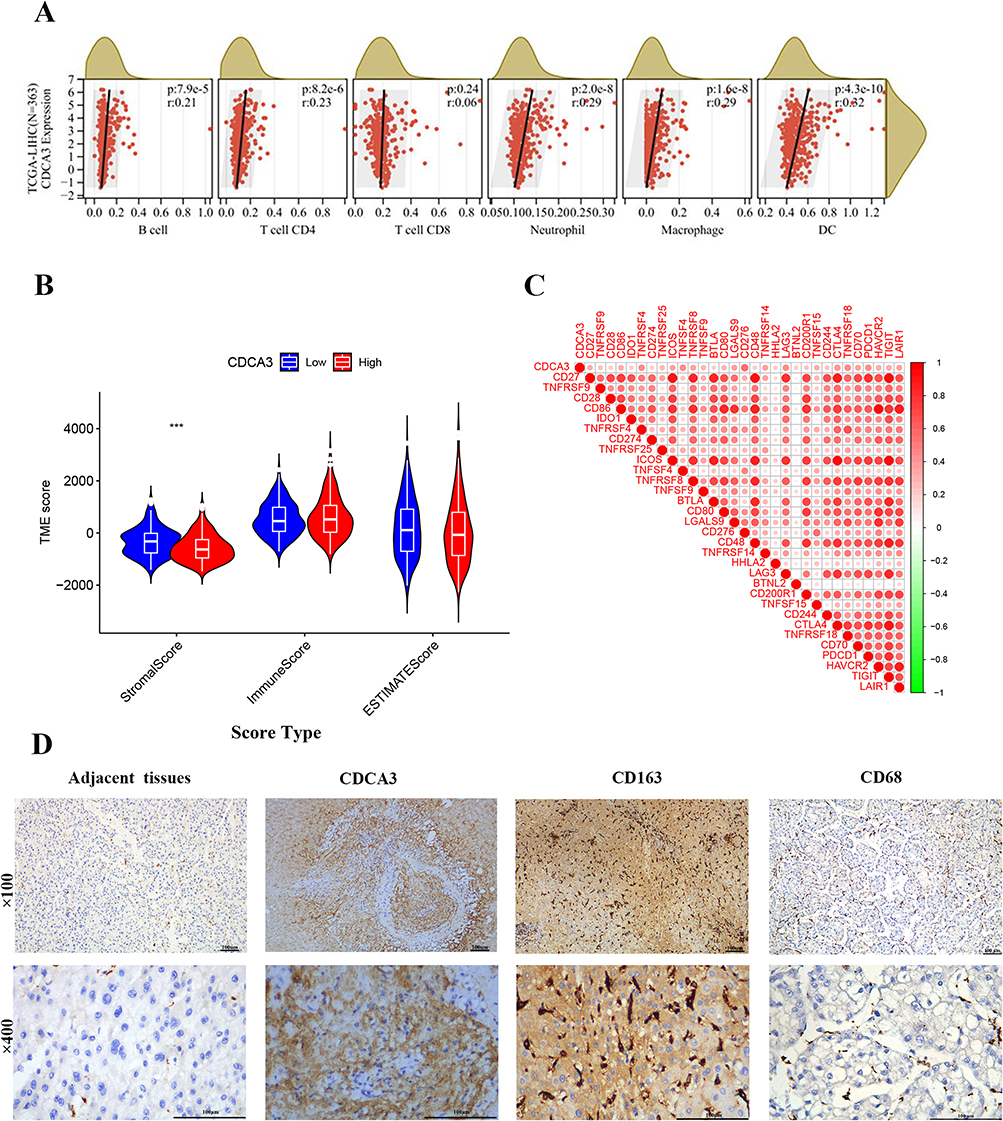 |
Figure 4 Relationship between CDCA3 expression and tumor-infiltrating immune cells. (A) Correlation between CDCA3 expression and immune cell infiltration in HCC based on the TIMER database. (B) Correlation of CDCA3 expression with immune score, stromal score, ESTIMATE score. (C) Association between the expression level of CDCA3 and immune checkpoint genes. (D) Expression of CDCA3 and M2 marker (CD163) and M1 marker (CD68) in HCC tissue. (***p < 0.001). |
CDCA3 Promote M2 Macrophage Polarization
To elucidate the mechanistic involvement of CDCA3 in M2 macrophage polarization, we quantified the expression of M2-associated markers (Arg-1, IL-4, IL-10) in THP-1 cells treated with PMA and HCC supernatant. A significant increase in Arg-1 and IL-10 levels was observed in the HCC supernatant-treated group relative to the PMA-induced group, suggesting that CDCA3 may facilitate M2 polarization (Figure 5A–C).
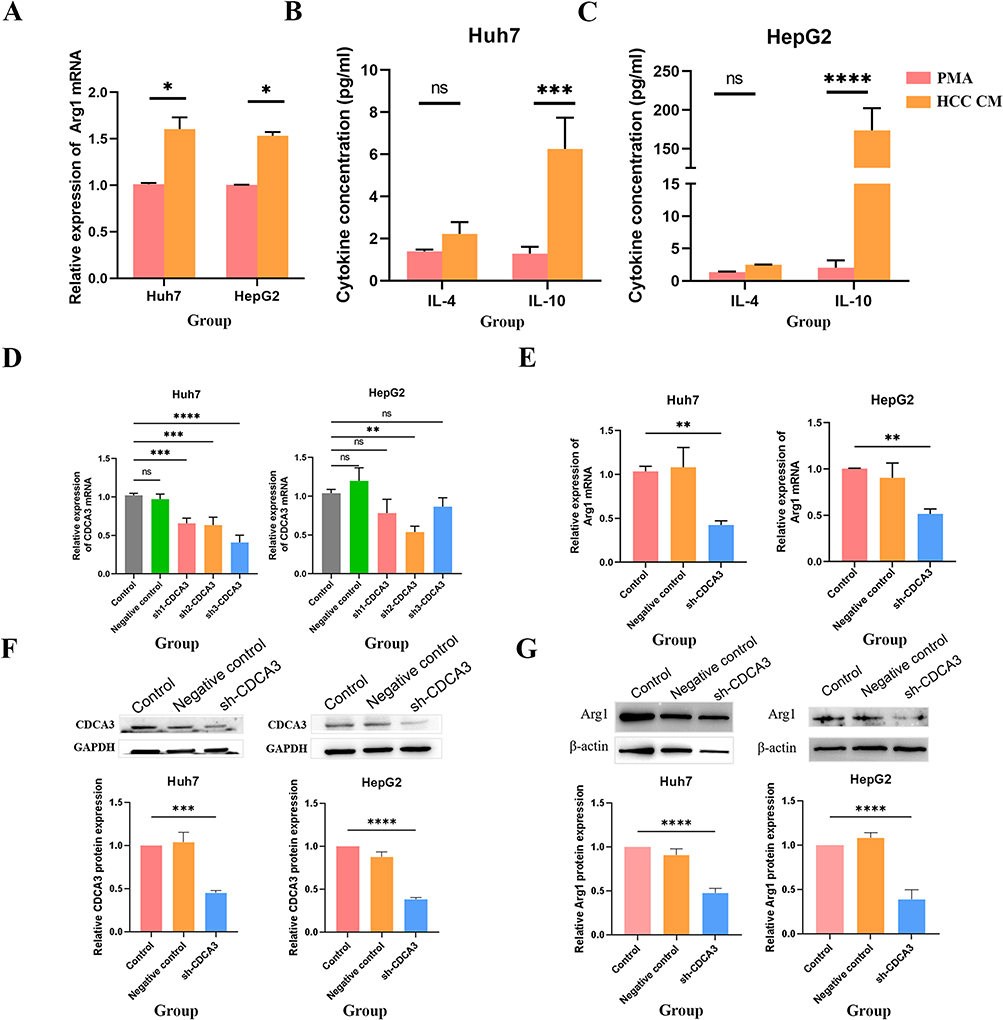 |
Figure 5 CDCA3 promote M2 Macrophage polarization. (A) RT-qPCR assessment of mRNA levels of the M2 macrophage marker gene Arg-1 in THP-1 cells after PMA or HCC supernatant co-culture. (B and C) Flow cytometric analysis of IL-10 cytokine levels in M2 macrophages in THP-1 cells after PMA or HCC supernatant co-culture. (D and F) Evaluation of the efficacy of CDCA3 interference. (E and G) Expression changes of Arg1 after interference with CDCA3 expression. (*p < 0.05, **p < 0.01, ***p < 0.001, ****p < 0.0001). Abbreviation: ns, not significant. |
To further validate this effect in a functional context, we generated a lentiviral vector encoding shRNA targeting CDCA3 (sh‑CDCA3) to knock down CDCA3 expression in Huh7 and HepG2 hepatocellular carcinoma cells. Successful suppression of CDCA3 at both mRNA and protein levels was confirmed by RT‑qPCR and Western blot (Figure 5D and F). Culture supernatant from sh‑CDCA3‑transfected HCC cells was then collected and co‑cultured with THP‑1 cells for 24 h. Western blot analysis revealed that both mRNA and protein levels of M2 polarization markers were reduced upon CDCA3 inhibition (Figure 5E and G). In contrast, expression of the M1 marker IL‑1β was elevated following CDCA3 knockdown (Figure S1), consistent with a shift away from the M2 phenotype.
Collectively, these results demonstrate that CDCA3 plays a promoting role in M2 macrophage polarization.
CDCA3 Drives Malignant Progression in HCC by Polarizing M2 Macrophages
To determine whether CDCA3 expression influences the tumor-promoting function of macrophages, we established a conditioned medium (CM)-based co-culture system. Macrophages were first exposed to supernatant from CDCA3-knockdown HCC cells (sh-CDCA3); the resulting CM was then collected and applied to HCC cells with normal CDCA3 expression (test group). As a control, macrophages were treated with supernatant from HCC cells expressing normal CDCA3 levels, and the resulting CM was similarly used to treat normal CDCA3-expressing HCC cells. Functional assays revealed that the CM from the test group significantly attenuated the proliferative (Figure 6A), migratory (Figure 6B), and invasive (Figure 6C) capacities of HCC cells compared to the control group. These findings suggest that CDCA3 enhances HCC malignancy primarily by inducing M2-like polarization in tumor-associated macrophages, which in turn promotes a more aggressive tumor phenotype.
 |
Figure 6 Effects of CDCA3 expression interference-induced macrophage polarization on hepatoma cell malignancy. (A) Effect of CDCA3 interference-induced macrophage polarization on hepatoma cell proliferation. (B) Effect of CDCA3 interference-induced macrophage polarization on hepatoma cell migration. (C) Effect of CDCA3 interference-induced macrophage polarization on hepatoma cell apoptosis (**p < 0.01, ***p < 0.001). |
CDCA3 Promoted Macrophage M2 Polarization Induced by HCC Cell Culture Supernatant by the Change of Cytokines Expression
To investigate the principal mechanism underlying macrophage polarization, Olink proteomics sequencing was employed to quantify differentially expressed proteins in the supernatant of HepG2 cells following CDCA3 knockdown, compared to that of untreated control cells. Simultaneously, GO and KEGG analyses of differentially expressed genes were performed, and the volcano map showed that TGF-beta-1, VEGFA, CD40, CXCL1, and CXCL5 were significantly different (Figure 7A–C). TGF‑β1 is a pivotal immunomodulatory cytokine known to promote M2 macrophage polarization and facilitate anti‑inflammatory responses and tissue repair. Meanwhile, VEGFA, CXCL1, and CXCL5 often secreted by M2 macrophages contribute to the recruitment of immune cells involved in inflammatory and reparative processes (Figure 7D–H). Collectively, these cytokines exert coordinated effects on M2 macrophages, enhancing their anti‑inflammatory, tissue‑remodeling, and immunoregulatory functions.
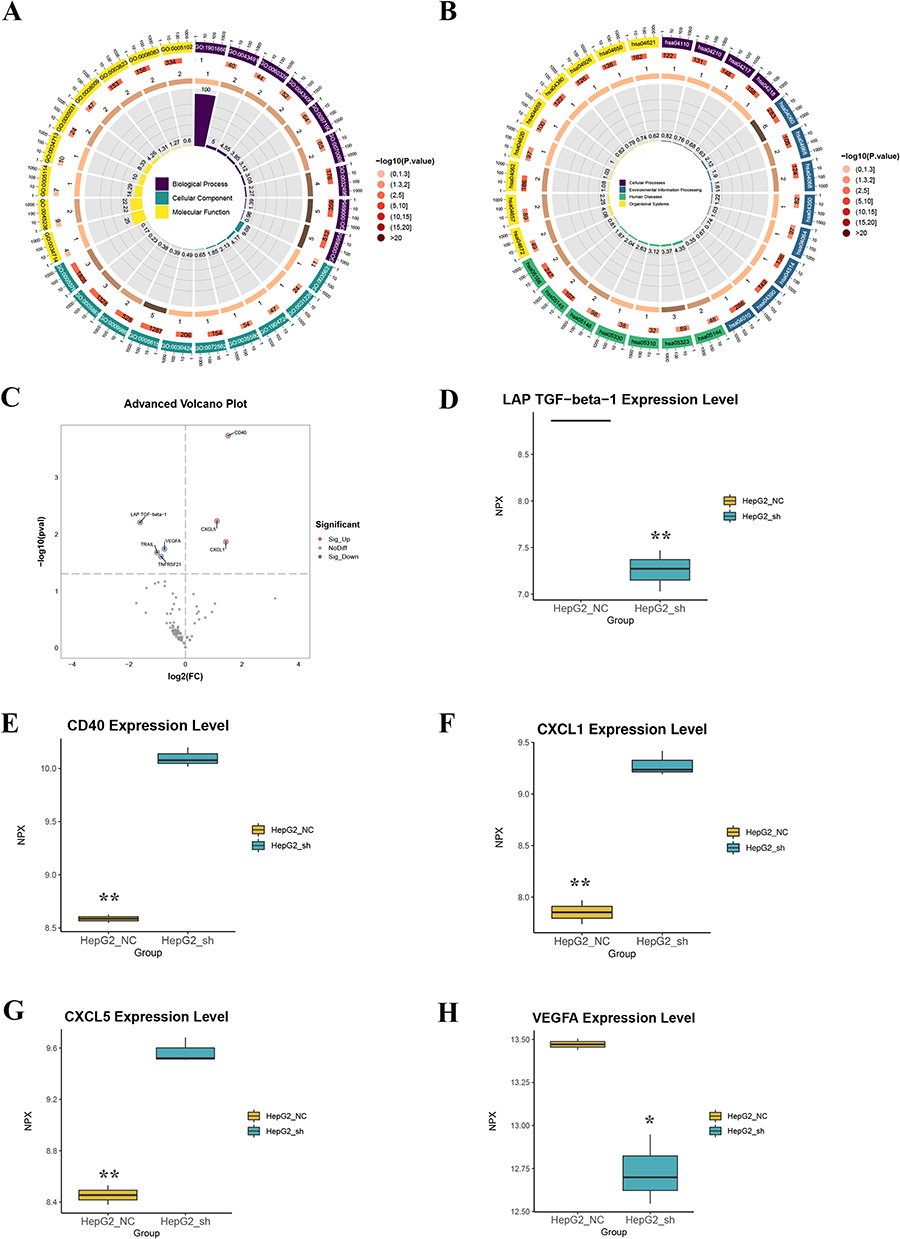 |
Figure 7 CDCA3 promotes M2 macrophage polarization induced by HCC cell culture supernatant through changes in cytokine expression. (A and B) Functional enrichment analysis of differentially expressed proteins in the supernatant of CDCA3-overexpressing HepG2 cells versus controls. (A) Significantly enriched Gene Ontology (GO) biological processes. (B) Significantly enriched KEGG pathways. (C) Volcano plot depicting the proteomic profile of differentially expressed proteins. Proteins are colored red for significant upregulation and blue for significant downregulation (FDR-adjusted p-value < 0.05). Key cytokines are explicitly labeled. (D–H) Validation of selected differentially expressed cytokines in cellular supernatant by Olink assay. Data are presented as mean ± SEM of normalized protein expression (NPX) from three biological replicates (n=3). Statistical significance was determined by Student’s t-test (*p < 0.05, **p < 0.01). |
Discussion
Hepatocellular carcinoma (HCC) continues to pose significant therapeutic challenges due to its high recurrence rate and metastatic potential, despite advances in treatment modalities.24 The persistent limitations in improving long-term patient survival underscore the urgent need to identify novel molecular drivers and potential therapeutic targets in HCC pathogenesis.25,26
Our investigation found CDCA3 as a clinically relevant biomarker and functional in HCC progression. Analysis of TCGA data revealed consistent CDCA3 upregulation in tumor tissues compared to normal counterparts, with elevated expression correlating with advanced disease stage and poorer overall survival. Univariate and multivariate analyses indicated that CDCA3 expression was associated with disease stage, and was also related to patient age, tumor grade, and T stage. The results demonstrated that serum CDCA3 levels exhibited an AUC of 0.869 (95% CI: 0.811–0.927), 81.9% sensitivity and 77.8% specificity for the diagnosis of HCC, suggesting that serum CDCA3 is a diagnostic and prognostic marker for HCC. Although peripheral blood can be affected by systemic factors (such as inflammation and liver and kidney clearance rates), leading to errors in the results, we chose to collect serum without hemolysis or lipemia. In subsequent multicenter cohort studies, we will further validate the diagnostic value of CDCA3.
Mechanistically, GO analysis revealed that cell proliferation and division were characterized by a state of heightened activity. The results of the BP and CC experiments indicated that the cell samples exhibited increased levels of cell proliferation, which may be indicative of cancer, tissue regeneration, or the process of cell growth, suggesting a high degree of malignancy or accelerated growth. It has been hypothesized that ions may exert an indirect influence on cell cycle progression by modulating the intracellular environment, for example, through the fluctuations of calcium ions or the MAPK and calcium-dependent protein pathways. One example is the role of calcium ions as a critical regulator of the G1/S phase transition. KEGG analysis revealed significant enrichment in neuroactive ligand-receptor interactions and cell cycle pathways, and neuroactive ligands (eg, epinephrine, dopamine, serotonin, and neuropeptides) can directly regulate macrophage function via their receptors, while norepinephrine inhibits NF-κB via β2-adrenergic receptors, driving M2 polarization (secretion of IL-10 and, TGF-β). In tumor microenvironments, catecholamines released by sympathetic nerves can induce macrophage skewing towards pro-tumor M2 phenotypes. Macrophages may secrete neuroactive molecules (eg, ATP and acetylcholine) to autoregulate polarization.27 Macrophages may directly (self-proliferation) or indirectly (paracrine factors) influence cell cycle progression.28,29 Further research is required to interpret this mechanism. GSEA data strongly suggested a systemic metabolic shutdown with hepatic and immune involvement. Priority should be given to pathways such as fatty acid oxidation (ACADM and CPT2) and bile acid synthesis (CYP7A1) as potential therapeutic targets.30
The malignant progression of tumors is closely associated with the tumor microenvironment (TME), which may be driven by alterations in cells and their secreted products, metabolite production, and remodeling of the extracellular matrix (ECM), resulting in the malignant advancement of tumors.31,32 Tumor-associated macrophages (TAMs) are a critical component of the tumor microenvironment that influences disease onset, progression and therapeutic response.33–35 To determine the role of CDCA3 in the TME, we found that the expression of CDCA3 was correlated with macrophages, neutrophils, DC, and CD4 T cells in the TCGA database. Two subtypes of tumor-associated macrophages have been identified: M1 and M2. M1-type macrophages have been demonstrated to promote inflammation and inhibit tumor development, primarily through the production of cytokines, such as IL-12 and TNF-α. In contrast, M2-type macrophages have been shown to inhibit inflammation and immune surveillance through the release of IL-10 and TGF-β, which have been identified as contributing factors to tumor development.36,37 In general, M1 macrophages have been observed to exhibit anti-cancer activity. However, as cancer progresses, immunosuppressive M2 macrophages become the predominant type, promoting tumor growth and metastasis, as well as vascularization and remodeling of the tumor mesenchyme.11,38 We used immunohistochemistry to detect the expression of CDCA3 and CD163 (M2 macrophage marker) in the same hepatocellular carcinoma tissues and found that the expression levels of CDCA3 and CD163 in hepatocellular carcinoma tissues were positively correlated, indicating that the infiltration of M2 macrophages was also increased in hepatocellular carcinoma tissues with high CDCA3 expression levels. The expression levels of CDCA3 and CD163 in HCC tissues were positively correlated, indicating that the infiltration of M2 macrophages increased in HCC tissues with high CDCA3 expression levels. These results suggest that the expression level of CDCA3 in HCC may be related to the M2 polarization of tumor-associated macrophages. Despite rigorous standardization, several limitations of our IHC approach warrant consideration: Pre-analytical Variability: Although fixation time was controlled, differences in tissue ischemia time could affect epitope preservation. Spatial Heterogeneity: Focal CDCA3 expression in tumors might be underrepresented in tissues. To clarify the effect of CDCA3 on the M2 polarization of tumor-associated macrophages, we used supernatants from cultured HCC cells to induce the polarization of THP-1 origin macrophages and found that the expression of M2-type macrophage markers such as Arg1 and IL-10 increased significantly, which proved that THP-1 origin macrophages had been induced to become M2-type macrophages to become M2-type macrophages. We then knocked down the expression of CDCA3 in HCC cells and co-cultured the supernatant of cells with THP-1. Arg1 expression was inhibited after interference with CDCA3 expression, confirming that CDCA3 could promote M2 polarization of tumor-associated macrophages in HCC cells. To further investigate the effect of CDCA3-induced M2 polarization of TAMs on the biological behavior of HCC cells, we co-cultured HCC cells and CDCA3-interfering HCC cell with the supernatant of macrophages for 24 h. The effects of CDCA3-induced M2 polarization of tumor-associated macrophages on the proliferation, migration, and apoptosis of HCC cells were investigated using CCK-8 and apoptosis assays. These results confirmed that CDCA3 promotes the malignant progression of HCC by inducing M2 polarization of tumor-associated macrophages. To elucidate the underlying mechanisms through which CDCA3 promotes M2 macrophage polarization under CM induction, we profiled the cell supernatant using Olink technology to screen for soluble factors potentially involved. TGF-beta-1 and VEGFA were significantly downregulated in CDCA3-knockdown HCC cell supernatants, and CD40, CXCL5, and CXCL1 were significantly overexpressed. TGF-beta-1 is a crucial cytokine that modulates macrophage function, promoting their differentiation towards the M2 phenotype.39 Vascular Endothelial Growth Factor A (VEGFA) is a key factor in angiogenesis and plays a significant role in immune response, particularly in M2 macrophages. VEGFA is known to promote macrophage polarization toward the M2 phenotype.40 CD40 is a costimulatory molecule that plays a significant role in immune responses, particularly in the activation and regulation of various immune cells, including macrophages. CD40 is often associated with M1 (pro-inflammatory) responses, and its role in M2 polarization is complex.41 CXCL5 (C-X-C Motif Chemokine Ligand 5), also known as ENA-78, is a chemokine involved in various immune responses and has a notable relationship with M2 macrophages.42 CXCL1 (C-X-C Motif Chemokine Ligand 1), also known as Growth-Regulated Oncogene Alpha (GROα), is a chemokine involved in inflammatory responses and has a complex relationship with M2 macrophages.43 These results suggest that CDCA3 may influence immune cell function in the tumor microenvironment by regulating the secretion of these key factors. However, the precise mechanism by which CDCA3 regulates the secretion of these cytokines remains a central question that requires deeper exploration. Based on the known biological functions of CDCA3, we propose several potential mechanisms. Firstly, and most directly, as a key component of an E3 ubiquitin ligase complex, CDCA3 might directly mediate the ubiquitination and degradation of certain transcription factors or signaling pathway proteins, thereby transcriptionally regulating cytokine expression. For instance, CDCA3 could influence the activity of canonical signaling pathways such as NF-κB or STAT,44 leading to broad alterations in the transcription of TGF-β-1, VEGFA, and various chemokines. Secondly, given its pivotal role in cell cycle regulation, CDCA3 knockdown may induce cell cycle arrest and proliferation inhibition; such a fundamental change in cell state can itself trigger a global reprogramming of the secretome. Furthermore, we cannot exclude the possibility that CDCA3 indirectly interferes with the post-translational modification, folding, or secretion processes of cytokines by influencing endoplasmic reticulum stress or autophagy. Future studies are necessary to directly identify CDCA3-interacting proteins using techniques like co-immunoprecipitation (Co-IP) and mass spectrometry, and to validate specific downstream targets and regulatory axes through functional rescue experiments involving the overexpression or knockdown of key molecules in these proposed pathways in HCC cells.
This study has several limitations that should be considered when interpreting our findings. The single-center origin and limited sample size of our clinical cohort necessitate validation in larger, multi-center studies. The absence of in vivo validation represents another constraint, as the complex dynamics of the tumor microenvironment cannot be fully recapitulated in vitro. Future studies employing orthotopic liver cancer models or humanized mouse systems would provide valuable insights into CDCA3’s immunomodulatory functions in a more physiologically relevant context. Additionally, while the PMA-differentiated THP-1 model offers practical advantages, primary tumor-associated macrophages from HCC patients would more accurately represent the cellular interactions occurring in human hepatocellular carcinoma.
In conclusion, our findings establish CDCA3 as a promising diagnostic biomarker and functional regulator in HCC progression. Thus, CDCA3 promotes HCC progression by driving M2 macrophage polarization via the regulation of specific immunomodulators, establishing a novel mechanism of tumor microenvironment manipulation. These insights not only advance our understanding of HCC pathogenesis but also highlight CDCA3 as a potential therapeutic target for further investigation.
Consent for Publication
All authors have approved the manuscript for publication. Data and materials are accessible upon request. The study’s original contributions are incorporated within the article. For additional questions, please contact the corresponding author.
Acknowledgments
This study was supported by the Science and Technology Program of Zhejiang Province (LQ24H200001), Medical and Health Research Project of Zhejiang Province (2023KY353), Chinese Medicine Research Program of Zhejiang Province (2024ZL176), and Shaoxing Bureau of Science and Technology Plan (2022SY020, 2023A14010).
Author Contributions
All authors made a significant contribution to the work reported, whether that is in the conception, study design, execution, acquisition of data, analysis and interpretation, or in all these areas; took part in drafting, revising or critically reviewing the article; gave final approval of the version to be published; have agreed on the journal to which the article has been submitted; and agree to be accountable for all aspects of the work.
Funding
This study was funded by the Science and Technology Program of Zhejiang Province (LQ24H200001), Medical and Health Research Project of Zhejiang Province (2023KY353), Chinese Medicine Research Program of Zhejiang Province (2024ZL176), and Shaoxing Bureau of Science and Technology Plan (2022SY020, 2023A14010).
Disclosure
The authors report no conflicts of interest in this work.
References
1. Xia C, Dong X, Li H, et al. Cancer statistics in China and United States, 2022: profiles, trends, and determinants. Chin Med J. 2022;135(5):584–590. doi:10.1097/CM9.0000000000002108
2. Vogel A, Meyer T, Sapisochin G, Salem R, Saborowski A. Hepatocellular carcinoma. Lancet Lond Engl. 2022;400(10360):1345–1362. doi:10.1016/S0140-6736(22)01200-4
3. Llovet JM, Kelley RK, Villanueva A, et al. Hepatocellular carcinoma. Nat Rev Dis Primer. 2021;7(1):6. doi:10.1038/s41572-020-00240-3
4. Chidambaranathan-Reghupaty S, Fisher PB, Sarkar D. Hepatocellular carcinoma (HCC): epidemiology, etiology and molecular classification. Adv Cancer Res. 2021;149:1–61. doi:10.1016/bs.acr.2020.10.001
5. Lurje I, Czigany Z, Bednarsch J, et al. Treatment strategies for hepatocellular carcinoma − a multidisciplinary approach. Int J Mol Sci. 2019;20(6):1465. doi:10.3390/ijms20061465
6. Bray F, Laversanne M, Sung H, et al. Global cancer statistics 2022: GLOBOCAN estimates of incidence and mortality worldwide for 36 cancers in 185 countries. CA Cancer J Clin. 2024;74(3):229–263. doi:10.3322/caac.21834
7. Xiang J, Li Y, Mei S, et al. Novel diagnostic and therapeutic strategies based on PANoptosis for hepatocellular carcinoma. Cancer Biol Med. 2025;22(8):928–939. doi:10.20892/j.issn.2095-3941.2025.0150
8. Kildey K, Gandhi NS, Sahin KB, et al. Elevating CDCA3 levels in non-small cell lung cancer enhances sensitivity to platinum-based chemotherapy. Commun Biol. 2021;4(1):638. doi:10.1038/s42003-021-02136-8
9. Li H, Li M, Yang C, et al. Prognostic value of CDCA3 in kidney renal papillary cell carcinoma. Aging. 2021;13(23):25466–25483. doi:10.18632/aging.203767
10. Junttila MR, de Sauvage FJ. Influence of tumour micro-environment heterogeneity on therapeutic response. Nature. 2013;501(7467):346–354. doi:10.1038/nature12626
11. Xiao Y, Yu D. Tumor microenvironment as a therapeutic target in cancer. Pharmacol Ther. 2021;221:107753. doi:10.1016/j.pharmthera.2020.107753
12. Malik S, Sureka N, Ahuja S, Aden D, Zaheer S, Zaheer S. Tumor-associated macrophages: a sentinel of innate immune system in tumor microenvironment gone haywire. Cell Biol Int. 2024;48(10):1406–1449. doi:10.1002/cbin.12226
13. Kerneur C, Cano CE, Olive D. Major pathways involved in macrophage polarization in cancer. Front Immunol. 2022;13:1026954. doi:10.3389/fimmu.2022.1026954
14. Klichinsky M, Ruella M, Shestova O, et al. Human chimeric antigen receptor macrophages for cancer immunotherapy. Nat Biotechnol. 2020;38(8):947–953. doi:10.1038/s41587-020-0462-y
15. Qiu Y, Chen T, Hu R, et al. Next frontier in tumor immunotherapy: macrophage-mediated immune evasion. Biomark Res. 2021;9(1):72. doi:10.1186/s40364-021-00327-3
16. Cheng K, Cai N, Zhu J, Yang X, Liang H, Zhang W. Tumor-associated macrophages in liver cancer: from mechanisms to therapy. Cancer Commun. 2022;42(11):1112–1140. doi:10.1002/cac2.12345
17. Tomczak K, Czerwińska P, Wiznerowicz M. The cancer genome atlas (TCGA): an immeasurable source of knowledge. Contemp Oncol Poznan Pol. 2015;19(1A):A68–77. doi:10.5114/wo.2014.47136
18. Győrffy B. Integrated analysis of public datasets for the discovery and validation of survival-associated genes in solid tumors. Innov Camb Mass. 2024;5(3):100625. doi:10.1016/j.xinn.2024.100625
19. Kanehisa M, Furumichi M, Sato Y, Matsuura Y, Ishiguro-Watanabe M. KEGG: biological systems database as a model of the real world. Nucleic Acids Res. 2025;53(D1):D672–D677. doi:10.1093/nar/gkae909
20. Kanehisa M. Toward understanding the origin and evolution of cellular organisms. Protein Sci Publ Protein Soc. 2019;28(11):1947–1951. doi:10.1002/pro.3715
21. Fairfax BP, Taylor CA, Watson RA, et al. Peripheral CD8+ T cell characteristics associated with durable responses to immune checkpoint blockade in patients with metastatic melanoma. Nat Med. 2020;26(2):193–199. doi:10.1038/s41591-019-0734-6
22. Am M, P J, M S, et al. The extracellular matrix: an accomplice in gastric cancer development and progression. Cells. 2020;9(2). doi:10.3390/cells9020394
23. Li T, Fan J, Wang B, et al. TIMER: a web server for comprehensive analysis of tumor-infiltrating immune cells. Cancer Res. 2017;77(21):e108–e110. doi:10.1158/0008-5472.CAN-17-0307
24. Hwang SY, Danpanichkul P, Agopian V, et al. Hepatocellular carcinoma: updates on epidemiology, surveillance, diagnosis and treatment. Clin Mol Hepatol. 2025;31(Suppl):S228–S254. doi:10.3350/cmh.2024.0824
25. Zhang S, Xiao X, Yi Y, et al. Tumor initiation and early tumorigenesis: molecular mechanisms and interventional targets. Signal Transduct Target Ther. 2024;9(1):149. doi:10.1038/s41392-024-01848-7
26. Shi X, Wang X, Yao W, et al. Mechanism insights and therapeutic intervention of tumor metastasis: latest developments and perspectives. Signal Transduct Target Ther. 2024;9(1):192. doi:10.1038/s41392-024-01885-2
27. Wang Y, Anesi JC, Panicker IS, et al. Neuroimmune interactions and their role in immune cell trafficking in cardiovascular diseases and cancer. Int J Mol Sci. 2025;26(6):2553. doi:10.3390/ijms26062553
28. Filiberti S, Russo M, Lonardi S, et al. Self-renewal of macrophages: tumor-released factors and signaling pathways. Biomedicines. 2022;10(11):2709. doi:10.3390/biomedicines10112709
29. Lavin Y, Mortha A, Rahman A, Merad M. Regulation of macrophage development and function in peripheral tissues. Nat Rev Immunol. 2015;15(12):731–744. doi:10.1038/nri3920
30. Jia W, Li Y, Cheung KCP, Zheng X. Bile acid signaling in the regulation of whole body metabolic and immunological homeostasis. Sci China Life Sci. 2024;67(5):865–878. doi:10.1007/s11427-023-2353-0
31. Que H, Fu Q, Lan T, Tian X, Wei X. Tumor-associated neutrophils and neutrophil-targeted cancer therapies. Biochim Biophys Acta Rev Cancer. 2022;1877(5):188762. doi:10.1016/j.bbcan.2022.188762
32. Downs-Canner SM, Meier J, Vincent BG, Serody JS. B cell function in the tumor microenvironment. Annu Rev Immunol. 2022;40:169–193. doi:10.1146/annurev-immunol-101220-015603
33. Munir MT, Kay MK, Kang MH, et al. Tumor-associated macrophages as multifaceted regulators of breast tumor growth. Int J Mol Sci. 2021;22(12):6526. doi:10.3390/ijms22126526
34. DeNardo DG, Ruffell B. Macrophages as regulators of tumour immunity and immunotherapy. Nat Rev Immunol. 2019;19(6):369–382. doi:10.1038/s41577-019-0127-6
35. L I, T G, P A, et al. Tumor-associated macrophages in human breast, colorectal, lung, ovarian and prostate cancers. Front Oncol. 2020:10. doi:10.3389/fonc.2020.566511
36. Boutilier AJ, Elsawa SF. Macrophage Polarization States in the Tumor Microenvironment. Int J Mol Sci. 2021;22(13):6995. doi:10.3390/ijms22136995
37. Wang H, Zhang X, Wang X, Xu W. The promising role of tumor-associated macrophages in the treatment of cancer. Drug Resist Updat Rev Comment Antimicrob Anticancer Chemother. 2024;73:101041. doi:10.1016/j.drup.2023.101041
38. Aminin D, Wang YM. Macrophages as a “weapon” in anticancer cellular immunotherapy. Kaohsiung J Med Sci. 2021;37(9):749–758. doi:10.1002/kjm2.12405
39. Cai G, Lu Y, Zhong W, et al. Piezo1-mediated M2 macrophage mechanotransduction enhances bone formation through secretion and activation of transforming growth factor-β1. Cell Prolif. 2023;56(9):e13440. doi:10.1111/cpr.13440
40. Ni X, Wu W, Sun X, et al. Interrogating glioma-M2 macrophage interactions identifies gal-9/tim-3 as a viable target against PTEN-null glioblastoma. Sci Adv. 2022;8(27):eabl5165. doi:10.1126/sciadv.abl5165
41. Zhang JQ, Zeng S, Vitiello GA, et al. Macrophages and CD8+ T cells mediate the antitumor efficacy of combined CD40 ligation and imatinib therapy in gastrointestinal stromal tumors. Cancer Immunol Res. 2018;6(4):434–447. doi:10.1158/2326-6066.CIR-17-0345
42. Su P, Jiang L, Zhang Y, et al. Crosstalk between tumor-associated macrophages and tumor cells promotes chemoresistance via CXCL5/PI3K/AKT/mTOR pathway in gastric cancer. Cancer Cell Int. 2022;22(1):290. doi:10.1186/s12935-022-02717-5
43. W N, L W, Z Y, et al. CXCL1 derived from tumor-associated macrophages promotes breast cancer metastasis via activating NF-κB/SOX4 signaling. Cell Death Dis. 2018;9(9). doi:10.1038/s41419-018-0876-3
44. Xue C, Yao Q, Gu X, et al. Evolving cognition of the JAK-STAT signaling pathway: autoimmune disorders and cancer. Signal Transduct Target Ther. 2023;8(1):204. doi:10.1038/s41392-023-01468-7
 © 2025 The Author(s). This work is published and licensed by Dove Medical Press Limited. The
full terms of this license are available at https://www.dovepress.com/terms
and incorporate the Creative Commons Attribution
- Non Commercial (unported, 4.0) License.
By accessing the work you hereby accept the Terms. Non-commercial uses of the work are permitted
without any further permission from Dove Medical Press Limited, provided the work is properly
attributed. For permission for commercial use of this work, please see paragraphs 4.2 and 5 of our Terms.
© 2025 The Author(s). This work is published and licensed by Dove Medical Press Limited. The
full terms of this license are available at https://www.dovepress.com/terms
and incorporate the Creative Commons Attribution
- Non Commercial (unported, 4.0) License.
By accessing the work you hereby accept the Terms. Non-commercial uses of the work are permitted
without any further permission from Dove Medical Press Limited, provided the work is properly
attributed. For permission for commercial use of this work, please see paragraphs 4.2 and 5 of our Terms.
Recommended articles
Tumor-Associated Macrophages in Hepatocellular Carcinoma: From Ontogeny and Heterogeneity to Immune Evasion and Therapeutic Targeting
Su Y, Liang Y, Zhong D, Chen Y, Ma SS, Huang X
Journal of Hepatocellular Carcinoma 2026, 13:616101
Published Date: 16 June 2026