Back to Journals » Journal of Inflammation Research » Volume 16
CD8A is a Promising Biomarker Associated with Immunocytes Infiltration in Hyperoxia-Induced Bronchopulmonary Dysplasia
Authors Du Y, Zuo L, Xiong Y, Wang X, Zou J, Xu H
Received 25 November 2022
Accepted for publication 18 February 2023
Published 17 April 2023 Volume 2023:16 Pages 1653—1669
DOI https://doi.org/10.2147/JIR.S397491
Checked for plagiarism Yes
Review by Single anonymous peer review
Peer reviewer comments 2
Editor who approved publication: Professor Ning Quan
Yiting Du,1,2 Limin Zuo,2 Ying Xiong,1 Xuedong Wang,3 Jun Zou,2 Hong Xu1
1Department of Pediatrics, Key Laboratory of Birth Defects and Related Diseases of Women and Children, West China Second University Hospital, Sichuan University, Chengdu, 610041, People’s Republic of China; 2Chengdu Women’s and Children’s Central Hospital, School of Medicine, University of Electronic Science and Technology of China, Chengdu, 611731, People’s Republic of China; 3Key Laboratory of Birth Defects and Related Diseases of Women and Children, West China Second University Hospital, Sichuan University, Chengdu, 610041, People’s Republic of China
Correspondence: Ying Xiong, Department of Pediatrics, Key Laboratory of Birth Defects and Related Diseases of Women and Children, West China Second University Hospital, Sichuan University, Sec. 3 No. 17, South Renmin Road, Chengdu, 610041, People’s Republic of China, Email [email protected]
Background: Bronchopulmonary dysplasia (BPD) refers to a chronic lung disease which is commonly observed in preterm infants. It can usually be caused by several pathological processes that endanger the long-term lung development, such as inflammation and immune dysfunction.
Methods: In this study, a bioinformatics approach was applied to identify the differentially expressed immune-related genes (DEIRGs). We downloaded the transcriptional profiles (GSE32472 dataset) from the Gene Expression Omnibus (GEO) database and performed gene set enrichment analysis (GSEA). Cell type Identification By Estimating Relative Subsets of RNA Transcripts (CIBERSORT), microenvironment cell populations counter (MCPcounter), and Estimation of STromal and Immune cells in Malignant Tumor tissues using Expression data (ESTIMATE) were used for the analysis of the immune cell infiltration landscape of BPD. A weighted co-expression network was subsequently constructed using weighted gene co-expression network analysis (WGCNA) to screen candidate differentially expressed immune related genes (DEIRGs).
Results: GSEA results indicated that immune-related pathways were mainly involved in BPD. Ten significantly different immune cell types were observed between BPD and normal groups. A total of 228 DEGs in the turquoise module were identified, and 31 DEIRGs were further identified. Cluster of the differentiation 8 alpha (CD8A) expression was down-regulated in BPD, and its expression was validated by the GSE25286, GSE25293, GSE99633 datasets and qRT-PCR. In addition, CD8A expression was closely associated with immune cells infiltration, especially T cells CD8 and neutrophil.
Conclusion: A distinct immune cell infiltration landscape was found between BPD and normal group. CD8A can be a novel candidate biomarker for BPD, which plays an essential role in the onset and progress of hyperoxia-related BPD via the disruption of immune cell functions.
Keywords: bronchopulmonary dysplasia, CD8A, preterm infants, immunocytes infiltrate, hyperoxia
Introduction
Bronchopulmonary dysplasia (BPD) is known as a devastating chronic lung disease observed commonly in premature infants with frequent and severe respiratory infections and a lifelong impairment in pulmonary functions.1,2 Approximately 10–30% premature infants who were born with <1000 g birthweight before 30 weeks’ gestation would have the potential to develop BPD.3 Mounting evidences have demonstrated that BPD is associated with considerable morbidity and mortality in the newborn period, childhood, and adulthood.4,5 In addition to the respiratory system, BPD also shows adverse impacts on the neurodevelopment and other organs throughout the body.6 Therefore, it is of great importance to develop novel biomarkers for tracking the onset and progress of BPD and provide powerful and reliable interventions for BPD.
The pathogenesis of BPD is complex and remains largely unknown. Recent studies revealed that immune response plays an important role in the pathological process of BPD.7 A genomic study conducted by Revhaug et al reported that the immune system-related genes were impacted in a murine experimental model of BPD.8 Hyperoxia could evoke the innate immune response by promoting the generation of chemokines and cytokines and recruiting the immune cells to the pulmonary tissue in BPD model subsequently.9 Moreover, neonatal hyperoxic exposure can lead to the proinflammatory M1 phenotype in the alveolar macrophages.10 A recent study has further identified a set of differentially expressed genes and the dysregulated pathways associated with T cell activation in BPD subjects.11 In recent years, bioinformatics approaches have been attempted to unveil the underlying pathways involved in BPD development. Angiogenesis and inflammation were considered as important biological changes that contributed to the BPD development, and the expression of interleukin 6 mRNA was observed pronouncedly increased in early BPD.12 Some potential candidate genes (NOS2, MMP1, CRP, and LBP) in relation to BPD have been discovered in preterm newborns by exome sequencing.13 The down-regulation of EGR1, JUN, BTG2, and FOS has also been reported to be associated with BPD, and may serve as biomarkers for early BPD diagnosis.14 However, although multiple biomarkers have been identified for the early diagnosis of BPD, the underlying mechanism of BPD is still not fully elucidated. Many studies reported that immune cell infiltration is closely related to the etiology of different clinical outcomes, such as tumors, ulcerative colitis, psoriasis, arthritis, myocarditis, and atherosclerosis.15–20 The role of immune cell infiltration in the BPD is, nevertheless, yet to be determined. Thus, it would be of great interest to investigate how the immune cell infiltration results in the pathological processes that contribute to lung injury in BPD and to examine the differences in the composition of various immune cells.
In the present study, we aimed to identify immune-related genes (IRGs) for BPD and explore the role of immune infiltration in BPD. First, we comprehensively applied the IBERSORT, MCPcounter, and ESTIMATE algorithms to characterize the immune infiltration landscape of BPD. Then, differential expression analysis and weighted gene co-expression network analysis (WGCNA) were used to screen immune-related modules and core IRGs. Additionally, the relationship between immune cell infiltrations and core IRGs was examined to further understand the related immune mechanism in the etiology of BPD. This study may offer a better understanding of the immune response in hyperoxia-related BPD and provide important insights into further research work or clinical practice.
Methods
Acquisition and Preprocessing of Gene Expression Omnibus (GEO) Data
The schematic diagram of this study is presented in Figure 1. The gene expression datasets of BPD (GSE32472, GSE25286, GSE25293, and GSE99633) were downloaded from the GEO database. GSE32472 dataset was applied to identify IRGs, which contained blood samples from 25 infants without BPD (no oxygen therapy) and 50 infants with severe BPD (oxygen therapy > 28 days), respectively. The GSE25286, GSE25293, and GSE99633 datasets were used to validate the results of bioinformatics analysis, and the BPD was induced by hyperoxia. Detailed information of the datasets is presented in Table 1. We used the Affy package of R to perform normalization and background correction.21 The “sva” package was used to perform batch normalization.22
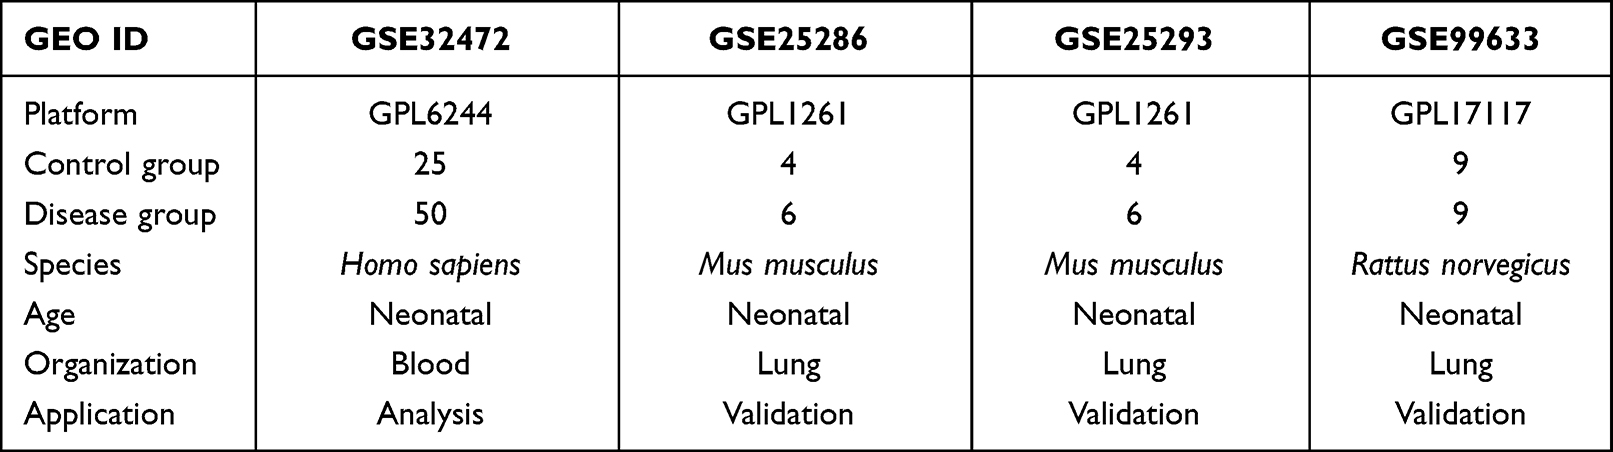 |
Table 1 The Detailed Descriptions of the Datasets in the Present Study |
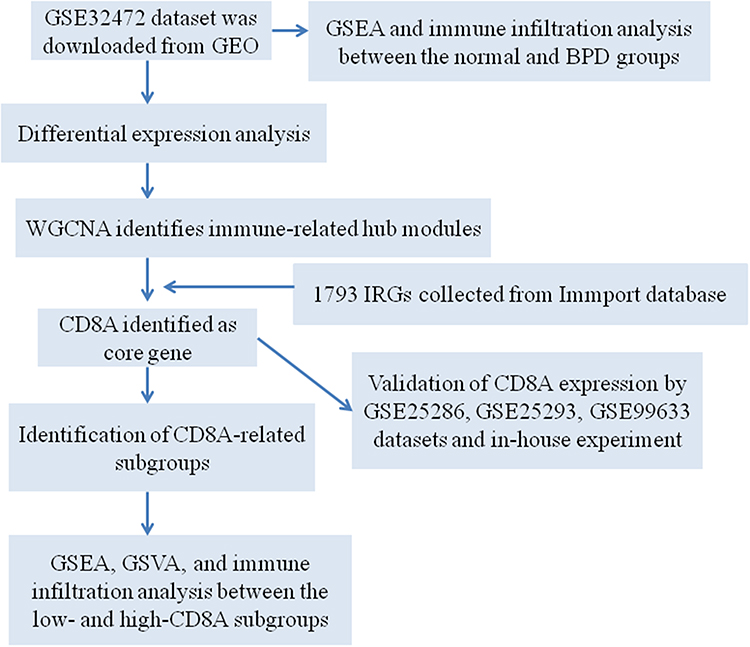 |
Figure 1 The schematic graph of the bioinformatics analysis. |
Gene Set Enrichment Analysis (GSEA)
To identify differential enrichment pathways and biological processes involved in BPD development, we carried out GSEA based on the gene expression profile of the GSE32472 dataset. The DOSE (v.3.22.1), ggplot2 (v.3.3.3), enrichplot (v.1.16.2), and ClusterProfiler (v.4.4.4) packages were applied to visualize GSEA.23,24 The reference gene sets of “h.all.v7.3.symbols” was downloaded from the MSigDB database (https://www.gsea-msigdb.org/gsea/msigdb/index.jsp). P-value <0.05 and false discovery rate <0.25 were set as the filter parameters.
Immune Cell Infiltrates Analysis
The gene expression profiles of BPD patients were analyzed to comprehensively assess the biological functions and characterize the landscape of immune cell infiltration in BPD. We applied CIBERSORT to analyze the gene expression profile of the GSE32472 dataset and compare the proportion of 22 immune cell types between normal and BPD groups. MCPcounter was applied to assess the proportion of 10 immune cell types between normal and BPD groups. ESTIMATE software was applied to calculate ESTIMATE Sore, Immune Sore, and Stromal Score. We used the ggplot2 package of R to visualize the difference of immune infiltrate levels between normal and BPD groups.
Identification of Differentially Expressed Genes (DEGs) and WGCNA
DEGs between normal and BPD groups of the GSE32472 dataset were identified using the limma package, and they were screened based on the cutoff criteria with p.adj < 0.05 and∣logFC∣ ≥ 0.3. Then, the DEGs expression profile was obtained, and we performed WGCNA to identify co-expression modules that are associated with immune-related pathways. We calculated the distance between each gene by Pearson’s correlation coefficient, WGCNA package was used to construct a weighted gene co-expression network.25 The hierarchical clustering analysis was carried out using “hclust” function, and the “pickSoftThreshold” function was applied to calculate the soft thresholding power value. Furthermore, the co-expression network between normal and BPD groups was constructed using the “blockwiseModules” function. The hub genes in each valuable module were screened based on Module Membership (MM) > 0.8 and Gene Significance (GS) > 0.5.
Functional Annotation of the Valuable Modules
To identify the potential biological function of the valuable modules, we applied the clusterProfiler package of R to carry out the Kyoto Encyclopedia of Genes and Genomes (KEGG) and Gene Ontology-Biological process (GOBP) enrichment analysis.26 P-value <0.05 was considered significantly enriched.
Protein–Protein Interaction (PPI) Network and Core Differentially Expressed Immune Related Genes (DEIRGs) Identification
The immune-related genes were downloaded from the ImmPort database (https://www.immport.org/). The DEIRGs among WGCNA modules and IRGs were identified using the Venn tool. The STRING database (http://string-db.org) was used to construct the PPI network of DEIRGs, and the result was visualized using Cytoscape software (version 3.7.2). The core DEIRGs were screened using the CytoHubba plug-in of Cytoscape software. The samples of the GSE32472 dataset were divided into CD8A-low and CD8A-high subgroups based on the median expression of CD8A. The R heatmap package was used to visualize gene expression levels between CD8A-low and CD8A-high subgroups. The ggplot2 package was used to visualize the disparities of immune infiltrate levels between CD8A-low and CD8A-high subgroups.
Correlation Analysis Between Immune Cells and CD8A Expression
We assessed the correlation between CD8A expression and infiltrating immune cells using Spearman correlation analysis, and the results were visualized by the ggplot2 package of R.
Establishment of the BPD Model and CD8A Expression Validation
We purchased 30 neonatal Sprague-Dawley rats (3.5–4.5 g) from the laboratory animal center of Sichuan University. The animal experiment was approved by the Animal Ethics Committee of West China Second University Hospital (NO. 2022KX016). All animals were randomly divided into the normoxia group (n = 15, exposure to air) and hyperoxia group (n = 15, exposure to 90% oxygen).27 After 14 days of hyperoxia induction, the rats were anesthetized with pentobarbital sodium (50 mg/kg), and blood samples were collected for a quantitative real-time polymerase-chain reaction (qRT-PCR) experiment. The TRIzol reagent (Invitrogen, USA) was used to extract the total RNA from blood samples. Two micrograms of purified RNA was reverse-transcribed into cDNA by Takara PrimeScript RT kit (Takara, Japan) following the manufacturer’s protocols. Then, the qRT-PCR was carried out using Brilliant SYBR Green QPCR Master Mix (Stratagene) on the ABI 7500HT PCR system (Applied Biosystems, MA, USA) based on the manufacturer’s instructions. The 2–ΔΔCt method was used to quantify the relative expression and β-actin was used for normalization. The primers used were listed in Table S1.
Statistical Analysis
Normal distributed data were presented as mean ± standard deviation (SD). Statistical analysis was performed by using one-way analysis of variance (ANOVA). Dunnett’s test was conducted to correct for the multiple comparisons. P-value <0.05 was considered as statistically significant.
Results
GSEA of the GSE32472 Dataset
We performed GSEA on the gene expression profile of the GSE32472 dataset between normal and BPD groups to explore the potential signaling pathways related to the pathologies of BPD. As presented in Figure 2, our findings revealed that inflammation- and immune-related pathways were found mainly involved in BPD development, such as the B cell receptor signaling pathway, cytokine–cytokine receptor interaction, chemokine signaling pathway, an intestinal immune network for IGA production, primary immunodeficiency, T cell receptor signaling pathway, and CD8 T-cell receptor (TCR) pathway, etc. This result implied that immune response plays an important role in BPD development.
 |
Figure 2 Gene set enrichment analysis (GSEA). Potential pathways, such as B cell receptor signaling pathway (A), cytokine receptor interaction (B), chemokine signaling pathway (C), the immune network for IGA production (D), primary immunodeficiency (E), senescence and autophagy in cancer (F), T cell receptor signaling pathway (G), CD8 TCR pathway (H) involved in BPD. |
Composition of Immune Cells in BPD
As shown in Figure 3A, we used CIBERSORT to quantify the proportion of 22 immune cell types, and results indicated the proportion of B cells naïve (p < 0.05), NK cells resting (p < 0.01), macrophages M0 (p < 0.001), and neutrophils (p < 0.001) were significantly higher in the BPD group than those in the normal group. However, the proportion of T cells CD8 (p < 0.001), T cells CD4 naïve (p < 0.001), T cells CD4 memory resting (p < 0.01), and monocytes (p < 0.01) were significantly lower in the BPD group than those in the normal group. The MCPcounter was used to analyze the proportion of 10 immune cell types (Figure 3B), and the results revealed that the proportion of T cells (p < 0.001), CD8 T cells (p < 0.001), and myeloid dendritic cells (p < 0.01) were significantly lower in the BPD group than in the normal group, while neutrophils (p < 0.001) and endothelial cells (p < 0.05) were significantly higher in the BPD group than in the normal group. Furthermore, the ESTIMATE scores, Immune scores, and Stromal scores generated by the ESTIMATE software showed that Immune scores (p < 0.05) and Stromal scores (p < 0.05) were significantly different between the BPD group and the normal group (Figure 3C). These results further strengthened our hypothesis that immunocyte infiltration was highly involved in the BPD etiology.
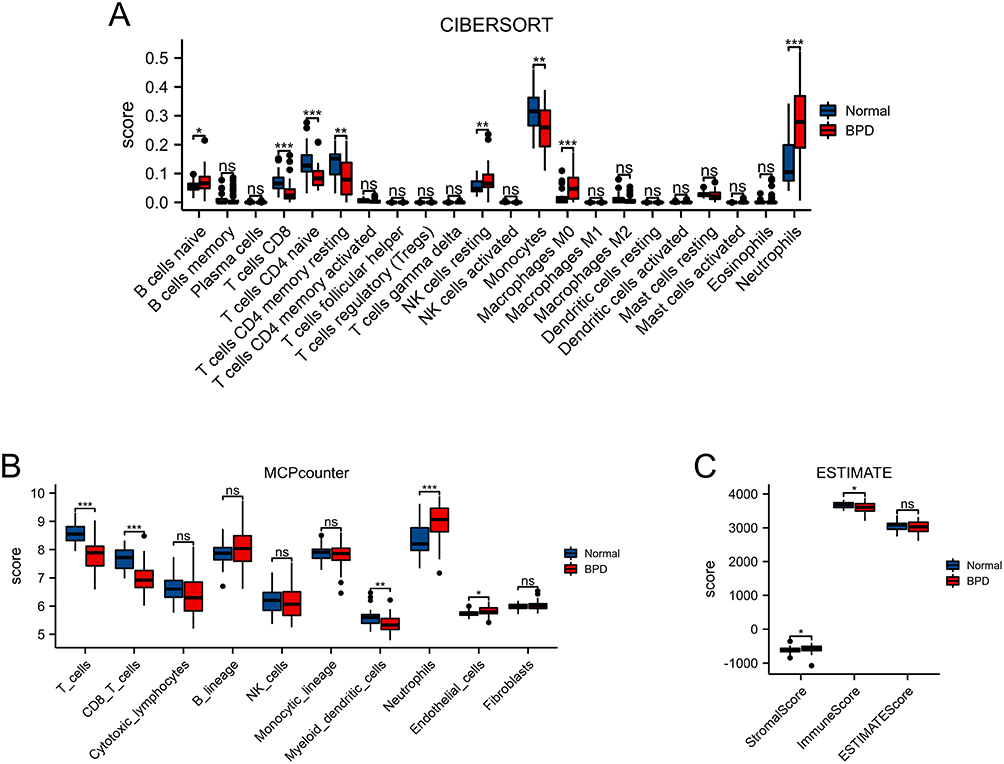 |
Figure 3 Landscape of immunocytes infiltrates in BPD. (A) CIBERSORT scores of 22 immune cell types between BPD and normal groups. (B) MCPCounter scores of stromal cells or immune cells between BPD and normal groups. (C) Stromalscore, Immunescore, and ESTIMATEScore between BPD and normal groups. *p < 0.05, **p < 0.01, ***p < 0.001. |
Identification of DEGs and WGCNA
We used the “limma” package to identify the DEGs between the BPD and normal groups. As shown in Figure 4A and Table S2, a total of 2000 DEGs were obtained based on the cutoff criteria with p.adj < 0.05 and∣logFC∣ ≥ 0.3, of which 834 genes were down-regulated and 1166 genes were up-regulated. And the top 50 downregulated and upregulated genes were presented in a heat map (Figure 4B). Next, we performed WGCNA based on the gene expression profile of 2000 DEGs. As shown in Figures 5A and B, we have chosen β = 5 to ensure a scale-free network and produce a hierarchical clustering tree with different modules. Then, three gene modules were identified by constructing the co-expression matrix (Figure 5C). As shown in Figure 5D, the brown module (p = 6.6e-7, r = −0.54), blue module (p = 1.1e-6, r = 0.53), and turquoise module (p = 1.1e-7, r = 0.57) showed significant correlation with BPD. Furthermore, we performed the Pearson’s correlation analysis between MM and GS in the blue module (Figure S1A, p = 3.6e-22, r = 0.47), brown module (Figure S1B, p = 7.6e-7, r = 0.45), and turquoise module (Figure S1C, p = 3.1e-34, r = 0.51).
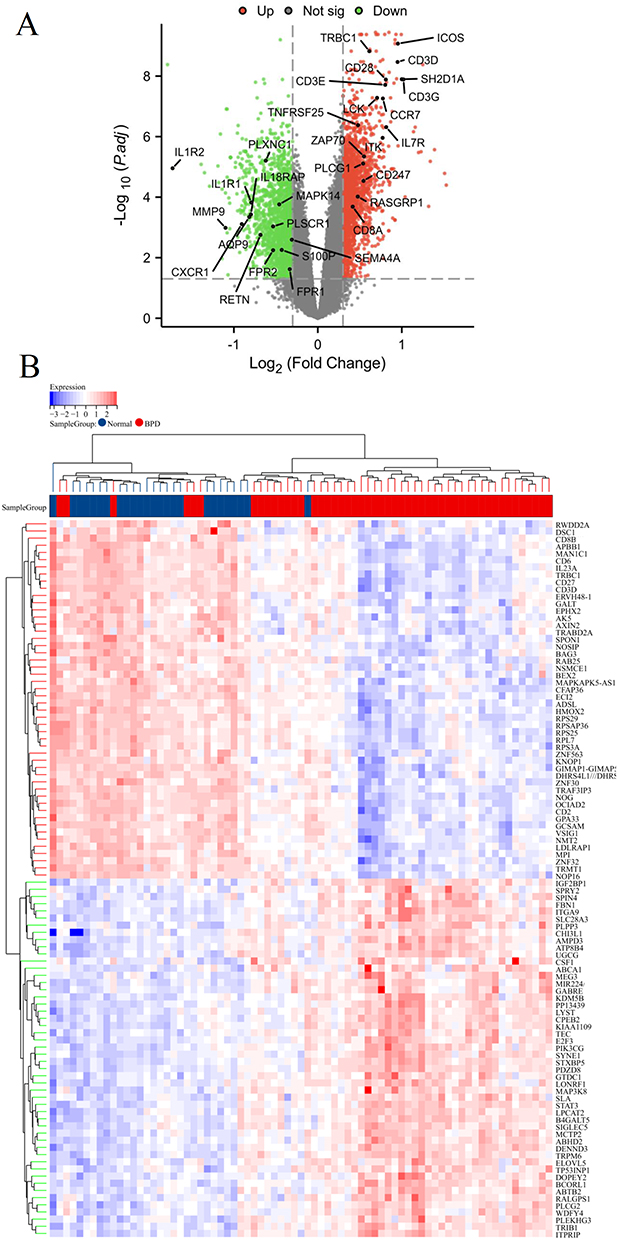 |
Figure 4 Identification of differentially expressed genes (DEGs) in BPD. Volcano plot (A) and heatmap (B) of DEGs between BPD and normal groups. |
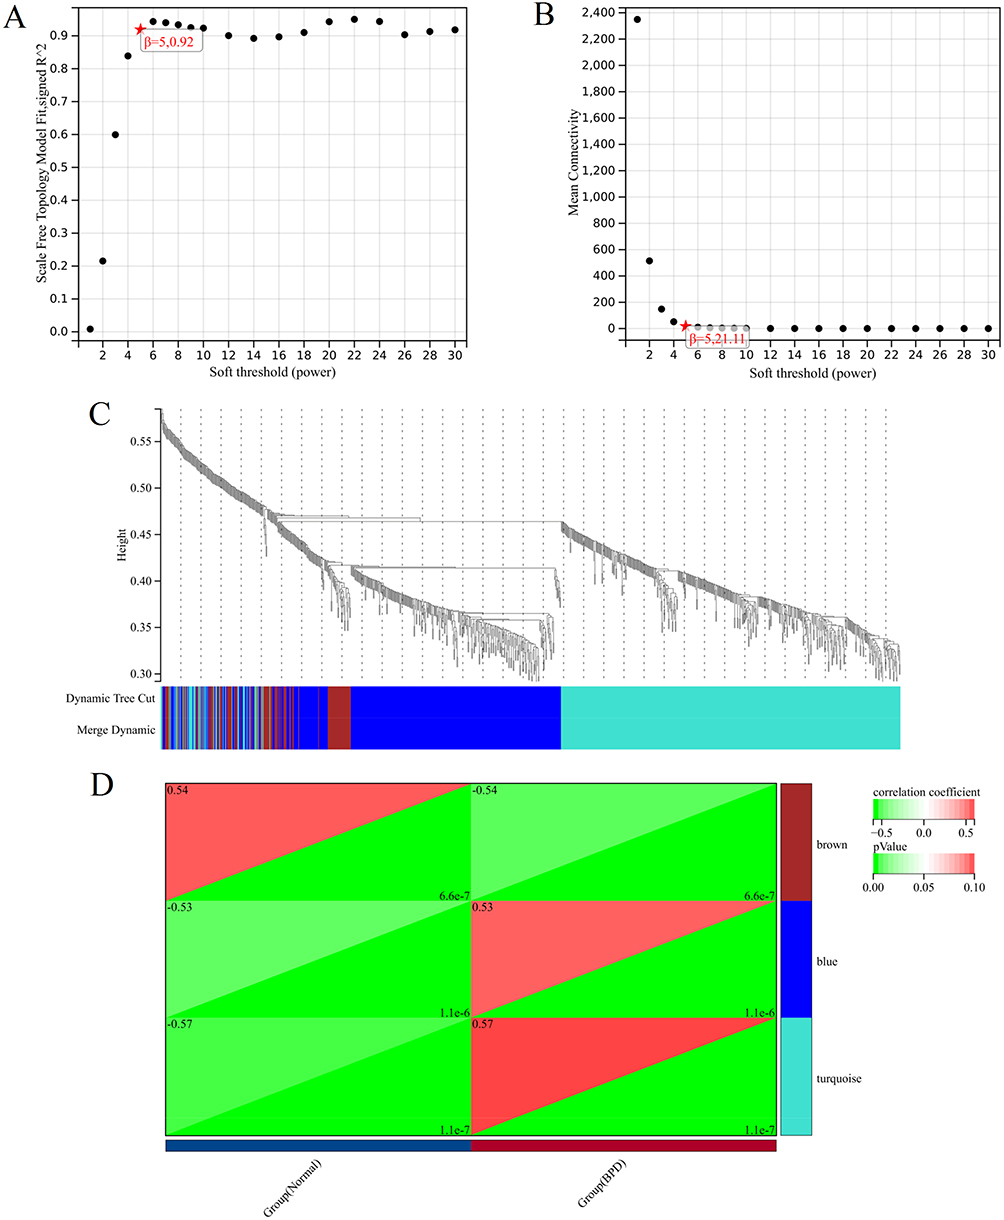 |
Figure 5 Construction of co-expression modules. (A) The y-axis represents the scale-free topology model fit, the x-axis represents the soft threshold. The red star indicates that β (5, 0.92) was chosen to construct co-expression modules. (B) The y-axis represents the mean connectivity, the x-axis represents the soft threshold. The red star indicates that β (5, 21.11) was chosen to construct co-expression modules. (C) Dendrogram of all genes clustered based on a dissimilarity measure. The different colours represent the different co-expression modules. (D) Heatmap of the module–trait relationships. The brown module (p = 6.6e-7, r = −0.54), blue module (p = 1.1e-6, r = 0.53), and turquoise module (p = 1.1e-7, r = 0.57) showed significant correlation with BPD. |
Functional Enrichment Analysis of Key Modules
To screen out immune-related modules, functional enrichment analysis was performed for each key module. Our results indicated that blue module genes were mainly enriched in cytoplasmic translation, ribonucleoprotein complex biogenesis, ribosome biogenesis, ribosome, EGFR tyrosine kinase inhibitor resistance, etc. (Figure 6A and Table S3). The brown module genes were mainly involved in cytoplasmic translation, aerobic respiration, oxidative phosphorylation, amyotrophic lateral sclerosis, Parkinson disease, etc. (Figure 6B and Table S4). The turquoise module genes were mainly enriched in lymphocyte differentiation, T cell differentiation, immune response-activating signal transduction, Th17 cell differentiation, T cell receptor signaling pathway, primary immunodeficiency, etc. (Figure 6C and Table S5). These findings revealed that immune-related pathways were mainly involved in the turquoise module. This module was, therefore, chosen for the subsequent analysis.
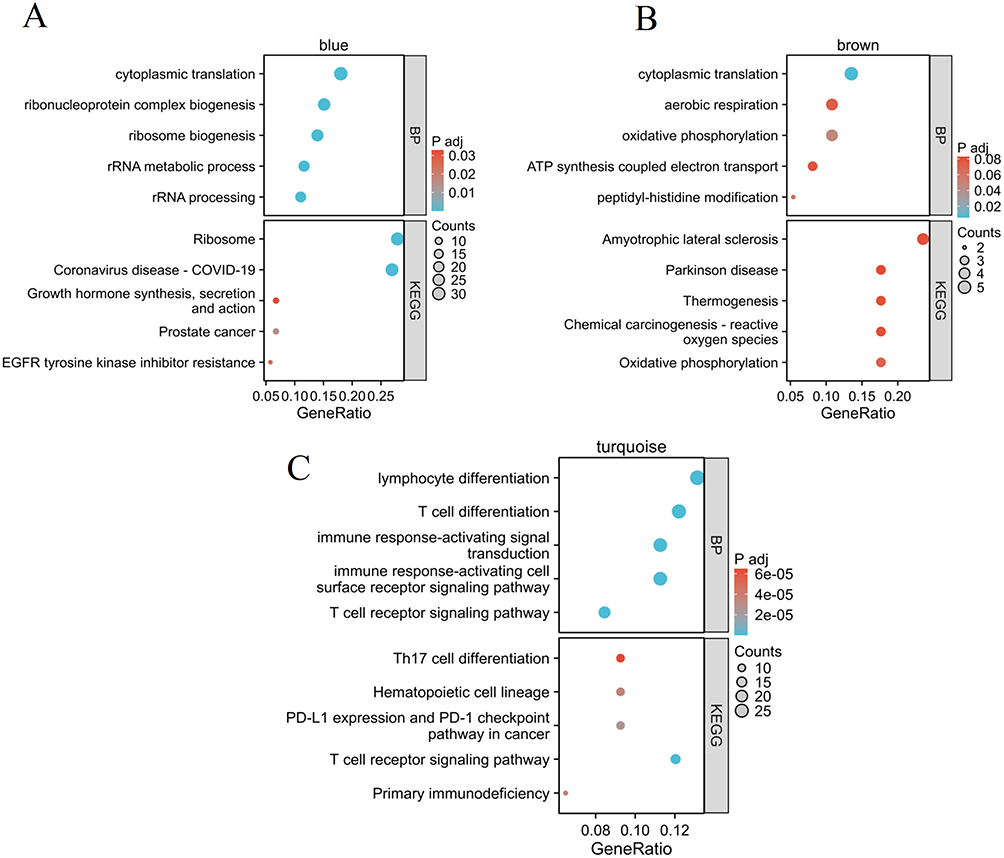 |
Figure 6 Enrichment analysis of blue (A), brown (B), and turquoise (C) module. |
Protein–Protein Interaction Network and Validation of Core DEIRGs
We intersected IRGs and the genes in the three immune-related module (turquoise), and 31 DEIRGs were identified (Figure 7A). Then, the PPI network of DEIRGs was constructed, and core DEIRGs (CD8A) with the highest degree were identified (Figure 7B). We found the expression of CD8A was significantly down-regulated in the BPD group compared to the normal group (Figure 7C). Additionally, the expression of CD8A was further verified in multiple datasets and in-house experiment. As presentation in Figures 7D–G, the CD8A was significantly down-regulated in BPD group in GSE32472 (p = 1.3e-06), GSE25286 (p = 4.4e-04), GSE25293 (p = 4.7e-03), GSE99633 (p = 0.03), and in-house experiment (p = 2.4e-11), these results of which were consistent with the bioinformatics analysis results in GSE32472 dataset.
 |
Figure 7 Protein–protein interaction network and core DEIRGs identification. (A) The intersection genes of turquoise module and IRGs. (B) Protein–protein interaction network of 31 DEIRGs. The darker the colour of the node, the more important it is in the network. Therefore, we chose the CD8A as the core gene. (C) CD8A expression level in GSE32472 dataset. (D–F) Validation of CD8A by external datasets (GSE25286, GSE25293 and GSE99633). (G) Validation of CD8A by in-house experiment. |
In addition, the diagnostic ability of CD8A in distinguishing BPD from the normal samples exhibited a good diagnostic value, with an AUC of 0.81 in GSE32472, AUC of 1 in GSE25286, AUC of 1 in GSE25293, AUC of 0.8 in GSE99633, and AUC of 1 in our in vivo experiment (Figure S2).
GSEA and Gene Set Variation Analysis (GSVA) Analyses Between CD8A-Related Subgroups
We divided the GSE32472 dataset into two subgroups based on the median expression level of CD8A, and the top 50 DEGs associated with CD8A expression level were presented in Figure S3. GSEA and GSVA analyses were performed to further investigate the potential functions regulated by CD8A in BPD. Based on GSEA results, regulation of exocytosis (ES = −0.4654, P = 0.002), regulation of myeloid leukocyte mediated immunity (ES = −0.5991, P = 0.006), interleukin 6 mediated signaling pathway (ES = −0.5901, P < 0.001), leukotriene metabolic process (ES = −0.6913, P < 0.001), leukocyte mediated immunity (ES = −0.5346, P = 0.0078), toll-like receptor 4 signaling pathway (ES = −0.6471, P = 0.0081), interleukin 6 production (ES = −0.5325, P = 0.0059), and exocytosis (ES = −0.5979, P < 0.001) were enriched in the CD8A-low subgroup (Figure 8A). Furthermore, the GSVA results showed that immune- and inflammation-related pathways were activated in CD8A-low subgroup, including the immune effector process (p < 0.05), T cell antigen processing and presentation (p < 0.01), negative regulation of myeloid cell differentiation (p < 0.001), regulation of macrophage-derived form cell differentiation (p < 0.01), myeloid cell homeostasis (p < 0.05), interleukin 6 mediated signaling pathway (p < 0.001), positive regulation of myeloid leukocyte mediated immunity (p < 0.05), etc. (Figure 8B). These findings suggested that CD8A may show significant impact on the progression of BPD via regulating immune functions.
 |
Figure 8 GSEA and GSVA analyses of CD8A in the BPD. (A) Single gene GSEA of CD8A. The gene sets with p-value < 0.05 were considered significantly enriched. (B) The histogram represented the results of GSVA between the two subgroups. *p < 0.05, **p < 0.01, and ***p < 0.001. |
Immune Infiltration Analysis of CD8A
Subsequently, CIBERSORT was used to compare the proportion of 22 immune cell types, and we found that B cells memory (p < 0.01), T cells CD8 (p < 0.001), T cells CD4 naïve (p < 0.001), and T cells CD4 memory resting (p < 0.01) were decreased, whereas macrophages M0 (p < 0.001) and neutrophils (p < 0.001) were increased in the CD8A-low subgroup compared to the CD8A-high subgroup (Figure 9A). MCPcounter was applied to assess the proportion of 10 immune cell types, and results showed that T cells (p < 0.001), CD8 T cells (p < 0.001), cytotoxic lymphocytes (p < 0.001), B lineage (p < 0.05), NK cells (p < 0.01), and myeloid dendritic cells (p < 0.05) were decreased, whereas neutrophils (p < 0.001) and endothelial cells (p < 0.01) were increased in the CD8A-low subgroup compared to the CD8A-high subgroup (Figure 9B). ESTIMATE analysis showed that the Stromal score (p < 0.05) was increased, whereas the Immune score (p < 0.001) was decreased in the CD8A-low subgroup compared to the CD8A-high subgroup (Figure 9C).
 |
Figure 9 Immune cell infiltration analysis. (A) CIBERSORT scores of 22 immune cell types between CD8A low and high groups. (B) MCPCounter scores of stromal cells or immune cells between CD8A low and high groups. (C) Stromalscore, Immunescore, and ESTIMATEScore between CD8A low and high groups. *p < 0.05, **p < 0.01, and ***p < 0.001. |
Furthermore, we carried out a Spearman correlation analysis of the CD8A expression in immune cells. CD8A was positively correlated with T cells CD8 (p = 0, r = 0.84), T cells CD4 memory resting (p = 0, r = 0.52), T cells CD4 naïve (p = 0.0005, r = 0.46), B cells memory (p < 0.001, r = 0.38), eosinophils (p = 0.02, r = 0.26), T cells CD4 memory activated (p = 0.03, r = 0.24), T cells (p = 0, r = 0.83), cytotoxic lymphocytes (p = 0, r = 0.58), NK cells (p = 0.0003, r = 0.4), B lineage (p = 0.004, r = 0.32), and myeloid dendritic cells (p = 0.004, r = 0.32). CD8A was negatively correlated with macrophages M0 (p = 0, r = −0.58), and neutrophils (p =, r = −0.73) (Figure 10). Therefore, CD8A was associated with immune cell infiltrations in BPD.
 |
Figure 10 Association of CD8A with immune infiltrates. Correlation analysis between immune cells and CD8A gene expression by using CIBERSORT (A) and MCPCounter (B) algorithms. Bold p values represent statistically significant differences. |
Discussion
BPD has been recognized as one of the most common respiratory problems due to the prematurity in infants,28 which remains to be a huge challenge in neonatal medicine. This longstanding complication has increased respiratory morbidity and also the incidence of neurological diseases, aggravating the financial burden of the family across the world.29 Despite mounting effort has been devoted to improving the survival rates, the prevalence of BPD has remained the same or even increased.30 To date, the pathogenesis of BPD is still not fully understood; novel and effective therapeutic strategies were still not available. Therefore, investigations about the underlying pathogenesis of BPD may provide the potential insights for early diagnosis and developing treatment strategies in the future. In the present study, we applied the bioinformatics approaches to investigate the differentially expressed immune-related genes and its immune infiltration in BPD. Three main findings were obtained from this study. Firstly, the results of GSEA and immune infiltration analysis indicated that immune-related pathways and immunocytes infiltrate were involved in the etiology of BPD. Second, a core biomarker (CD8A) for BPD was identified via a combination of DEG and WGCNA. Furthermore, CD8A expression was associated with immune cell infiltration in BPD, which may shed some light on the BPD immunotherapy.
CD8A is the gene encoding the CD8a chain of the dimeric CD8 protein, which is primarily responsible for cell-mediated immune defense and T-cell development.31,32 CD8A has been widely reported as a potential prognosis and diagnostic marker for several diseases, such as inflammatory disorders and tumors.33,34 The CD8A gene can also predict severity factors in chronic rhinosinusitis33 and can act as a diagnostic biomarker for rheumatoid arthritis.17 The expression of CD8A was significantly up-regulated in the early N stage and related to favorable overall survival in lung adenocarcinoma.34 A recent study has revealed that CD8A expression was down-regulated in a clinically relevant animal model of BPD.35 Consistently, we also observed that CD8A expression was decreased in BPD in our study.
Epigenetic and genomic results reported the significant immune dysfunction in a mouse model of BPD.8 Increasing evidence also indicated that the imbalance between pro- and anti-inflammatory factors would induce injuries to the pulmonary interstitium in BPD patients.36 Macrophages are important orchestrators of the pulmonary inflammatory and repair responses process, involving both the initiation and development of inflammation.37 However, the specific pattern of immune cell infiltration in BPD is still unclear. As a result, we performed a comprehensive assessment of BPD immune cell infiltration to further investigate the potential pathogenesis related to the immune dysfunction. Our findings showed that T cells, CD8 T cells, and myeloid dendritic cells were significantly lower in the BPD group than in the normal group, while neutrophils and macrophages M0 were significantly higher in the BPD group than in the normal group. This finding revealed that immune infiltration is highly associated with the development of BPD. Furthermore, by the immunocytes infiltrate analysis of groups with low and high expression of CD8A, we also found T cells, CD8 T cells, NK cells, and myeloid dendritic cells levels were decreased, while neutrophils and macrophages M0 levels were increased in CD8A-low subgroup. It has been demonstrated that T lymphocytes plays a crucial role in the pathogenesis and progression of chronic lung disorder in babies born prematurely.38 Emerging studies have suggested the CD8+ T cells may contribute to the immunopathology in BPD and may increase the risk of respiratory morbidity.39 Furthermore, the high neutrophil-to-lymphocyte ratio is an early predictor of severe BPD and also a biomarker for the preterm infants with intrauterine infections.40 The level of macrophage is significantly higher in the BPD patients.41 Macrophage activation is associated with IL-6/STAT3 axis in clinical and experimental BPD. Suppression of macrophage-associated IL-6 trans-signalling contributes to lung growth in experimental BPD.42 Dendritic cells are an integral component of lung development, and BPD pathology is significantly associated with dendritic cell recruitment in the lung tissue.43 Neutrophils count may be a risk factor for the development of new BPD in neonates.44 Thus, our findings are consistent with previous studies and reveal the importance of immune cell infiltration in the pathogenesis of BPD based on bioinformatics analysis. Considering all the results discussed above, we argued that CD8A is accountable for the development of BPD via the regulation of T cells, CD8 T cells, macrophages M0, neutrophils, and myeloid dendritic cells.
To our knowledge, this is the first study to characterize the immune infiltration landscape of BPD and investigate the role of CD8A in BPD; however, several limitations should be noted. First, since the validation set is not a human-related dataset and the sample size is limited, the expression of the core gene needs to be further validated in clinical samples with more participants engaged. Second, more experiments are necessary to further examine the interactions between immune cells and CD8A expression in BPD.
Conclusion
Our study not only provides a novel insight into the landscape of immune cells infiltrate associated with BPD etiology but also screened potential diagnostic marker for BPD. CD8A was down-regulated in hyperoxia-induced BPD, and it was associated with specific immune cell infiltrates in BPD. CD8A may involve in the development of BPD via regulation of immune functions. Our findings provided researchers and clinicians more evidence with immunotherapeutic strategies in the treatment of BPD.
Data Sharing Statement
All data in the present study can be obtained from the corresponding author upon reasonable request.
Ethical Approval
The animal experiment was approved by the Animal Ethics Committee of West China Second University Hospital (NO. 2022KX016). All experimental procedures were performed based on the Guide for the Care and Use of Laboratory Animals published by the National Institutes of Health (NIH Publications No. 8023, revised 1978).
Disclosure
All authors declared that they have no competing interests.
References
1. Carpenter TC, Stenmark KR. Predisposition of infants with chronic lung disease to respiratory syncytial virus-induced respiratory failure: a vascular hypothesis. Pediatr Infect Dis J. 2004;23(1 Suppl):S33–S40. doi:10.1097/01.inf.0000108191.13799.09
2. Miller EK, Bugna J, Libster R, et al. Human rhinoviruses in severe respiratory disease in very low birth weight infants. Pediatrics. 2012;129(1):e60–e67. doi:10.1542/peds.2011-0583
3. Um-Bergström P, Pourbazargan M, Brundin B, et al. Increased cytotoxic T-cells in the airways of adults with former bronchopulmonary dysplasia. Eur Respir J. 2022;60(3):2102531. doi:10.1183/13993003.02531-2021
4. Doyle LW, Carse E, Adams AM, Ranganathan S, Opie G, Cheong JLY. Ventilation in extremely preterm infants and respiratory function at 8 years. N Engl J Med. 2017;377(4):329–337. doi:10.1056/NEJMoa1700827
5. Jobe AH, Bancalari E. Bronchopulmonary dysplasia. Am J Respir Crit Care Med. 2001;163(7):1723–1729. doi:10.1164/ajrccm.163.7.2011060
6. Abman SH, Bancalari E, Jobe A. The evolution of bronchopulmonary dysplasia after 50 years. Am J Respir Crit Care Med. 2017;195(4):421–424. doi:10.1164/rccm.201611-2386ED
7. Heydarian M, Schulz C, Stoeger T, Hilgendorff A. Association of immune cell recruitment and BPD development. Mol Cell Pediatr. 2022;9(1):16. doi:10.1186/s40348-022-00148-w
8. Revhaug C, Bik-Multanowski M, Zasada M, et al. Immune system regulation affected by a murine experimental model of bronchopulmonary dysplasia: genomic and epigenetic findings. Neonatology. 2019;116(3):269–277. doi:10.1159/000501461
9. D’Angio CT, Johnston CJ, Wright TW, Reed CK, Finkelstein JN. Chemokine mRNA alterations in newborn and adult mouse lung during acute hyperoxia. Exp Lung Res. 1998;24(5):685–702. doi:10.3109/01902149809099588
10. Willis GR, Fernandez-Gonzalez A, Anastas J, et al. Mesenchymal stromal cell exosomes ameliorate experimental bronchopulmonary dysplasia and restore lung function through macrophage immunomodulation. Am J Respir Crit Care Med. 2018;197(1):104–116. doi:10.1164/rccm.201705-0925OC
11. Bhattacharya S, Mereness JA, Baran AM, et al. Lymphocyte-specific biomarkers associated with preterm birth and bronchopulmonary dysplasia. Front Immunol. 2020;11:563473. doi:10.3389/fimmu.2020.563473
12. Yan W, Jiang M, Zheng J. Identification of key pathways and differentially expressed genes in bronchopulmonary dysplasia using bioinformatics analysis. Biotechnol Lett. 2020;42(12):2569–2580. doi:10.1007/s10529-020-02986-y
13. Carrera P, Di Resta C, Volonteri C, et al. Exome sequencing and pathway analysis for identification of genetic variability relevant for bronchopulmonary dysplasia (BPD) in preterm newborns: a pilot study. Clin Chim Acta. 2015;451(Pt A):39–45. doi:10.1016/j.cca.2015.01.001
14. Liu W, Su Y, Li S, et al. Weighted gene coexpression network reveals downregulation of genes in bronchopulmonary dysplasia. Pediatr Pulmonol. 2021;56(2):392–399. doi:10.1002/ppul.25141
15. Kawada JI, Takeuchi S, Imai H, et al. Immune cell infiltration landscapes in pediatric acute myocarditis analyzed by CIBERSORT. J Cardiol. 2021;77(2):174–178. doi:10.1016/j.jjcc.2020.08.004
16. Wang L, Yang Z, Cao Y. Regulatory T cell and activated natural killer cell infiltration in hepatocellular carcinoma: immune cell profiling using the CIBERSORT. Ann Translat Med. 2020;8(22):1483. doi:10.21037/atm-20-5830
17. Zhou S, Lu H, Xiong M. Identifying immune cell infiltration and effective diagnostic biomarkers in rheumatoid arthritis by bioinformatics analysis. Front Immunol. 2021;12:726747. doi:10.3389/fimmu.2021.726747
18. Tan L, Xu Q, Shi R, Zhang G. Bioinformatics analysis reveals the landscape of immune cell infiltration and immune-related pathways participating in the progression of carotid atherosclerotic plaques. Artif Cells Nanomed Biotechnol. 2021;49(1):96–107. doi:10.1080/21691401.2021.1873798
19. Gong X, Wang W. Profiles of innate immune cell infiltration and related core genes in psoriasis. Biomed Res Int. 2021;2021:6656622. doi:10.1155/2021/6656622
20. Xiu MX, Liu YM, Chen GY, Hu C, Kuang BH. Identifying hub genes, key pathways and immune cell infiltration characteristics in pediatric and adult ulcerative colitis by integrated bioinformatic analysis. Dig Dis Sci. 2021;66(9):3002–3014. doi:10.1007/s10620-020-06611-w
21. Irizarry RA, Bolstad BM, Collin F, Cope LM, Hobbs B, Speed TP. Summaries of Affymetrix GeneChip probe level data. Nucleic Acids Res. 2003;31(4):e15. doi:10.1093/nar/gng015
22. Leek JT, Johnson WE, Parker HS, Jaffe AE, Storey JD. The sva package for removing batch effects and other unwanted variation in high-throughput experiments. Bioinformatics. 2012;28(6):882–883. doi:10.1093/bioinformatics/bts034
23. Liu S, Xie X, Lei H, Zou B, Xie L. Identification of key circRNAs/lncRNAs/miRNAs/mRNAs and pathways in preeclampsia using bioinformatics analysis. Med Sci Monit. 2019;25:1679–1693. doi:10.12659/MSM.912801
24. Wu T, Hu E, Xu S, et al. clusterProfiler 4.0: a universal enrichment tool for interpreting omics data. Innovation. 2021;2(3):100141. doi:10.1016/j.xinn.2021.100141
25. Langfelder P, Horvath S. WGCNA: an R package for weighted correlation network analysis. BMC Bioinform. 2008;9:559. doi:10.1186/1471-2105-9-559
26. Yu G, Wang LG, Han Y, He QY. clusterProfiler: an R package for comparing biological themes among gene clusters. Omics. 2012;16(5):284–287. doi:10.1089/omi.2011.0118
27. Li Z, Chen Y, Li W, Yan F. Cell division cycle 2 protects neonatal rats against hyperoxia-induced bronchopulmonary dysplasia. Yonsei Med J. 2020;61(8):679–688. doi:10.3349/ymj.2020.61.8.679
28. Tracy MK, Berkelhamer SK. Bronchopulmonary dysplasia and pulmonary outcomes of prematurity. Pediatr Ann. 2019;48(4):e148–e153. doi:10.3928/19382359-20190325-03
29. Gilfillan M, Bhandari A, Bhandari V. Diagnosis and management of bronchopulmonary dysplasia. BMJ. 2021;375:n1974. doi:10.1136/bmj.n1974
30. Lui K, Lee SK, Kusuda S, et al. Trends in outcomes for neonates born very preterm and very low birth weight in 11 high-income countries. J Pediatr. 2019;215:32–40.e14. doi:10.1016/j.jpeds.2019.08.020
31. Xu Q, Chen Y, Zhao WM, et al. DNA methylation and regulation of the CD8A after duck hepatitis virus type 1 infection. PLoS One. 2014;9(2):e88023. doi:10.1371/journal.pone.0088023
32. Tregaskes CA, Kong FK, Paramithiotis E, et al. Identification and analysis of the expression of CD8 alpha beta and CD8 alpha alpha isoforms in chickens reveals a major TCR-gamma delta CD8 alpha beta subset of intestinal intraepithelial lymphocytes. J Immunol. 1995;154(9):4485–4494. doi:10.4049/jimmunol.154.9.4485
33. Alromaih S, Mfuna-Endam L, Bosse Y, Filali-Mouhim A, Desrosiers M. CD8A gene polymorphisms predict severity factors in chronic rhinosinusitis. Int Forum Allergy Rhinol. 2013;3(8):605–611. doi:10.1002/alr.21174
34. Ma K, Qiao Y, Wang H, Wang S. Comparative expression analysis of PD-1, PD-L1, and CD8A in lung adenocarcinoma. Ann Translat Med. 2020;8(22):1478. doi:10.21037/atm-20-6486
35. Shrestha D, Ye GX, Stabley D, et al. Pulmonary immune cell transcriptome changes in double-hit model of BPD induced by chorioamnionitis and postnatal hyperoxia. Pediatr Res. 2021;90(3):565–575. doi:10.1038/s41390-020-01319-z
36. Speer CP. Pulmonary inflammation and bronchopulmonary dysplasia. J Perinatol. 2006;26(Suppl 1):S57-S62; discussion S63–S64. doi:10.1038/sj.jp.7211476
37. Johnston LK, Rims CR, Gill SE, McGuire JK, Manicone AM. Pulmonary macrophage subpopulations in the induction and resolution of acute lung injury. Am J Respir Cell Mol Biol. 2012;47(4):417–426. doi:10.1165/rcmb.2012-0090OC
38. Toldi G, Hummler H, Pillay T. T lymphocytes, multi-omic interactions and bronchopulmonary dysplasia. Front Pediatr. 2021;9:694034. doi:10.3389/fped.2021.694034
39. Scheible KM, Emo J, Laniewski N, et al. T cell developmental arrest in former premature infants increases risk of respiratory morbidity later in infancy. JCI Insight. 2018;3(4). doi:10.1172/jci.insight.96724
40. Sun Y, Chen C, Zhang X, et al. High neutrophil-to-lymphocyte ratio is an early predictor of bronchopulmonary dysplasia. Front Pediatr. 2019;7:464. doi:10.3389/fped.2019.00464
41. Jacobson JD, Truog WE, Benjamin DR. Increased expression of human leukocyte antigen-DR on pulmonary macrophages in bronchopulmonary dysplasia. Pediatr Res. 1993;34(3):341–344. doi:10.1203/00006450-199309000-00020
42. Hirani D, Alvira CM, Danopoulos S, et al. Macrophage-derived IL-6 trans-signalling as a novel target in the pathogenesis of bronchopulmonary dysplasia. Eur Respir J. 2022;59(2). doi:10.1183/13993003.02248-2020
43. De Paepe ME, Hanley LC, Lacourse Z, Pasquariello T, Mao Q. Pulmonary dendritic cells in lungs of preterm infants: neglected participants in bronchopulmonary dysplasia? Pediatr Dev Pathol. 2011;14(1):20–27. doi:10.2350/09-09-0709-OA.1
44. Kim BI, Lee HE, Choi CW, et al. Increase in cord blood soluble E-selectin and tracheal aspirate neutrophils at birth and the development of new bronchopulmonary dysplasia. J Perinat Med. 2004;32(3):282–287. doi:10.1515/JPM.2004.053
 © 2023 The Author(s). This work is published and licensed by Dove Medical Press Limited. The
full terms of this license are available at https://www.dovepress.com/terms
and incorporate the Creative Commons Attribution
- Non Commercial (unported, 3.0) License.
By accessing the work you hereby accept the Terms. Non-commercial uses of the work are permitted
without any further permission from Dove Medical Press Limited, provided the work is properly
attributed. For permission for commercial use of this work, please see paragraphs 4.2 and 5 of our Terms.
© 2023 The Author(s). This work is published and licensed by Dove Medical Press Limited. The
full terms of this license are available at https://www.dovepress.com/terms
and incorporate the Creative Commons Attribution
- Non Commercial (unported, 3.0) License.
By accessing the work you hereby accept the Terms. Non-commercial uses of the work are permitted
without any further permission from Dove Medical Press Limited, provided the work is properly
attributed. For permission for commercial use of this work, please see paragraphs 4.2 and 5 of our Terms.
Recommended articles
Vitamin D Ameliorates Apoptosis and Inflammation by Targeting the Mitochondrial and MEK1/2-ERK1/2 Pathways in Hyperoxia-Induced Bronchopulmonary Dysplasia
Hu J, Wu Z, Wang H, Geng H, Huo J, Zhu X, Zhu X
Journal of Inflammation Research 2022, 15:4891-4906
Published Date: 25 August 2022
The Value of Cord Blood CXCL10 and MMP8 as Biomarkers in Predicting Bronchopulmonary Dysplasia- A Retrospective Cohort Study
He X, Qie X, Ma H, Li W, Li J, He X
International Journal of General Medicine 2026, 19:560178
Published Date: 3 March 2026