")
Back to Journals » Cancer Management and Research » Volume 10
CD24 expression and stem-associated features define tumor cell heterogeneity and tumorigenic capacities in a model of carcinogenesis
Authors Ortiz-Montero P, Liu-Bordes WY, Londoño-Vallejo A , Vernot JP
Received 8 June 2018
Accepted for publication 20 July 2018
Published 16 November 2018 Volume 2018:10 Pages 5767—5784
DOI https://doi.org/10.2147/CMAR.S176654
Checked for plagiarism Yes
Review by Single anonymous peer review
Peer reviewer comments 2
Editor who approved publication: Dr Beicheng Sun
Paola Ortiz-Montero,1 Win-Yan Liu-Bordes,2 Arturo Londoño-Vallejo,2 Jean-Paul Vernot1,3
1Cellular and Molecular Physiology Group, Faculty of Medicine, Department of Physiological Sciences, National University of Colombia, Bogotá, Colombia; 2Institut Curie, PSL Research University, Sorbonne University, CNRS UMR3244 Telomere and Cancer Lab, Paris, France; 3Biomedical Research Institute, Faculty of Medicine, National University of Colombia, Bogotá, Colombia
Background: Most carcinomas are composed of heterogeneous populations of tumor cells with distinct and apparently stable phenotypic characteristics.
Methods: Using an in vitro model of carcinogenesis we aimed at experimentally elucidating the significance of heterogeneity in the expression of CD24, a marker frequently overexpressed in various cancers and correlated with poor prognosis.
Results: We show that CD24Neg and CD24Pos cells issued from the same tumorigenic cell line display striking differences in stem-related properties, expression of epithelial–mesenchymal transition/mesenchymal-epithelial transition markers, and tumorigenic capacity. Indeed, while CD24Neg cells were as tumorigenic as the parental cell line, CD24Pos cells, although unable to form tumors, were unexpectedly more mesenchymal, displayed enhanced stemness-related properties, and expressed a proinflammatory signature.
Conclusion: Our findings support the view that acquisition of stem-like cell, CD24-associated, attributes like migration, invasion, and plasticity by a tumor subpopulation is not necessarily related to local tumor growth but may be required for escaping the niche and colonizing distant sites.
Keywords: cancer stem cells, CD24, HEK cells, stemness, tumorigenicity
Introduction
Cancers of epithelial origin are the most frequent type of malignancy in humans and their frequency augments exponentially with age.1 Most tumors are composed of heterogeneous populations of cells that differ in their genetic lesions, cellular morphology, differentiation state, proliferation capacity, and therapeutic response. It has been suggested that tumors are “abnormal organs” sustained by a population of cancer stem cells (CSC), endowed with the ability to self-renew and with multipotent differentiation capacity to yield a heterogeneous cell progeny.2 CSC have been identified in various types of cancers by discrete surface marker expression (CD44, CD133, CD105, aldehyde dehydrogenase [ALDH], EpCAM) and by their ability to generate spheres in vitro and xenograft tumors in vivo.3–6 Interestingly, it has been shown that, through a reverse process, more differentiated progenitor cells can switch to CSC.7,8 Different mechanisms have been proposed to explain this dynamic phenotypic interconversion or cell plasticity, including spontaneous conversion,7,9 inducers of epithelial–mesenchymal transition (EMT),10,11 or inflammatory or senescent processes,12–14 among others.
We have shown that post-crisis premalignant human embryonic kidney (HEK) cells have the potential to become fully tumorigenic, in immunocompromised mice, exclusively in the presence of a senescent microenvironment.12 Explanted cells isolated from these tumors display enhanced stem-like cell properties and autonomous tumorigenic potential, that is, in the absence of a senescent microenvironment. Phenotypic analysis showed that explanted cells result from EMT cells that have undergone incomplete or partial MET process,12 with population cells expressing both epithelial and mesenchymal markers (hybrid phenotype),15,16 and variable levels of CD24. Whereas two of the explanted cell lines were clearly either CD24+ or CD24, one particular cell line (PC1-Expl-1) showed a heterogeneous expression of CD24.12
Early work has shown an important role of CD24 in the tumorigenesis and progression of different types of cancers, including renal cell carcinoma (RCC),17 nasopharyngeal cancer,18 hepatocellular carcinoma,19 ovarian cancer,20 NSCLC,21 breast cancer,22 pancreatic carcinomas,23 and others. This mucin-like cell surface protein24 is broadly overexpressed in many types of tumor tissues and has been useful as a diagnostic and prognostic marker in many types of cancers20,22,25–34 including very common ones, but also less frequent ones, such as the clear cell RCC.24,35,36 On the other hand, some human CSC showed decreased CD24 expression compared to their progeny.37,38 Indeed, low CD24 expression has been associated with breast3,38 and colorectal37 cancer. In combination with high CD44 expression, downregulation of CD24 has been associated with CSC and tumorigenesis in breast cancer.10,11 At the same time, also in breast cancer, CD24 overexpression was significantly correlated with the presence of lymph node metastasis and more advanced pathologic stages.39
At the experimental level, it has been shown that CD24 expression induces increased cell proliferation, migration, and invasion, warranting rapid tumor cell spreading,40 properties fostered by the EMT program (partial or complete) and stemness capabilities.39,41,42 Also, work with different types of cancer cell lines has shown that CD24 was able to promote tumor cell proliferation and invasion.41,43
It is likely that the role of CD24 in the acquisition of stem-like cell properties and tumorigenic capacity is context-dependent (type of cancer, cell of origin, state of cancer development, environmental cues, and so on). Therefore, it would be important to associate its expression or lack of expression with the acquisition of particular cell functions responsible for either tumor initiation capacity, tumor progression, or metastasis. To do this, we have isolated and characterized CD24-positive (CD44+CD24Pos) and -negative (CD44+CD24Neg) cells from the tumorigenic PC1-Expl-1 HEK cell line. Our results suggest that a full stemness program is not necessary for tumor initiation.
Materials and methods
Cell lines and culture conditions
HEK cells were established in Silvia Bacchetti’s laboratory (Department of Pathology, McMaster University) in 1990 and reported for the first time in 1992;44 these cells were transferred to the Londono lab for a collaborative work in 2001 and the transfer was covered by an institutional material transfer agreement.45 The “Explanted” cell lines were established in the Londono lab by putting in culture flasks tissue slices obtained from the tumors formed by PC1 and PC2 in immunocompromised mice as previously described.12 CD44+CD24Pos and CD44+CD24Neg cells were separated from the PC1-Expl-1 by fluorescence-activated cell sorting (FACS). Cells were negative for mycoplasma DNA contamination as we evaluated by PCR (Mycoplasma Check: Mycoplasma Detection at GATC Biotech). Cells were maintained under standard culture conditions in a humidified 5%, CO2 atmosphere at 37°C in modified Eagle’s culture media supplemented with 10% FBS, essential amino acids, and sodium pyruvate as described previously.12 The use of these cell lines was approved by the Ethics committees of the participating institutions.
Flow cytometry analysis and cell sorting
Cells (106) were harvested after trypsinization, washed and suspended in 500 µL PBS 1× containing 0.5% BSA. Cells were stained with fluorescein isothiocyanate-conjugated mouse anti-human CD44, R-Phycoerythrin-conjugated mouse anti-human CD24 (both from Invitrogen), APC-conjugated mouse anti-human EpCAM (CD326) (Miltenyi Biotec), or APC-conjugated mouse anti-human CD105 (Miltenyi Biotec) monoclonal antibodies. Cells incubated without antibody were used as a blank. The different antibodies were incubated for 45 minutes and washed to remove the excess of antibodies. The cytometric analysis and cell sorting were carried out using a FACS Aria-II flow cytometer (BD Biosciences, San Jose, CA, USA). Cells were kept in sterile conditions during cell sorting and the purity of each sorted population was tested after each sort by rerunning the sorted population. After sorting, cells were checked under an inverted microscope and were kept under standard culture conditions. The Flow Jo software was used for data acquisition and analysis, using measurements from 10,000 cells in each experiment.
ALDH activity determination
ALDH activity was determined using an ALDEFLUOR assay kit (Stem Cell Technologies) according to the manufacturer’s protocol. Briefly, 106 cells were stained with bodipy-aminoacetaldehyde (BAAA) and incubated for 30 minutes at 37°C. A specific inhibitor of ALDH1, diethylamino-benzaldehyde (DEAB), was used to control background fluorescence. The stained cells were analyzed using the FACS Aria II (BD Biosciences). The data were analyzed using the Flow Jo software program.
Cell proliferation determination
Cells were seeded in triplicates into 16 mm-diameter wells at a density of 5,000 cells per well in 0.5% FBS MEMα medium and allowed to attach for 24 hours. At daily intervals and for 5 consecutive days, cells were harvested from the monolayer after trypsinization and counted using a Neubauer chamber.
Cell migration and invasion assays
Cells were grown to 70%–80% confluence, and then serum starved overnight before setting up the experiments. Cells were washed twice with PBS 1×, harvested after trypsinization, and collected and suspended in starvation medium. For “wound healing” assays, cells were seeded in triplicates, grown to confluence, and scratched with a p10 pipette tip making a straight scratch, simulating a wound. Images were captured at 0, 6, and 12 hours. At least ten images at each time point were used for analysis and the percentage of invaded area was estimated by using Image J program. For transwell migration assays, filters (8.0 µm pore size) and 24-well transwell chambers (BD Biosciences) were used. Chambers were rinsed with culture medium without serum 1 hour before the assay. The cells were plated in triplicates in the upper wells at a density of 1 × 10⁵ per well in 0.1 mL of culture medium.Chemotaxis was induced using medium with 20% FBS on the bottom side of the chambers. Cells were allowed to migrate for a period of 48 hours at 37°C and 5% CO2 atmosphere, after which the experiment was stopped by wiping the cells from the upper side of the chamber with cotton swabs and fixed immediately with methanol 15 minutes and then stained with 0.5% of Crystal violet in water for 15 minutes. A total of ten images were taken for quantification using an inverted microscope. The invasion assay was identical to the above migration assay except that filters were coated with 100 µL of matrigel (BD Biosciences), diluted one-third in medium without serum. The experiment was stopped after 48 hours as described above.
Cell adhesion assay
Fibronectin at 20 µg/mL (Invitrogen) was added to 96-well plates and incubated for 2 hours at 37°C and 5% CO2 atmosphere; then the solution was removed, and the wells were washed with PBS 1× and incubated during 1 hour with the blocking solution (0.5% of BSA in medium) in order to block any unspecific binding. To each well 4 × 10⁴ cells were added in triplicates. Plates were then cultured for 40 minutes at 37°C and 5% CO2 atmosphere. Subsequently, the unbound cells were removed from the wells by gentle aspiration and carefully washed three times with PBS 1× and the remaining cells were stained with Crystal violet, as described above. The adherent cells were counted using an inverted microscope. The Cristal violet was dissolved with PBS having 2% SDS and the absorbance was read at 550 nm.
Human inflammatory cytokine assay
The amount of human proinflammatory cytokines (IL1β, tumor necrosis factor alpha, IL12-p70, IL6, IL8, and IL10) present in cell supernatants from CD44+CD24Neg and CD44+CD24Pos cells was determined using a human inflammatory cytokine kit (BD™ Cytometric Bead Array following the manufacturer’s instructions. A FACScan flow cytometer (BD) was used for the data acquisition and the FCAP Array Software with BD FACSArray Bioanalyzer-BD Biosciences for the analysis.
Human cytokine array
Cell supernatants were collected and analyzed for the expression of 40 cytokines using a human cytokine detection kit (# ARY005B, R&D Systems). The blot was performed according to the manufacturer’s instructions and imaged using standard enhanced chemiluminesence-based detection and autoradiography. Each dot represents a specific protein expression.
qRT-PCR
RNA was extracted using the Trizol/chloroform method (Invitrogen) according to the manufacturer’s instructions. The concentration of total RNA was measured by an ND-1000 NanoDrop spectrophotometer and 1 µg of RNA was treated with DNAse I (Invitrogen) and used for the reverse transcription using the high-capacity cDNA reverse transcription kit (Applied Biosystems). The resulting cDNA was assessed by qRT-PCR using Power Syber Green Master Mix (Applied Biosystems). The volume of each reaction was 25 µL. Measurements were done in a 7500 Real Time PCR system. For each sample, qRT-PCR reactions were done in triplicate, and the entire analysis was done twice independently. The average Ct-value for the endogenous control (glyceraldehyde 3-phosphate dehydrogenase) was calculated for each sample. To calculate the relative expression of the gene of interest the delta-delta Ct-method was used.46 The sequence of the primers used is provided in Table S1.
Mammosphere-forming assay
Mammosphere assays were performed as described by Dontu,47 using 5 × 10³ cells/six-well ultralow attachment plates (Nalge Nunc International). Cells were seeded in triplicates in serum-free DMEM/F12 (1:1) medium supplemented with 20 ng/mL basic-fibroblast growth factor (Gibco; Ref. PHG0266), 20 ng/mL epidermal growth factor (Gibco; Ref. PHG0315), ITS (insulin+ transferrin + selenium, Sigma), B27 supplement (GIBCO), and 1% methylcellulose. Fresh medium was added to each well every 2 days (without removing the old medium). Cells were grown in these conditions as nonadherent spheres during 9 days, after which the spheres >100 µm were counted. Medium without growth factors was used as a control (without induction).
Multipotent cell differentiation assay
Differentiation assays were performed as previously described.48 For adipogenic differentiation we used incomplete medium MEMα (Sigma-Aldrich) supplemented with 10% FBS, 1 mM dexamethasone (Sigma), 0.5 mM isobutylmethylxanthine (Sigma), 200 µM indomethacin (Sigma-Aldrich), and 10 µg/mL insulin (Sigma-Aldrich). Adipocytes were stained with Oil Red-O solution. Osteogenic differentiation was induced with incomplete medium MEMα, supplemented with 10% FBS, 100 nM dexamethasone, 0.2 mM ascorbic-2-phosphate (Sigma-Aldrich), and 10 mM β-glycerophosphate (Sigma-Aldrich). Cells were assessed for alkaline phosphatase (ALP) activity using an ALP staining kit (Chemicon International, SCR004) following the manufacturer’s instructions. For chondrogenic differentiation, 5 × 10⁴ cells were plated in a 24-well plate and cultured in chondrogenic induction medium, containing MEMα and 10 ng/mL TGF-β1 (Sigma-Aldrich). Chondrocytes were stained with 0.1% Safranin O. Cells were observed with an inverted microscope.
Immunohistochemistry
Biopsies from tumors derived from mouse injected with PC1-Expl-1, CD44+CD24Neg, and Mix cells were evaluated for all premalignant and malignant lesions using routine H&E staining and E-cadherin, EMA, Vimentin, alpha-smooth muscle actin (αSMA), and PAX8 by immunostaining according to the manufacturer’s instructions.
Western blot
Cells were harvested at 75% confluence and lysed in RIPA buffer with protease (Roche) and phosphatase inhibitors. Protein quantifications were performed using the Pierce BCA Protein Assay kit (Thermo scientific), and 40 µg of protein was analyzed in 10% SDS-PAGE and electrotransferred on polyvinylidene difluoride membranes (Millipore Corp., Bedford, MA, USA). The PageRuler Plus Prestained Protein marker (Thermo Scientific) was used as ladder. Transfer was performed for 30 minutes at 15 V in a semidry system. Blocking was performed with 5% BSA for 1–2 hours at room temperature and primary antibodies were incubated at 4°C overnight. Detection was performed using the 5-bromo-4-chloro-3-indolyl phosphate/nitro blue tetrazolium kit (Promega). The following antibodies were used: mouse monoclonal E-cadherin (BD Biosciences; Ref. 610182) dilution 1:5000; mouse monoclonal Beta-actin (Santa Cruz Biotechnology; Ref. sc-47778) dilution 1:30,000, rabbit polyclonal (zinc finger E-box binding home box 1 [ZEB1]) (Abcam; Ref. ab64098) dilution 1:500; mouse monoclonal Vimentin (Sigma; Ref. V5255) dilution 1:1000; rabbit polyclonal Twist1 (Sigma; Ref: T6451) rabbit polyclonal nuclear factor kappa B (NF-κB) (Abcam; Ref: ab16502) dilution 1:500; rabbit polyclonal NF-κB phosphoS536 (Abcam; Ref: ab86299) dilution 1:500; mouse anti-STAT3 (Sigma; Ref: SAB1404414) dilution 1:1,000 and rabbit polyclonal STAT3 phosphoTyr705 (Sigma; Ref: SAB4504541) dilution 1:1,000.
Colony formation assay
Cells were cultured in MEM with 10% FBS. Cells were then plated at a density of 500 cells per well in six-well plates and allowed to adhere overnight at 37°C, 5% CO2 atmosphere. Cells were allowed to grow ~10–12 days. Colonies were then stained with 0.5% Crystal violet in 20% methanol for 30 minutes and washed.
Tumorigenicity assays
Sorted cell lines were expanded and then harvested by trypsinization for 5–10 minutes at 37°C in an incubator. Cells were washed with PBS 1×, centrifuged for 5 minutes at 800 g, suspended in the culture medium without serum, and kept on ice until use. For subcutaneous injections in the flanks of severe combined immunodeficiency (SCID) mice (five mice per group; female; 6–8-week-old), 0.2 mL of a cell suspension containing 5 × 10⁵ cells was used. For coinjection experiments, a suspension containing 2.5 × 10⁵ of both cells was used. Animals were purchased from Charles River, Germany and were kept under specific pathogen-free environment conditions and inspected for tumor growth at least twice a week for at least 3 months. The tumor volume was calculated using the formula: tumor volume [mm3] = (length [mm]) × (width [mm2]) × 0.52. Animals were killed at the end of the observation period or when tumors reached a volume of 1.200 mm3. Institutional and National guidelines for the care and use of animals were followed. The institutional ethics committee board (CEEA-IC) approved all the protocols. Animal care and use for this study were performed in accordance with the recommendations of the European Community (2010/63/UE) for the care and use of laboratory animals. Experimental procedures were specifically approved by the ethics committee of the Institute Curie CEEA-IC #118 (Authorization 03416.02 given by National Authority) in compliance with the international guidelines.
Statistical analysis
Comparisons for gene expression levels, cell growth, sphere formation, adhesion, migration, and invasion capacities were analyzed with Graph Pad Prims v5 software using nonparametric two-tailed t-test (Mann–Whitney) and two-way ANOVA with Bonferroni post-test. Significant P-value was considered as <0.05, <0.01, or <0.001 as indicated in the figures.
Results
Xenograft-derived HEK cells exhibit a heterogeneous gene expression of CD24
We have previously shown that xenograft-derived HEK cells acquire both an autonomous capacity to form tumors and a metastable phenotype characterized by the expression of both epithelial and mesenchymal markers.12 We noticed that one out of three isolated cell lines (PC1-Expl-1) had a heterogeneous expression of the cell surface marker CD24 (Figure 1A). To study whether a variable expression of CD24 was associated or not with tumorigenic potential, we sorted CD44+CD24Neg and CD44+CD24Pos cells by flow cytometry (Figure 1B). Purified cells were replated and cultured in standard conditions. Both cell subpopulations grew well after sorting, and after 1 month the CD24 expression remained negative in the CD44+CD24Neg and positive in the CD44+CD24Pos subpopulations (Figure 1C). The gene expression level of CD44 and CD24 was also evaluated by qRT-PCR in cells that were kept in culture for 1 month. As expected, the CD44+CD24Pos cells express much higher levels of CD24 while both subpopulations express similar levels of CD44 (Figure 1D). These results demonstrate that CD44/CD24 expression levels remain relatively stable throughout many generations in vitro.
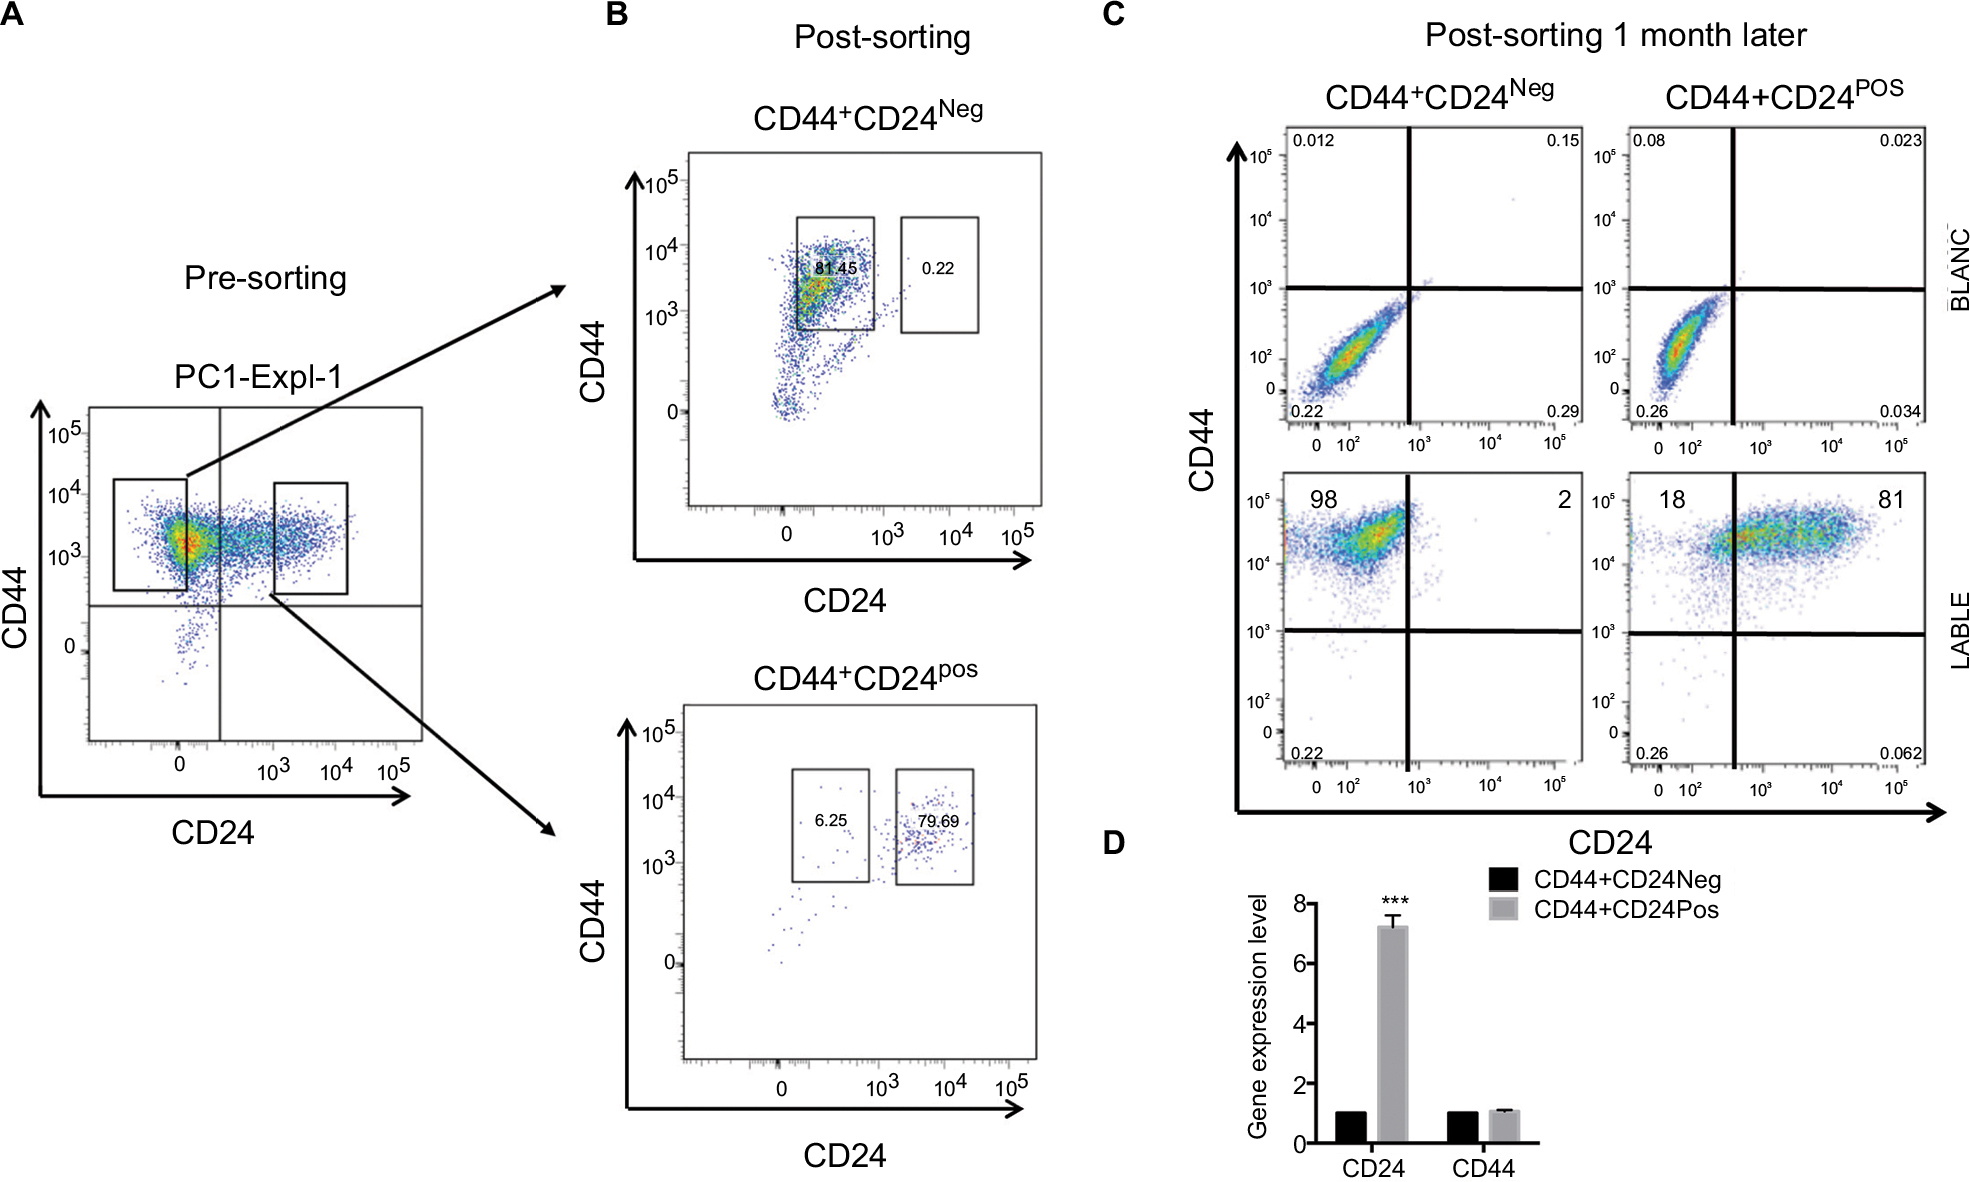 | Figure 1 Xenograft-derived human embryonic kidney cells exhibit a heterogeneous gene expression of CD24. Notes: (A) CD44+CD24Pos and CD44+CD24Neg cells were sorted by FACS according to CD24 expression. (B) The purity of these two cell populations was confirmed by rerunning the sorted population (post-sorting). (C) Sorted cells were kept in culture for 1 month, after which cell surface marker expression was determined in both CD44+CD24Pos and CD44+CD24Neg cell populations by flow cytometry (FACS) using CD44-FITC (mesenchymal marker) and CD24-PE (epithelial marker) monoclonal antibodies (lower plots). The upper plots indicated the blanc (n=3). (D) CD24 and CD44 expression was determined by quantitative reverse transcription PCR; the values were normalized to glyceraldehyde 3-phosphate dehydrogenase and relative to control cells. Error bars represent SEM. (***P<0.001) (n=2). Abbreviations: FACS, fluorescence-activated cell sorting; Neg, negative; Pos, positive. |
CD44+CD24Pos cells display enhanced EMT-related phenotypes compared to CD44+CD24Neg cells
Both CD44+CD24Neg and CD44+CD24Pos subpopulations were very similar in size and morphology, with cells showing an elongated form with apparent loss of cell–cell contacts (Figure 2A). Although both cell lines showed similar levels of expression of the proliferation marker Ki67 (Figure 2B, left) and proliferation rate was very similar during the first three days of culture, CD44+CD24Neg cells proliferated slightly more rapidly than the CD24Pos in the following days (Figure 2B, right), a difference that has been consistently observed in subsequent cell subcultures (not shown). As these cells were derived from a parental epithelial cell line that underwent first an EMT and then an MET,12 we proceeded to evaluate the expression of EMT-associated protein markers, as well as that of microRNA members of the miR-200 family. Data from Western blot (Figure 2C) and qRT-PCR (Figure 2D) analyses indicate that the expression of both epithelial (E-cadherin and Kr19) and mesenchymal markers (Vimentin, Zeb1, Zeb2, and Twist) are slightly more robust in the CD44+CD24Pos cells, as compared to CD44+CD24Neg, as it is the relative expression of miR-200a and miR-429 (Figure 2E).
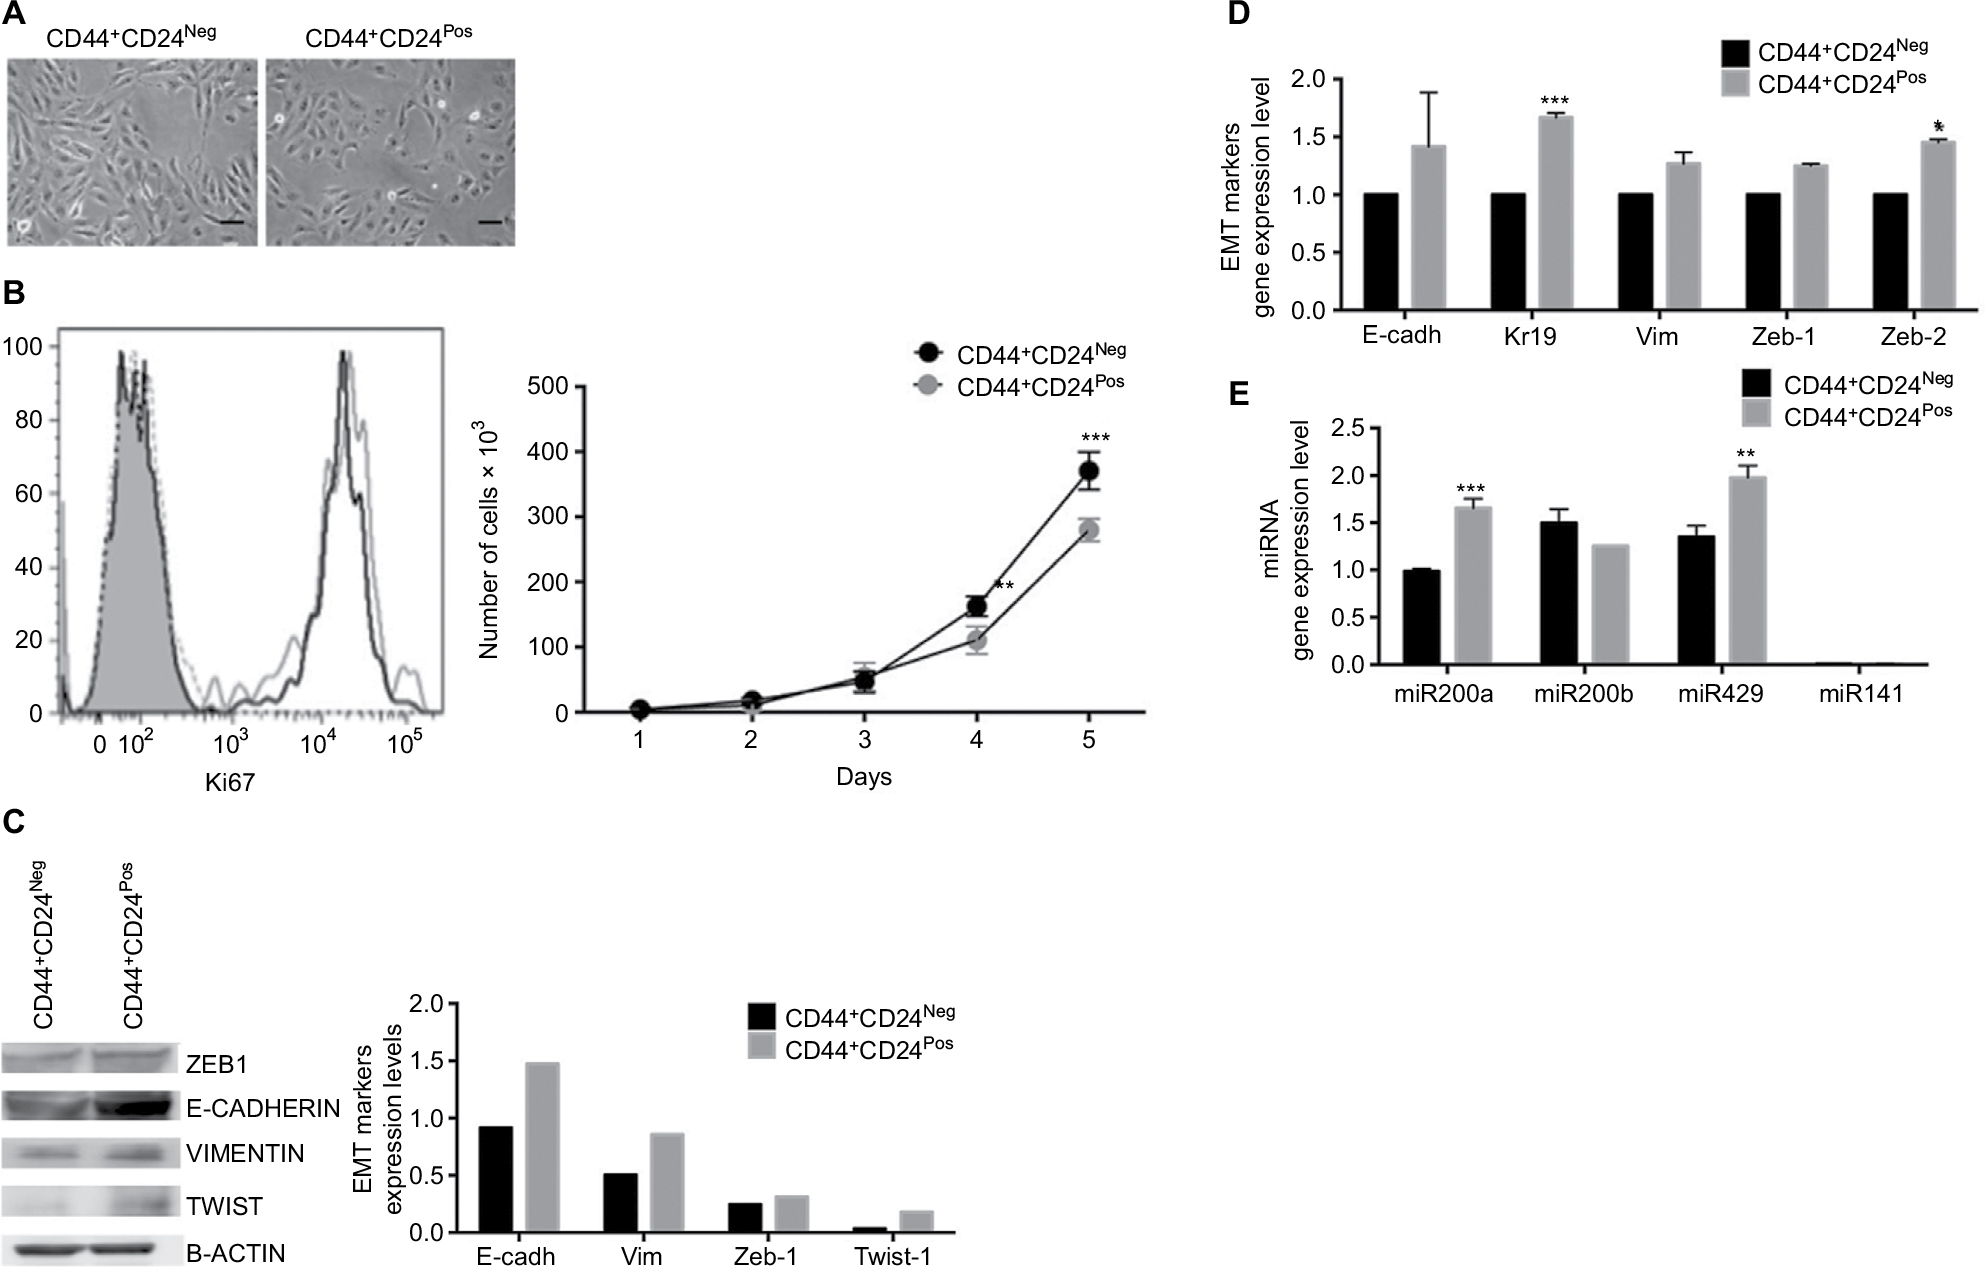 | Figure 2 CD44+CD24Pos cells exhibit an enhanced EMT phenotype compared to CD44+CD24Neg. Notes: (A) Representative images of cell cultures showing cells with fibroblastoid morphology in both cell subpopulations; scale bar, 10 µm. (B) Representative FACS histograms (left) showing the expression of Ki-67 in CD44+CD24Neg and CD44+CD24Pos cells (black and gray histogram, respectively). Filled histogram corresponds to blanc and dotted histogram to isotype control. The cell proliferation capacity (right) was determined by automatic counting of cells at the indicated time points; cells were seeded in triplicates, error bars represent SEM (**P<0.01; ***P<0.001) (n=2). The expression of EMT markers (E-cadherin, Keratin 19, Vimentin, Zeb1, Zeb2, and Twist1) was evaluated by (C) Western blot or (D) qRT-PCR; the values were normalized to beta-actin or glyceraldehyde 3-phosphate dehydrogenase, respectively (*P<0.05). (E) Expression levels of the miR-200 family, relative to the mean expression of hsa-Let7 family (housekeeping gene) as determined by qRT-PCR. Error bars indicate SEM from two independent RT reactions. Abbreviations: EMT, epithelial–mesenchymal transition; Neg, negative; Pos, positive; E-cadh, E-cadherin; Vim, Vimentin; Zeb-1, Zinc Finger E-Box Binding Homeobox 1; Twist-1, Twist Family BHLH Transcription Factor 1. |
We next evaluated functional properties associated with the EMT, namely migration, invasion, and adhesion capacities. CD44+CD24Pos cells were more motile, with cells migrating more than CD44+CD24Neg cells as assessed by “wound healing” assay (spontaneous migration) (Figure 3A) or by directed migration toward FBS in the transwell migration assay (Figure 3B). A significant increase in matrigel-coated filter invasion capacity was also evident in CD44+CD24Pos cells (Figure 3C). Interestingly, the CD44+CD24Neg cells showed more ability to adhere to fibronectin-coated plates (Figure 3D) as evaluated by counting the number of adhered cells (Figure 3D, upper) or by quantifying Crystal violet absorbance (Figure 3D, bottom). These data indicate that CD44+CD24Pos cells have enhanced migration and invasion capacities, suggesting enhanced tumorigenic capabilities, while conserving a mixed EMT phenotype in terms of marker expression.
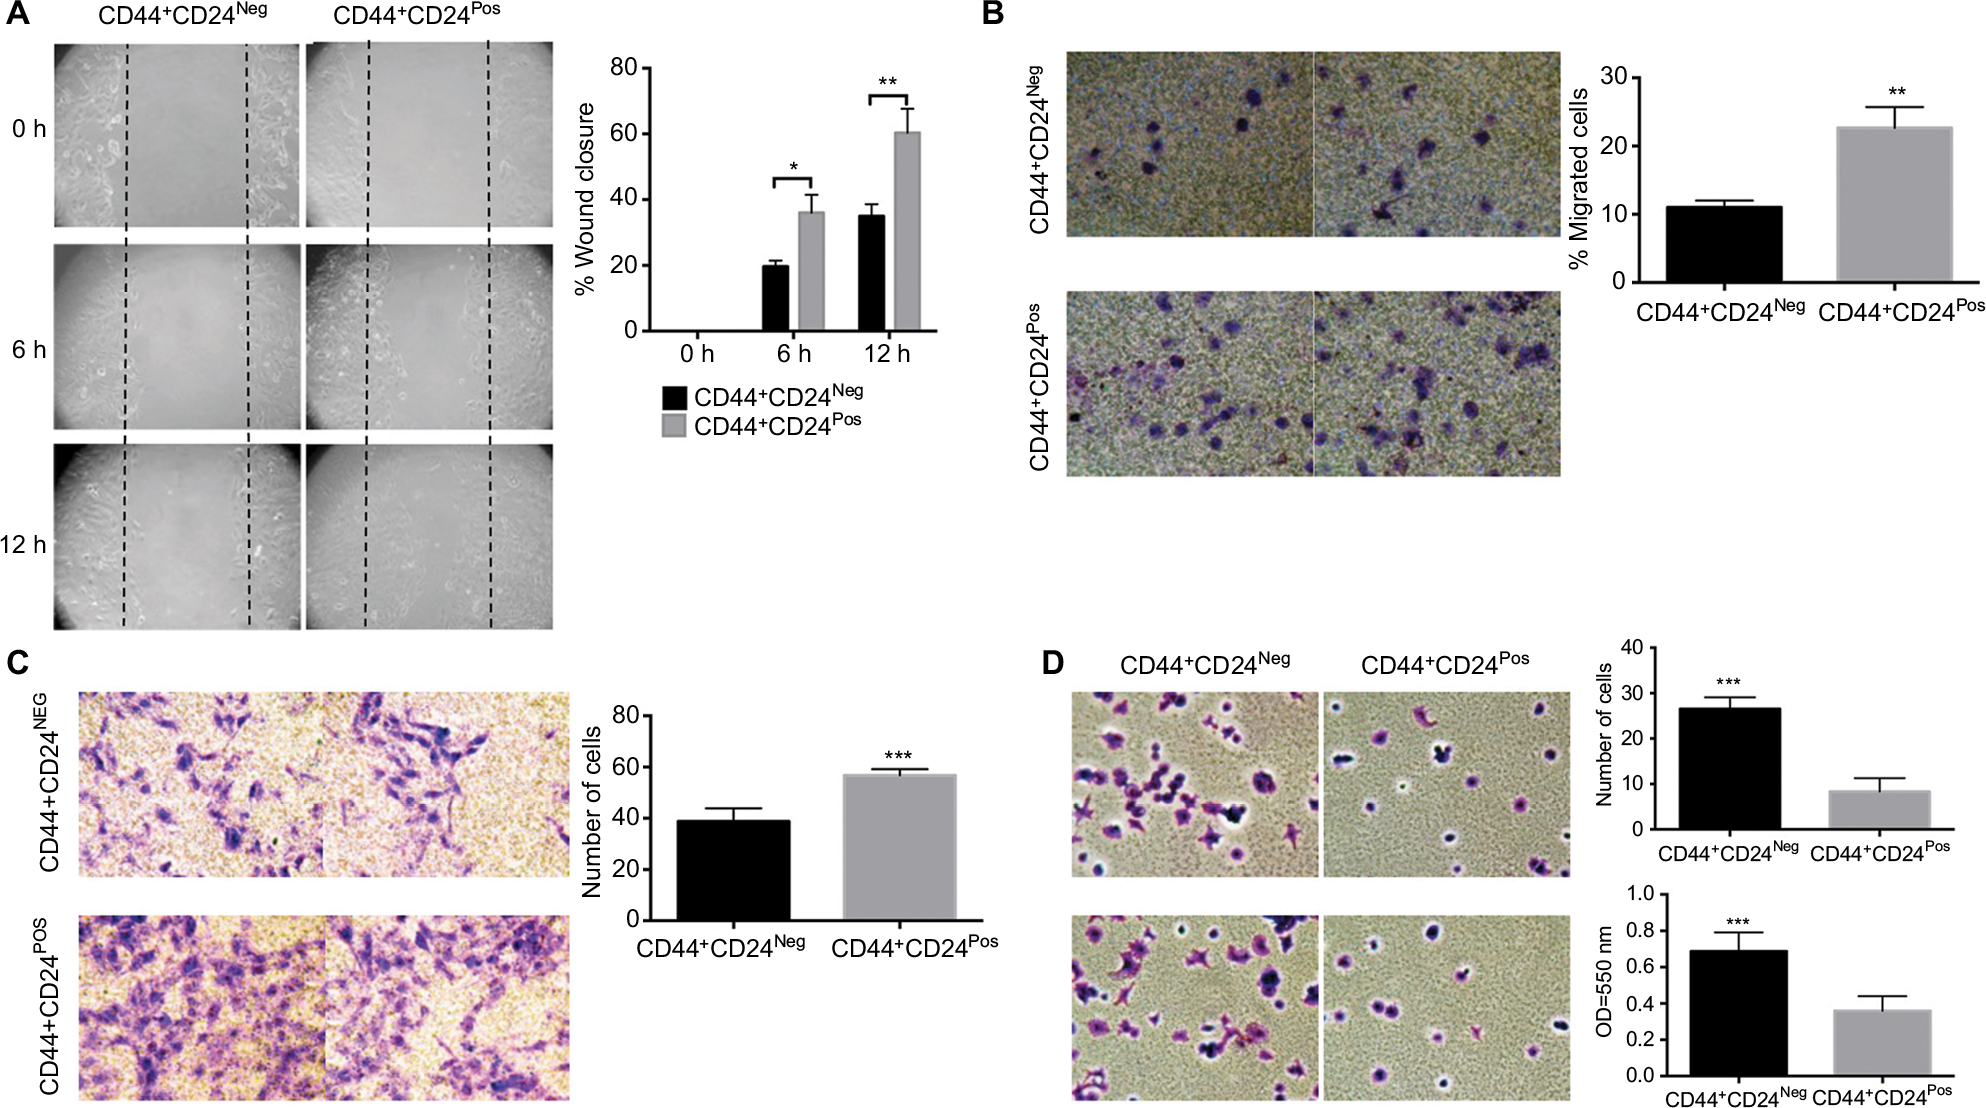 | Figure 3 CD44+CD24Pos exhibited more ability to migrate and invade but less ability to adhere to CD44+CD24Neg cells. Notes: (A) Wound healing assay performed in CD44+CD24Neg and CD44+CD24Pos cells; a representative experiment is shown (micrographs [10×] were taken at the indicated times). Black dotted lines indicate the area of the wound. The histograms show the healed wound area at the different time points; at least ten images were analyzed using the Image J program. Error bars indicate SEM. (*P<0.05; **P<0.01). (B) Transwell migration and (C) invasion (toward 20% FBS) assays. Representative micrographs (20×) were taken from the membrane filters (bottom surface of the filters) stained with Crystal violet. The histograms show the quantification of transwell migration and invasion assay by counting the number of cells present on the bottom surface of filters from at least 15 images. Error bars indicate SEM (**P<0.01; ***P<0.001) (n=2). (D) Adhesion assay of CD44+CD24Neg and CD44+CD24Pos cell subpopulations. Representative micrographs (20×) were taken from the plates stained with Crystal violet. The histograms show the quantification of the adhesion assay by counting the number of adherent cells (upper) and by measuring the Crystal violet absorbance (bottom). Error bars indicate SEM (***P<0.001). Abbreviations: Neg, negative; Pos, positive. |
CD44+CD24Neg and CD44+CD24Pos cell subpopulations dramatically differ in their tumorigenic potential
Given the differences in migration and invasion between CD24Neg and CD24Pos cell lines, we proceeded to evaluate their tumorigenic potential in comparison to the parental cell line PC1-Expl-1. After 40–50 days postinjection, and contrary to our expectations, the CD44+CD24Neg cell subpopulation was as competent to form tumors as the parental cell line (Figure 4A). On the other hand, CD44+CD24Pos cells did not support tumor formation, even after a follow-up period of more than 3 months. Given that the parental cell line contains both cell types and is able to form tumors very efficiently, we explored the possibility of a positive or negative interaction by mixing CD44+CD24Pos and CD44+CD24Neg cells in equal proportions and by injecting the mix subcutaneously into SCID mice. The CD44+CD24Pos/CD44+CD24Neg mix formed tumors with a slight delay, after which tumors reached sizes that were, in average at the experimental endpoint, half of the size of the pure CD44+CD24Neg-derived or parental cell-derived tumors (Figure 4A). Similar to our previous study,12 immunohistochemical staining (Figure 4B) revealed that PC1-Expl-1-derived tumors were highly heterogeneous, with epithelioid and fibroblastoid compartments, a morphology also observed in the tumors formed by the CD44+CD24Pos/CD44+CD24Neg mix. Interestingly, tumors formed by the CD44+CD24Neg cell subpopulation exhibited a more accentuated epithelioid morphology, also suggested by the lower expression of some mesenchymal markers such as αSMA and Vimentin (Figure 4B). These results indicate that tumor formation in the parental cell line and the mix is mostly the result of CD44+CD24Neg growth capabilities. However, the presence of tumor heterogeneity whenever CD44+CD24Neg and CD44+CD24Pos are co-injected suggests some contribution by the latter.
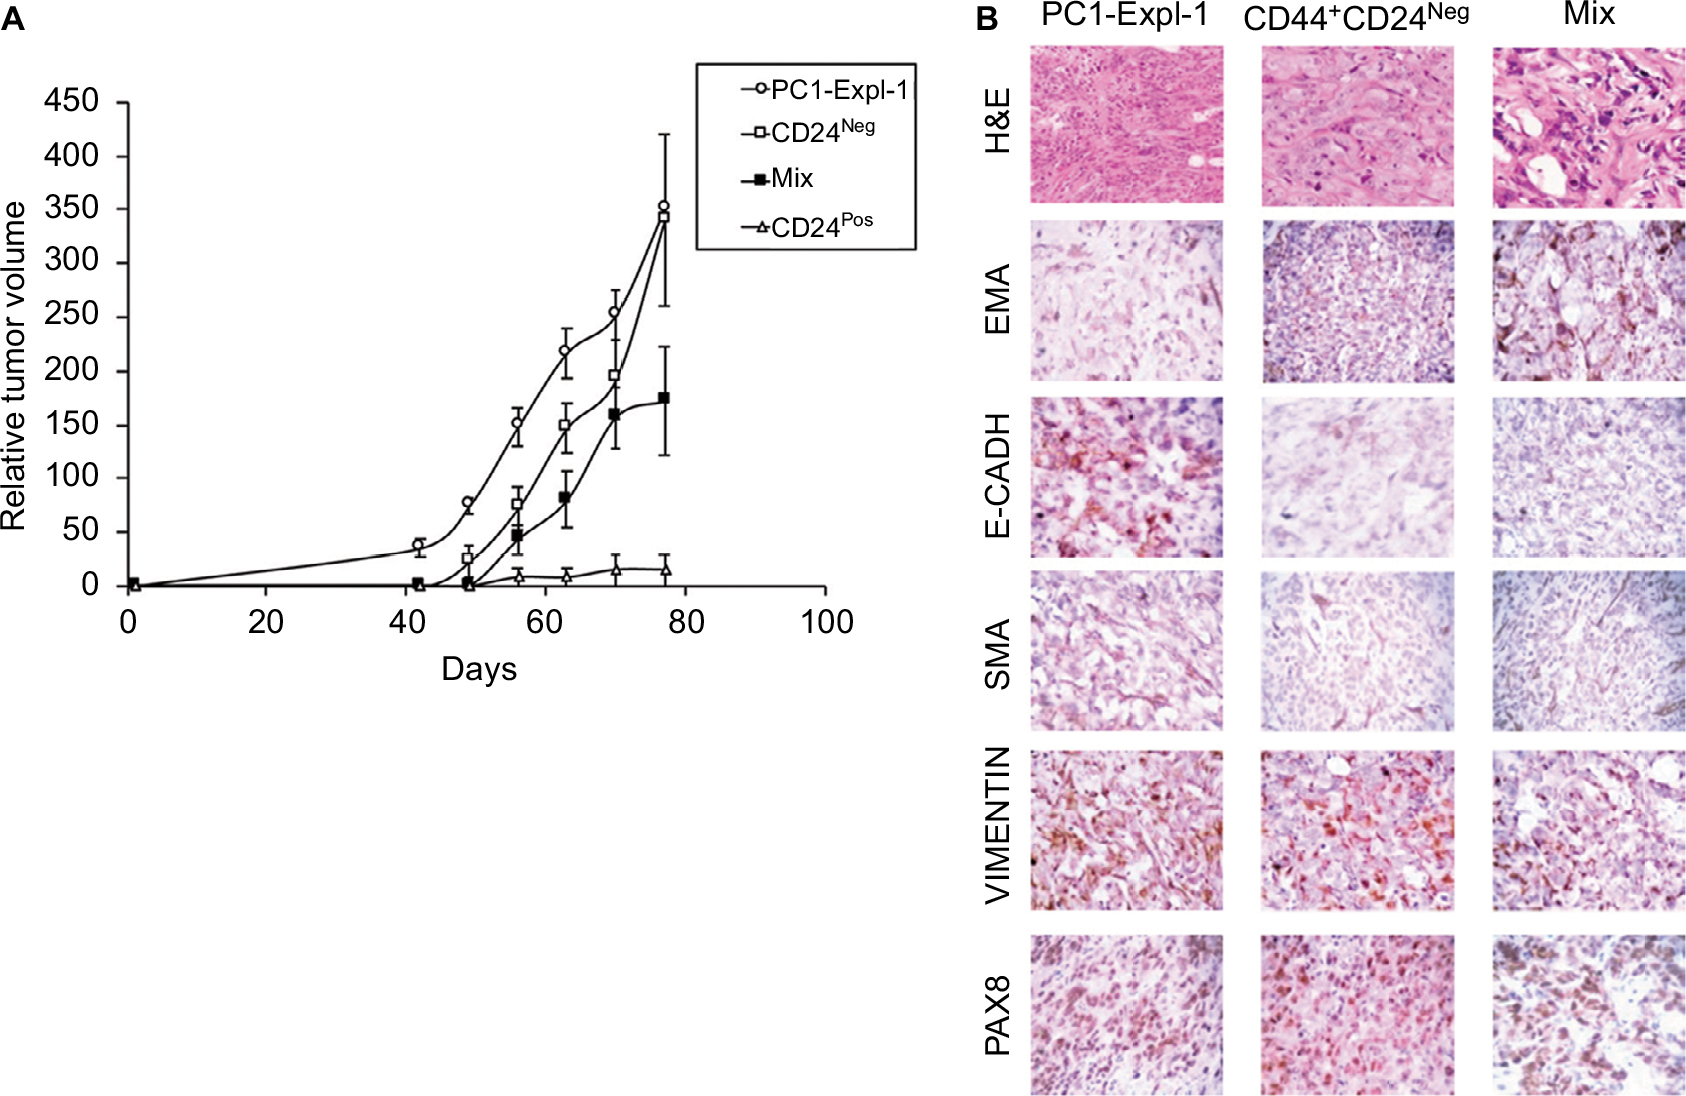 | Figure 4 CD44+CD24Neg and CD44+CD24Pos cell subpopulations differ in their tumorigenic potential. Notes: (A) Tumorigenic assay: The indicated sorted cell lines were injected (5×10⁵ cells per inoculation) subcutaneously in the flanks of SCID mice. A cell suspension containing 2.5×10⁵ cells of each cell subpopulations was used (labeled Mix). As a control, PC1-Expl-1 cells (5×10⁵) were injected. CD44+CD24Neg cells formed visible tumors in 40 days. Error bars indicate mean ± SD. (B) Histopathology analyses of tumors formed by PC1-Expl-1, Mix, and CD44+CD24Neg cells. H&E staining shows the morphologic aspect. Immunostaining for the epithelial (EMA and E-cadherin) and mesenchymal (αSMA and Vimentin) markers, and for the renal carcinoma marker Pax8, were performed using specific antibodies to detect the human proteins. Abbreviations: αSMA, alpha-smooth muscle actin; EMA, epithelial membrane antigen; Neg, negative; Pos, positive. |
CD44+CD24Neg and CD44+CD24Pos subpopulations varied in their stemness properties
CSC are defined mainly by their self-renewal and their multipotential differentiation capacities49; these stem-like cell features have also been associated with an EMT program.10,50,51 Therefore, we evaluated the ability of the two cell subpopulations to form multicellular spheroids in low binding surfaces. CD44+CD24Pos and CD44+CD24Neg cells were plated in six-well low-binding plates (5,000 cells/well) for 8 days. While both cell subpopulations formed spheres bigger than 100 µm, the number and size of these spheres were greater in CD44+CD24Pos cells (Figure 5A). This result indicates that CD44+CD24Pos cells display higher self-renewing properties when compared to CD44+CD24Neg cells. In contrast, the number of colonies formed by CD44+CD24Neg cells after dilution was much higher than that of CD44+CD24Pos cells (Figure 5D), suggesting an enhanced clonogenic capacity for the former. We also assessed gene expression of stem cell-associated markers (the ATP-binding cassette [ABC] transporter, ABC-B1) and reprogramming factors (Nanog, Oct-4, Klf-4, Sox2, Lin28) by qRT-PCR. CD44+CD24Pos cells express high levels of the ABC-B1 transporter, known to be involved in multidrug resistance52 (Figure 5B). In addition, Oct-4, Sox-2, and Lin28 were also upregulated in the CD44+CD24Pos cell subpopulation (Figure 5C), suggesting again that CD44+CD24Pos cells have more “stemness” than CD44+CD24Neg cells.
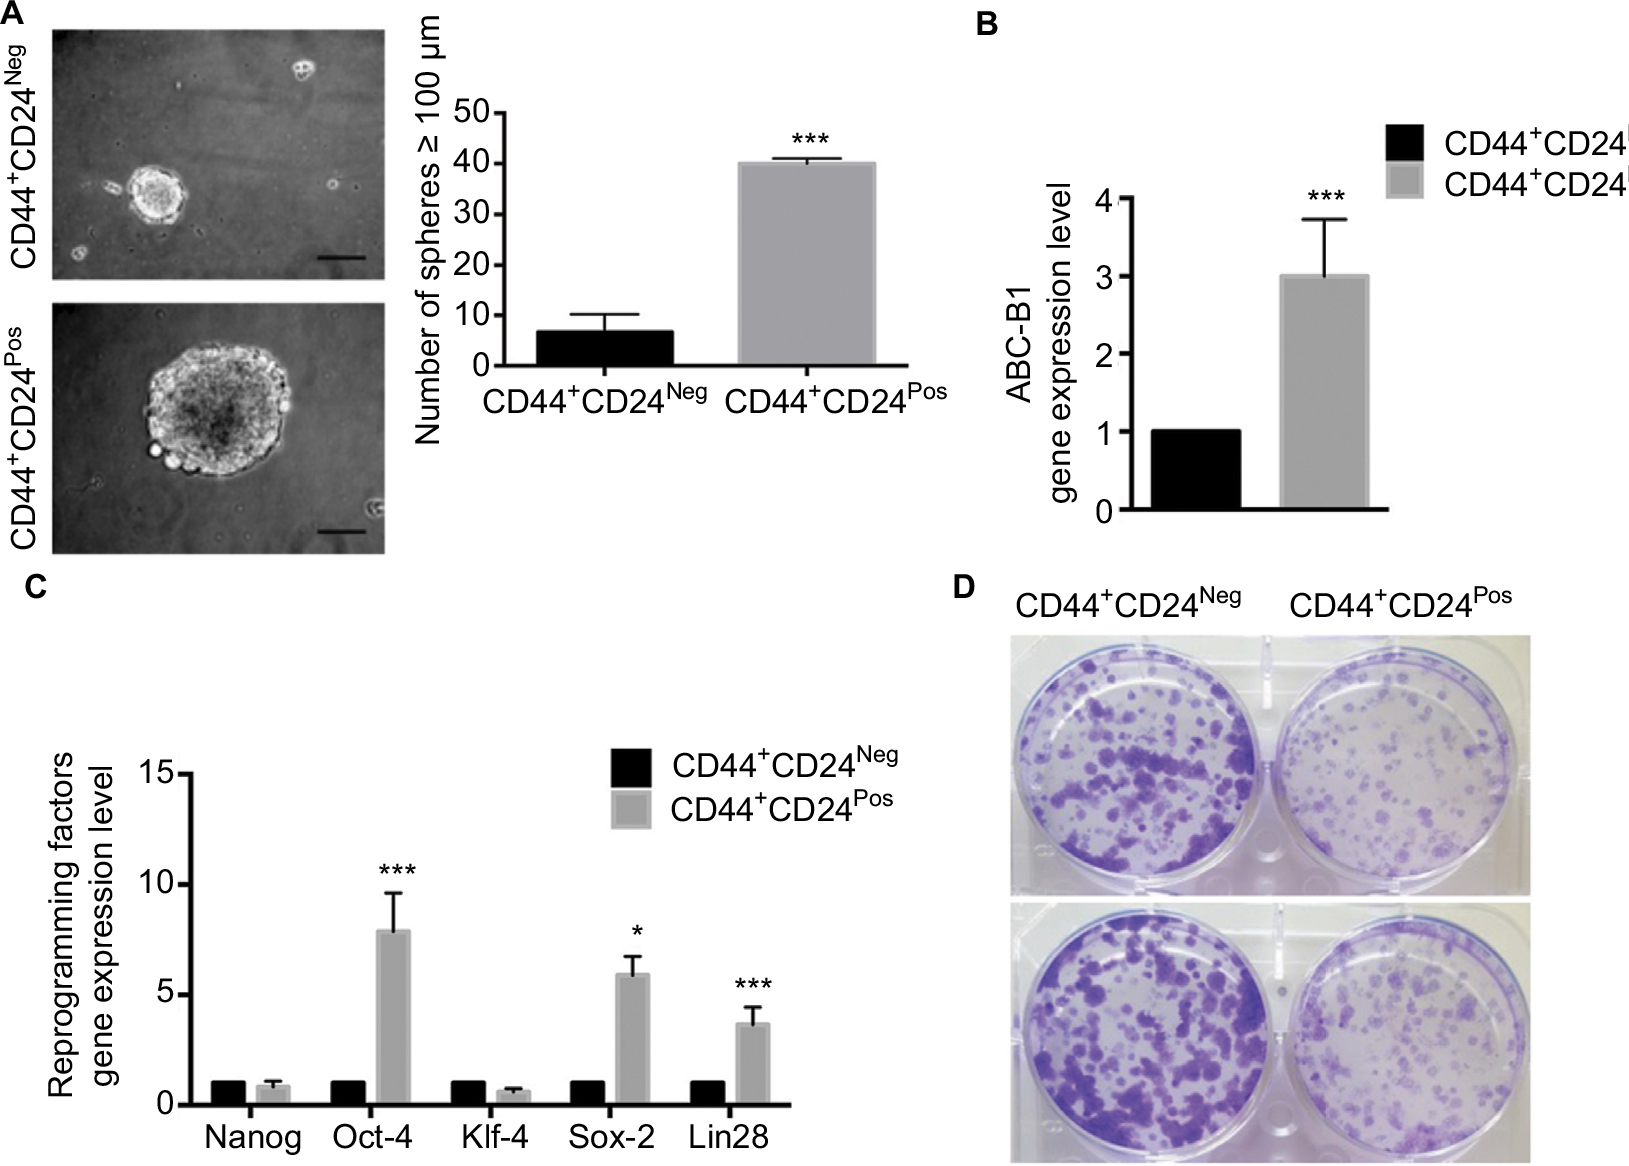 | Figure 5 CD44+CD24Neg and CD44+CD24Pos subpopulations vary in their stemness properties. Notes: (A) Sphere formation assay in the presence of defined medium (epidermal growth factor and fibroblast growth factor). Representative micrographs (10×) show sphere formation after 8 days of induction. Scale bar, 100 µm. The total number of spheres per well larger than 100 µm was determined at day 8. Error bars indicate SEM. (***P<0.001) (n=2). (B) The gene expression level of stem cell-associated markers (ABC-B1) and (C) reprogramming-associated transcription factors was determined by quantitative reverse transcription PCR. The values were normalized to glyceraldehyde 3-phosphate dehydrogenase. Error bars represent SEM (*P<0.05; ***P<0.001) (n=2). (D) Representative micrographs of two independent clonogenic experiments in CD44+CD24Neg and CD44+CD24Pos cells. Colonies were stained with Crystal violet. Abbreviations: Neg, negative; Pos, positive. |
To extend the global assessment of CSC properties, based also on the origin of the HEK cell lines, we further evaluated the expression of EpCAM, ALDH1, CD133, and CD105. EpCAM is an adhesion molecule expressed in a variety of human epithelial cancers, progenitors, and stem cells.3,53,54 The enzyme ALDH1 is highly expressed in embryonic tissue as well as in adult stem cells.55,56 CD133 is often used as a marker for CSC in nervous system, colon, and prostate cancer and that has been used as a negative predictive factor in RCC.25,57–61 Finally, the CD105 protein has been defined as a CSC marker in ccRCC.4 Although the differences observed were small, they were consistent and statistically significant (Figure 6A, D). The median fluorescence intensity of proportion of EpCAM+ and CD133+ was higher in CD44+CD24Pos cells (Figure 6A, C), while that of CD105+ was higher in CD44+CD24Neg. The ratio of the ALDH1+ cells stained with BAAA was 17.6% and 0.68% in CD44+CD24Pos and CD44+CD24Neg cells, respectively, while that of those stained with BAAA and DEAB, as a negative control, was 2.76% and 0.35%, respectively. Therefore, the real ratio of the ALDH+ cells was 14.84% and 0.33%, respectively, indicating again that CD44+CD24Pos cells are enriched in stem-like cells (Figure 6B).
 | Figure 6 CD44+CD24Neg and CD44+CD24Pos subpopulations differ in the expression of stem cell markers. Notes: CD44+CD24Pos express high levels of stem cell markers. (A) Representative plot showing the expression of EpCAM in CD44+CD24Neg and CD44+CD24Pos cells (black and gray histogram, respectively) determined by flow cytometry. Dotted histogram corresponds to blanc (n=3). (B) ALDH activity was determined by fluorescence-activated cell sorting. DEAB, an ALDH inhibitor, was added to ensure accurate identification of ALDH+ and ALDH− cells. The expression of (C) CD133 and (D) CD105 was determined by FACS. The histograms show the median fluorescence intensity (n=2). Error bars indicate SEM (*P<0.05; **P<0.01). Abbreviations: ALDH, aldehyde dehydrogenase; DEAB, diethylamino-benzaldehyde; Neg, negative; Pos, positive. |
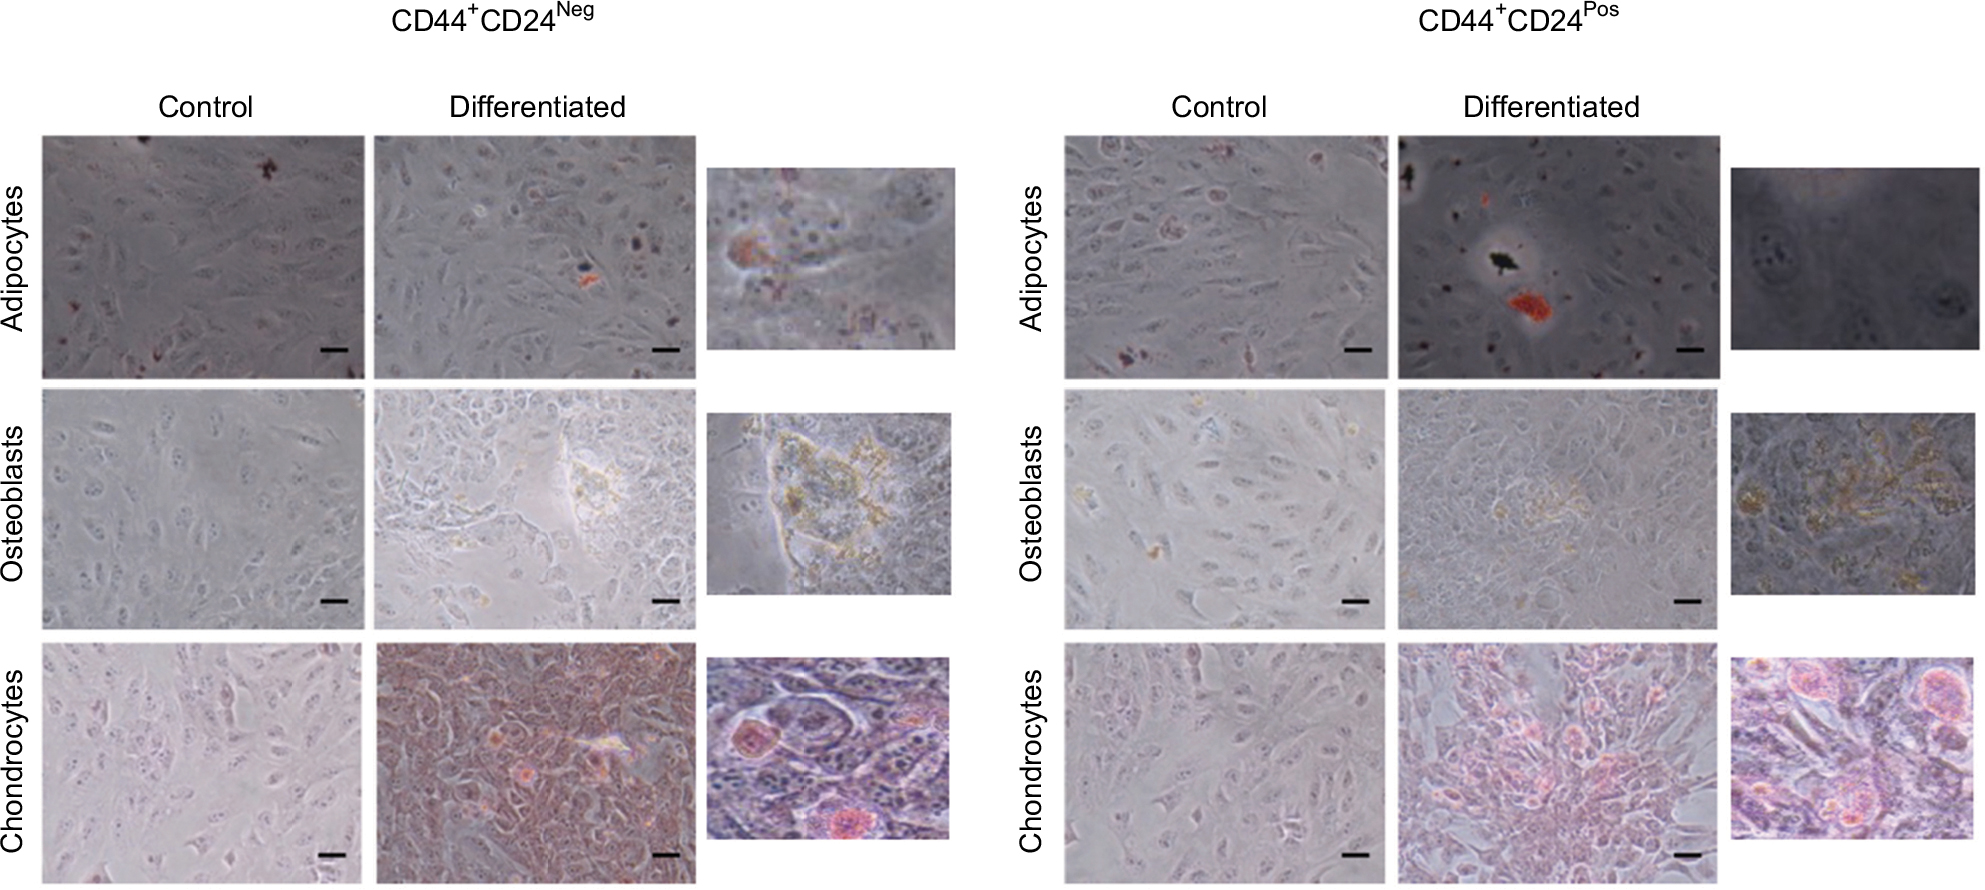
We next evaluated the multilineage differentiation potential of these cells. Remarkably, after 9 days, both CD44+CD24Pos and CD44+CD24Neg cells were able to give rise to chondrocytes, adipocytes, and osteocytes (Figure 7), although the intensity of the staining suggested a slight increase in the differentiation capacity of CD44+CD24Pos cells. To better assess this, we evaluated the differentiation capacity (specific staining) and the differentiation-associated gene expression (qRT-PCR) at different time points. Early evaluations (day 3) did not reveal well-defined differences between these two cell subpopulations (Figure S1). The evaluations at days 6 and 9 showed that, although both cell subpopulations were endowed with differentiation capacity (Figures S2A, S3A, B and S4A, B), normalization of gene expression relative to CD44+CD24Neg cells showed increase in expression of PPARγ (adipogenic differentiation), RUNX2 (osteogenic differentiation), and Aggrecan (chondrogenic differentiation) (Figures S2C, S3C, and S4C, respectively).
 | Figure 7 CD44+CD24Neg and CD44+CD24Pos cells differ slightly in their multilineage differentiation capacity. Notes: The differentiation to mesenchymal cell lineages was induced by using specific stimulation media, as described in methods and evaluated after 9 days of induction. Adipocytes (oil red-O), osteoblasts (ALP activity), and chondrocytes (Safranin O) differentiation was determined with specific staining. Representative images are shown. Scale bar, 10 µm. Abbreviations: ALP, alkaline phosphatase; Neg, negative; Pos, positive. |
CD44+CD24Pos cells were enriched in a proinflammatory gene expression signature
The tumorigenic assay indicates that while the inoculation of a mixture of both cell subpopulations reconstituted the heterogeneity of tumors obtained with the parental PC1-Expl-1, the inoculation of pure CD44+CD24Neg cells yielded a more homogeneous tumor. This suggests that the presence of CD44+CD24Pos cells, which likely does not contribute much to tumor growth, somehow influences the differentiation status of tumor cell populations. We have explored the possibility that soluble factors could be responsible for these effects and found that CD44+CD24Pos cells secrete high levels of the proinflammatory cytokines IL6 and IL8, as evaluated by flow cytometry (Figure 8A). Next, we used a human cytokine antibody array (ARY005B) that simultaneously detects 36 target proteins. From this screen, expressions of IL6, IL8, CXCL-1, and SERPIN E1, were found to be significantly increased in CD44+CD24Pos compared to CD44+CD24Neg cells (Figure 8B), suggesting that these soluble factors could be responsible for conferring special properties to the microenvironment where cells grew or to neighboring cells, including CD44+CD24Neg. Some of these cytokine-signaling pathways involved NF-κB activation. Notably, CD44+CD24Pos cells showed higher phosphorylation of NF-κB (Figure 9A, C) while pSTAT3 was unmodified (Figure 9B, C). The mechanisms, by which these soluble factors and pathways could eventually induce cells with less tumorigenic potential, should be further studied.
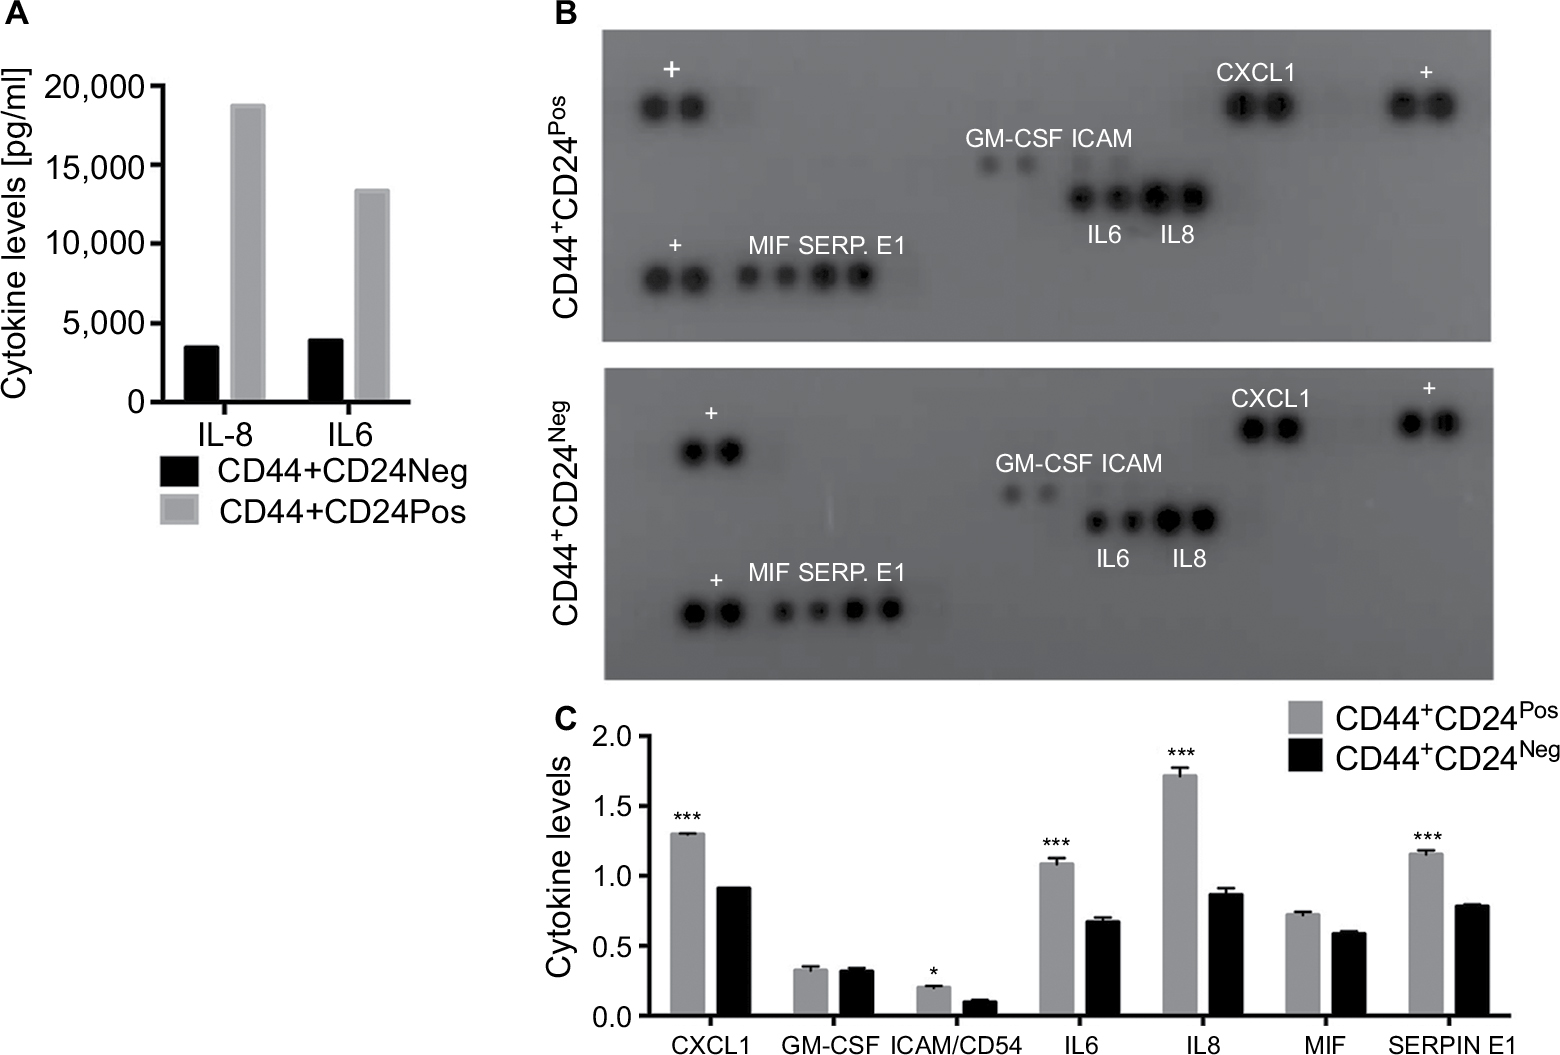 | Figure 8 CD44+CD24Pos cells show a proinflammatory gene expression signature. Notes: (A) The proinflammatory cytokines IL6 and IL8 were determined using a Becton Dickinson Cytometric Bead Array flow cytometric assay, using serum-free conditioned medium obtained from CD44+CD24Neg and CD44+CD24Pos cells. Bar graph shows the amount of cytokines in a representative experiment. (B) Human proinflammatory cytokines and chemokines were determined using a human cytokine detection kit and protocol (# ARY005B, R&D Systems). Culture media from CD44+CD24Neg and CD44+CD24Pos cells were blotted on cytokine membranes. Captured proteins were visualized using chemiluminescent detection reagents and the signal produced was quantified. The signal is proportional to the amount of analyte bound. Positive cytokines appear as black dots, in duplicate. +: membrane positive control. ***P<0.001; *P<0.05. Abbreviations: Neg, negative; Pos, positive. |
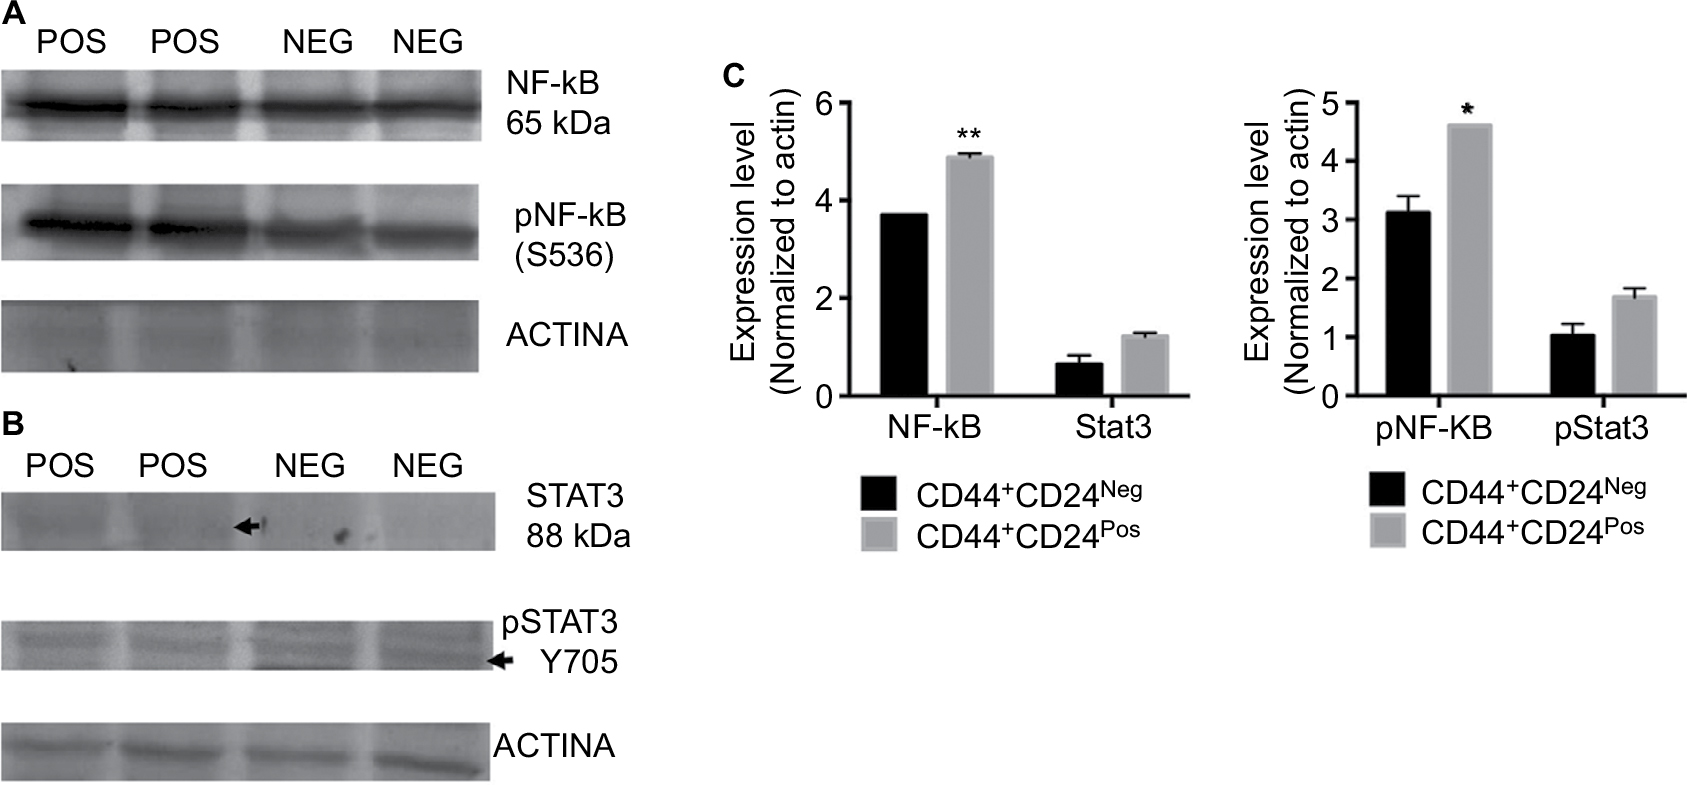 | Figure 9 CD44+CD24Pos cells showed higher phosphorylation of NF-κB but no changes in the expression or phosphorylation levels of Stat3. Notes: Western blot analysis was performed to assess total and phosphorylated (A) NF-κB and (B) Stat3 protein levels in CD44+CD24Pos and CD44+CD24Neg cells. Forty micrograms of proteins were fractionated on SDS-polyacrylamide gels, transferred to polyvinylidene difluoride membranes and incubated with specific antibodies. (C) Quantification of the total (left) and phosphorylated (right) target protein bands relative to β-actin is shown in the bar graphs. Error bars indicate SEM (*P<0.05; **P<0.01). Abbreviation: NF-κB, nuclear factor kappa B; Neg, negative; Pos, positive. |
Discussion
Cancer cells within individual tumors often exist in diverse phenotypic states differing in functional attributes. Beyond the mutation-driven emergence and evolution of clonal diversity, the presence of CSC, with their self-renewal potential, multipotency, and dynamic plasticity,62,63 is expected to significantly contribute to this heterogeneity. Intratumor heterogeneity can also be the result of tumor microenvironment influence (stromal cells, secretion of soluble factors, presence of extracellular matrix components, and so on), which can enable cancer cells to gain or lose stem-like cell functions.64–66 In our model, premalignant HEK cells were tumorigenic only in the presence of a senescence microenvironment, which also proved to be responsible for conferring autonomous tumorigenic potential to explanted cells isolated from those tumors.12 This remarkable acquisition was accompanied by a MET transition program generating cells with a hybrid phenotype (presence of epithelial and mesenchymal markers)15,16 and importantly, increased stem-like cell functions and cell plasticity.12 Because there is still no complete clarity about the importance of the EMT/MET intermediate states, the CSC markers, or the cell phenotypic heterogeneity in tumor development and progression, we sought to investigate if the CD24 variable expression observed in the HEK-explanted cell lines could be associated with the gain or loss of cell properties contributing to tumorigenesis.
Comparison of the two cell subpopulations shows that they are very similar in size and morphology but differ slightly in the expression of epithelial and mesenchymal markers,67,68 with the CD44+CD24Pos cell subpopulation having increased expression of E-cadherin and Vimentin and the EMT-associated transcription factor Zeb-2. Some members of the miR-200 family, associated with the EMT program, were also augmented in the CD44+CD24Pos cells. These enriched mesenchymal cell features agreed well with the more migratory and invasive phenotype observed in the CD44+CD24Pos cell subpopulation, and may have anticipated its greater tumorigenic capacity.69,70 However, CD44+CD24Pos cells were unable to induce tumors in SCID mice, while CD44+CD24Neg cells were as tumorigenic as the parental PC1-Expl-1 cell line. However, the tumors formed by CD44+CD24Neg cells were more homogeneous than tumors formed by parental cells or by a mixture of both CD44+CD24Neg and CD44+CD24Pos, suggesting that the latter, even if they contribute little to tumor growth, contribute to tumor heterogeneity. Although the mechanism by which the presence of CD44+CD24Pos cells impacts tumor heterogeneity remains to be fully explored, we have showed that these cells secreted higher amounts of inflammatory cytokines, which could influence their own growth as well as the tumor microenvironment.
Evaluation of stemness showed that, except for clonogenicity and CD105 marker expression, CD44+CD24Pos cells presented an enrichment of stem-like cell characteristics (number and size of tumorspheres, multilineage differentiation potential, expression of reprogramming factors, ALDH1 and ABC-B1). In this way, it was surprising that they were unable to induce tumors.55,71,72 Because of their prominent EMT phenotype and their greater mobility and ability to migrate and invade, it is possible that these cells are more likely endowed with metastatic potential,73 and that they are limited in their ability to colonize tissues and establish robust cell growth. This possibility is supported by the fact that they display low adhesion capacity, reduced proliferation rate, as well as very diminished clonogenic capacity,74,75 compared to CD44+CD24Neg cells. In this regard, high CD24 expression has been associated with metastasis potential.22,24 The existence of distinct populations of cancer cells, having tumor growth advantages or alternatively, metastatic potential, has also been demonstrated in human pancreatic cancer.76 Also, in xenotransplantation experiments, it has been shown that breast cancer cell lines expressing high levels of ALDH1 are more metastatic than those expressing low ALDH1.77 Interestingly, cells from the metastasis showed a reduced CD44/CD24 ratio, compared to cells from the primary tumor, due to a higher CD24 expression.77 It should be clear, notwithstanding, that the CD44+CD24Neg cell subpopulation has also stem-like cell properties (albeit some of them reduced compared to CD44+CD24Pos cells) but with extra attributes that make them competent to adhere and proliferate, and notably, induce tumors.
Though the purpose of our work was not to validate our HEK model as an in vitro system for RCC studies, we noted that both cell subpopulations expressed high levels of CD105, a marker that has been used to identify CSC in various types of RCC4 and PAX8, another marker associated with renal neoplasia.78,79 Of note, the tumorigenic CD44+CD24Neg cells expressed higher level of CD105 compared to the nontumorigenic CD44+CD24Pos cells. Perhaps relevant to this is the fact that CD105+ cells isolated from patients with RCC when injected into immunodeficient mice are tumorigenic compared to the CD105 cell population.4 Further analysis of the tumorigenic CD105+ cells revealed also higher clonogenic ability of these cells, thus a situation very similar to the CD44+CD24Neg cells described here.
Also in keeping with ours is another study on a sarcomatoid RCC cell line, in which two cell subpopulations initially identified by the differential expression of CD44 and CD24 were found to have different tumorigenic capabilities, each one harboring their own albeit different CSC.80 In the same study, the CD44BrightCD24Bright showed greater migratory and invasive potential compared to the CD44BrightCD24Dim subset,80 pointing to a further similarity with our model where CD44+CD24Pos presented also higher migratory and invasive potential. Together, these results indicate that different cell subpopulations with specific stem-like cell properties may exist in the same tumor, and suggest that a particular set of stem cell features could translate into different oncogenic phenotypes.
In all, our work supports the idea that full-blown stemness is not indispensable for tumorigenesis, although some stem-like cell attributes may be needed, depending on the cell context and/or the stage of tumor formation. It is also highly likely that functions not necessarily associated with stemness are required for full tumorigenicity. The “optimal” set of cell functions with this ability would necessarily depend on genome evolution, cell heterogeneity, microenvironmental cues, and cell–cell interactions in the primary tumor. Recreating such environment in heterotopic situations during the metastatic process likely requires a great deal of cell plasticity, which at minima combines EMT/MET transitions and bona fide stemness capacities.
Conclusions
Our results showed that CD44+CD24Neg and CD44+CD24Pos cells differ in features associated with EMT–MET programs, stemness, and, importantly, tumorigenic capacity. Although the CD44+CD24Neg cell subpopulation displayed reduced stem-like cell properties and lesser ability to migrate and invade, compared to CD44+CD24Pos cells, they produced tumors as efficiently as the parental PC1-Expl-1 cell line. Having extra attributes (increased adherence, clonogenicity, and proliferation) could favor local tumor growth. Our results suggest that an “optimal” set of stem-like cell properties with the ability to confer tumorigenicity would depend necessarily on cell and tissue context, microenvironmental cues, and cell–cell interactions in the tumor microenvironment. In conclusion, this work shows that the acquisition of a full-blown stemness program is not necessarily associated with increased tumor initiation.
Acknowledgments
We would like to thank Doctor Jinneth Acosta, Pathology Group, Faculty of Medicine, Universidad Nacional de Colombia, for processing and analyses of tumors. This work was supported by funding from the Patrimonio Autónomo Fondo Nacional de Financiamiento para la Ciencia, la Tecnología y la Innovación, Francisco José de Caldas, Colciencias (Contract No RC-692–2013), División de Investigación y Extensión, Bogotá, and Faculty of Medicine, Universidad Nacional de Colombia, to JPV. Work in the laboratory of ALV was supported by INCa and ARC grants and the Labellisation Program of the “Ligue contre le Cancer”.
Author contributions
PO-M, AL-V, and JPV conceived and designed the study. PO-M carried out most of the experiments. W-YL-B carried out animal experimentation. PO-M, AL-V, and JPV analyzed data, interpreted the results, and wrote the article. All authors contributed to data analysis, drafting and revising the article, gave final approval of the version to be published, and agree to be accountable for all aspects of the work.
Disclosure
The authors report no conflicts of interest in this work.
References
Blanpain C. Tracing the cellular origin of cancer. Nat Cell Biol. 2013;15(2):126–134. | ||
Dalerba P, Cho RW, Clarke MF. Cancer stem cells: models and concepts. Annu Rev Med. 2007;58:267–284. | ||
Al-Hajj M, Wicha MS, Benito-Hernandez A, Morrison SJ, Clarke MF. Prospective identification of tumorigenic breast cancer cells. Proc Natl Acad Sci U S A. 2003;100(7):3983–3988. | ||
Bussolati B, Bruno S, Grange C, Ferrando U, Camussi G. Identification of a tumor-initiating stem cell population in human renal carcinomas. FASEB J. 2008;22(10):3696–3705. | ||
O’Brien CA, Kreso A, Dick JE. Cancer stem cells in solid tumors: an overview. Semin Radiat Oncol. 2009;19(2):71–77. | ||
Saroufim A, Messai Y, Hasmim M, et al. Tumoral CD105 is a novel independent prognostic marker for prognosis in clear-cell renal cell carcinoma. Br J Cancer. 2014;110(7):1778–1784. | ||
Chaffer CL, Brueckmann I, Scheel C, et al. Normal and neoplastic nonstem cells can spontaneously convert to a stem-like state. Proc Natl Acad Sci U S A. 2011;108(19):7950–7955. | ||
Smalley M, Piggott L, Clarkson R. Breast cancer stem cells: obstacles to therapy. Cancer Lett. 2013;338(1):57–62. | ||
Gupta PB, Fillmore CM, Jiang G, et al. Stochastic state transitions give rise to phenotypic equilibrium in populations of cancer cells. Cell. 2011;146(4):633–644. | ||
Mani SA, Guo W, Liao MJ, et al. The epithelial-mesenchymal transition generates cells with properties of stem cells. Cell. 2008;133(4):704–715. | ||
Morel AP, Lièvre M, Thomas C, Hinkal G, Ansieau S, Puisieux A. Generation of breast cancer stem cells through epithelial-mesenchymal transition. PLoS One. 2008;3(8):e2888. | ||
Castro-Vega LJ, Jouravleva K, Ortiz-Montero P, et al. The senescent microenvironment promotes the emergence of heterogeneous cancer stem-like cells. Carcinogenesis. 2015;36(10):1180–1192. | ||
Hartman ZC, Poage GM, den Hollander P, et al. Growth of triple-negative breast cancer cells relies upon coordinate autocrine expression of the proinflammatory cytokines IL-6 and IL-8. Cancer Res. 2013;73(11):3470–3480. | ||
Iliopoulos D, Hirsch HA, Wang G, Struhl K. Inducible formation of breast cancer stem cells and their dynamic equilibrium with non-stem cancer cells via IL6 secretion. Proc Natl Acad Sci U S A. 2011;108(4):1397–1402. | ||
Jolly MK, Boareto M, Huang B, et al. Implications of the hybrid epithelial/mesenchymal phenotype in metastasis. Front Oncol. 2015;5:155. | ||
Nieto MA, Huang R, Jackson RA, Thiery JP. EMT: 2016. Cell. 2016;166(1):21–45. | ||
Droz D, Zachar D, Charbit L, Gogusev J, Chrétein Y, Iris L. Expression of the human nephron differentiation molecules in renal cell carcinomas. Am J Pathol. 1990;137(4):895–905. | ||
Karran L, Jones M, Morley G, et al. Expression of a B-cell marker, CD24, on nasopharyngeal carcinoma cells. Int J Cancer. 1995;60(4):562–566. | ||
Huang LR, Hsu HC. Cloning and expression of CD24 gene in human hepatocellular carcinoma: a potential early tumor marker gene correlates with p53 mutation and tumor differentiation. Cancer Res. 1995;55(20):4717–4721. | ||
Kristiansen G, Denkert C, Schlüns K, Dahl E, Pilarsky C, Hauptmann S. CD24 is expressed in ovarian cancer and is a new independent prognostic marker of patient survival. Am J Pathol. 2002;161(4):1215–1221. | ||
Kristiansen G, Schlüns K, Yongwei Y, Denkert C, Dietel M, Petersen I. CD24 is an independent prognostic marker of survival in nonsmall cell lung cancer patients. Br J Cancer. 2003;88(2):231–236. | ||
Kristiansen G, Winzer KJ, Mayordomo E, et al. CD24 expression is a new prognostic marker in breast cancer. Clin Cancer Res. 2003;9(13):4906–4913. | ||
Jacob J, Bellach J, Grützmann R, et al. Expression of CD24 in adenocarcinomas of the pancreas correlates with higher tumor grades. Pancreatology. 2004;4(5):454–460. | ||
Fang X, Zheng P, Tang J, Liu Y. CD24: from A to Z. Cell Mol Immunol. 2010;7(2):100–103. | ||
Li C, Heidt DG, Dalerba P, et al. Identification of pancreatic cancer stem cells. Cancer Res. 2007;67(3):1030–1037. | ||
Yeung TM, Gandhi SC, Wilding JL, Muschel R, Bodmer WF. Cancer stem cells from colorectal cancer-derived cell lines. Proc Natl Acad Sci U S A. 2010;107(8):3722–3727. | ||
Cram DS, McIntosh A, Oxbrow L, Johnston AM, Deaizpurua HJ. Differential mRNA display analysis of two related but functionally distinct rat insulinoma (RIN) cell lines: identification of CD24 and its expression in the developing pancreas. Differentiation. 1999;64(4):237–246. | ||
Darwish NS, Kim MA, Chang MS, et al. Prognostic significance of CD24 expression in gastric carcinoma. Cancer Res Treat. 2004;36(5):298–302. | ||
Fogel M, Friederichs J, Zeller Y, et al. CD24 is a marker for human breast carcinoma. Cancer Lett. 1999;143(1):87–94. | ||
Kristiansen G, Sammar M, Altevogt P. Tumour biological aspects of CD24, a mucin-like adhesion molecule. J Mol Histol. 2004;35(3):255–262. | ||
Kristiansen G, Machado E, Bretz N, et al. Molecular and clinical dissection of CD24 antibody specificity by a comprehensive comparative analysis. Lab Invest. 2010;90(7):1102–1116. | ||
Lee JH, Kim SH, Lee ES, Kim YS. CD24 overexpression in cancer development and progression: a meta-analysis. Oncol Rep. 2009;22(5):1149–1156. | ||
Lee TK, Castilho A, Cheung VC, Tang KH, Ma S, Ng IO. CD24(+) liver tumor-initiating cells drive self-renewal and tumor initiation through STAT3-mediated NANOG regulation. Cell Stem Cell. 2011;9(1):50–63. | ||
Li C, Lee CJ, Simeone DM. Identification of human pancreatic cancer stem cells. Methods Mol Biol. 2009;568:161–173. | ||
Arik D, Can C, Dündar E, Kabukçuog˘lu S, Pas¸aog˘lu Ö. Prognostic significance of CD24 in clear cell renal cell carcinoma. Pathol Oncol Res. 2017;23(2):409–416. | ||
Lee HJ, Kim DI, Kwak C, Ku JH, Moon KC. Expression of CD24 in clear cell renal cell carcinoma and its prognostic significance. Urology. 2008;72(3):603–607. | ||
Choi D, Lee HW, Hur KY, et al. Cancer stem cell markers CD133 and CD24 correlate with invasiveness and differentiation in colorectal adenocarcinoma. World J Gastroenterol. 2009;15(18):2258–2264. | ||
Ponti D, Zaffaroni N, Capelli C, Daidone MG. Breast cancer stem cells: an overview. Eur J Cancer. 2006;42(9):1219–1224. | ||
Kwon MJ, Han J, Seo JH, et al. CD24 overexpression is associated with poor prognosis in luminal a and triple-negative breast cancer. PLoS One. 2015;10(10):e0139112. | ||
Baumann P, Cremers N, Kroese F, et al. CD24 expression causes the acquisition of multiple cellular properties associated with tumor growth and metastasis. Cancer Res. 2005;65(23):10783–10793. | ||
Bretz N, Noske A, Keller S, et al. CD24 promotes tumor cell invasion by suppressing tissue factor pathway inhibitor-2 (TFPI-2) in a c-Src-dependent fashion. Clin Exp Metastasis. 2012;29(1):27–38. | ||
Lim J, Lee KM, Shim J, Shin I. CD24 regulates stemness and the epithelial to mesenchymal transition through modulation of Notch1 mRNA stability by p38MAPK. Arch Biochem Biophys. 2014;558:120–126. | ||
Smith SC, Oxford G, Wu Z, et al. The metastasis-associated gene CD24 is regulated by Ral GTPase and is a mediator of cell proliferation and survival in human cancer. Cancer Res. 2006;66(4):1917–1922. | ||
Stewart N, Bacchetti S. Expression of SV40 large T antigen, but not small t antigen, is required for the induction of chromosomal aberrations in transformed human cells. Virology. 1991;180(1):49–57. | ||
der-Sarkissian H, Bacchetti S, Cazes L, Londoño-Vallejo JA. The shortest telomeres drive karyotype evolution in transformed cells. Oncogene. 2004;23(6):1221–1228. | ||
Schmittgen TD, Livak KJ. Analyzing real-time PCR data by the comparative C(T) method. Nat Protoc. 2008;3(6):1101–1108. | ||
Dontu G, Abdallah WM, Foley JM, et al. In vitro propagation and transcriptional profiling of human mammary stem/progenitor cells. Genes Dev. 2003;17(10):1253–1270. | ||
Rodríguez-Pardo VM, Vernot JP. Mesenchymal stem cells promote a primitive phenotype CD34+c-kit+ in human cord blood-derived hematopoietic stem cells during ex vivo expansion. Cell Mol Biol Lett. 2013;18(1):11–33. | ||
Visvader JE. Cells of origin in cancer. Nature. 2011;469(7330):314–322. | ||
May CD, Sphyris N, Evans KW, Werden SJ, Guo W, Mani SA. Epithelial-mesenchymal transition and cancer stem cells: a dangerously dynamic duo in breast cancer progression. Breast Cancer Res. 2011;13(1):202–211. | ||
Morel AP, Hinkal GW, Thomas C, et al. EMT inducers catalyze malignant transformation of mammary epithelial cells and drive tumorigenesis towards claudin-low tumors in transgenic mice. PLoS Genet. 2012;8(5):e1002723. | ||
Dean M, Fojo T, Bates S. Tumour stem cells and drug resistance. Nat Rev Cancer. 2005;5(4):275–284. | ||
Imrich S, Hachmeister M, Gires O. EpCAM and its potential role in tumor-initiating cells. Cell Adhes Migr. 2012;6(1):30–38. | ||
Munz M, Baeuerle PA, Gires O. The emerging role of EpCAM in cancer and stem cell signaling. Cancer Res. 2009;69(14):5627–5629. | ||
Ginestier C, Hur MH, Charafe-Jauffret E, et al. ALDH1 is a marker of normal and malignant human mammary stem cells and a predictor of poor clinical outcome. Cell Stem Cell. 2007;1(5):555–567. | ||
Xu X, Chai S, Wang P, et al. Aldehyde dehydrogenases and cancer stem cells. Cancer Lett. 2015;369(1):50–57. | ||
Bussolati B, Dekel B, Azzarone B, Camussi G. Human renal cancer stem cells. Cancer Lett. 2013;338(1):141–146. | ||
Bruno S, Bussolati B, Grange C, et al. CD133+ renal progenitor cells contribute to tumor angiogenesis. Am J Pathol. 2006;169(6):2223–2235. | ||
Collins AT, Berry PA, Hyde C, Stower MJ, Maitland NJ. Prospective identification of tumorigenic prostate cancer stem cells. Cancer Res. 2005;65(23):10946–10951. | ||
Ricci-Vitiani L, Lombardi DG, Pilozzi E, et al. Identification and expansion of human colon-cancer-initiating cells. Nature. 2007;445(7123):111–115. | ||
Singh SK, Hawkins C, Clarke ID, et al. Identification of human brain tumour initiating cells. Nature. 2004;432(7015):396–401. | ||
Clarke MF, Dick JE, Dirks PB, et al. Cancer stem cells-perspectives on current status and future directions: AACR Workshop on cancer stem cells. Cancer Res. 2006;66(19):9339–9344. | ||
Nguyen DX, Bos PD, Massagué J. Metastasis: from dissemination to organ-specific colonization. Nat Rev Cancer. 2009;9(4):274–284. | ||
Lim E, Vaillant F, Wu D, et al. Aberrant luminal progenitors as the candidate target population for basal tumor development in BRCA1 mutation carriers. Nat Med. 2009;15(8):907–913. | ||
Passalidou E, Trivella M, Singh N, et al. Vascular phenotype in angiogenic and non-angiogenic lung non-small cell carcinomas. Br J Cancer. 2002;86(2):244–249. | ||
Shirakawa K, Kobayashi H, Heike Y, et al. Hemodynamics in vasculogenic mimicry and angiogenesis of inflammatory breast cancer xenograft hemodynamics in vasculogenic mimicry and angiogenesis of inflammatory breast. Cancer Res. 2002;62(2):560–566. | ||
Celià-Terrassa T, Meca-Cortés O, Mateo F, et al. Epithelial-mesenchymal transition can suppress major attributes of human epithelial tumor-initiating cells. J Clin Invest. 2012;122(5):1849–1868. | ||
Sarrio D, Franklin CK, Mackay A, Reis-Filho JS, Isacke CM. Epithelial and mesenchymal subpopulations within normal basal breast cell lines exhibit distinct stem cell/progenitor properties. Stem Cells. 2012;30(2):292–303. | ||
Clark AG, Vignjevic DM. Modes of cancer cell invasion and the role of the microenvironment. Curr Opin Cell Biol. 2015;36:13–22. | ||
Wolf K, Friedl P. Molecular mechanisms of cancer cell invasion and plasticity. Br J Dermatol. 2006;154 Suppl 1:11–15. | ||
Chang JC. Cancer stem cells: role in tumor growth, recurrence, metastasis, and treatment resistance. Medicine. 2016;95(1 Suppl 1):S20–25. | ||
Nishi M, Sakai Y, Akutsu H, et al. Induction of cells with cancer stem cell properties from nontumorigenic human mammary epithelial cells by defined reprogramming factors. Oncogene. 2014;33(5):643–652. | ||
Giampieri S, Manning C, Hooper S, Jones L, Hill CS, Sahai E. Localized and reversible TGFbeta signalling switches breast cancer cells from cohesive to single cell motility. Nat Cell Biol. 2009;11(11):1287–1296. | ||
Hai J, Zhu CQ, Bandarchi B, et al. L1 cell adhesion molecule promotes tumorigenicity and metastatic potential in non-small cell lung cancer. Clin Cancer Res. 2012;18(7):1914–1924. | ||
Turaga SM, Lathia JD. Adhering towards tumorigenicity: altered adhesion mechanisms in glioblastoma cancer stem cells. CNS Oncol. 2016;5(4):251–259. | ||
Hermann PC, Huber SL, Herrler T, et al. Distinct populations of cancer stem cells determine tumor growth and metastatic activity in human pancreatic cancer. Cell Stem Cell. 2007;1(3):313–323. | ||
Li W, Ma H, Zhang J, Zhu L, Wang C, Yang Y. Unraveling the roles of CD44/CD24 and ALDH1 as cancer stem cell markers in tumorigenesis and metastasis. Sci Rep. 2017;7(1):13856. | ||
Knoepp SM, Kunju LP, Roh MH. Utility of PAX8 and PAX2 immunohistochemistry in the identification of renal cell carcinoma in diagnostic cytology. Diagn Cytopathol. 2012;40(8):667–672. | ||
Ozcan A, de La Roza G, Ro JY, Shen SS, Truong LD. PAX2 and PAX8 expression in primary and metastatic renal tumors: a comprehensive comparison. Arch Pathol Lab Med. 2012;136(12):1541–1551. | ||
Hsieh CH, Hsiung SC, Yeh CT, et al. Differential expression of CD44 and CD24 markers discriminates the epitheliod from the fibroblastoid subset in a sarcomatoid renal carcinoma cell line: evidence suggesting the existence of cancer stem cells in both subsets as studied with sorted cells. Oncotarget. 2017;8(9):15593–15609. |
Supplementary materials
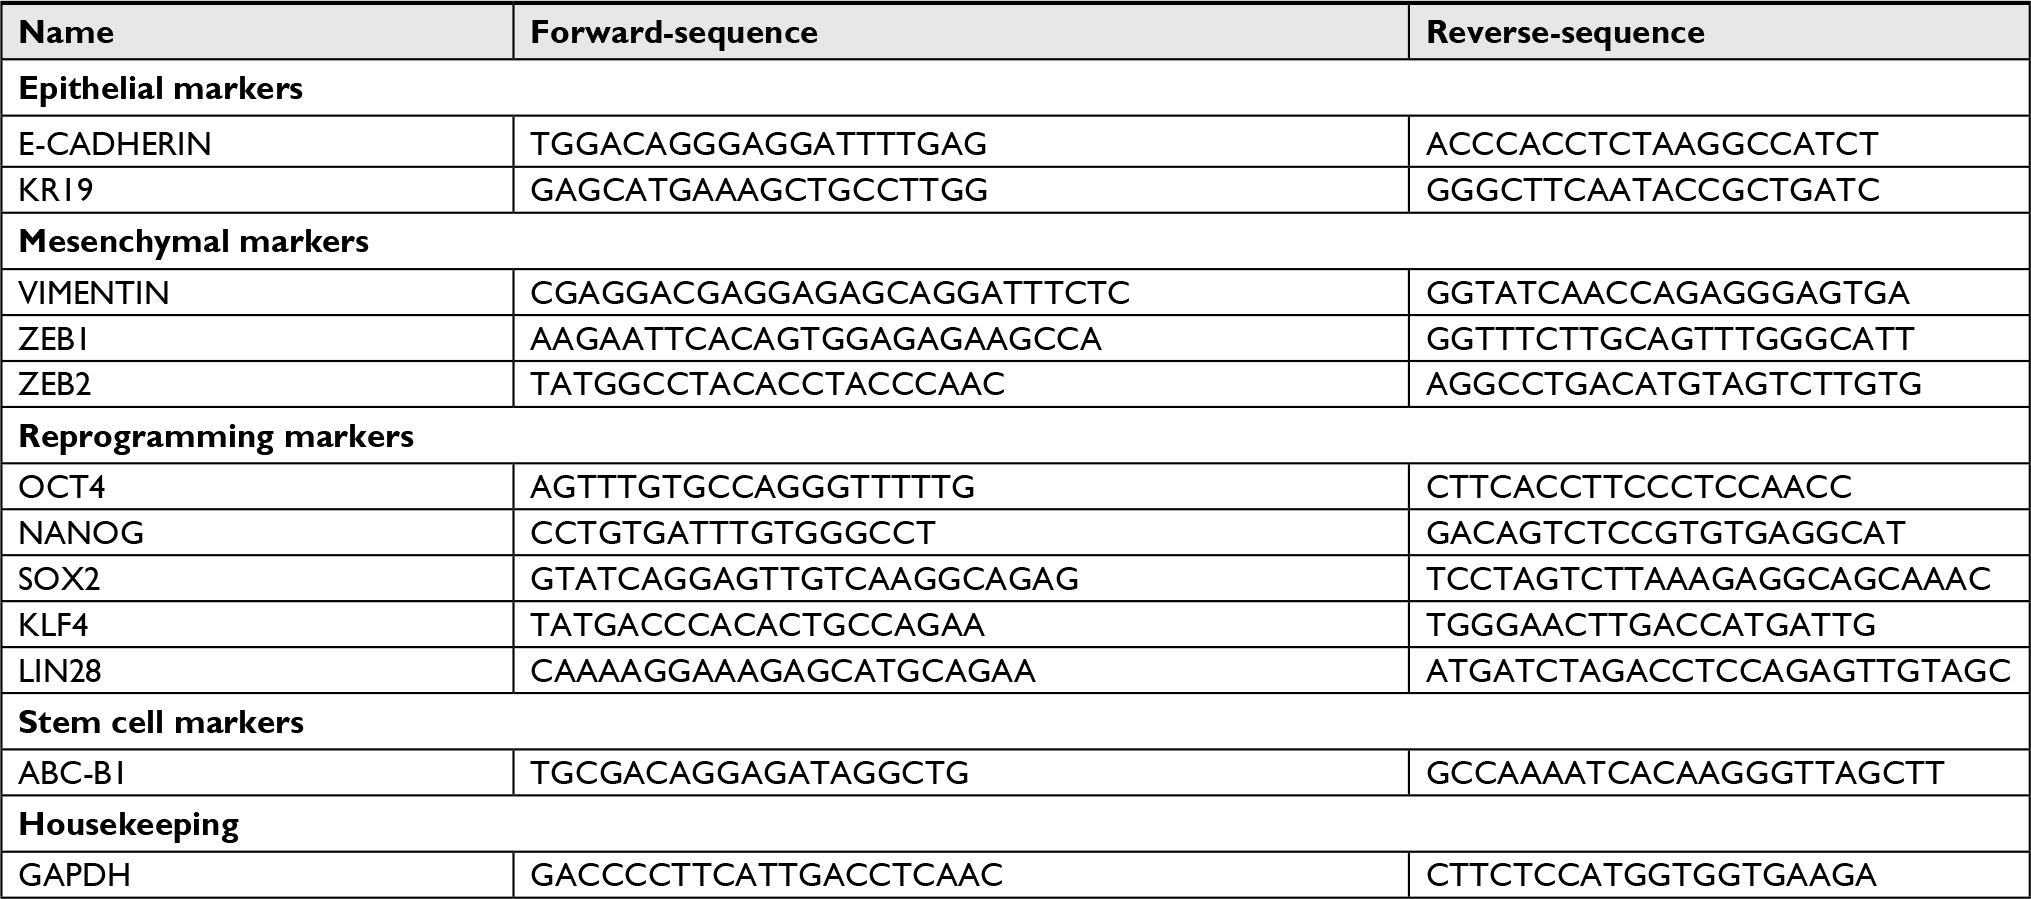 | Table S1 Primer sequences Abbreviation: GAPDH, glyceraldehyde 3-phosphate dehydrogenase. |
 | Figure S1 Early evaluations of the differentiation capacity did not reveal differences between CD44+CD24Neg and CD44+CD24Pos cells. Notes: Differentiation to adipocytes (stained with oil red-O), osteoblasts (stained for alkaline phosphatase activity), and chondrocytes (stained with Safranin O) mesenchymal cell lineages was induced by standard protocols. Differentiation was evaluated after 3 days of induction. Representative images (20×) and image enlargements from the experiment are shown. Abbreviations: Neg, negative; Pos, positive. |
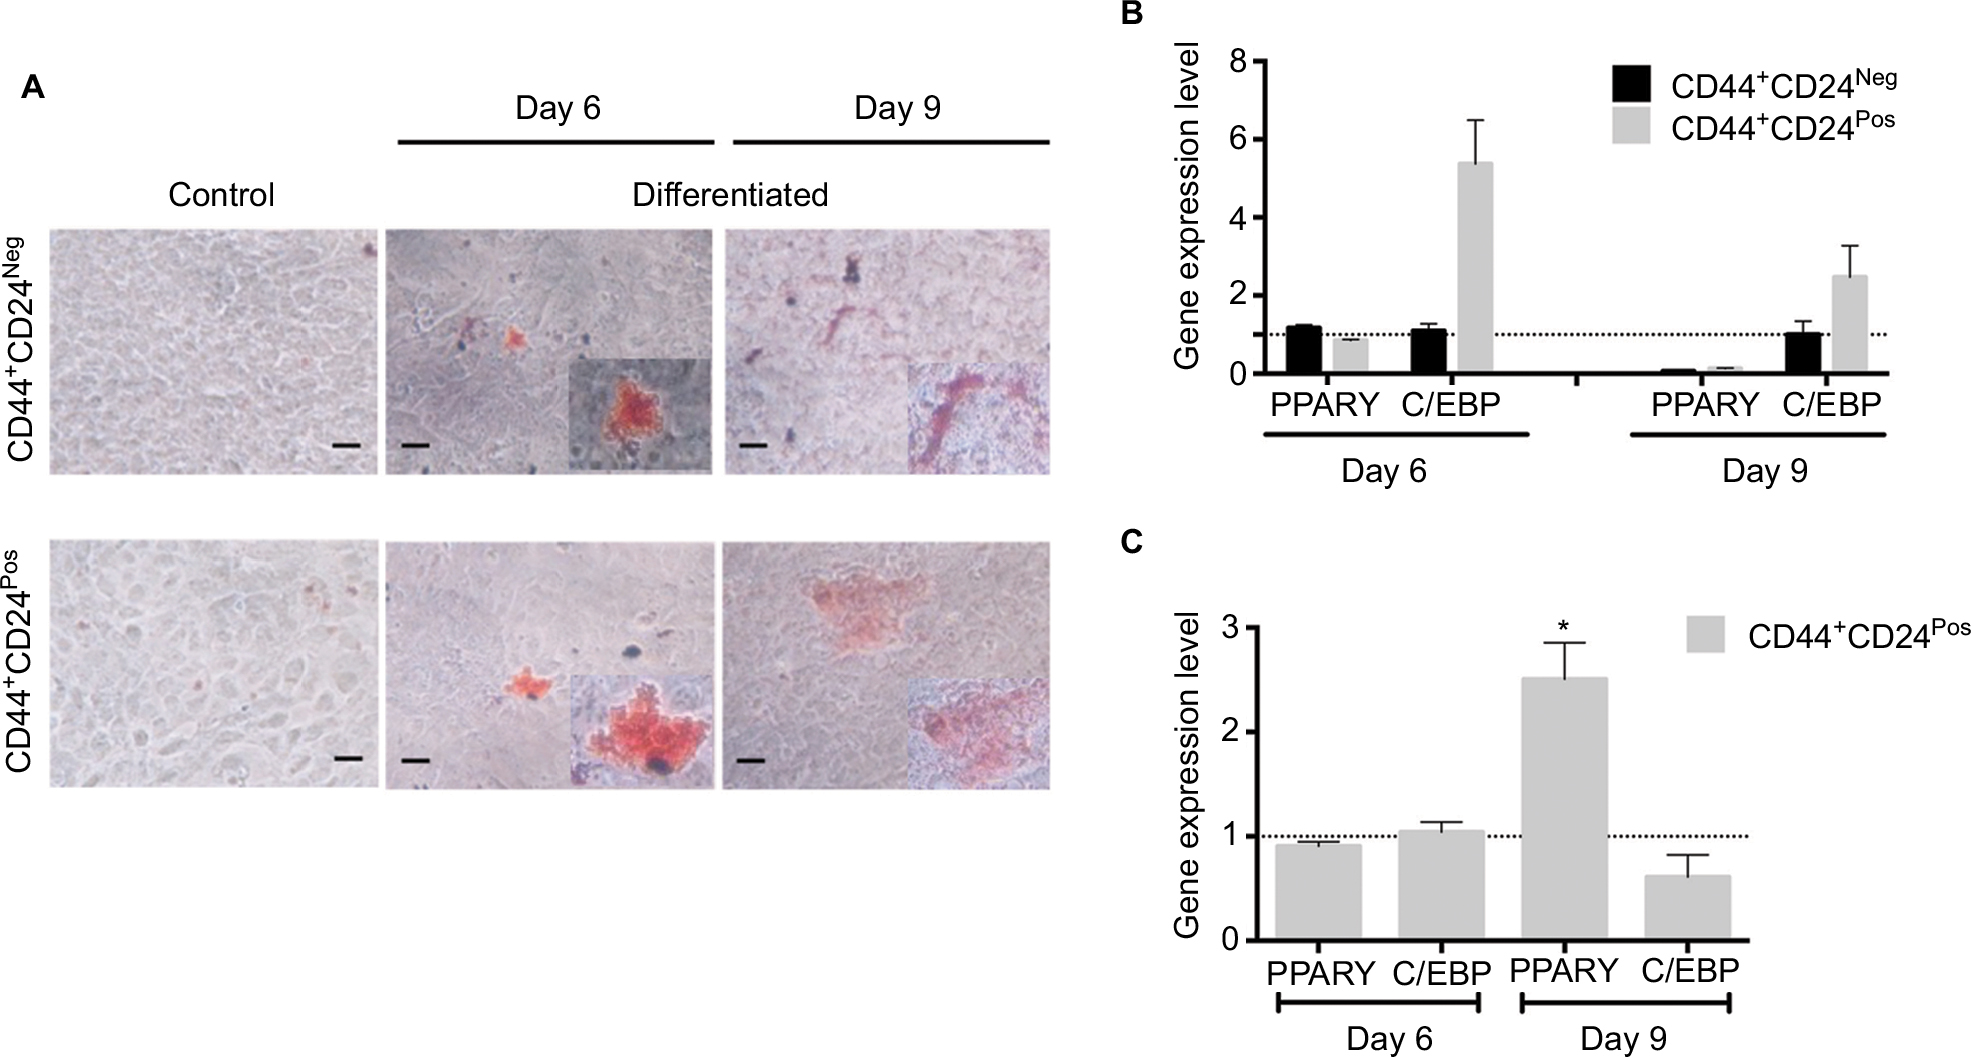 | Figure S2 CD44+CD24Pos cells show more efficient adipogenic differentiation capacity. Notes: (A) Adipogenic differentiation was evaluated after 6 and 9 days of induction by oil red-O staining. Relative gene expression levels of PPARγ and CBPF involved in adipogenic differentiation were determined by qRT-PCR; the values were normalized to (B) GAPDH and relative to control cells (undifferentiated) or to (C) CD44+CD24Neg cells. Error bars represent SEM (*P<0.05). Abbreviation: GAPDH, glyceraldehyde 3-phosphate dehydrogenase; Neg, negative; Pos, positive. |
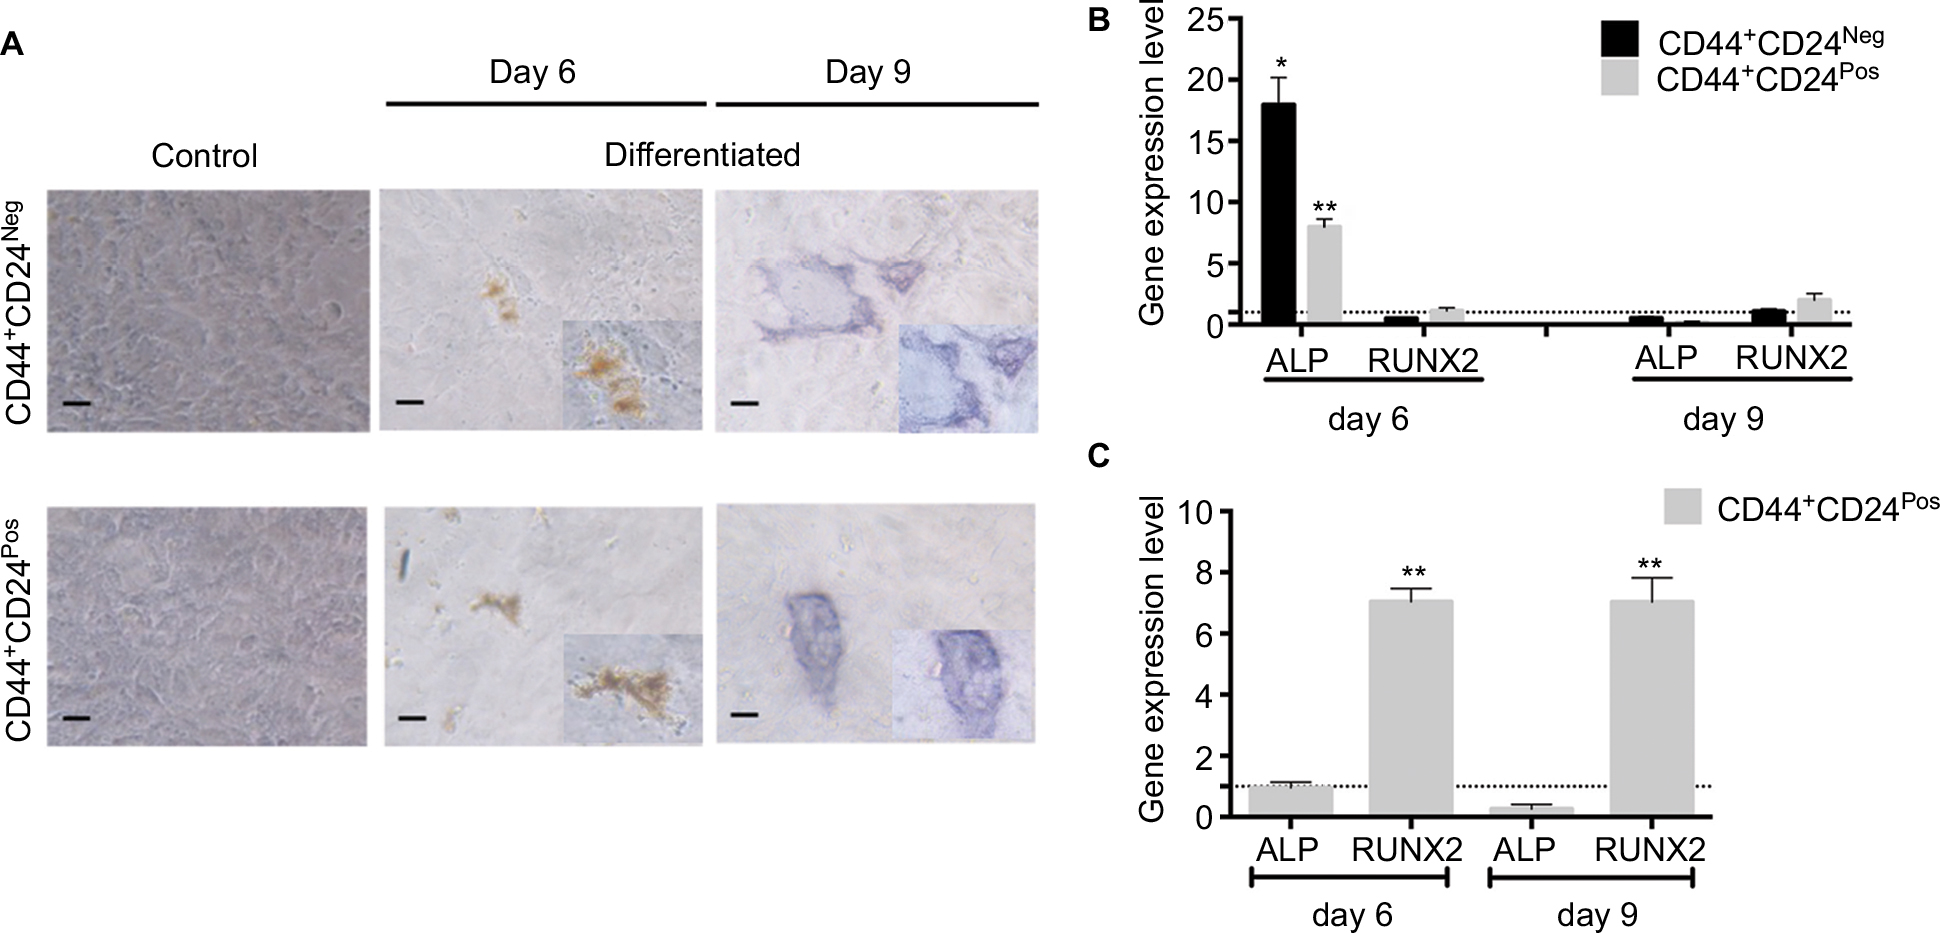 | Figure S3 CD44+CD24Pos cells show more efficient osteogenic differentiation capacity. Notes: (A) Osteogenic differentiation was evaluated after 6 and 9 days of induction by alkaline phosphatase staining. Relative gene expression levels of ALP and RUNX2 involved in osteogenic differentiation were determined by qRT-PCR; the values were normalized to (B) GAPDH and relative to control cells (undifferentiated) or to (C) CD44+CD24Neg cells. Error bars represent SEM (*P<0.05; **P<0.01). Abbreviations: ALP, alkaline phosphatase; GAPDH, glyceraldehyde 3-phosphate dehydrogenase; Neg, negative; Pos, positive. |
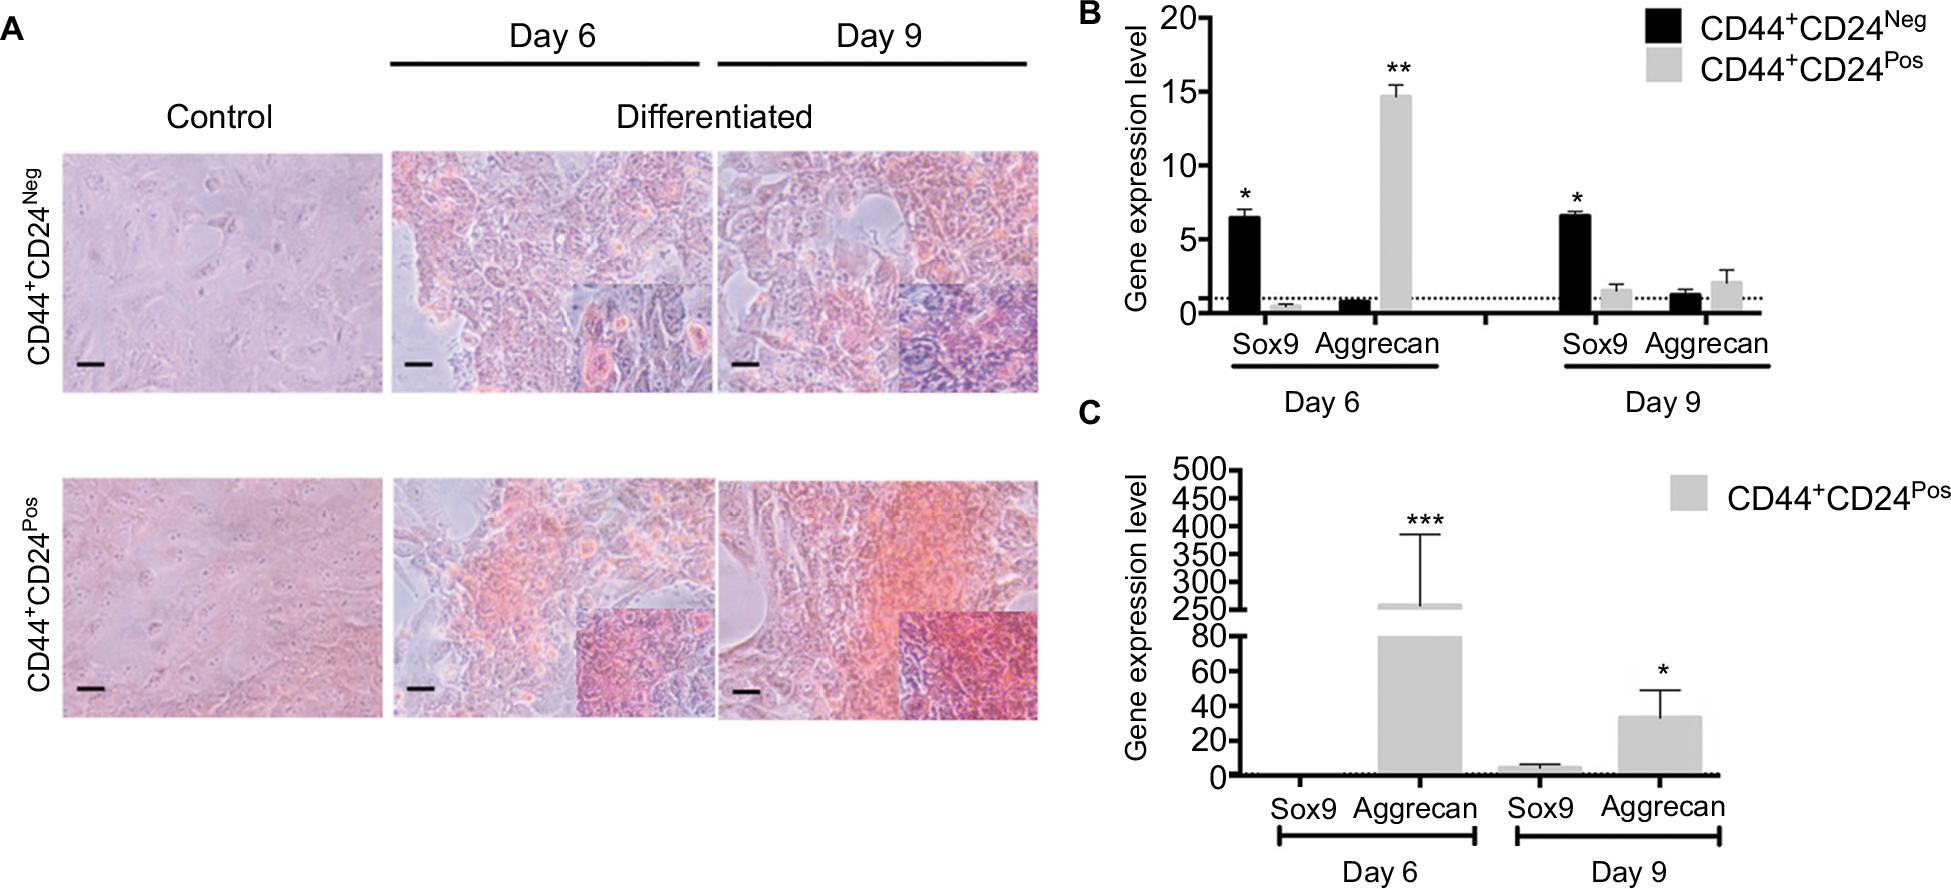 | Figure S4 CD44+CD24Pos cells show more efficient chondrogenic differentiation capacity. Notes: (A) Chondrogenic differentiation was evaluated after 6 and 9 days of induction by Safranin O staining. Relative gene expression levels of SOX9 and AGGRECAN involved in chondrogenic differentiation were determined by qRT-PCR; the values were normalized to (B) GAPDH and relative to control cells (undifferentiated) or to (C) CD44+CD24Neg cells. Error bars represent SEM (*P<0.05; **P<0.01; ***P<0.001). Abbreviation: GAPDH, glyceraldehyde 3-phosphate dehydrogenase; Neg, negative; Pos, positive. |
 © 2018 The Author(s). This work is published and licensed by Dove Medical Press Limited. The full terms of this license are available at https://www.dovepress.com/terms.php and incorporate the Creative Commons Attribution - Non Commercial (unported, v3.0) License.
By accessing the work you hereby accept the Terms. Non-commercial uses of the work are permitted without any further permission from Dove Medical Press Limited, provided the work is properly attributed. For permission for commercial use of this work, please see paragraphs 4.2 and 5 of our Terms.
© 2018 The Author(s). This work is published and licensed by Dove Medical Press Limited. The full terms of this license are available at https://www.dovepress.com/terms.php and incorporate the Creative Commons Attribution - Non Commercial (unported, v3.0) License.
By accessing the work you hereby accept the Terms. Non-commercial uses of the work are permitted without any further permission from Dove Medical Press Limited, provided the work is properly attributed. For permission for commercial use of this work, please see paragraphs 4.2 and 5 of our Terms.