Back to Journals » International Journal of Chronic Obstructive Pulmonary Disease » Volume 21
Cardiopulmonary Exercise Testing and Quantitative Chest CT in COPD: The Stronger Association of Emphysema Over Airway Thickness with Functional Impairment
Authors Peng Y, Shi M, Yu C ![]() , Yang T
, Yang T ![]() , Huang K
, Huang K ![]()
Received 21 January 2026
Accepted for publication 18 June 2026
Published 23 June 2026 Volume 2026:21 597874
DOI https://doi.org/10.2147/COPD.S597874
Checked for plagiarism Yes
Review by Single anonymous peer review
Peer reviewer comments 2
Editor who approved publication: Prof. Dr. Zijing Zhou
Yaodie Peng,1,2,* Minghui Shi,2,* Chunyan Yu,2 Ting Yang,1,2 Ke Huang2
1PekingUniversity China-Japan Friendship School of Clinical Medicine, Beijing, People’s Republic of China; 2National Center for Respiratory Medicine; State Key Laboratory of Respiratory Health and Multimorbidity; National Clinical Research Center for Respiratory Diseases; Institute of Respiratory Medicine, Chinese Academy of Medical Sciences; Department of Pulmonary and Critical Care Medicine, Center of Respiratory Medicine, China-Japan Friendship Hospital, Beijing, People’s Republic of China
*These authors contributed equally to this work
Correspondence: Ke Huang, Email [email protected] Ting Yang, Email [email protected]
Introduction: The relationship between cardiopulmonary function and chest structure, particularly the square root of wall area of a hypothetical airway with a luminal perimeter of 10 mm (Pi10), in patients with chronic obstructive pulmonary disease (COPD) remains unclear. This study aims to compare cardiopulmonary function across computed tomography (CT) phenotypes and to evaluate the association between emphysema, airway thickness and cardiopulmonary function, respectively.
Methods: Patients with stable COPD were recruited and underwent pulmonary function testing, CT, and cardiopulmonary exercise testing (CPET). Emphysema was assessed using the percentage of low attenuation areas < − 950 Hounsfield units (%LAA-950), and airway wall thickness was evaluated with Pi10. Based on these two CT metrics, patients were categorized into four phenotypes: normal, emphysema-dominant (E-dominant), airway-dominant (A-dominant), and mixed. Pearson’s correlation and Multiple linear regression were conducted to assess the relationship between %LAA-950, Pi10 and cardiopulmonary function.
Results: Ninety-three patients were enrolled in this study. Individuals with E-dominant phenotype and mixed phenotype had lower FEV1/FVC, and those with E-dominant phenotype had worse ventilatory efficiency (VD/VTpeak and VE/VCO2 slope). %LAA-950 showed negative correlations with VO2peak (β = − 0.288, p = 0.004) and VO2peak%pred (β = − 0.244, p = 0.027) and positive correlations with VD/VTpeak (β = 0.272, p = 0.017), VE/VCO2AT (β = 0.285, p = 0.011) and VE/VCO2 slope (β = 0.276, p = 0.026). However, Pi10 exhibited no significant associations with the studied CPET variables.
Conclusion: Patients with emphysema are more likely to have reduced exercise endurance and ventilatory efficiency during exercise. Emphysema may be a better indicator of cardiopulmonary function than airway thickness.
Keywords: chronic obstructive pulmonary disease, computed tomography, emphysema, Pi10, cardiopulmonary exercise test
Introduction
Chronic Obstructive Pulmonary Disease (COPD) is one of the major health threats globally, and in China, the prevalence of COPD is as high as 8.6% among adults over 20 years of age.1 Significant heterogeneity exists among individuals with COPD in areas including respiratory symptoms, chest imaging, etc. COPD is characterized by persistent airflow limitation that is affected by a combination of small airway disease and lung parenchymal destruction. High-resolution computed tomography (HRCT) enables objective quantification of emphysema severity and airway morphology,2 and is widely used in the diagnosis and phenotyping of COPD.3 Currently, the four main phenotypes are as follows: normal, emphysema-dominant, airway-dominant and mixed, and previous studies showed there are some significant differences in the clinical characteristics of the phenotypes.4–6 The percentage of low attenuation areas < −950 Hounsfield units (%LAA-950), wall area percentage (WA%) and square root of wall area of a hypothetical airway with a luminal perimeter of 10 mm (Pi10) are representative CT quantitative parameters. The former is commonly used to evaluate emphysema, and the latter two quantify airway wall thickness.
Cardiopulmonary function is significantly associated with survival in patients with COPD,7 and can aid in formulating rehabilitation and other therapeutic programs.8,9 The cardiopulmonary exercise testing (CPET) is regarded as the gold standard for objectively evaluating the overall cardiopulmonary metabolic function.10 It has been validated that exercise capacity is significantly lower in COPD compared to the healthy population.9 Understanding the association between CT phenotypes and exercise capacity may help clinicians identify high-risk patients and guide personalized rehabilitation strategies, particularly in settings where CPET is not readily available. Some studies assessed the relationship between %LAA-950, WA% and cardiopulmonary function during exercise,5,11,12 yet no available data evaluate the correlation of Pi10 with CPET-derived variables, nor have studies compared cardiopulmonary function across CT phenotypes stratified by %LAA-950 and Pi10. Therefore, this study aims to compare cardiopulmonary function across CT phenotypes based on %LAA-950 and Pi10 and to evaluate the relationship between emphysema (%LAA-950), airway wall thickening (Pi10) and cardiopulmonary function evaluated by CPET in patients with stable COPD.
Methods
Study Participants
This study recruited outpatients with stable COPD at China–Japan Friendship Hospital. Inclusion criteria: meeting the global initiative for chronic obstructive lung disease (GOLD) diagnostic criteria for COPD;13 no history of acute exacerbation within the past 3 months. Exclusion criteria: asthma, interstitial lung disease, primary pulmonary hypertension, left ventricular dysfunction, muscular and peripheral vascular disease; received long-term oxygen therapy; and received any pulmonary rehabilitation. The eligible patients completed a clinical questionnaire, and conducted HRCT, pulmonary function tests and CPET. The questionnaire covered demographic profiles, smoking status, and comorbidity information. The recruitment period was between July 2022 and August 2024. A total of 127 patients were recruited, among whom 93 completed all required assessments. The number of patients was determined by the availability.
Pulmonary Function Test
Pulmonary function tests were performed before CPET according to international recommendations,14 recording FVC, FEV1, FEV1%pred, and FEV1/FVC (Jaeger Masterscreen, Germany). The degree of impaired lung function in participants was graded according to the GOLD guidelines.13
Cardiopulmonary Exercise Test
Standard CPET (Jaeger Masterscreen, Germany) was conducted according to international recommendations.10 The protocol included: a 2-min rest phase (0 W), a 3-min warm-up phase (20 W), test phase (20 W/2min load increments). Participants were instructed to maintain the pedal frequency of 60–65 rotations per minute.
Oxygen uptake (VO2), carbon dioxide production (VCO2), ventilation (VE), tidal volume (VT), dead space volume (VD) and heart rate (HR) at peak and VO2 at the anaerobic threshold (AT) were recorded. VO2 and VE at peak were recorded as the mean value during the last 15 seconds of test phase. The AT was determined by the V slope and ventilation equivalent method.15 The VO2-HR ratio (VO2/HR), physiological VD-VT ratio (VD/VT), and VE-VCO2 ratio (VE/VCO2) were calculated. Excluding data above the ventilation compensation point, the VE and VCO2 measured every 10 seconds were fitted to a linear VE/VCO2 regression function, where the slope values were obtained.
High-Resolution Computed Tomography and COPD Phenotyping
Participants underwent HRCT scan at full inspiration in the supine position. The images were obtained with a slice thickness of 1 mm and a resolution of 512×512 mm (Genesis, Canon Medical System, Japan). All images were analyzed using the FACT-Digital LungTM software (DeXin, Xi’an, China).
Emphysema was evaluated by %LAA-950.16 Airway wall thickness was assessed using the Pi10,17 calculated by linear regression of the corresponding data for each measurement segment.18 As the 15% cut-off of %LAA-950 was commonly used to define emphysema,5,19,20 and the 75th percentile of Pi10 was selected by referencing prior studies that adopted the 75th percentile of %WA for phenotyping.5,21 Using these two thresholds, enrolled patients were stratified into four phenotypes: normal phenotype, %LAA-950 ≤15% and Pi10 ≤75th percentile; airway-dominant phenotype (A-dominant), %LAA-950 ≤15% and Pi10 >75th percentile; emphysema-dominant phenotype (E-dominant), %LAA-950 >15% and Pi10 ≤75th percentile; and mixed phenotype, %LAA-950 >15% and Pi10 >75th percentile.
Statistics
Categorical variables were reported as the number and percentages. Continuous variables were presented as mean ± standard deviation or median and interquartile range according to the normality tested by the Shapiro–Wilk test. Categorical variables were compared using the  test or the Fisher exact test and continuous variables with the ANOVA or the Kruskal–Wallis test. Post hoc pairwise comparisons were conducted using the Tukey’s test (following ANOVA) or Dunn’s test with Bonferroni correction (following Kruskal–Wallis). Pearson’s correlation coefficient (r) was used to assess the relationship between continuous variables. Multivariate regression linear models were conducted to identify the predicting variables. The models were adjusted for sex, age, BMI and history of hypertension or diabetes. IBM SPSS Statistics for Windows, version 27.0 (IBMCorp., Armonk, N.Y., USA) was used for statistical analysis. p < 0.05 denoted a statistically significant difference.
Results
A total of 93 patients (77 male and 16 female) with stable COPD were enrolled in the study, and the median age was 63 years. Levels of airflow limitation were mostly mild and moderate, with 46 (49.46%) participants classified as GOLD1, 37 (39.78%) as GOLD2, 7 (7.53%) as GOLD3 and 3 (3.23%) as GOLD4. The values of %LAA-950 and Pi10 were 14.72±10.37% and 4.29±0.13 mm. The 75th percentile for Pi10, used to classify the CT phenotypes, was 4.3764 mm. After phenotyping using %LAA-950 and Pi10, 45 (48.39%) were categorized as normal phenotype, 9 (9.68%) as A-dominant, 25 (26.88%) as E-dominant and 14 (15.05%) as Mixed. Characteristics of patients with CT phenotypes were described in Table 1. Individuals with the mixed and E-dominant phenotype had lower FEV1/FVC compared to those with normal phenotype.
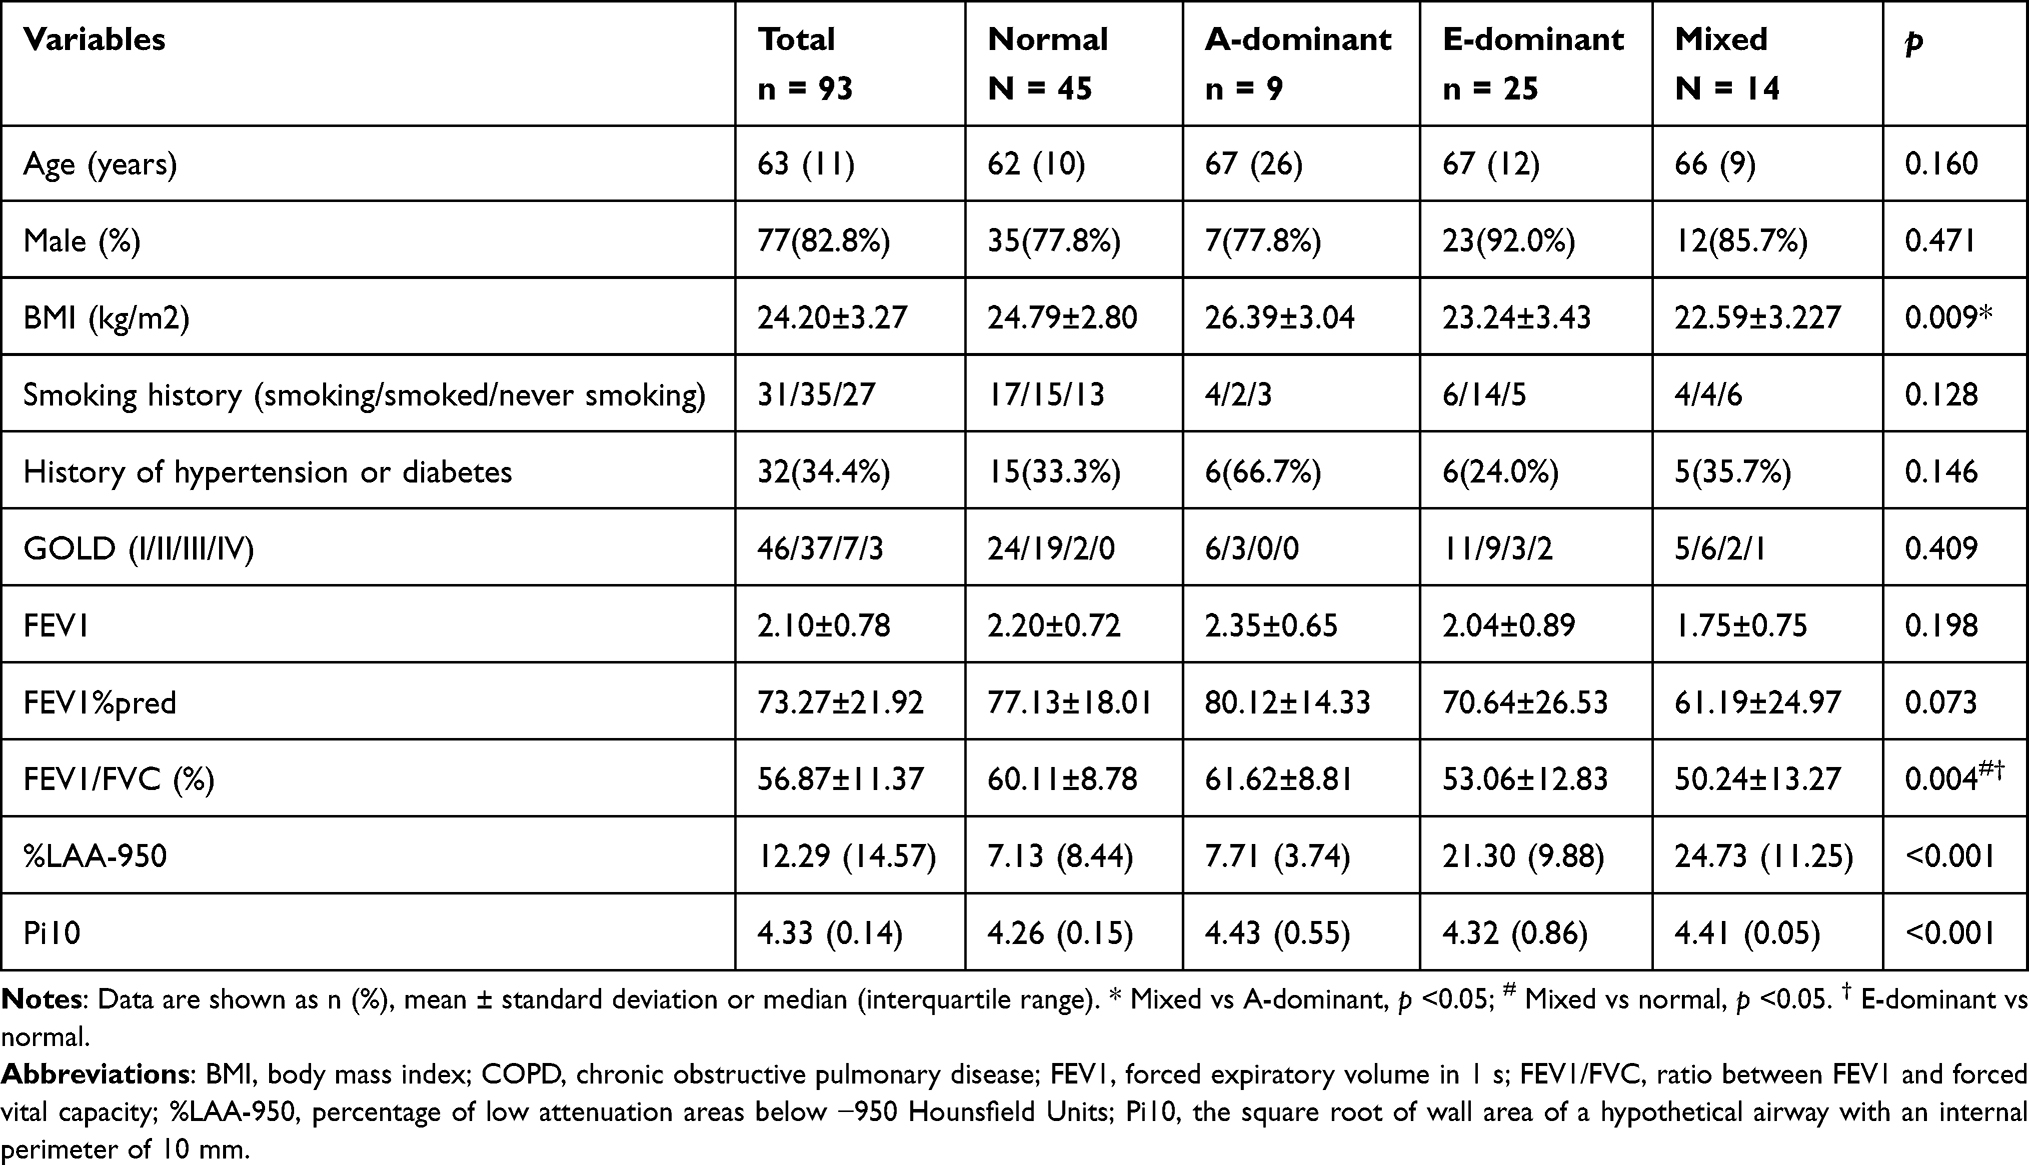 |
Table 1 Characteristics of Participants with COPD by CT Phenotypes |
The details of CPET measurements across the four CT phenotypes were shown in Table 2. VO2peak was decreased in participants with COPD, as 51.6% (n = 48) exhibited a VO2%predpeak value less than 80%. Individuals with E-dominant phenotype had higher VD/VT compared to those with normal phenotype (p = 0.029) and also had higher VE/VCO2 slope than the normal (p = 0.034) and A-dominant phenotypes (p = 0.036) (Figure 1).
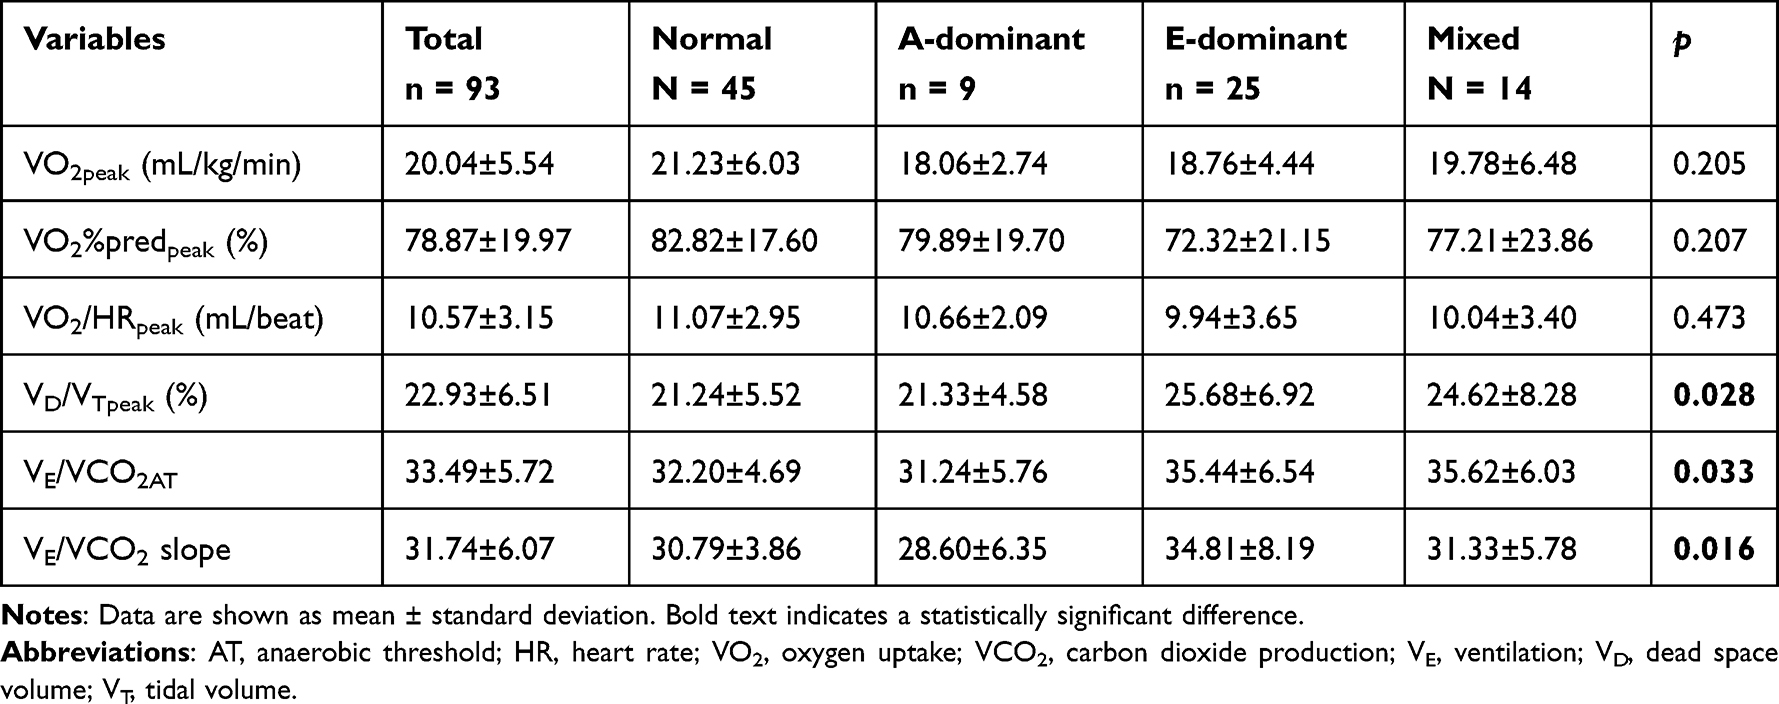 |
Table 2 Comparisons of CPET Parameters Among Four CT-Based Phenotypes |
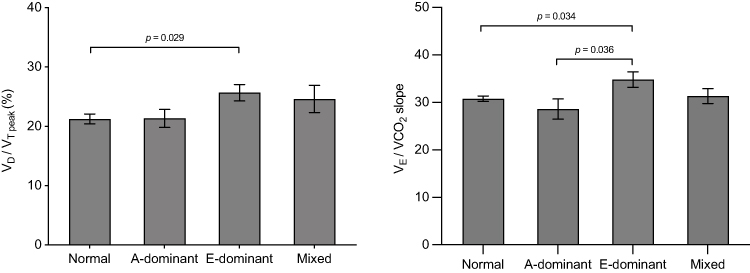 |
Figure 1 Comparison of exercise ventilation response among four CT-based phenotypes. The data are presented as mean ± standard error of the mean. |
We also compared the ventilation response according to the distribution in quartiles for %LAA-950 and Pi10. The distributions of VD/VTpeak and VE/VCO2AT in the %LAA-950 quartiles are demonstrated in Figure 2. Individuals with sever emphysema had increased VD/VTpeak and VE/VCO2AT. However, no significant differences were seen in the distribution of Pi10 for the studied CPET variables.
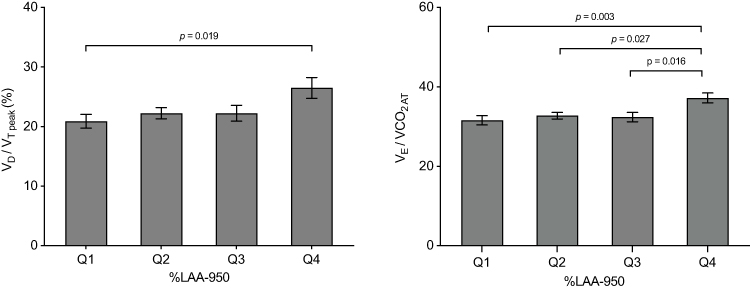 |
Figure 2 Distributions of exercise ventilation response in the %LAA-950 quartiles. The data are presented as mean ± standard error of the mean. |
Pearson correlation analyses were conducted to investigate the association between CT and CPET variables (Table 3). %LAA-950 was significantly correlated with exercise endurance and ventilatory response: it correlated negatively with VO2peak, VO2%predpeak, Wpeak and VO2/HRpeak, and positively with VD/VTpeak, VE/VCO2AT and VE/VCO2 slope. No significant correlation was observed in the analysis between Pi10 and enrolled CPET variables.
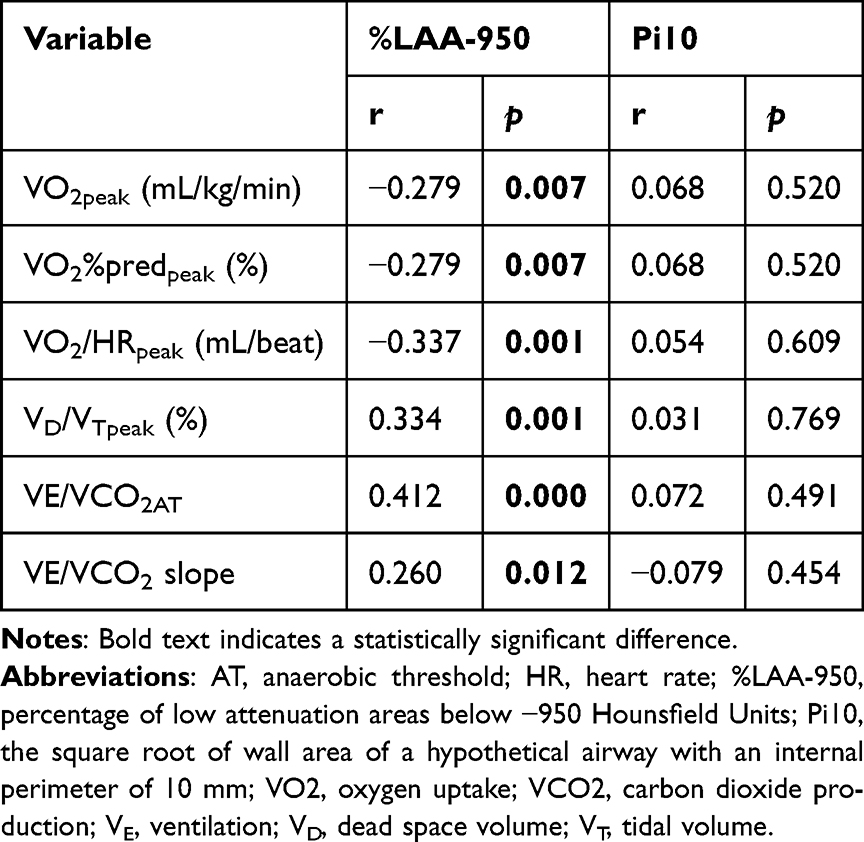 |
Table 3 Pearson’s Correlation Analysis Between CT and CPET Variables |
In the total participants, linear regressions were conducted to identify the predicting variables of cardiopulmonary exercise response (Table 4). In the adjusted model, individuals with severer emphysema had lower VO2peak and VO2%predpeak (B = −0.151, 95% CI −0.253/-0.048, β = −0.288, p = 0.004 and B = −0.461, 95% CI −0.867/-0.054, β = −0.244, p = 0.027, respectively), also had higher VD/VTpeak, VE/VCO2AT, and VE/VCO2 slope (B = 0.170, 95% CI 0.032/0.308, β = 0.272, p = 0.017, B = 0.154, 95% CI 0.036/0.272, β = 0.285, p = 0.011 and B = 0.158, 95% CI 0.019/0.297, β = 0.276, p = 0.026, respectively). %LAA-950 was the independent predictive variable for VO2/HRpeak in unadjusted model, but did not see it in adjusted model. No significant results were seen in the linear regression analysis of Pi10 and CPET variables.
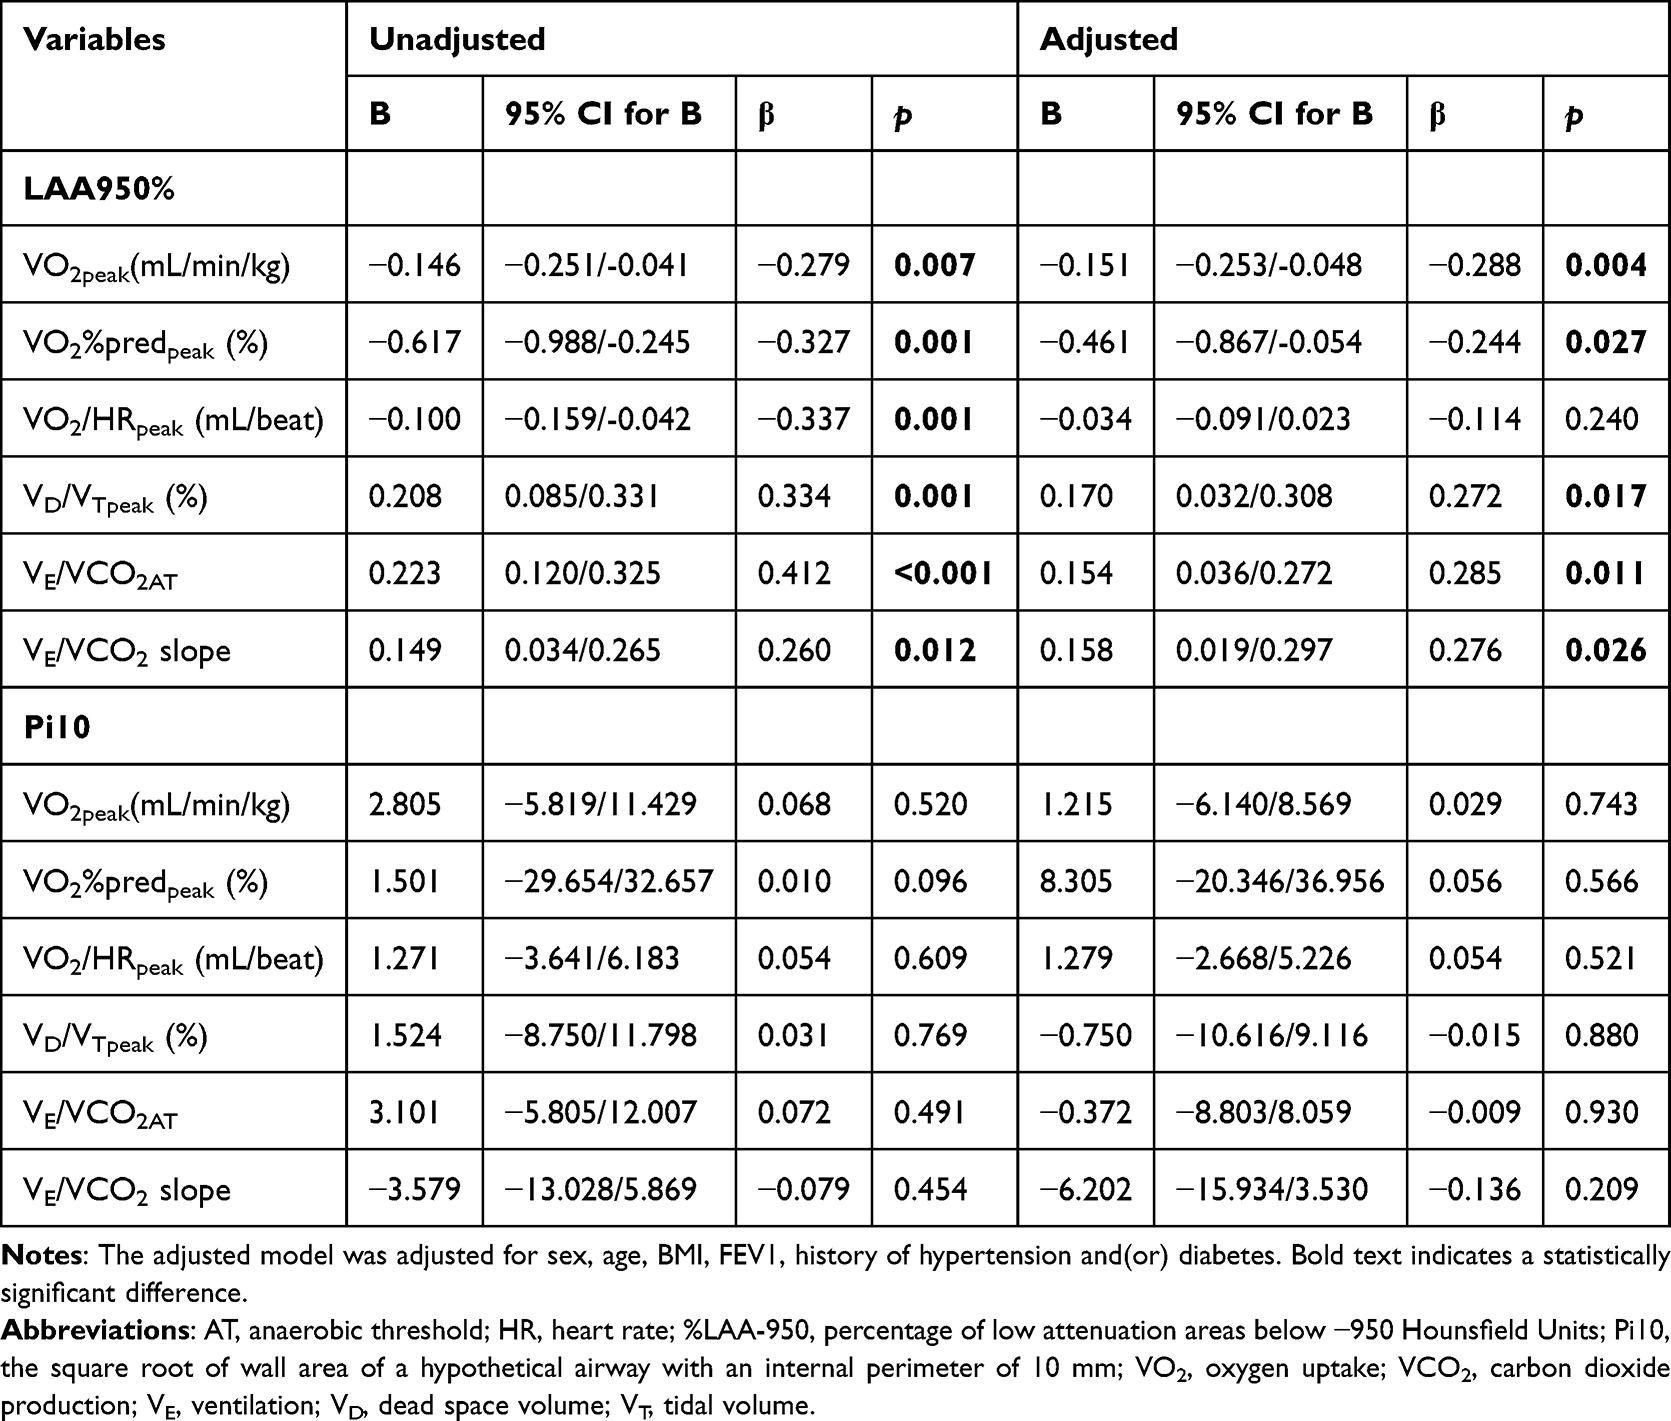 |
Table 4 Unadjusted and Adjusted Linear Regressions for CPET Variables and CT Measurements |
Discussion
This study demonstrated the different effects of emphysema (%LAA-950) and airway wall thickening (Pi10) on cardiopulmonary function assessed by CPET. We found: (1) individuals with E-dominant and mixed phenotype had severer airflow obstruction and those with E-dominant phenotype had worse ventilatory efficiency. (2) Compared with Pi10, %LAA-950 is more associated with exercise and ventilation capacity, and served as an independently predictive factor of VO2peak, VO2%predpeak, VD/VTpeak, VE/VCO2AT and VE/VCO2 slope.
Since the phenotypes are formed by combining %LAA-950 and Pi10, and no significant correlation was found between Pi10 and lung function or CPET parameters, the phenotype effect is driven almost entirely by %LAA-950. In this study, patients with E-dominant and mixed phenotypes exhibited lower FEV1/FVC, consistent with previous studies that found that %LAA-950 is associated with airflow obstruction.22–24 It is readily understandable that the severity of pathological damage correlates closely with the degree of airflow obstruction.
In this study, %LAA-950 was positively correlated with VD/VTpeak, VE/VCO2 slope and VE/ VCO2AT. It suggested that emphysema was associated with worse ventilation efficiency during exercise. Rodrigues et al5 and Rinaldo et al25 also confirmed the association between %LAA-950 and both VE/VCO2 slope and VE/VCO2. A likely explanation is that emphysema severity directly correlates with the extent of ventilation-perfusion mismatch and dead space, increasing ventilatory demand to compensate for dead space loading and CO2 elimination.26 The excessive ventilatory response during exercise, while compensatory, contributes to heightened dyspnea and limit exercise capacity.27,28 VO2peak was used to assess exercise tolerance. Many studies proved that VO2peak is a great prognostic marker for acute exacerbation and early death in patients with COPD.7,29,30 This study showed that %LAA-950 predicts VO2peak, VO2peak%pred independently. As CPET is only available in a few hospitals, whereas CT is usually accessible even in primary care. These results may help clinicians to predict the exercise endurance and ventilation efficiency of COPD patients based on the severity of emphysema and finally assist in formulating an appropriate rehabilitation program and assessing the prognosis.
This is the first study to assess the association between Pi10 and exercise capacity measured by CPET. Previous studies on airway wall thickness were mainly based on WA%, which found WA% positively correlated with VE/VCO2 and VE/VCO2 slope.5,11 Although Pi10 reduces the effects of generational and individual differences in airway compared to WA%, and some studies have shown that Pi10 predicts faster lung function decline, frequent exacerbations and mortality in patients with COPD,31,32 its association with cardiopulmonary function remains unclear. Currently, only a few studies have examined the relationship between Pi10 and 6-minute walking distance (6MWD), and the findings are inconsistent. Charbonnier et al33 and Bhatt et al34 reported that higher Pi10 is associated with poorer 6MWD. But Ostridge et al35 found no significant association. Similarly, this study did not observe a significant correlation between Pi10 and CPET parameters. This may be due to the small sample size, which limited the power to detect weaker correlations. The inherent limitations of CT-based structural quantification may also have contributed, including the exclusion of mucus-obstructed airways from the Pi10 assessment. In addition, Hao et al36 suggest that Pi10 is not directly related to intraluminal inflammatory indices. We speculate Pi10 may not be the optimal indicator for assessing changes in airway wall morphology, and further studies with larger sample sizes are needed to clarify its relationship with cardiopulmonary function.
There are some limitations in this study. Firstly, the sample size was small, particularly in the A-dominant and mixed groups, which may affect the results. Post-hoc power analysis based on 93 subjects revealed that the minimal detectable correlation coefficient was 0.287 at power = 0.80 and two-sided α = 0.05. Therefore, weaker correlations could not be reliably tested in our overall population. Secondly, the patients included were predominantly mild-to-moderate COPD, male smokers, which has poor generalization to the entire COPD population. Thirdly, normal population was not included for comparison, and CT phenotyping was not based on the upper limits of normal for %LAA-950 and Pi10. As Pi10 varies widely across studies and there is no recognized cutoff value, we arbitrarily used the 75th percentile of participants’ Pi10 as the cutoff value. Finally, as the limitations of cross-sectional studies, more longitudinal studies are needed to investigate the value of the quantitative CT parameters in guiding exercise interventions and predicting adverse outcomes.
Conclusions
In summary, this study showed that emphysema is closely related to exercise endurance and ventilatory efficiency. And %LAA-950 is independently associated with VO2peak, VO2peak%pred, VD/VTpeak, VE/VCO2AT and VE/VCO2 slope. Compared with Pi10, %LAA-950 may help primary care physicians predict cardiopulmonary function during exercise in patients with COPD. However, these findings require validation in larger studies.
Abbreviations
AT, anaerobic threshold; BMI, body mass index; COPD, chronic obstructive pulmonary disease; CPET, cardiopulmonary exercise test; FEV1, forced expiratory volume in 1 s; FEV1/FVC, ratio between FEV1 and forced vital capacity; HR, heart rate; %LAA-950, percentage of low attenuation areas below −950 Hounsfield Units; Pi10, the square root of wall area of a hypothetical airway with an internal perimeter of 10 mm; VCO2, carbon dioxide production; VD, dead space volume; VE, ventilaton; VO2, oxygen uptake; VT, tidal volume.
Data Sharing Statement
The data that support the findings of this study are available on request from the corresponding author Ke Huang ([email protected]).
Ethics Approval and Informed Consent
This study was approved by the institutional review board at the China–Japan Friendship Hospital (2022-KY-141). The written informed consent was obtained from each participant. And this study complied with the Declaration of Helsinki.
Funding
This study was supported by the Social Development Project of Yunnan Province (202403AC100006, 2023ZD0506003), and the Science & Technology Fundamental Resources Investigation Program (2022FY100800). However, this funding did not affect the study.
Disclosure
The authors report no conflicts of interest in this work.
References
1. Wang C, Xu J, Yang L, et al. Prevalence and risk factors of chronic obstructive pulmonary disease in China (the China Pulmonary Health [CPH] study): a national cross-sectional study. Lancet. 2018;391(10131):1706–9. doi:10.1016/S0140-6736(18)30841-9
2. Coxson HO, Rogers RM. Quantitative computed tomography of chronic obstructive pulmonary disease. Acad Radiol. 2005;12(11):1457–1463. doi:10.1016/j.acra.2005.08.013
3. Amudala Puchakayala PR, Sthanam VL, Nakhmani A, et al. Radiomics for improved detection of chronic obstructive pulmonary disease in low-dose and standard-dose chest ct scans. Radiology. 2023;307(5):e222998. doi:10.1148/radiol.222998
4. Van Tho N, Ogawa E, Trang le TH, et al. A mixed phenotype of airway wall thickening and emphysema is associated with dyspnea and hospitalization for chronic obstructive pulmonary disease. Ann Am Thorac Soc. 2015;12(7):988–996. doi:10.1513/AnnalsATS.201411-501OC
5. Rodrigues Sousa S, Nunes Caldeira J, Rodrigues C. COPD phenotypes by computed tomography and ventilatory response to exercise. Pulmonology. 2024;30(3):222–229. doi:10.1016/j.pulmoe.2022.01.002
6. Li T, Zhou HP, Zhou ZJ, Guo LQ, Zhou L. Computed tomography-identified phenotypes of small airway obstructions in chronic obstructive pulmonary disease. Chin Med J. 2021;134(17):2025–2036. doi:10.1097/CM9.0000000000001724
7. Ewert R, Obst A, Mühle A, et al. Value of cardiopulmonary exercise testing in the prognosis assessment of chronic obstructive pulmonary disease patients: a retrospective, multicentre cohort study. Respiration. 2022;101(4):353–366. doi:10.1159/000519750
8. Burge AT, Holland AE, McDonald CF, et al. Home-based pulmonary rehabilitation for COPD using minimal resources: an economic analysis. Respirology. 2020;25(2):183–190. doi:10.1111/resp.13667
9. Herdy AH, Ritt LE, Stein R, et al. Cardiopulmonary exercise test: background, applicability and interpretation. Arq Bras Cardiol. 2016;107(5):467–481. doi:10.5935/abc.20160171
10. Ross RM. ATS/ACCP statement on cardiopulmonary exercise testing. Am J Respir Crit Care Med. 2003;167(10):1451. doi:10.1164/ajrccm.167.10.950
11. Crisafulli E, Alfieri V, Silva M, et al. Relationships between emphysema and airways metrics at High-Resolution Computed Tomography (HRCT) and ventilatory response to exercise in mild to moderate COPD patients. Respir Med. 2016;117:207–214. doi:10.1016/j.rmed.2016.06.016
12. Jones JH, Zelt JT, Hirai DM, et al. Emphysema on thoracic ct and exercise ventilatory inefficiency in mild-to-moderate COPD. Copd. 2017;14(2):210–218. doi:10.1080/15412555.2016.1253670
13. Global Initiative for Chronic Obstructive Lung Disease. Global strategy for the diagnosis m, and prevention of chronic obstructive lung disease[EB/OL]. Available from: https://goldcopd.org/2025GOLD.Reports.
14. Miller MR, Hankinson J, Brusasco V, et al. Standardisation of spirometry. Eur Respir J. 2005;26(2):319–338. doi:10.1183/09031936.05.00034805
15. Balady GJ, Arena R, Sietsema K, et al. Clinician’s Guide to cardiopulmonary exercise testing in adults: a scientific statement from the American Heart Association. Circulation. 2010;122(2):191–225. doi:10.1161/CIR.0b013e3181e52e69
16. Gevenois PA, De Vuyst P, de Maertelaer V, et al. Comparison of computed density and microscopic morphometry in pulmonary emphysema. Am J Respir Crit Care Med. 1996;154(1):187–192. doi:10.1164/ajrccm.154.1.8680679
17. Patel BD, Coxson HO, Pillai SG, et al. Airway wall thickening and emphysema show independent familial aggregation in chronic obstructive pulmonary disease. Am J Respir Crit Care Med. 2008;178(5):500–505. doi:10.1164/rccm.200801-059OC
18. Nakano Y, Wong JC, de Jong PA, et al. The prediction of small airway dimensions using computed tomography. Am J Respir Crit Care Med. 2005;171(2):142–146. doi:10.1164/rccm.200407-874OC
19. Ostridge K, Wilkinson TM. Present and future utility of computed tomography scanning in the assessment and management of COPD. Eur Respir J. 2016;48(1):216–228. doi:10.1183/13993003.00041-2016
20. Chen TT, Cheng TY, Liu IJ, et al. Leveraging subjective parameters and biomarkers in machine learning models: the feasibility of lnc-il7r for managing emphysema progression. Diagnostics. 2025;15(9). doi:10.3390/diagnostics15091165.
21. Mohamed Hoesein FA, Schmidt M, Mets OM, et al. Discriminating dominant computed tomography phenotypes in smokers without or with mild COPD. Respir Med. 2014;108(1):136–143. doi:10.1016/j.rmed.2013.08.014
22. Colombi D, Petrini M, Risoli C, et al. Quantitative CT at Follow-Up of COVID-19 Pneumonia: relationship with Pulmonary Function Tests. Diagnostics. 2023;13(21):3328. doi:10.3390/diagnostics13213328
23. Zou X, Tian B, Lin Q, et al. Diagnostic value of CT in patients with stable chronic obstructive pulmonary disease at high altitude: observational study. Medicine. 2024;103(44):e40291. doi:10.1097/MD.0000000000040291
24. Zou D, Zhu X. Association of CT phenotype with pulmonary function in patients with chronic obstructive pulmonary disease and influencing factors of prognosis. Am J Transl Res. 2023;15(3):2164–2174.
25. Rinaldo RF, Mondoni M, Comandini S, et al. The role of phenotype on ventilation and exercise capacity in patients affected by COPD: a retrospective study. Multidiscip Respir Med. 2020;15(1):476. doi:10.4081/mrm.2020.476
26. Poon CS. Potentiation of exercise ventilatory response by airway CO2 and dead space loading. J Appl Physiol. 1992;73(2):591–595. doi:10.1152/jappl.1992.73.2.591
27. Elbehairy AF, Ciavaglia CE, Webb KA, et al. Pulmonary gas exchange abnormalities in mild chronic obstructive pulmonary disease. implications for dyspnea and exercise intolerance. Am J Respir Crit Care Med. 2015;191(12):1384–1394. doi:10.1164/rccm.201501-0157OC
28. Phillips DB, Elbehairy AF, James MD, et al. Impaired ventilatory efficiency, dyspnea, and exercise intolerance in chronic obstructive pulmonary disease: results from the cancold study. Am J Respir Crit Care Med. 2022;205(12):1391–1402. doi:10.1164/rccm.202109-2171OC
29. da Luz Goulart C, Oliveira MR, Sendín FA, et al. Prognostic value of key variables from cardiopulmonary exercise testing in patients with COPD: 42-month follow-up. Respir Med. 2022;197:106856. doi:10.1016/j.rmed.2022.106856
30. Wan Q, Deng Z, Wu F, et al. Association of exercise tolerance with respiratory health outcomes in mild-to-moderate chronic obstructive pulmonary disease. Ann Am Thorac Soc. 2025;22(5):669–678. doi:10.1513/AnnalsATS.202404-408OC
31. Mohamed Hoesein FA, de Jong PA, Lammers J-WJ, et al. Airway wall thickness associated with forced expiratory volume in 1 second decline and development of airflow limitation. Eur Respir J. 2015;45(3):644–651. doi:10.1183/09031936.00020714
32. Kahnert K, Jörres RA, Kauczor HU, et al. Standardized airway wall thickness Pi10 from routine CT scans of COPD patients as imaging biomarker for disease severity, lung function decline, and mortality. Ther Adv Respir Dis. 2023;17:17534666221148663. doi:10.1177/17534666221148663
33. Charbonnier JP, Pompe E, Moore C, et al. Airway wall thickening on CT: relation to smoking status and severity of COPD. Respir Med. 2019;146:36–41. doi:10.1016/j.rmed.2018.11.014
34. Bhatt SP, Nakhmani A, Sthanam V, Kizhakke Puliyakote A, Reinhardt JM, Bodduluri S. PiSlope: a New CT Metric for Quantifying Airway Remodeling in Chronic Obstructive Pulmonary Disease. Radiology. 2024;313(2):e240717. doi:10.1148/radiol.240717
35. Ostridge K, Williams NP, Kim V, et al. Relationship of CT-quantified emphysema, small airways disease and bronchial wall dimensions with physiological, inflammatory and infective measures in COPD. Respir Res. 2018;19(1):31. doi:10.1186/s12931-018-0734-y
36. Hao W, Li M, Pang Y, Du W, Huang X. Increased chemokines levels in patients with chronic obstructive pulmonary disease: correlation with quantitative computed tomography metrics. Br J Radiol. 2021;94(1118):20201030. doi:10.1259/bjr.20201030
 © 2026 The Author(s). This work is published and licensed by Dove Medical Press Limited. The
full terms of this license are available at https://www.dovepress.com/terms
and incorporate the Creative Commons Attribution
- Non Commercial (unported, 4.0) License.
By accessing the work you hereby accept the Terms. Non-commercial uses of the work are permitted
without any further permission from Dove Medical Press Limited, provided the work is properly
attributed. For permission for commercial use of this work, please see paragraphs 4.2 and 5 of our Terms.
© 2026 The Author(s). This work is published and licensed by Dove Medical Press Limited. The
full terms of this license are available at https://www.dovepress.com/terms
and incorporate the Creative Commons Attribution
- Non Commercial (unported, 4.0) License.
By accessing the work you hereby accept the Terms. Non-commercial uses of the work are permitted
without any further permission from Dove Medical Press Limited, provided the work is properly
attributed. For permission for commercial use of this work, please see paragraphs 4.2 and 5 of our Terms.
Recommended articles
Contributions of Emphysema and Functional Small Airway Disease on Intrapulmonary Vascular Volume in COPD
Huang X, Yin W, Shen M, Wang X, Ren T, Wang L, Liu M, Guo Y
International Journal of Chronic Obstructive Pulmonary Disease 2022, 17:1951-1961
Published Date: 25 August 2022
Phenotyping COPD Patients with Emphysema Distribution Using Quantitative CT Measurement; More Severe Airway Involvement in Lower Dominant Emphysema
Park J, Kim EK, Lee SH, Kim MA, Kim JH, Lee SM, Lee JS, Oh YM, Lee SD, Lee JH
International Journal of Chronic Obstructive Pulmonary Disease 2022, 17:2013-2025
Published Date: 31 August 2022
Re-Defining High Risk COPD with Parameter Response Mapping Based on Machine Learning Models
Pu Y, Zhou X, Zhang D, Guan Y, Xia Y, Tu W, Lu Y, Zhang W, Fu CC, Fang Q, de Bock GH, Liu S, Fan L
International Journal of Chronic Obstructive Pulmonary Disease 2022, 17:2471-2483
Published Date: 4 October 2022
Clinical and Radiological Features Between Patients with Stable COPD from Plateau and Flatlands: A Comparative Study
Jiang Z, Wang X, Zhang L, Yangzom D, Ning Y, Su B, Li M, ChuTso M, Chen Y, Liang Y, Sun Y
International Journal of Chronic Obstructive Pulmonary Disease 2023, 18:849-858
Published Date: 12 May 2023
Differentiating Emphysema From Emphysema-Dominated COPD Patients with CT Imaging Feature and Machine Learning
Guo W, Li M, Li Y, Fan X, Wu L
International Journal of Chronic Obstructive Pulmonary Disease 2025, 20:2615-2628
Published Date: 25 July 2025