Back to Journals » International Journal of Chronic Obstructive Pulmonary Disease » Volume 17
Contributions of Emphysema and Functional Small Airway Disease on Intrapulmonary Vascular Volume in COPD
Authors Huang X ![]() , Yin W
, Yin W ![]() , Shen M
, Shen M ![]() , Wang X
, Wang X ![]() , Ren T
, Ren T ![]() , Wang L, Liu M, Guo Y
, Wang L, Liu M, Guo Y ![]()
Received 1 April 2022
Accepted for publication 16 August 2022
Published 25 August 2022 Volume 2022:17 Pages 1951—1961
DOI https://doi.org/10.2147/COPD.S368974
Checked for plagiarism Yes
Review by Single anonymous peer review
Peer reviewer comments 3
Editor who approved publication: Professor Min Zhang
Xiaoqi Huang,1,* Weiling Yin,1,* Min Shen,1 Xionghui Wang,1 Tao Ren,1 Lei Wang,1 Min Liu,2 Youmin Guo1
1Department of Radiology, Yan’an University Affiliated Hospital, Yan’an, People’s Republic of China; 2Department of Radiology, China-Japan Friendship Hospital, Beijing, People’s Republic of China
*These authors contributed equally to this work
Correspondence: Youmin Guo, Department of Radiology, Yan’an University Affiliated Hospital, Yan’an, People’s Republic of China, Tel +86-13909187113, Email [email protected]
Background: Previous studies have demonstrated that there is a certain correlation between emphysema and changes in pulmonary small blood vessels in patients with chronic obstructive pulmonary disease (COPD), but most of them were limited to the investigation of the inspiratory phase. The emphysema indicators need to be further optimized. Based on the parametric response mapping (PRM) method, this study aimed to investigate the effect of emphysema and functional small airway disease on intrapulmonary vascular volume (IPVV).
Methods: This retrospective study enrolled 63 healthy subjects and 47 COPD patients, who underwent both inspiratory and expiratory CT scans of the chest and pulmonary function tests (PFTs). Inspiratory and expiratory IPVV were measured by using an automatic pulmonary vessels integration segmentation approach, the ratio of emphysema volume (Emph%), functional small airway disease volume (fsAD%), and normal areas volume (Normal%) were quantified by the PRM method for biphasic CT scans. The participants were grouped according to PFTs. Analysis of variance (ANOVA) and Kruskal–Wallis H-test were used to analyze the differences in indicators between different groups. Then, Spearman’s rank correlation coefficients were used to analyze the correlation between Emph%, fsAD%, Normal%, PFTs, and IPVV. Finally, multiple linear regression was applied to analyze the effects of Emph% and fsAD% on IPVV.
Results: Differences were found in age, body mass index (BMI), smoking index, FEV1%, FEV1/forced vital capacity (FVC), expiratory IPVV, IPVV relative value, IPVV difference value, Emph%, fsAD%, and Normal% between the groups (P< 0.05). A strong correlation was established between the outcomes of PFTs and quantitative CT indexes. Finally, the effect of Emph% was more significant than that of fsAD% on expiratory IPVV, IPVV difference value, and IPVV relative value.
Conclusion: IPVV may have a potential value in assessing COPD severity and is significantly affected by emphysema.
Keywords: chronic obstructive pulmonary disease, intrapulmonary vascular volume, emphysema, functional small airway disease, parametric response mapping method
Introduction
Chronic obstructive pulmonary disease (COPD) is one of the most common respiratory diseases worldwide, with high morbidity and mortality.1 Previous pathophysiological studies on COPD found that the pulmonary vascular endothelial growth factor was impaired due to chronic hypoxia, chronic bronchial inflammation and emphysema.2–5 The volume of small vessels in the distal lung decreased, whereas that of the proximal vessels increased, which was called the pruning and remodeling of pulmonary vessels.6
The intrapulmonary vascular volume (IPVV) of chest computed tomography (CT) images can be extracted, analyzed, and quantified non-invasively;7,8 it has been applied in the studies of various pulmonary diseases.9–12 Some studies found that the volume of small vessels in the distal lung, or its ratio to the total volume of pulmonary vessels, tended to be positively correlated with FEV1, FEV1/FVC, and negatively correlated with LAA%-950 (the lung volume with a CT attenuation value of less than −950 HU relative to the total lung volume) in patients with COPD, which represented the severity of emphysema on inspiratory CT.13,14 Also, a certain relationship existed with the airway wall, consistent with the conclusions of pathophysiological studies.15
However, Galban proposed a parametric response mapping (PRM) method, which further differentiated and quantified emphysema areas and functional small airway disease areas through differences in lung density by registering the inspiratory and expiratory images of chest CT.16 Compared with the LAA%-950 represented airflow obstruction in the inspiratory phase, this method could simultaneously separate gas trapping to small airways obstruction in patients, so as to provide more profound value in the imaging analysis of COPD.17–20
Therefore, in this study, we analyzed the IPVV of high-risk COPD patients and COPD patients with COPD and patients with COPD of different severity, and explored the contributions of emphysema and functional small airway disease on intrapulmonary vascular volume based on the PRM method.
(Relevant literatures worked on this area: References 7–20, 24–35)
Materials and Methods
Participants
A total of 110 participants, comprising 63 healthy controls and 47 patients with COPD from the Affiliated Hospital of Yan’an University from December 2018 to 2020, who all underwent biphasic CT and pulmonary function tests (PFTs), were enrolled in this retrospective study. The study involving human participants was reviewed and approved by the Medical Ethics Committee of the Affiliated Hospital of Yan’an University (Grant No.: 2,018,032). Written informed consent was obtained from all participants. The patients/controls provided their written informed consent to participate in this study. The clinical data of patients were maintained with confidentiality and in compliance with the Declaration of Helsinki.
The inclusion criteria were as follows: (1) patients with COPD met the diagnostic criteria of the Global initiative for chronic obstructive lung disease-global strategy for the diagnosis, management, and prevention of chronic obstructive pulmonary disease (2022 Report);21 and (2) chest CT inspiratory and expiratory biphasic images were clear and complete and could be processed correctly to obtain lung fissure segmentation results.
The exclusion criteria were as follows: (1) age <40 years or >80 years; (2) lung cancer and other intrapulmonary space-occupying lesions; (3) history of thoracic surgery, such as after lung resection, heart valve replacement, and coronary intervention; (4) thoracic deformity; (5) diseases, such as large-area infection of the lung, lung consolidation, atelectasis, massive pleural effusion, and severe pulmonary fibrosis, affecting lung analysis; (6) bronchial asthma, tuberculosis, bronchiectasis, pulmonary hypertension; (7) patients with heart, liver, and renal insufficiency; (8) and occupational dust exposure history.
Figure 1 demonstrates a flowchart detailing participant selection. The baseline demographics and CT imaging data of all participants were collected and analyzed.
 |
Figure 1 Flowchart of participant selection. Abbreviations: COPD, chronic obstructive pulmonary disease; CT, computed tomography; PFTs, pulmonary function tests; PRISm, Preserved Ratio Impaired Spirometry. |
PFTs
PFTs (Sensormedics Vmax299 pulmonary function instrument, USA) were performed within 1 week before or after the CT examination. The patients were seated, and the vital capacity data, including forced expiratory volume in 1 s (FEV1), forced vital capacity (FVC), FEV1 predicted value (FEV1%), and FEV1/FVC, were measured before and after inhalation of salbutamol (400 μg). Participants with FEV1/FVC ≥70% and FEV1% pred <80% were classified as the Preserved Ratio Impaired Spirometry (PRISm) group, and those with FEV1/FVC ≥70% and FEV1% ≥80% were as the normal group. Participants in the COPD group were classified according to the GOLD [GOLD 1, mild COPD (FEV1% ≥80%); GOLD 2, moderate COPD (50%≤ FEV1% <80%); GOLD 3, severe COPD (30%≤ FEV1% <50%); and GOLD 4, very severe COPD (FEV1% <30%)]. Besides PFTs, the patients’ body mass index (BMI) and smoking index were assessed.
Biphasic Chest CT Scanning
Before the examination, all patients underwent breathing training. All patients underwent biphasic chest CT scanning on a 128-slice spiral CT scanner (Shanghai United Imaging UCT-760). They were placed in the supine position, held their heads with both hands, and held their breath at the end of deep inhalation and forced exhalation. During scanning, no contrast agent was injected. The scanning range included the whole lung scan from the apex to base. The scanning parameters were as follows: tube voltage 120 kV; adaptive dynamic tube current, current range 40–95 mAs; collimator width, 128*0.625 mm; pitch, 1.0875; rotational speed, 0.5 s/r; and scanning slice thickness, 5 mm. Thus, biphasic images were reconstructed using a 1-mm thin slice of the bone algorithm, field of vision (FOV) 350*450 mm, and matrix 521*521.
Image Processing
Biphasic CT images were transferred to an in-home workstation (the FACT-Digital Lung Workstation, Dexin, Xi’an, China), which enabled automated segmentation of a variety of lung structures, including right/left lungs, lung vessels, airway trees, and inner/outer airway walls. After automatic lung segmentation, an automated three-dimensional (3D) method was used to reconstruct the pulmonary vasculature and calculate the IPVV of the entire lung in each phase. In both inspiratory and expiratory CT, IPVV measurements included vascular walls and arteriovenous lumens. The ratio between expiratory IPVV and inspiratory IPVV was defined as IPVV relative value, and the difference value between the two was defined as IPVV difference value.
In addition, biphasic images were registered using B-splines combined with affine variation registration. The voxel-based quantitative detection method used in this study was described as the PRM method in Galban’s study.16 All voxels were divided into three categories according to the altered CT value: the areas with the CT value in the inspiratory phase >-950 HU and the CT value in the expiratory phase >-856 HU were normal lung tissue areas (normal areas volume ratio, Normal%, marked in green); the areas with the inspiratory phase <-950 HU and the CT value in the expiratory phase <-856 HU were the emphysema areas (emphysema volume ratio, Emph%, marked in red); and the areas with the CT value in the inspiratory phase >-950 HU and the CT value in the expiratory CT phase <-856HU were functional small airway lesions areas (functional small airway lesions volume ratio, fsAD%, marked in yellow) (Figure 2).
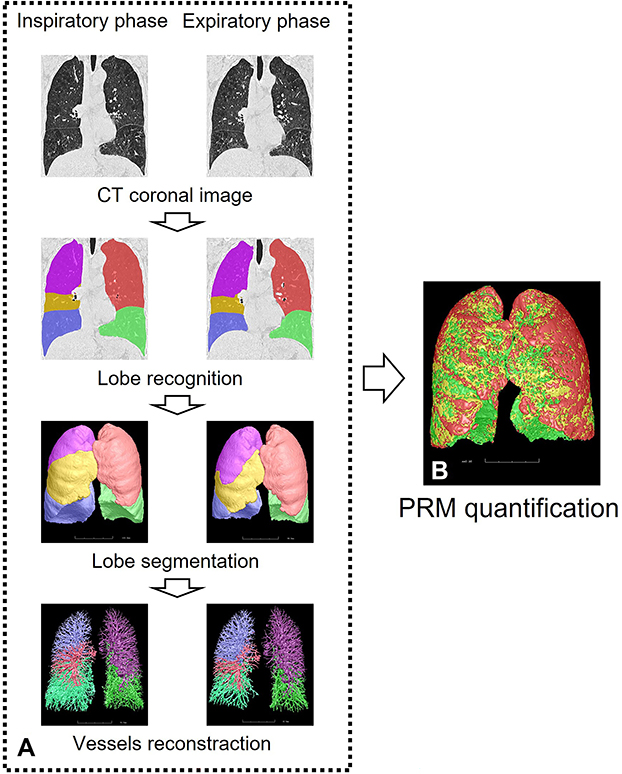 |
Figure 2 Schematic diagram of parameter measurement in biphasic quantitative CT. Notes: (A) Identification and segmentation of lung fissures and lobes on CT images by the 3D adaptive border marching algorithm and the implicit surface functions. The principal curvatures and the principal directions were used to distinguish pulmonary vessels from lung tissue, and the vascular tree was automatically extracted and segmented to calculate IPVV in the whole lung. (B) Normal lung tissue areas (green), emphysema areas (red), and functional small disease areas (yellow) were quantified by the PRM method. |
Statistical Analysis
The normally distributed measurement data were tested using the Shapiro–Wilk test and expressed as mean ± standard deviations ( ), and the differences between groups were compared using ANOVA and the least significant difference t-(LSD-t) test. The measurement data not conforming to the normal distribution were expressed as M (P25, P75), and the Kruskal–Wallis H-test was used to compare the differences between the groups. Spearman’s rank correlation was used to analyze the correlation between quantitative CT indexes and PFTs. Multiple linear regression was used to evaluate the impact of Emph% and fsAD% on IPVV. All statistical analyses were performed using SPSS 26.0 (SPSS Inc. IL, USA). A P-value <0.05 indicated a statistically significant difference.
Results
Patient Characteristics and PFTs
A total of 110 participants were included in this study, and divided into four groups according to FEV1/FVC and FEV1% in pulmonary function test results (PFTs) after the inhalation of bronchodilators: 41 in the normal lung function group; 22 in the PRISm group; 32 in the mild COPD group [Global initiative for chronic obstructive pulmonary disease (GOLD1) (15 participants) and GOLD2 (17 participants)]; 15 in the severe COPD group [GOLD3 (10 participants) and GOLD4 (5 participants)].
The sex distribution in the two groups was similar (P>0.05), but the differences in age, BMI, and smoking index were statistically significant (P<0.05). The age and smoking index of patients with COPD were higher than those of without COPD, while the BMI in the PRISm group was higher than that in the normal group. The FEV1% of PRISm patients in PFTs was lower than that in the normal group (P<0.05). FEV1/FVC in PRISm patients was higher than that in GOLD1 patients (P<0.05), and all PFT indexes were lower in patients with severe COPD than in patients with mild COPD (Table 1).
 |
Table 1 Comparison of Subject’s Baseline Characteristics and PFTs |
Quantitative CT Indexes
The expiratory IPVV, IPVV relative value, and IPVV difference value differed significantly between the groups (P<0.05). Although no statistical difference was observed between the PRISm and normal groups, the aforementioned variables in these groups were lower than those of the patients with COPD; also, these variables were higher in patients with severe COPD than in patients with mild COPD (P<0.05). Similarly, the differences in Normal%, Emph%, and fsAD% were also statistically significant between the groups (P<0.05). Although no statistical difference was detected between the PRISm and normal groups, Normal% and Emph% were higher in patients with severe COPD (P<0.05) (Table 2).
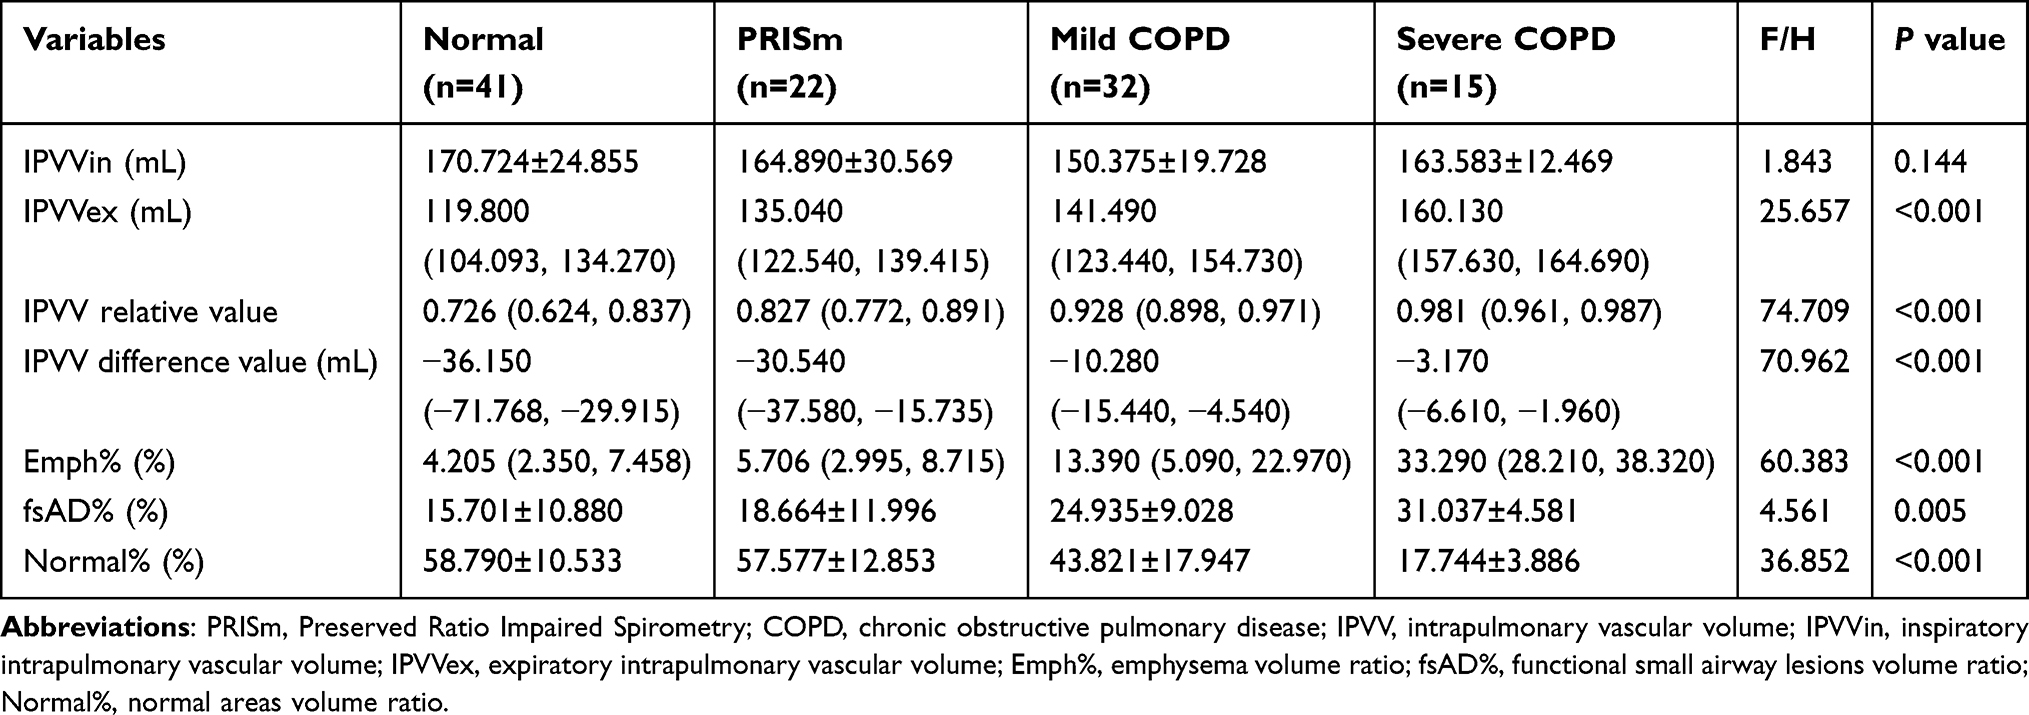 |
Table 2 Comparison of Subjects’ Quantitative CT Indexes |
Correlation Between Quantitative CT Indexes and PFTs
First, the quantitative CT indicators, expiratory IPVV, IPVV relative value, IPVV difference value, Emph%, and fsAD%, moderately positively correlated with FEV1% and FEV1/FVC, while Normal% moderately negatively correlated (P<0.05). In addition, expiratory IPVV significantly correlated with PFTs than inspiratory IPVV (Tables 3 and 4, Figures 3 and 4).
 |
Table 3 Correlations Between IPVV and PFTs |
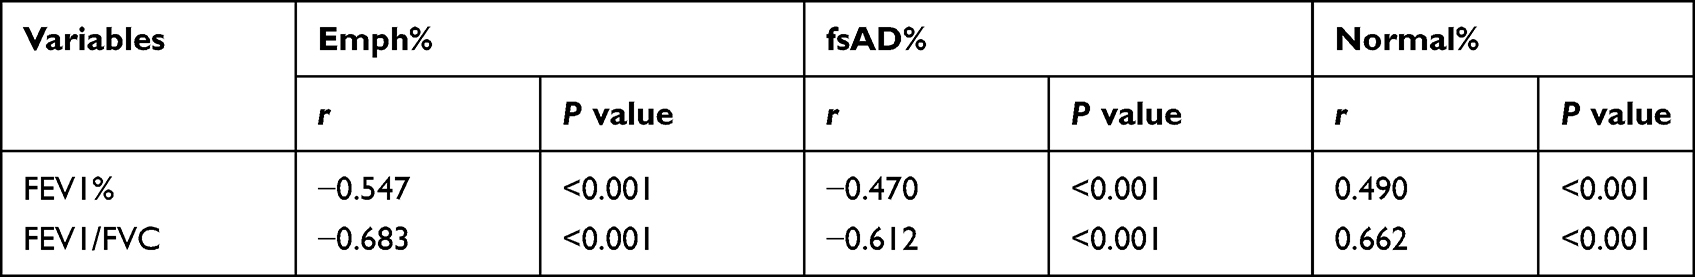 |
Table 4 Correlations Between PRM Indexes and PFTs |
 |
Figure 3 Correlations between IPVV and PFTs. Abbreviations: FEV1, forced expiratory volume in 1 second; FEV1%, predicted value of forced expiratory volume in 1 second; FVC, forced vital capacity; IPVV, intrapulmonary vascular volume; IPVVin, inspiratory intrapulmonary vascular volume; IPVVex, expiratory intrapulmonary vascular volume. Notes: Scatter plots were drawn, and Spearman’s rank correlation was used. A P value <0.05 was considered statistically significant. (A) Correlation between inspiratory IPVV and FEV1%. (B) Correlation between inspiratory IPVV and FEV1/FVC. (C) Correlation between expiratory IPVV and FEV1%. (D) Correlation between expiratory IPVV and FEV1/FVC. (E) Correlation between IPVV relative value and FEV1%. (F) Correlation between IPVV relative value and FEV1/FVC. (G) Correlation between IPVV difference value and FEV1%. (H) Correlation between IPVV difference value and FEV1/FVC. |
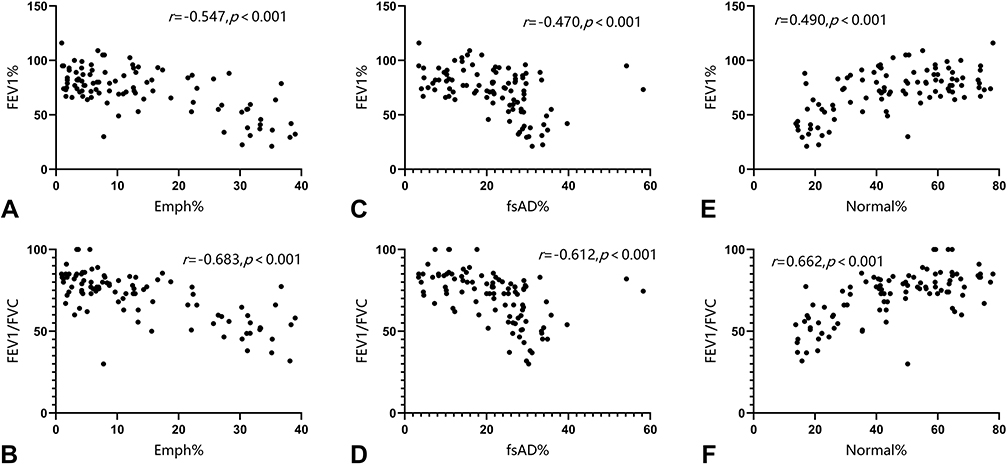 |
Figure 4 Correlations between PRM indexes and PFTs. Abbreviations: Emph%, emphysema volume ratio; fsAD%, functional small airway lesions volume ratio; Normal%, normal areas volume ratio; FEV1, forced expiratory volume in 1 second; FEV1%, predicted value of forced expiratory volume in 1 second; FVC, forced vital capacity. Notes: Scatter plots were drawn, and Spearman’s rank correlation was used. A P value <0.05 indicated a statistically significant difference. (A) Correlation between Emph% and FEV1%. (B) Correlation between Inspiratory Emph% and FEV1/FVC. (C) Correlation between fsAD% and FEV1%. (D) Correlation between fsAD% and FEV1/FVC. (E) Correlation between Normal% and FEV1%. (F) Correlation between Normal% and FEV1/FVC. |
Second, a significant correlation was observed between expiratory IPVV, IPVV relative value, difference value, Emph%, fsAD%, and Normal%, especially between IPVV relative and difference values (P<0.05) (Table 5, Figure 5).
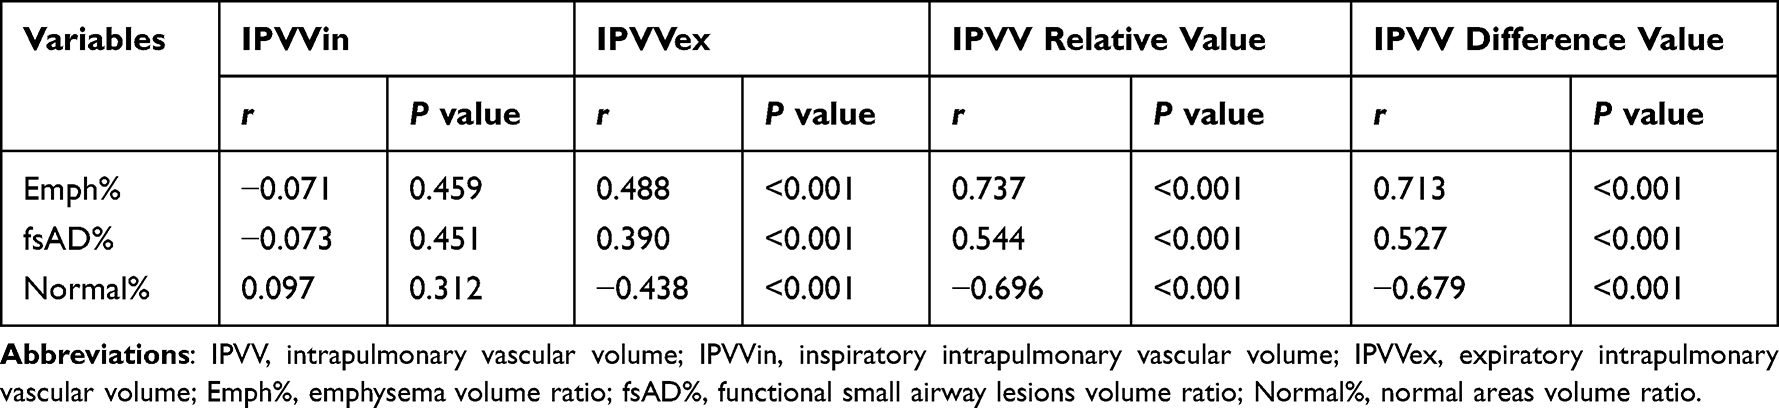 |
Table 5 Correlations Between IPVV and PRM Indexes |
 |
Figure 5 Correlations between IPVV and PRM indexes. Abbreviations: IPVV, intrapulmonary vascular volume; IPVVin, inspiratory intrapulmonary vascular volume; IPVVex, expiratory intrapulmonary vascular volume; Emph%, emphysema volume ratio; fsAD%, functional small airway lesions volume ratio; Normal%, normal areas volume ratio. Notes: Scatter plots were drawn, and Spearman’s rank correlation was used. A P value <0.05 indicated a statistically significant difference. (A) Correlation between Inspiratory IPVV and Emph%. (B) Correlation between inspiratory IPVV and fsAD%. (C) Correlation between inspiratory IPVV and Normal%. (D) Correlation between expiratory IPVV and Emph%. (E) Correlation between expiratory IPVV and fsAD%. (F) Correlation between expiratory IPVV and Normal%. (G) Correlation between IPVV relative value and Emph%. (H) Correlation between IPVV relative value and fsAD%. (I) Correlation between IPVV relative value and Normal%. (J) Correlation between IPVV difference value and Emph%. (K) Correlation between IPVV difference value and fsAD%. (L) Correlation between IPVV difference value and Normal%. |
Contributions of Biphasic Registration Quantitative CT Indexes on IPVV
Emph% and fsAD% were used as independent variables, and inspiratory IPVV, expiratory IPVV, and IPVV relative and difference values were used as dependent variables for multivariate linear regression analysis. The results showed a statistically significant difference in expiratory IPVV, IPVV relative value, and IPVV difference value (P<0.05), and the R2 of IPVV relative and difference values was higher than that of the expiratory IPVV. This phenomenon also showed that Emph% was a critical influencing factor for expiratory IPVV, IPVV relative value, and IPVV difference value (Table 6).
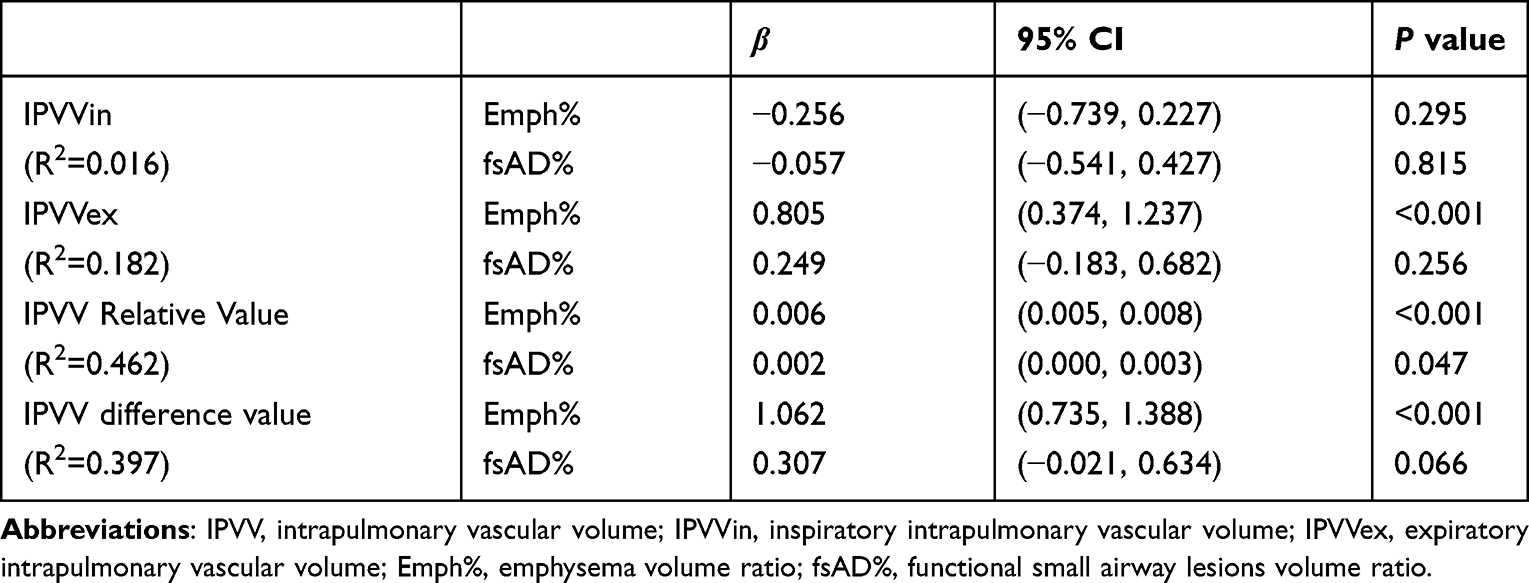 |
Table 6 Multiple Linear Regression Analysis of IPVV in Emph% and fsAD% |
Discussion
In this study, we quantified IPVV on inspiratory and expiratory CT scans, divided the areas of emphysema and functional small airway disease, and analyzed the interaction between the two parameters in healthy individuals and patients with COPD of varying severity. The current findings demonstrated that IPVV was a quantitative indicator of intrapulmonary vascular changes in patients with COPD. Especially, expiratory IPVV could be more valuable than inspiratory IPVV in assessing the occurrence and development of COPD disease, and also the relative and difference values were significant in this study. In addition, the multiple linear regression analysis showed that emphysema influenced pulmonary vascular changes.
Previous studies demonstrated the application value of dual-phase quantitative CT in healthy people and patients with COPD.16,22,23 We used this technology to describe the IPVV, emphysema areas, and functional small airway disease areas. Compared with LAA%-950 obtained on inspiratory CT, this method could simultaneously evaluate the severity of emphysema and functional small airway disease in patients.16,17 This study was novel in demonstrating a relationship between intrapulmonary vessels depicted by biphasic CT scans and emphysema and functional small airway disease by the PRM method.
We found that expiratory IPVV increased with the disease severity of COPD and decreased lung function, suggesting an interplay between pulmonary vascular changes and adverse disease progression in COPD. Besides, the inclusion of PRISm patients was also novelty of this study, which aimed to investigate the changes in pulmonary vascular volume in patients at high risk of COPD, although the changes were not significant. Our study suggested that IPVV might be a safe and reliable potential biomarker for assessing COPD disease severity. In addition, the changes in IPVV relative and difference values were more significant than those of expiratory IPVV, indicating that they were more affected by expiratory IPVV and the difference decreased in pulmonary vasculopathy decreased between inspiratory and expiratory phases. Cao also found that expiratory IPVV increased with COPD severity, and the difference decreased from the inspiratory phase, which were consistent with the findings of this study.24
Previous studies have assessed the relationship between small pulmonary vessels, which measured using the proportion of vessels with a cross-sectional area of <5mm2 (%CSA <5mm2 or BV5). Most of the studies found that %CSA<5mm2 or BV5 was positively correlated with FEV1 and FEV1/FVC, but negatively correlated with LAA%-950.25–30 However, relevant studies on IPVV in smokers or patients with COPD found that the total IPVV was positively correlated with smoking severity and LAA%-950, which was consistent with the results of the correlation analysis on IPVV and emphysema in this study.31–33 It suggested that small peripheral pulmonary vessels were susceptible to emphysema and hypoxia leading to loss, narrowing, or decreased filling. However, total vascular volume in the lung might be increased by enlarged pulmonary vascular volume close to the mediastinum.34 This mechanism exacerbated inflammatory responses or circulatory diseases such as pulmonary hypertension, right ventricular dysfunction, and cor pulmonale.34,35
Our study was novel in comparing the effects of emphysema and functional small airway disease on IPVV based on the PRM method. The emphysema had a greater impact on expiratory IPVV, and IPVV difference and relative values. However, Cao found that compared with LAA-950, the airway wall thickness had a more significant effect on expiratory IPVV and IPVV difference and relative values,24 suggesting further exploration of the pathophysiology of the effects of emphysema and small airway disease on pulmonary blood vessels.
Nevertheless, the present study had some limitations. First, we collected an insufficient sample size, and the patient distribution between the groups was unequal, especially in the PRISm and the severe COPD groups. This led to selection bias and inadequate significance in some study results. Second, we did not analyze the IPVV characteristics of each lung lobe, and hence the data were limited. Third, our study did not allow further analysis of the effect of pulmonary vascular volume on disease severity and prognosis, which would be investigated in future prospective studies using longitudinal cohorts.
Conclusion
In conclusion, expiratory IPVV, IPVV relative value and IPVV difference value may have a potential value in assessing COPD severity based on biphasic quantitative CT. In addition, emphysema may be a critical factor in affecting pulmonary vascular changes, providing additional information underlying the pathophysiological changes of COPD, which needs to be verified by further exploration.
Data Sharing Statement
The data used to support the findings of this study are available from the first author upon request. Co-first author: Xiaoqi Huang, Email: [email protected]; Weiling Yin, Email: [email protected].
Ethical Approval and Consent to Participate
The study involving human subjects was reviewed and approved by the Medical Ethics Committee of the Affiliated Hospital of Yan’an University (2018032), and written informed consent was obtained from all subjects. The patients/subjects provided their written informed consent to participate in this study. The clinical data of patients was maintained with confidentiality and in compliance with the Declaration of Helsinki.
Acknowledgments
We thank Medsci for its English language copy editing during the preparation of this manuscript.
Author Contributions
All authors made a significant contribution to the work reported, whether that is in the conception, study design, execution, acquisition of data, analysis and interpretation, or in all these areas; took part in drafting, revising or critically reviewing the article; gave final approval of the version to be published; have agreed on the journal to which the article has been submitted; and agree to be accountable for all aspects of the work.
Funding
The design of the study and collection, analysis, and interpretation of data were supported by the General Projects of Key Research & Development Plans of Department of science and technology, Shaanxi, China (2021SF-254).
Disclosure
The authors report no conflicts of interest in this work.
References
1. Vogelmeier CF, Criner GJ, Martinez FJ, et al. Global strategy for the diagnosis, management, and prevention of chronic obstructive lung disease 2017 report. GOLD executive summary. Am J Respir Crit Care Med. 2017;195(5):557–582. doi:10.1016/j.arbres.2017.02.001
2. Song Q, Chen P, Liu XM. The role of cigarette smoke-induced pulmonary vascular endothelial cell apoptosis in COPD. Respir Res. 2021;22(1):39. doi:10.1186/s12931-021-01630-1
3. Das M, Dempsey EC, Bouchey D, et al. Chronic hypoxia induces exaggerated growth responses in pulmonary artery adventitial fibroblasts: potential contribution of specific protein kinase c isozymes. Am J Respir Cell Mol Biol. 2000;22(1):15–25. doi:10.1165/ajrcmb.22.1.3536
4. Hueper K, Vogel CJ, Parikh MA, et al. Pulmonary microvascular blood flow in mild chronic obstructive pulmonary disease and emphysema. The mesa COPD study. Am J Respir Crit Care Med. 2015;192(5):70. doi:10.1164/rccm.201411-2120OC
5. Kasahara Y, Tuder RM, Taraseviciene SL, et al. Inhibition of VEGF receptors causes lung cell apoptosis and emphysema. J Clin Invest. 2000;106(11):1311–1319. doi:10.1172/JCI10259
6. Rahaghi FN, Wells JM, Come CE, et al. Arterial and venous pulmonary vascular morphology and their relationship to findings in cardiac magnetic resonance imaging in smokers. J Comput Assist Tomogr. 2016;40(6):948–952. doi:10.1097/RCT.0000000000000465
7. Zhai Z, Staring M, Hernandez GI, et al. Automatic quantitative analysis of pulmonary vascular morphology in CT images. Med Phys. 2019;46(9):3985–3997. doi:10.1002/mp.13659
8. Tan W, Yuan Y, Chen A, et al. An approach for pulmonary vascular extraction from chest CT images. J Healthc Eng. 2019;2019:9712970. doi:10.1155/2019/9712970
9. Jacob J, Pienn M, Payer C, et al. Quantitative CT-derived vessel metrics in idiopathic pulmonary fibrosis: a structure-function study. Respirology. 2019;24(5):445–452. doi:10.1111/resp.13485
10. Lins M, Vandevenne J, Thillai M, et al. Assessment of small pulmonary blood vessels in COVID-19 patients using HRCT. Acad Radiol. 2020;27(10):1449–1455. doi:10.1016/j.acra.2020.07.019
11. Matsuoka S, Kotoku A, Yamashiro T, et al. Quantitative CT evaluation of small pulmonary vessels in patients with acute pulmonary embolism. Acad Radiol. 2018;25(5):653–658. doi:10.1016/j.acra.2017.11.013
12. Sverzellati N, Siilva M. The matter of the lung: quantification of vascular substance in asthma. Am J Respir Crit Care Med. 2018;198(1):2. doi:10.1164/rccm.201804-0804ED
13. Cho YH, Lee SM, Seo JB, et al. Quantitative assessment of pulmonary vascular alterations in chronic obstructive lung disease: associations with pulmonary function test and survival in the KOLD cohort. Eur J Radiol. 2018;108:276–282. doi:10.1016/j.ejrad.2018.09.013
14. Matsuoka S, Washko GR, Dransfield MT, et al. Quantitative CT measurement of cross-sectional area of small pulmonary vessel in COPD: correlations with emphysema and airflow limitation. Acad Radiol. 2010;17(1):93–99. doi:10.1016/j.acra.2009.07.022
15. Takayanagi S, Kawata N, Tada Y, et al. Longitudinal changes in structural abnormalities using MDCT in COPD: do the CT measurements of airway wall thickness and small pulmonary vessels change in parallel with emphysematous progression? Int J Chron Obstruct Pulmon Dis. 2017;12:551–560. doi:10.2147/COPD.S121405
16. Galban CJ, Han MK, Boes JL, et al. Computed tomography-based biomarker provides unique signature for diagnosis of COPD phenotypes and disease progression. Nat Med. 2012;18(11):1711–1715. doi:10.1038/nm.2971
17. Bhatt SP, Washko GR, Hoffman EA, et al. Imaging advances in chronic obstructive pulmonary disease. Insights from the genetic epidemiology of chronic obstructive pulmonary disease (COPDGene) study. Am J Respir Crit Care Med. 2019;199(3):286–301. doi:10.1164/rccm.201807-1351SO
18. Pompe E, Galban CJ, Ross BD, et al. Parametric response mapping on chest computed tomography associates with clinical and functional parameters in chronic obstructive pulmonary disease. Respir Med. 2017;123:48–55. doi:10.1016/j.rmed.2016.11.021
19. Silva M, Nemec SF, Dufresne V, et al. Normal spectrum of pulmonary parametric response map to differentiate lung collapsibility: distribution of densitometric classifications in healthy adult volunteers. Eur Radiol. 2016;26(9):3063–3070. doi:10.1007/s00330-015-4133-1
20. Labaki WW, Gu T, Murray S, et al. Voxel-wise longitudinal parametric response mapping analysis of chest computed tomography in smokers. Acad Radiol. 2019;26(2):217–223. doi:10.1016/j.acra.2018.05.024
21. Global initiative for chronic obstructive lung disease. Global initiative for chronic obstructive lung disease-global strategy for the diagnosis, management, and prevention of chronic obstructive pulmonary disease (2022 Report) [EB/OL]; 2021.
22. Matsuoka S, Kurihara Y, Yagihash K, et al. Airway dimensions at inspiratory and expiratory multisection CT in chronic obstructive pulmonary disease: correlation with airflow limitation. Radiology. 2008;248(3):1042–1049. doi:10.1148/radiol.2491071650
23. Wu F, Chen L, Huang J, et al. Total Lung and Lobar Quantitative assessment based on paired inspiratory-expiratory Chest CT in healthy adults: correlation with pulmonary ventilatory function. Diagnostics. 2021;11(10):11. doi:10.3390/diagnostics11101791
24. Cao X, Gao X, Yu N, et al. Potential value of expiratory CT in quantitative assessment of pulmonary vessels in COPD. Front Med. 2021;8:761804. doi:10.3389/fmed.2021.761804
25. Pistenmaa CL, Nardelli P, Ash SY, et al. Pulmonary arterial pruning and longitudinal change in percent emphysema and lung function: the genetic epidemiology of COPD study. Chest. 2021;160(2):470–480. doi:10.1016/j.chest.2021.01.084
26. Synn AJ, Li W, San ER, et al. Radiographic pulmonary vessel volume, lung function and airways disease in the Framingham Heart Study. Eur Respir J. 2019;54(3):11. doi:10.1183/13993003.00408-2019
27. Yoshimure K, Suzuki Y, Uto T, et al. Morphological changes in small pulmonary vessels are associated with severe acute exacerbation in chronic obstructive pulmonary disease. Int J Chron Obstruct Pulmon Dis. 2016;11:1435–1445. doi:10.2147/COPD.S107424
28. Mashimo S, Chubachi S, Tsutsumi A, et al. Relationship between diminution of small pulmonary vessels and emphysema in chronic obstructive pulmonary disease. Clin Imaging. 2017;46:85–90. doi:10.1016/j.clinimag.2017.07.008
29. Aaron C, Hoffman E, Lima J, et al. Pulmonary vascular volume, impaired left ventricular filling and dyspnea: the Mesa Lung Study. PLoS One. 2017;12(4):e0176180. doi:10.1371/journal.pone.0176180
30. Estepar RS, Kinney GL, Black JL, et al. Computed tomographic measures of pulmonary vascular morphology in smokers and their clinical implication. Am J Respir Crit Care Med. 2013;188(2):231–239. doi:10.1164/rccm.201301-0162OC
31. Barker AL, Eddy RL, Macneil JL, et al. CT pulmonary vessels and MRI ventilation in chronic obstructive pulmonary disease: relationship with worsening FEV1 in the TINCan cohort study. Acad Radiol. 2021;28(4):495–506. doi:10.1016/j.acra.2020.03.006
32. Sun X, Meng X, Zhang P, et al. Quantification of pulmonary vessel volumes on low-dose computed tomography in a healthy male Chinese population: the effects of aging and smoking. Quant Imaging Med Surg. 2022;12(1):406–416. doi:10.21037/qims-21-160
33. Synn AJ, Zhang C, Washko GR, et al. Cigarette smoke exposure and radiographic pulmonary vascular morphology in the Framingham heart study. Ann Am Thorac Soc. 2019;16(6):698–706. doi:10.1513/AnnalsATS.201811-795OC
34. Rahaghi FN, Nardelli P, Harder E, et al. Quantification of arterial and venous morphologic markers in pulmonary arterial hypertension using CT imaging. Chest. 2021;160(6):2220–2231. doi:10.1016/j.chest.2021.06.069
35. Washko GR, Nardelli P, Ash SY, et al. Arterial vascular pruning, right ventricular size, and clinical outcomes in chronic obstructive pulmonary disease. A Longitudinal Observational Study. Am J Respir Crit Care Med. 2019;200(4):454–461. doi:10.1164/rccm.201811-2063OC
 © 2022 The Author(s). This work is published and licensed by Dove Medical Press Limited. The
full terms of this license are available at https://www.dovepress.com/terms
and incorporate the Creative Commons Attribution
- Non Commercial (unported, 3.0) License.
By accessing the work you hereby accept the Terms. Non-commercial uses of the work are permitted
without any further permission from Dove Medical Press Limited, provided the work is properly
attributed. For permission for commercial use of this work, please see paragraphs 4.2 and 5 of our Terms.
© 2022 The Author(s). This work is published and licensed by Dove Medical Press Limited. The
full terms of this license are available at https://www.dovepress.com/terms
and incorporate the Creative Commons Attribution
- Non Commercial (unported, 3.0) License.
By accessing the work you hereby accept the Terms. Non-commercial uses of the work are permitted
without any further permission from Dove Medical Press Limited, provided the work is properly
attributed. For permission for commercial use of this work, please see paragraphs 4.2 and 5 of our Terms.
Recommended articles
Phenotyping COPD Patients with Emphysema Distribution Using Quantitative CT Measurement; More Severe Airway Involvement in Lower Dominant Emphysema
Park J, Kim EK, Lee SH, Kim MA, Kim JH, Lee SM, Lee JS, Oh YM, Lee SD, Lee JH
International Journal of Chronic Obstructive Pulmonary Disease 2022, 17:2013-2025
Published Date: 31 August 2022
Clinical and Radiological Features Between Patients with Stable COPD from Plateau and Flatlands: A Comparative Study
Jiang Z, Wang X, Zhang L, Yangzom D, Ning Y, Su B, Li M, ChuTso M, Chen Y, Liang Y, Sun Y
International Journal of Chronic Obstructive Pulmonary Disease 2023, 18:849-858
Published Date: 12 May 2023
Chronic Marijuana Use and Chronic Obstructive Pulmonary Disease: A Case Report
Ostertag BS, Hendrickson KW
International Journal of Chronic Obstructive Pulmonary Disease 2025, 20:2305-2309
Published Date: 7 July 2025
Differentiating Emphysema From Emphysema-Dominated COPD Patients with CT Imaging Feature and Machine Learning
Guo W, Li M, Li Y, Fan X, Wu L
International Journal of Chronic Obstructive Pulmonary Disease 2025, 20:2615-2628
Published Date: 25 July 2025
Pathogenesis, Diagnostic Advances, and Therapeutic Management of Chronic Obstructive Pulmonary Disease: A Narrative Review
Wang S, Han H, Hu X, Hong K
International Journal of Chronic Obstructive Pulmonary Disease 2026, 21:599148
Published Date: 6 May 2026