Back to Journals » International Journal of Women's Health » Volume 18
Bidirectional Associations Between Frailty and Preeclampsia: A Two-Sample Mendelian Randomization Study
Authors Tian C ![]() , Hu D, Feng J, Li X, Guo Z, Zhu X, Gai C, Zhu H
, Hu D, Feng J, Li X, Guo Z, Zhu X, Gai C, Zhu H
Received 26 February 2026
Accepted for publication 22 May 2026
Published 9 June 2026 Volume 2026:18 605392
DOI https://doi.org/10.2147/IJWH.S605392
Checked for plagiarism Yes
Review by Single anonymous peer review
Peer reviewer comments 2
Editor who approved publication: Dr Marta Barba
Chenghang Tian, Die Hu, Jing Feng, Xia Li, Zhenyu Guo, Xueying Zhu, Cong Gai, Huimin Zhu
School of Traditional Chinese Medicine, Beijing University of Chinese Medicine, Beijing, 102488, People’s Republic of China
Correspondence: Huimin Zhu, School of Traditional Chinese Medicine, Beijing University of Chinese Medicine, 11 North Third Ring East Road, Chaoyang District, Beijing, 102488, People’s Republic of China, Tel/Fax +86-10-5391 1430, Email [email protected]
Objective: This study aims to elucidate the potential bidirectional genetic relationship between frailty and preeclampsia (PE), which currently remains unclear.
Methods: We performed a bidirectional two-sample Mendelian randomization (MR) analysis to assess the causal link between the frailty index (FI) and PE. Summary statistics for FI were sourced from the IEU Open GWAS project (ebi-a-GCST90020053). For PE, two independent datasets were employed: one from IEU Open GWAS (ebi-a-GCST90018906) and another from the FinnGen R12 release (finn-b-O15_PREECLAMPS), to improve robustness and generalizability. The primary analysis used the inverse variance weighted (IVW) method, supported by MR-Egger, weighted median, simple mode and weighted mode methods. Sensitivity analyses were performed using Cochrane’s Q test, the MR-Egger intercept test, the MR-PRESSO global test and leave-one-out analysis.
Results: Genetically predicted FI conferred an increased odds of PE, as robustly demonstrated by the IVW method in both independent datasets: ebi-a-GCST90018906 (OR = 3.027, 95% CI [1.445, 6.343], P = 0.003]) and finn-b-O15_PREECLAMPS (OR = 1.561, 95% CI [1.013, 2.404], P = 0.043). Conversely, PE also showed a significant causal effect on FI in the FinnGen dataset (OR = 1.047, 95% CI [1.031, 1.064], P < 0.001). These results indicate that higher genetically predicted frailty is a risk factor for PE and PE may in turn contribute to the exacerbation of frailty. The robustness of these associations was supported by consistent findings across multiple sensitivity analyses.
Conclusion: This study provides suggestive genetic evidence for a potential bidirectional relationship between frailty and PE. The forward-direction findings, with frailty as the exposure and PE as the outcome, were consistently supported across two independent datasets, while the reverse-direction findings, with PE as the exposure and frailty as the outcome, were dataset-dependent and require further validation. Frailty may represent a promising target for obstetric risk stratification, pending confirmation in pregnant populations.
Keywords: frailty, preeclampsia, causality, genetic epidemiology, Mendelian randomization
Introduction
Preeclampsia (PE) is a multisystem condition of pregnancy, characterized by the onset of hypertension and proteinuria beyond the 20th week, and is a major contributor to maternal and fetal morbidity and mortality worldwide.1 The implications of PE are extensive and multifactorial, affecting both the mother and the offspring. Mothers with PE face risks of kidney, liver injury, severe hypertension, cerebrovascular events and lung dysfunction.2,3 Fetuses are susceptible to intrauterine growth restriction, fetal distress, stillbirth or preterm birth.4,5 Offspring exposed to PE in utero may experience long-term health issues, including elevated risks of hypertension, cardiovascular disease, neurodevelopmental delays, altered growth patterns and endocrine dysfunction.6 Globally, PE affects between 2% and 8% of all pregnancies.7 An estimated 4 million women are diagnosed with the condition annually, contributing to more than 70,000 maternal deaths and 500,000 fetal or neonatal losses each year,8 underscoring its substantial threat to maternal and infant health. While the exact pathogenesis of PE remains elusive, it is believed to stem from aberrant placental development, coupled with endothelial dysfunction, oxidative stress, immunological factors, and genetic predisposition.9 Currently, the sole curative intervention for PE is placental delivery, frequently requiring medically induced preterm birth.10 These adverse consequences have placed enormous strain on health and social care systems. Therefore, the formulation of effective early-prevention strategies is of paramount importance for mitigating the global burden of PE.
Frailty is increasingly recognized as a significant public health issue. This clinical syndrome is marked by an erosion of physiological reserves across multiple systems and an increased susceptibility to stressors, which collectively heightens the risk of negative outcomes like falls, hospitalizations and death.11 Existing evidence has established associations between frailty and various conditions, including depression,12 disability,13 reduced renal function,14 cardiovascular disease,15 neurodegenerative diseases16,17 and increased mortality.18 Notably, pregnancy induces substantial physiological and psychological changes such as shifts in dietary habits,19 reduced physical activity levels,20 mood disturbances including depression21 and endocrine shifts affecting hormonal balance,22 which may collectively disrupt maternal homeostasis and potentially contribute to the development or exacerbation of frailty. Moreover, research has demonstrated a significant correlation between multiple pregnancies and an elevated risk of frailty.23 The frailty index (FI) has emerged as a robust quantitative tool for assessing an individual’s health deficit burden. It is defined as the proportion of present health deficits relative to the total number of measured indicators. These deficits may encompass diseases, disabilities, clinical signs, abnormal laboratory or imaging findings and psychosocial parameters.24 A higher FI value indicates more severe frailty. Its strength lies in its ability to integrate multidimensional health information, thereby providing a comprehensive evaluation and enhancing the prediction of poor clinical outcomes.
Frailty has traditionally been studied in older adults, yet the core concept, a diminished physiological reserve that increases susceptibility to stressors, is not inherently age-specific. Pregnancy represents a substantial physiological challenge that taxes cardiovascular, metabolic, and immune systems, and may therefore expose or amplify underlying vulnerability in a manner conceptually analogous to the stress tests that reveal frailty in older populations. Indeed, both pregnancy and aging are characterized by chronic low-grade inflammation, endothelial dysfunction and oxidative stress, suggesting shared biological mechanisms that may link the two processes. Both conditions exhibit these overlapping pathways, which have been independently documented in each. These pathways are common to many chronic diseases, however, and their presence alone does not necessarily imply a causal link between frailty and PE. Whether the shared mechanisms reflect a genuine causal connection at the genetic level has yet to be tested. Elucidating this connection could unveil novel risk markers for PE and pave the way for early screening and interventions in high-risk groups, ultimately enhancing maternal and infant outcomes while reducing complication risks.
While randomized controlled trials (RCTs) are widely regarded as the gold standard for establishing causality in clinical research and provide the highest level of evidence-based medical evidence,25 ethical and practical constraints preclude their use in this context. As an alternative, Mendelian randomization (MR) has emerged as a powerful methodological approach for causal inference. By leveraging genetic variants as instrumental variables (IVs), MR mimics the random assignment of an RCT, thereby reducing confounding and mitigating reverse causality, while providing robust evidence for causal associations.26 To fill this knowledge gap, we used a two-sample MR framework based on pooled data from large-scale genome-wide association studies (GWAS) to assess the causal association between genetic predictions of FI and PE.
Methods
Study Design
This study was designed as a bidirectional two-sample MR study, with the MR analysis flowchart shown in Figure 1. The analysis adhered to three core MR assumptions: (1) Relevance assumption: Genetic instruments exhibit strong associations with the exposure; (2) Independence assumption: The instruments must be independent of any confounding factors that influence the exposure-outcome relationship; (3) Exclusion restriction: Instruments influence the outcome exclusively through the exposure, with no direct or alternative pathways.27 All statistical analyses in this study were performed using RStudio (version 4.5.0) and TwoSampleMR (version 0.6.15). This research report follows the STROBE-MR reporting guidelines for MR-enhanced epidemiological observational research reports.28
 |
Figure 1 MR analysis flowchart. |
Data Sources
The GWAS data for FI were sourced from the IEU Open GWAS project (ebi-a-GCST90020053), which were derived from a large-scale meta-analysis comprising individuals of European ancestry from two cohorts: participants from the UK Biobank (n = 164,610; aged 60–70 years; including 84,819 females [51.3%]) and from the Swedish TwinGene study (n = 10,616; aged 41–87 years; including 5,577 females [52.5%]). FI calculation was based on 49 or 44 self-reported items on symptoms, disabilities and diagnosed diseases for UK Biobank and TwinGene respectively.29 Summary statistics for PE were obtained from two independent GWAS: one from the IEU Open GWAS project (ebi-a-GCST90018906) and the other from the FinnGen Consortium R12 release (finn-b-O15_PREECLAMPS). Data on PE (ebi-a-GCST90018906) were sourced from a 2021 Nature Genetics publication comprising a cross-population atlas of genetic associations for 220 human phenotypes, including 267,242 individuals (2,355 cases) and 24,165,538 SNPs.30 The second PE dataset (finn-b-O15_PREECLAMPS) included 268,336 participants, among whom there were 9,023 cases. All summary data were based on European populations. GWAS summary statistics are provided in Table 1.
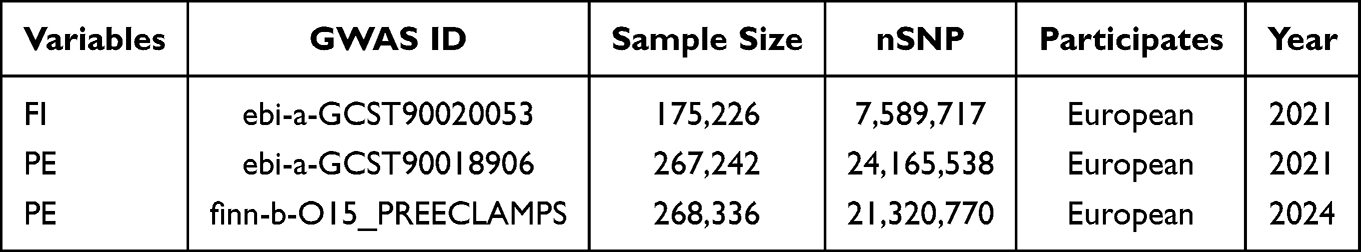 |
Table 1 Summary Information of GWAS Data |
Selection of IVs
SNPs significantly associated with FI were selected at a genome-wide significance threshold of P < 5.0×10⁻⁸. For PE, the conventional genome-wide significance threshold yielded too few SNPs for reliable instrumental variable analysis. We therefore adopted a more lenient threshold of P < 5.0 × 10⁻⁶, an approach used in prior MR studies when genome-wide significant instruments are scarce.31–33 To minimize linkage disequilibrium, clumping was performed by setting thresholds of R2 < 0.001 and distance = 10,000 kb. To mitigate bias from weak instruments, only SNPs with an F-statistic > 10 were retained.34 The F-statistic was calculated as F = R2 (N – 2) / (1 − R2), where R2 represents the proportion of variance in the exposure explained by the instrument and N denotes the sample size.35 The value of R2 was derived using the formula: R2 = β2 / (β2 + N × SE2), in which β refers to the estimated effect size of the allele on the phenotype and SE to its standard error. During the harmonization of exposure and outcome datasets, palindromic SNPs were removed to ensure allele consistency. Additionally, SNPs showing significant association with the outcome (P < 5.0 × 10⁻⁸) were excluded to avoid potential pleiotropic effects. The remaining SNPs were used as IVs in the MR analysis. To evaluate the biological relevance of our genetic instruments, we annotated all selected SNPs for their genomic context. Chromosomal positions, the nearest gene, and the predicted functional consequence were obtained from the Ensembl database (GRCh38). We then performed a manual literature review to determine whether each annotated gene has a known role in frailty or PE biology.
MR Analysis
This study implemented multiple MR approaches to evaluate causal effects between FI and PE. The inverse variance weighted (IVW) analysis served as the primary analysis method,36 supplemented by the MR-Egger method, weighted median method, simple mode, weighted mode and sensitivity analyses. The IVW method is the primary analytical tool used to estimate potential causal relationships because it provides the most accurate results and the selected SNPs are valid IVs.37 The weighted median method allows for the existence of IVs that have no effect on the outcome in 50% of cases and yields stable effect values even in the presence of heterogeneity.38 The MR-Egger method evaluates the causal effect of an exposure on an outcome while allowing for potential pleiotropic effects of all IVs.39 The simple mode selects the most frequent causal effect among IVs without weighting. It works best when most instruments have consistent effect directions, ignoring outliers effectively. The weighted mode assigns greater weight to more precise estimates, thereby diminishing the influence of less reliable ones. Odd ratio (OR) with 95% confidence intervals (95% CI) quantified effect sizes, with statistical significance defined at P < 0.05.
Directionality Test
Steiger directionality testing was conducted to verify the assumed causal direction for each exposure-outcome pair in the bidirectional MR design, as described by Hemani et al.40 This test compares the variance explained by each genetic instrument in the exposure versus the outcome. A larger R2 for the exposure supports the hypothesized causal direction.
Sensitivity Analysis
To ensure the robustness of our MR results against heterogeneity and horizontal pleiotropy, we performed comprehensive sensitivity analyses. Heterogeneity across IVs was evaluated using Cochran’s Q statistic within both the IVW and MR-Egger methods, with a P-value below 0.05 indicating significant heterogeneity. Horizontal pleiotropy was assessed using the MR-Egger intercept test, where a statistically significant deviation of the intercept term from zero (P < 0.05) was interpreted as evidence of horizontal pleiotropy.39 We further applied the MR-PRESSO global test to detect and correct for horizontal pleiotropy through outlier removal, with P-values empirically derived from 10,000 simulations. If significant global heterogeneity is detected, a local outlier test is subsequently conducted to identify any outlier SNPs. When horizontal pleiotropy variation is below 10%, MR-PRESSO is more precise and has lower bias compared to the IVW and MR-Egger methods.41 Finally, a leave-one-out sensitivity analysis was performed by iteratively excluding each SNP to evaluate the influence of IVs on the overall MR estimate and to identify potential sources of bias. Collectively, these approaches enhance the reliability and validity of our causal inference.
Results
Selected IVs
Based on established IVs selection criteria, genetic instruments were identified from the aggregated data to investigate the potential causal effect between FI and PE. After rigorous screening, 14 SNPs were identified as IVs for FI. For the PE dataset, we identified 11 (ebi-a-GCST90018906) and 36 (finn-b-O15_PREECLAMPS) strongly associated SNPs respectively. The strength of all instruments was robust, with F-statistics greatly exceeding the conventional threshold of 10. Specifically, F-statistics ranged from 30.000 to 119.121 for FI-associated SNPs, from 20.980 to 27.687 for PE IVs from the IEU source and from 20.873 to 55.222 for PE IVs from FinnGen, indicating a low likelihood of weak instrument bias.
Steiger Directionality Test
The Steiger directionality test confirmed the assumed causal direction for all four exposure-outcome pairs. All genetic instruments explained more variance in the assumed exposure than in the outcome (steiger_dir = TRUE for all SNPs), supporting the hypothesized causal directions. Although single-SNP Steiger P-values did not reach nominal significance, this is not unexpected given the modest variance explained by individual instruments. No SNPs were excluded due to directionality concerns. Details of all IVs, including their chromosomal location, nearest gene, functional consequence, and relevance to frailty or PE biology, are provided in Table S1.
Forward MR
In the forward MR analysis evaluating the effect of FI on PE (ebi-a-GCST90018906), the IVW analysis revealed a statistically significant impact of FI on PE (OR = 3.027, 95% CI [1.445, 6.343], P = 0.003]. This positive effect was further supported by weighted median (OR = 4.812, 95% CI [1.713, 13.521], P = 0.003) and weighted mode (OR = 5.360, 95% CI [1.168, 24.612], P = 0.050). Although MR-Egger and simple mode analyses did not reach statistical significance (P > 0.05), the direction of effect estimates was consistent with that of the IVW method, suggesting coherence across all five MR methods in supporting a positive causal effect of FI on PE (Table 2). Sensitivity analyses reinforced the robustness of these findings (Table 3). No significant heterogeneity was detected among IVs using Cochran’s Q statistic from the IVW method (P > 0.05). The funnel plot exhibited approximate symmetry, which is consistent with the absence of significant heterogeneity as indicated by Cochran’s Q test. Both the MR-Egger intercept test and the MR-PRESSO global test indicated no substantial horizontal pleiotropy (P > 0.05). Furthermore, the leave-one-out analysis confirmed that the overall causal estimate remained stable after sequentially removing each SNP, indicating that the causal relationship was unaffected by any single SNP. In summary, the MR analyses provide evidence supporting a causal effect of genetically predicted FI on the risk of PE. Funnel, scatter and forest plots from the forward MR analysis are presented in Figures 2–4.
 |
Table 2 MR Results for the Bidirectional Association of the FI with PE (Ebi-a-GCST90018906) |
 |
Table 3 Sensitivity Analyses of Forward MR |
 |
Figure 2 Funnel plot for the MR analysis of FI on PE (ebi-a-GCST90018906). |
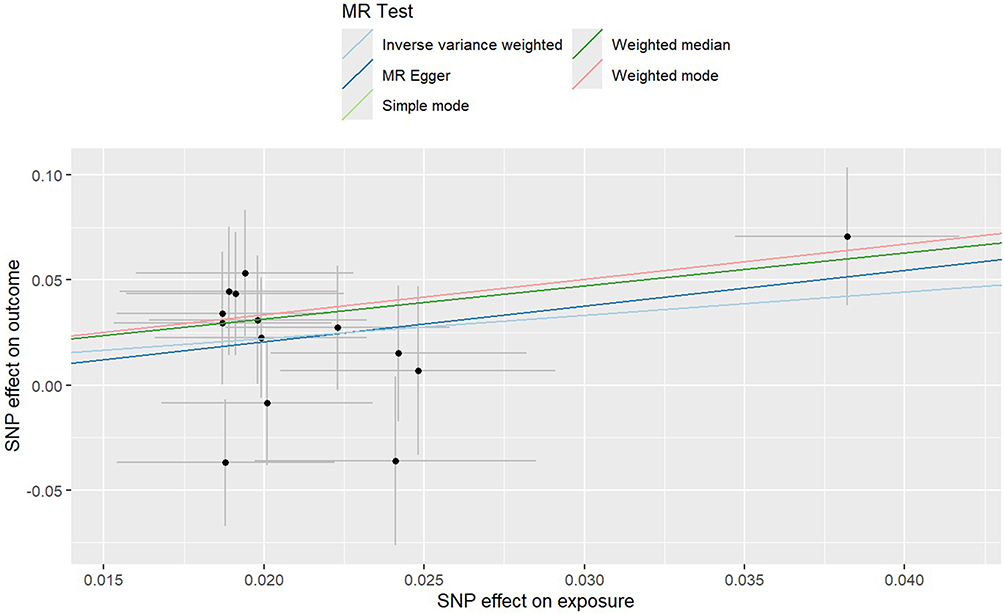 |
Figure 3 Scatter plot for the MR analysis of FI on PE (ebi-a-GCST90018906). |
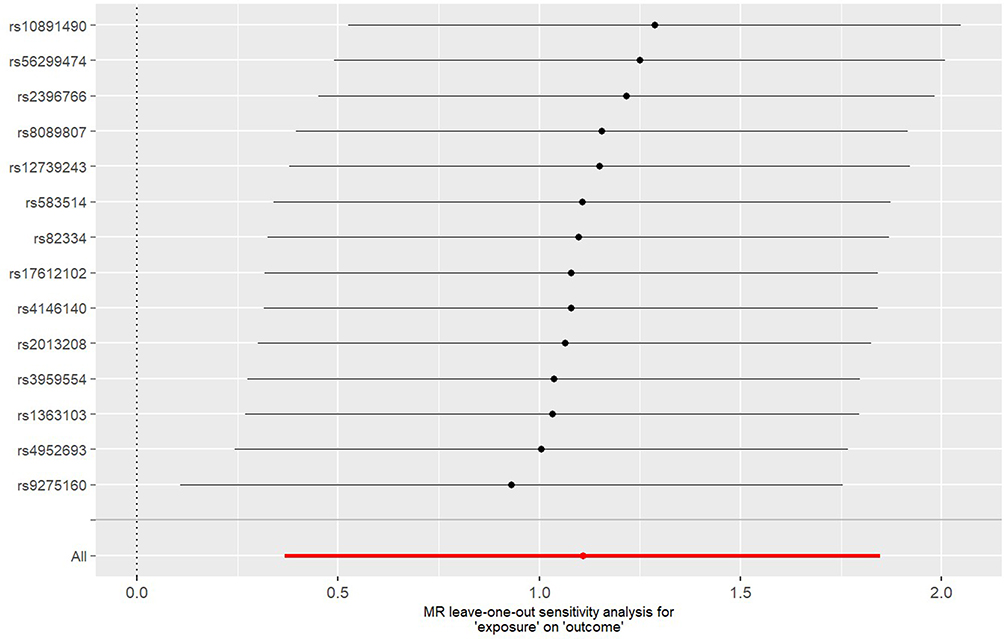 |
Figure 4 Forest plot for the MR analysis of FI on PE (ebi-a-GCST90018906). |
A separate MR analysis was conducted using PE from the FinnGen R12 consortium (finn-b-O15_PREECLAMPS) as the outcome. Similarly, the IVW method demonstrated a significant positive effect of FI on PE (OR = 1.561, 95% CI [1.013, 2.404], P = 0.043) (Table 4). Sensitivity results were consistent with the primary analysis: no heterogeneity or horizontal pleiotropy was detected (P > 0.05) and leave-one-out analysis again indicated robust estimates unaffected by IVs (Table 3). Supporting visualizations are included as Figures 5–7. In summary, the consistent causal estimates obtained across multiple independent GWAS datasets for the exposure (FI) strengthen the genetic evidence that a higher genetically predicted FI significantly increases the risk of PE, enhancing the credibility and robustness of our findings.
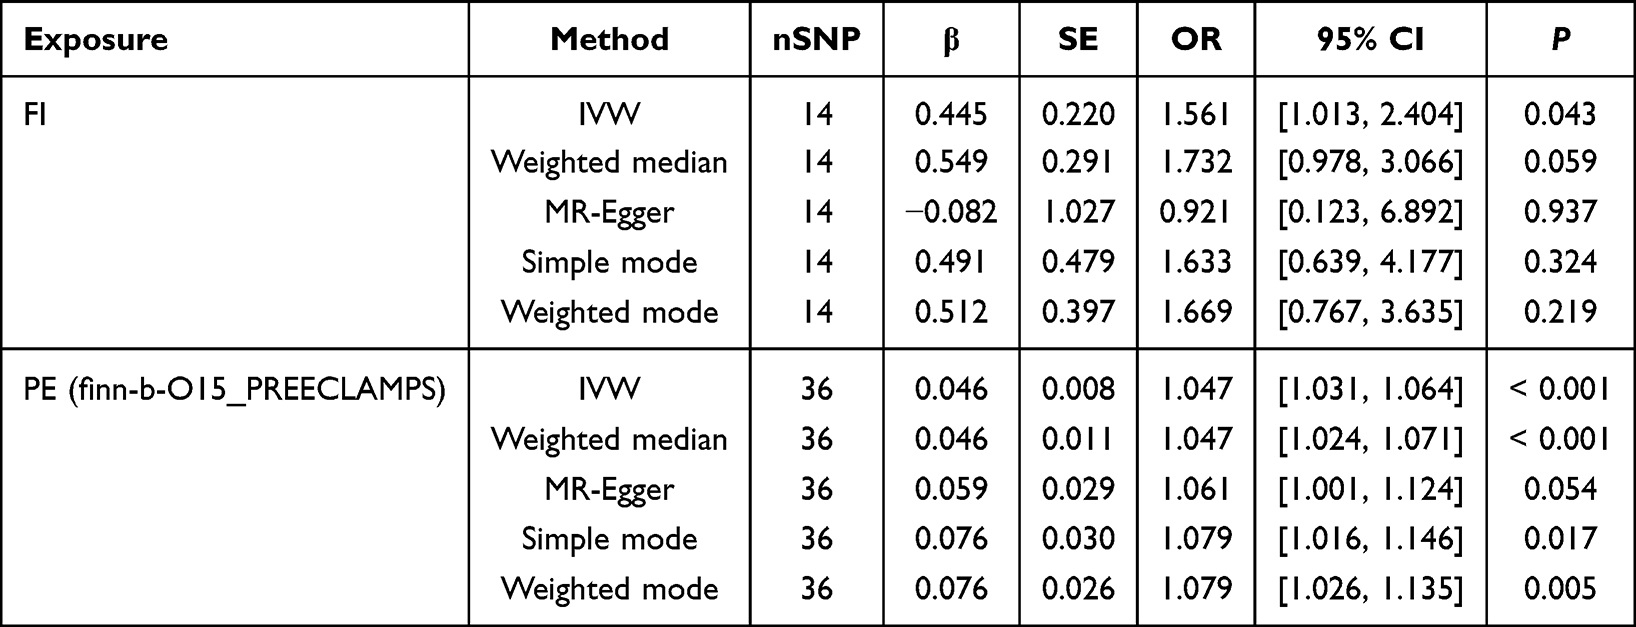 |
Table 4 MR Results for the Bidirectional Association of the FI with PE (Finn-b-O15_PREECLAMPS) |
 |
Figure 5 Funnel plot for the MR analysis of FI on PE (Finn-b-O15_PREECLAMPS). |
 |
Figure 6 Scatter plot for the MR analysis of FI on PE (Finn-b-O15_PREECLAMPS). |
 |
Figure 7 Forest plot for the MR analysis of FI on PE (Finn-b-O15_PREECLAMPS). |
Reverse MR
In the reverse MR analysis evaluating the effect of PE on FI (ebi-a-GCST90018906), none of the five methods employed (IVW, weighted median, MR-Egger, simple mode or weighted mode) supported a causal association (P > 0.05) (Table 2). Cochran’s Q test indicated the presence of moderate heterogeneity among the IVs in both the IVW and MR-Egger methods (P < 0.05). Interestingly, assessment of horizontal pleiotropy yielded discordant results: the MR-Egger intercept test showed no evidence of pleiotropic bias (intercept = 0.0042, P = 0.405), whereas the MR-PRESSO global test indicated potential bias (P < 0.05). Leave-one-out analysis confirmed that the overall estimates remained stable after sequential exclusion of individual SNPs (Table 5). Owing to the substantial heterogeneity and the discordance between pleiotropy diagnostics, the results do not support a reliable inference regarding a reverse causal effect of PE on FI. Funnel, scatter and forest plots from the reverse MR analysis are presented in Figures 8–10.
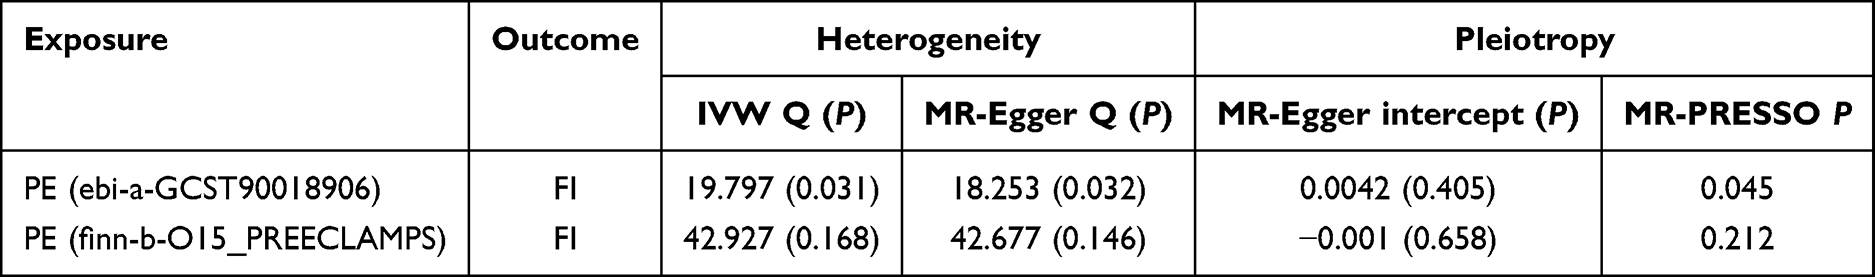 |
Table 5 Sensitivity Analyses of Reverse MR |
 |
Figure 8 Funnel plot for the MR analysis of PE (ebi-a-GCST90018906) on FI. |
 |
Figure 9 Scatter plot for the MR analysis of PE (ebi-a-GCST90018906) on FI. |
 |
Figure 10 Forest plot for the MR analysis of PE (ebi-a-GCST90018906) on FI. |
Excitingly, our results showed markedly improved consistency and strength of association across methods in the reverse MR analysis with PE as exposure and FI (finn-b-O15_PREECLAMPS) as outcome (Table 4). The IVW, weighted median, simple mode and weighted mode methods all consistently supported an inverse causal relationship between FI and PE, indicating that higher PE increases the risk of FI (IVW: OR = 1.047, 95% CI [1.031, 1.064], P < 0.001; weighted median: OR = 1.047, 95% CI [1.024, 1.071], P < 0.001; simple mode: OR = 1.079, 95% CI [1.016, 1.146], P = 0.017; weighted mode: OR = 1.079, 95% CI [1.016, 1.146], P = 0.005). Sensitivity analyses indicated no evidence of heterogeneity (Cochran’s Q P > 0.05) or horizontal pleiotropy (MR-Egger intercept and MR-PRESSO global test P > 0.05) (Table 5). Visual inspection of the funnel plot and leave-one-out analysis further confirmed the stability and robustness of the causal estimate. These results suggest that genetic predisposition to PE is associated with increased FI, supporting a potential causal role of PE in exacerbating frailty. Supporting visualizations are included as Figures 11–13.
 |
Figure 11 Funnel plot for the MR analysis of PE (Finn-b-O15_PREECLAMPS) on FI. |
 |
Figure 12 Scatter plot for the MR analysis of PE (Finn-b-O15_PREECLAMPS) on FI. |
 |
Figure 13 Forest plot for the MR analysis of PE (Finn-b-O15_PREECLAMPS) on FI. |
Discussion
This bidirectional MR analysis provides suggestive genetic evidence for a potential link between frailty and PE. An elevated genetic susceptibility to frailty was consistently associated with an increased risk of PE across two independent datasets. In the reverse direction, genetic predisposition to PE was associated with elevated FI in the FinnGen dataset, though this finding was not replicated in the IEU dataset, suggesting a potential but inconclusive reverse relationship. These findings offer novel insights into the shared etiology and underlying mechanisms linking frailty and PE, and further highlight their long-term implications for maternal health.
The consistency of the results across multiple MR methods and sensitivity analyses strengthens the validity of the observed associations, though some methodological nuances warrant consideration. In the forward MR analyses, MR-Egger and simple mode estimates did not reach nominal significance in some instances, yet their effect directions were consistent with the IVW results. This is not unexpected with a limited number of instruments, as conservative methods like MR-Egger often have reduced statistical power, and does not necessarily argue against a causal effect. In the reverse direction, the MR findings were inconsistent between the two PE datasets, with a significant association observed in FinnGen but not in the IEU dataset. The two datasets represent independent cohorts, and this divergence likely reflects genuine between-cohort variability. The reverse association should therefore be interpreted as dataset-dependent and requiring further validation. Additionally, the OR of 3.027 for FI on PE in the IEU dataset is moderately higher than typical MR estimates, which may reflect the limited number of instruments, the relaxed selection threshold, and potential residual pleiotropy. The FinnGen dataset yielded a more modest estimate (OR = 1.561), and the direction of effect was consistent across both datasets and across all MR methods. The consistency in direction across datasets and methods therefore provides more reliable evidence than the magnitude of any single estimate.
The observed bidirectional relationship between frailty and PE may be underpinned by several overlapping pathophysiological mechanisms. Frailty, marked by chronic low-grade inflammation, endothelial dysfunction, immune dysregulation and reduced physiological resilience,42–44 may increase susceptibility to PE by compromising vascular adaptation to pregnancy and exacerbating responses to placental stress. Conversely, PE can precipitate or worsen frailty through persistent vascular injury, systemic inflammatory activation and oxidative stress, which collectively promote accelerated cellular aging and multisystem functional decline.45,46 Furthermore, clinical interventions such as iatrogenic preterm delivery and the associated physiological and psychological burdens of PE may impair postnatal recovery and perpetuate a state of vulnerability,47 supporting the possibility of a cyclical interaction between frailty and PE. These mechanistic hypotheses, while biologically plausible, should be interpreted with caution, as no genetic mediation analysis was performed to directly link the identified instrumental SNPs to the proposed pathways.
Numerous clinical tools and biomarkers are currently employed for the prediction and screening of PE. A notable early-pregnancy screening algorithm integrates mean arterial pressure, uterine artery pulsatility index measured by Doppler ultrasound and maternal serum placental growth factor (PlGF) levels, demonstrating a detection rate of approximately 82% for PE when applied in the first trimester.48 However, the widespread implementation of such multimodal screening is constrained by high costs, reliance on specialized equipment and the need for trained sonographers. Beyond early pregnancy combined screening algorithms, another biomarker innovation for PE has entered clinical use gradually: the soluble fms-like tyrosine kinase 1 (sFlt-1) to PlGF ratio. A prospective multicenter observational study indicated that an sFlt-1/PlGF ratio ≤ 38 effectively rules out the short-term development of PE among women with clinical suspicion of the disease.49,50
In addition to the screening tools and biomarkers already applied clinically or entering validation phases, research leveraging high-throughput omics technologies has identified numerous potential PE-associated biomarkers in recent years, including 4-hydroxyglutamate,51 first-trimester placental protein 13 (PP13),52 the eosinophil-based complete blood count,53 cell-free DNA,54 placenta-specific extracellular microRNAs,55 and various oxidative stress markers such as ischemia-modified albumin (IMA), uric acid (UA) and malondialdehyde (MDA).56 Additional candidates involve spot urinary protein-to-creatinine ratio,57 N-terminal pro-brain natriuretic peptide (NT-proBNP) and brain natriuretic peptide (BNP),58 among others. These biomarkers may reflect the pathophysiological processes of PE across multiple dimensions such as placental dysfunction, inflammatory responses, oxidative stress and vascular endothelial injury. Although these biomarkers demonstrate certain predictive value or pathological relevance in exploratory studies, most remain in preclinical validation or small-scale trial phases. Their specificity, sensitivity, predictive timeliness and clinical applicability require further evaluation. Integrating these multi-omics biomarkers for combined analysis may represent a key direction for enhancing the accuracy of early PE prediction in the future.
While established biomarkers offer valuable pathways for the early screening and prevention of PE, their integration into widespread clinical practice remains challenging, especially within resource-constrained healthcare environments. Limitations primarily stem from their reliance on sophisticated instrumentation, labor-intensive protocols and substantial financial investment, which collectively restrict scalable implementation globally. In comparison, frailty, as a multidimensional clinical phenotype, can be efficiently evaluated using a range of simple, low-cost and validated assessment tools such as questionnaire-based scales. These features make it particularly suitable for deployment within primary care settings and medically underserved populations, thereby facilitating earlier identification of women at elevated risk of PE. More importantly, frailty itself is both modifiable and reversible.59 Improving frailty through multifaceted strategies may potentially contribute to reducing the risk of PE onset, as a potential preventive approach. In summary, frailty not only demonstrates considerable clinical applicability and accessibility but also holds notable public health implications and potential translational medical potential, suggesting its potential as a complementary tool for risk assessment in obstetric settings, though validation in pregnant populations is required before clinical implementation.
A range of frailty assessment tools have been created and validated over recent decades to measure physiological reserve and vulnerability in various patient groups. Commonly employed tools include the Edmonton Frailty Scale (EFS),60 the FI of Accumulative Deficits,24 the Clinical Frailty Scale (CFS),61 the Groningen Frailty Indicator (GFI),62 the Frailty Risk Score (FRS)63 and the Frailty Trait Scale (FTS),64 among others. To better understand the theoretical foundations underlying these tools, two influential frameworks are worth highlighting: the phenotypic model and the deficit accumulation model. The first, the Physical Frailty Phenotype (PFP) proposed by Fried et al, conceptualizes frailty as a distinct clinical syndrome characterized by specific physical criteria. Its objective is to pinpoint individuals with diminished physiological reserves who are predisposed to stressors and adverse outcomes.65 In contrast, the deficit accumulation model offers a complementary perspective by quantifying frailty as a continuous gradient of risk based on the proportion of health deficits present in an individual. This approach provides a highly sensitive and quantitative measure that captures the overall burden of multisystem dysregulation.24 The development of assessment tools based on these two complementary models has provided researchers and clinicians with flexible, low-cost and operationally feasible approaches for evaluating frailty. As our study establishes a genetic link between frailty and PE, these practical tools hold significant potential for improving early screening strategies and facilitating the identification of high-risk pregnant women.
Current evidence supports physical exercise and nutritional interventions as effective strategies for ameliorating frailty. A systematic review of 47 trials demonstrated that structured exercise programs, particularly long-term multicomponent interventions delivered three times weekly for 30–45 minutes per session, produce significant benefits in frail older adults.66 A network meta-analysis further identified physical activity as the most potent non-pharmacological strategy for frailty reduction, highlighting the efficacy of resistance, mind-body, and aerobic training.67 According to the 2024 compendium for older adults, low-to-moderate intensity exercise is highly beneficial for frailty, while it advises against routinely implementing high-intensity regimens.68 Nutritional status also profoundly influences frailty progression. Both malnutrition and obesity are associated with increased frailty risk, with prolonged obesity duration compounding this effect.69–71 In addition, evidence from the Chinese Longitudinal Healthy Longevity Study suggests dietary diversity, adequate protein intake and consumption of tea and fruits are inversely associated with frailty. These well-established interventions against frailty may also offer secondary benefits for PE prevention. Given the established association between frailty and PE risk, improving frailty through targeted exercise and nutritional approaches could represent a viable strategy for reducing PE incidence.
In terms of public health policy, future studies may explore whether frailty assessment during the preconception period or early pregnancy could aid in identifying women at elevated risk of PE. For women diagnosed with high frailty, personalized intervention strategies, such as nutritional support, resistance exercise training and psychosocial assistance, could be considered for future evaluation. Furthermore, in future frailty screening efforts, researchers should carefully consider the assessment’s purpose, available resources, priority settings, target population characteristics and feasibility when selecting appropriate frailty assessment tools to ensure intervention effectiveness. For survivors of PE, clinicians may consider that their health risks reflect a broader trend of systemic vulnerability rather than an isolated susceptibility to a single condition. Consequently, postpartum care could extend beyond disease-specific short-term follow-up and transition to a comprehensive long-term health management strategy based on the concept of frailty.
A key contribution of this work is the demonstration of a potential genetic association between frailty and PE, a relationship that has not previously been examined using MR methods. Our approach, which utilizes extensive GWAS datasets and complementary methods, has robustly mitigated the confounding biases and reverse causation that often plague conventional epidemiology. Therefore, our methodologically rigorous approach provides suggestive genetic evidence for a potential causal association between these two conditions. More importantly, by investigating the potential bidirectional relationship between frailty and PE, we develop evidence-based policy recommendations that target PE prevention strategies, facilitate early identification of high-risk populations and improve long-term management of frailty among PE survivors. Further investigation of these interventions in prospective studies is warranted to evaluate their potential for reducing the disease burden associated with both conditions.
It is important to acknowledge several limitations inherent to this study. First, the GWAS data used in this analysis were based exclusively on European populations. Therefore, it remains uncertain whether the identified causal relationship between frailty and PE can be generalized to other ethnic or geographic groups. Second, the selection of IVs was limited to SNPs available in existing GWAS databases, which may not capture all relevant genetic variants associated with the traits of interest. A further consideration concerns the source population of the FI GWAS. These data were derived from individuals aged 41 to 87 years, whereas PE is a condition of younger pregnant women. Although we have argued conceptually that the core feature of frailty, diminished physiological reserve, is not inherently age-specific, the genetic architecture of frailty-related traits may differ between general adult populations and pregnant women. The extent to which the genetic instruments identified in this GWAS capture pregnancy-relevant vulnerability therefore requires validation in future studies conducted specifically in obstetric populations. Additionally, the FI was constructed based on GWAS data from the general population, which may exhibit subtle differences compared to frailty defined during pregnancy, necessitating careful consideration. An additional limitation is that our analysis did not differentiate between early-onset and late-onset PE. Future research should specifically examine the association between frailty and these subtypes, as their underlying mechanisms and clinical presentations may warrant separate investigation. Such differentiation could improve risk stratification and contribute to more personalized preventive approaches. Regarding the relaxed instrument selection threshold for PE, all retained instruments had F-statistics well above 10 and we performed multiple sensitivity analyses, including the MR-Egger intercept test, MR-PRESSO, and the Steiger directionality test. However, multivariable MR was not conducted given the limited number of PE instruments, which may render such analyses underpowered. Residual pleiotropy therefore cannot be fully excluded, and our findings should be interpreted as suggestive rather than definitive causal evidence. Finally, although the MR study helps reduce confounding and reverse causation, the clinical applicability of our findings still requires further validation through prospective observational studies. Further biological investigation is also necessary to clarify the mechanisms connecting frailty and PE, which would in turn provide a stronger scientific basis for diagnostic, therapeutic and public health interventions.
Conclusion
This MR study provides suggestive genetic evidence for a potential bidirectional relationship between frailty and PE. Specifically, a genetic predisposition to frailty was consistently associated with increased PE risk across two independent datasets. The reverse association, examining whether genetic predisposition to PE influences frailty, was observed in only one dataset and should be interpreted with caution. These findings suggest that preconception frailty assessment may warrant further investigation as a strategy to identify individuals at higher risk, and that improving pre-pregnancy health could potentially contribute to reducing PE incidence. For PE survivors, long-term monitoring and support may be beneficial to prevent or mitigate frailty, though this requires validation in prospective studies. Overall, these findings highlight the potential value of integrating frailty evaluation into maternal health research to better understand the pathogenesis and long-term consequences of PE.
Data Sharing Statement
Summary statistics used in this study were obtained from the IEU Open GWAS project (https://gwas.mrcieu.ac.uk) and the FinnGen consortium (https://www.finngen.fi/en). The derived datasets generated during the analysis are available from the corresponding author on reasonable request.
Ethics Approval and Consent to Participate
This study is a secondary analysis based exclusively on publicly available, de-identified summary-level data from genome-wide association studies (GWAS). No individual-level data were accessed or used. According to item 1 and item 2 of Article 32 of the Measures for Ethical Review of Life Science and Medical Research Involving Human Subjects (issued jointly by the National Health Commission, Ministry of Education, Ministry of Science and Technology, and National Administration of Traditional Chinese Medicine on February 18, 2023, China), research that uses legally obtained public data or anonymized data for secondary analysis is exempt from ethical review. Therefore, this study was exempted from institutional review board approval, and no additional ethical approval or patient consent was required.
Acknowledgments
We extend our sincere gratitude to all the consortia and investigators who made their GWAS summary data publicly available, which made this study possible. Specifically, we acknowledge the IEU Open GWAS project, the UK Biobank, the Swedish TwinGene study and the FinnGen consortium.
Author Contributions
All authors made a significant contribution to the work reported, whether that is in the conception, study design, execution, acquisition of data, analysis and interpretation, or in all these areas; took part in drafting, revising or critically reviewing the article; gave final approval of the version to be published; have agreed on the journal to which the article has been submitted; and agree to be accountable for all aspects of the work.
Funding
This work was supported by the National Natural Science Foundation of China (No. 82405153, 82104644), National Administration of Traditional Chinese Medicine High-level Key Discipline construction Project (No. zyyzdxk-2023262) and Fundamental Research Funds for the Central Universities (No. 2022-JYB-XJSJJ003).
Disclosure
No potential conflict of interest was reported by the authors.
References
1. Tomimatsu T, Mimura K, Matsuzaki S, Endo M, Kumasawa K, Kimura T. Preeclampsia: maternal systemic vascular disorder caused by generalized endothelial dysfunction due to placental antiangiogenic factors. Int J Mol Sci. 2019;20(17):4246. doi:10.3390/ijms20174246
2. Bokslag A, van Weissenbruch M, Mol BW, de Groot CJ. Preeclampsia; short and long-term consequences for mother and neonate. Early Hum Dev. 2016;102:47–18. doi:10.1016/j.earlhumdev.2016.09.007
3. ACOG Practice Bulletin No. 202: Gestational hypertension and preeclampsia. Obstet Gynecol. 2019;133(1):1.
4. Odegård RA, Vatten LJ, Nilsen ST, Salvesen KA, Austgulen R. Preeclampsia and fetal growth. Obstet Gynecol. 2000;96(6):950–955.
5. Harmon QE, Huang L, Umbach DM, et al. Risk of fetal death with preeclampsia. Obstet Gynecol. 2015;125(3):628–635. doi:10.1097/AOG.0000000000000696
6. Turbeville HR, Sasser JM. Preeclampsia beyond pregnancy: long-term consequences for mother and child. Am J Physiol Renal Physiol. 2020;318(6):F1315–F1326. doi:10.1152/ajprenal.00071.2020
7. Wang W, Xie X, Yuan T, et al. Epidemiological trends of maternal hypertensive disorders of pregnancy at the global, regional, and national levels: a population-based study. BMC Pregnancy Childbirth. 2021;21(1):364. doi:10.1186/s12884-021-03809-2
8. Espinoza J, Vidaeff A, Pettker CM, Simhan H. Gestational hypertension and preeclampsia: ACOG Practice bulletin, number 222. Obstet Gynecol. 2020;135(6):e237–e260. doi:10.1097/AOG.0000000000003891
9. Hypertensive Disorders in Pregnancy Subgroup, Chinese Society of Obstetrics and Gynecology, Chinese Medical Association. Diagnosis and treatment of hypertension and pre-eclampsia in pregnancy: a clinical practice guideline in China (2020). Zhonghua Fu Chan Ke Za Zhi. 2020;55(4):227–238. Chinese. doi:10.3760/cma.j.cn112141-20200114-00039
10. Ma’ayeh M, Costantine MM. Prevention of preeclampsia. Semin Fetal Neonatal Med. 2020;25(5):101123. doi:10.1016/j.siny.2020.101123
11. Hoogendijk EO, Afilalo J, Ensrud KE, Kowal P, Onder G, Fried LP. Frailty: implications for clinical practice and public health. Lancet. 2019;394(10206):1365–1375. doi:10.1016/S0140-6736(19)31786-6
12. Sang N, Li BH, Zhang MY, et al. Bidirectional causal relationship between depression and frailty: a univariate and multivariate Mendelian randomisation study. Age Ageing. 2023;52(7):afad113. doi:10.1093/ageing/afad113
13. Zhang Q, Zhao X, Liu H, Ding H. Frailty as a predictor of future falls and disability: a four-year follow-up study of Chinese older adults. BMC Geriatr. 2020;20(1):388. doi:10.1186/s12877-020-01798-z
14. Wang M, Sun X, Zhang W, et al. Frailty and the risk of kidney function decline in the elderly population: the Rugao Longevity and Ageing Study. Nephrol Dial Transplant. 2021;36(12):2274–2281. doi:10.1093/ndt/gfaa323
15. He D, Wang Z, Li J, et al. Changes in frailty and incident cardiovascular disease in three prospective cohorts. Eur Heart J. 2024;45(12):1058–1068. doi:10.1093/eurheartj/ehad885
16. Belvisi D, Canevelli M, Costanzo M, et al. The role of frailty in Parkinson’s disease: a cross-sectional study. J Neurol. 2022;269(6):3006–3014. doi:10.1007/s00415-021-10873-3
17. Sheng ZH, Liu JY, Ma JY, et al. Alzheimer’s disease neuroimaging initiative §. Frailty increases the risk of Alzheimer’s disease in non-demented individuals: a longitudinal cohort study. J Alzheimers Dis. 2025;103(4):1023–1035. doi:10.1177/13872877241309081
18. Kojima G, Iliffe S, Walters K. Frailty index as a predictor of mortality: a systematic review and meta-analysis. Age Ageing. 2018;47(2):193–200. doi:10.1093/ageing/afx162
19. Forbes LE, Graham JE, Berglund C, Bell RC. Dietary change during pregnancy and women’s reasons for change. Nutrients. 2018;10(8):1032. doi:10.3390/nu10081032
20. Ferrari N, Joisten C. Impact of physical activity on course and outcome of pregnancy from pre- to postnatal. Eur J Clin Nutr. 2021;75(12):1698–1709. doi:10.1038/s41430-021-00904-7
21. The American College of Obstetricians and Gynecologists Committee Opinion no. 630. Screening for perinatal depression. Obstet Gynecol. 2015;125(5):1268–1271. doi:10.1097/01.AOG.0000465192.34779.dc
22. Morton A, Teasdale S. Physiological changes in pregnancy and their influence on the endocrine investigation. Clin Endocrinol. 2022;96(1):3–11. doi:10.1111/cen.14624
23. Kojima G, Ogawa K, Iliffe S, Taniguchi Y, Walters K. Number of pregnancies and trajectory of frailty index: english longitudinal study of ageing. J Am Med Dir Assoc. 2020;21(9):1249–1253.e1. doi:10.1016/j.jamda.2020.04.010
24. Mitnitski AB, Mogilner AJ, Rockwood K. Accumulation of deficits as a proxy measure of aging. ScientificWorldJournal. 2001;1:323–336. doi:10.1100/tsw.2001.58
25. Zabor EC, Kaizer AM, Hobbs BP. Randomized controlled trials. Chest. 2020;158(1S):S79–S87. doi:10.1016/j.chest.2020.03.013
26. Sanderson E, Glymour MM, Holmes MV, et al. Mendelian randomization. Nat Rev Meth Primers. 2022;2:6. doi:10.1038/s43586-021-00092-5
27. Lovegrove CE, Howles SA, Furniss D, Holmes MV. Causal inference in health and disease: a review of the principles and applications of Mendelian randomization. J Bone Miner Res. 2024;39(11):1539–1552. doi:10.1093/jbmr/zjae136
28. Skrivankova VW, Richmond RC, Woolf BAR, et al. Strengthening the reporting of observational studies in epidemiology using mendelian randomisation (STROBE-MR): explanation and elaboration. Bmj. 2021;375:n2233. doi:10.1136/bmj.n2233
29. Atkins JL, Jylhävä J, Pedersen NL, et al. A genome-wide association study of the frailty index highlights brain pathways in ageing. Aging Cell. 2021;20(9):e13459. doi:10.1111/acel.13459
30. Sakaue S, Kanai M, Tanigawa Y, et al. A cross-population atlas of genetic associations for 220 human phenotypes. Nat Genet. 2021;53(10):1415–1424. doi:10.1038/s41588-021-00931-x
31. Yang X, Zhong Q, Huang M, et al. Causal relationship between gestational diabetes and preeclampsia: a bidirectional mendelian randomization analysis. Diabet Res Clin Pract. 2024;210:111643. doi:10.1016/j.diabres.2024.111643
32. Chen X, Liu Z, Cui J, Chen X, Xiong J, Zhou W. Circulating adipokine levels and preeclampsia: a bidirectional Mendelian randomization study. Front Genet. 2022;13:935757. doi:10.3389/fgene.2022.935757
33. Lin H, Zheng L, Jiang X, Huang M, Zhang H, Li Q. Association between sweet food consumption and preeclampsia: insights from an observational study and Mendelian randomization analysis. Clin Exp Hypertens. 2026;48(1):2612559. doi:10.1080/10641963.2025.2612559
34. Sanderson E, Spiller W, Bowden J. Testing and correcting for weak and pleiotropic instruments in two-sample multivariable Mendelian randomization. Stat Med. 2021;40(25):5434–5452. doi:10.1002/sim.9133
35. Pierce BL, Burgess S. Efficient design for Mendelian randomization studies: subsample and 2-sample instrumental variable estimators. Am J Epidemiol. 2013;178(7):1177–1184. doi:10.1093/aje/kwt084
36. Zheng J, Baird D, Borges MC, et al. Recent developments in mendelian randomization studies. Curr Epidemiol Rep. 2017;4(4):330–345. doi:10.1007/s40471-017-0128-6
37. Bowden J, Holmes MV. Meta-analysis and Mendelian randomization: a review. Res Synth Methods. 2019;10(4):486–496. doi:10.1002/jrsm.1346
38. Bowden J, Davey Smith G, Haycock PC, Burgess S. Consistent estimation in Mendelian randomization with some invalid instruments using a weighted median estimator. Genet Epidemiol. 2016;40(4):304–314. doi:10.1002/gepi.21965
39. Bowden J, Davey Smith G, Burgess S. Mendelian randomization with invalid instruments: effect estimation and bias detection through Egger regression. Int J Epidemiol. 2015;44(2):512–525. doi:10.1093/ije/dyv080
40. Hemani G, Tilling K, Davey Smith G. Orienting the causal relationship between imprecisely measured traits using GWAS summary data. PLoS Genet. 2017;13(11):e1007081. doi:10.1371/journal.pgen.1007081
41. Verbanck M, Chen CY, Neale B, Do R. Detection of widespread horizontal pleiotropy in causal relationships inferred from Mendelian randomization between complex traits and diseases. Nat Genet. 2018;50(5):693–698. doi:10.1038/s41588-018-0099-7
42. Ferrucci L, Fabbri E. Inflammageing: chronic inflammation in ageing,cardiovascular disease,and frailty. Nat Rev Cardiol. 2018;15(9):505–522. doi:10.1038/s41569-018-0064-2
43. Calila H, Bălășescu E, Nedelcu RI, Ion DA. Endothelial dysfunction as a key link between cardiovascular disease and frailty: a systematic review. J Clin Med. 2024;13(9):2686. doi:10.3390/jcm13092686
44. Li H, Manwani B, Leng SX.Frailty, inflammation, and immunity. Aging Dis. 2011;2(6):466–473. Epub 2011 Dec 2. PMID: 22396895; PMCID: PMC3295062.
45. Chiang YT, Seow KM, Chen KH. The pathophysiological, genetic, and hormonal changes in preeclampsia: a systematic review of the molecular mechanisms. Int J Mol Sci. 2024;25(8):4532. doi:10.3390/ijms25084532
46. Roger L, Tomas F, Gire V. Mechanisms and regulation of cellular senescence. Int J Mol Sci. 2021;22(23):13173. doi:10.3390/ijms222313173
47. Horsch A, Garthus-Niegel S, Ayers S, et al. Childbirth-related posttraumatic stress disorder: definition,risk factors,pathophysiology,diagnosis, prevention, and treatment. Am J Obstet Gynecol. 2024;230(3S):S1116–S1127. doi:10.1016/j.ajog.2023.09.089
48. Tan MY, Wright D, Syngelaki A, et al. Comparison of diagnostic accuracy of early screening for pre-eclampsia by NICE guidelines and a method combining maternal factors and biomarkers: results of SPREE. Ultrasound Obstet Gynecol. 2018;51(6):743–750. doi:10.1002/uog.19039
49. Zeisler H, Llurba E, Chantraine F, et al. Predictive value of the sFlt-1:PlGF ratio in women with suspected preeclampsia. N Engl J Med. 2016;374(1):13–22. doi:10.1056/NEJMoa1414838
50. Velegrakis A, Kouvidi E, Fragkiadaki P, Sifakis S. Predictive value of the sFlt-1/PlGF ratio in women with suspected preeclampsia: an update (Review). Int J Mol Med. 2023;52(4):89. doi:10.3892/ijmm.2023.5292
51. Sovio U, McBride N, Wood AM, et al. 4-Hydroxyglutamate is a novel predictor of pre-eclampsia. Int J Epidemiol. 2020;49(1):301–311. doi:10.1093/ije/dyz098
52. Khalil A, Cowans NJ, Spencer K, Goichman S, Meiri H, Harrington K. First trimester maternal serum placental protein 13 for the prediction of pre-eclampsia in women with a priori high risk. Prenat Diagn. 2009;29(8):781–789. doi:10.1002/pd.2287
53. Tanacan A, Sakcak B, Ipek G, et al. The role of first trimester eosinophil count and eosinophil-based complete blood cell indices in the predictiction of preeclampsia: a case-control study. Placenta. 2023;143:16–21. doi:10.1016/j.placenta.2023.09.011
54. Palei AC. Cell-free DNA as a potential biomarker for preeclampsia. Expert Rev Mol Diagn. 2021;21(12):1253–1256. doi:10.1080/14737159.2021.1997593
55. Timofeeva AV, Fedorov IS, Sukhova YV, Ivanets TY, Sukhikh GT. Prediction of early- and late-onset pre-eclampsia in the preclinical stage via placenta-specific extracellular miRNA profiling. Int J Mol Sci. 2023;24(9):8006. doi:10.3390/ijms24098006
56. Afrose D, Chen H, Ranashinghe A, et al. The diagnostic potential of oxidative stress biomarkers for preeclampsia: systematic review and meta-analysis. Biol Sex Differ. 2022;13(1):26. doi:10.1186/s13293-022-00436-0
57. Wu J, Yao Y, Wang T, Xu T, Jiang R. Pregnancy urine biomarkers for effectively preeclampsia prediction: a systematic review and meta-analysis. Hypertens Pregnancy. 2025;44(1):2487794. doi:10.1080/10641955.2025.2487794
58. Suciu VE, Leucuța DC, Măluțan AM, et al. NT-proBNP and BNP as biomarkers for preeclampsia: a systematic review and meta-analysis. Int J Mol Sci. 2025;26(13):6272. doi:10.3390/ijms26136272
59. Kolle AT, Lewis KB, Lalonde M, Backman C. Reversing frailty in older adults: a scoping review. BMC Geriatr. 2023;23(1):751. doi:10.1186/s12877-023-04309-y
60. Rolfson DB, Majumdar SR, Tsuyuki RT, Tahir A, Rockwood K. Validity and reliability of the edmonton frail scale. Age Ageing. 2006;35(5):526–529. doi:10.1093/ageing/afl041
61. Rockwood K, Song X, MacKnight C, et al. A global clinical measure of fitness and frailty in elderly people. Cmaj. 2005;173(5):489–495. doi:10.1503/cmaj.050051
62. Peters LL, Boter H, Buskens E, Slaets JP. Measurement properties of the Groningen Frailty Indicator in home-dwelling and institutionalized elderly people. J Am Med Dir Assoc. 2012;13(6):546–551. doi:10.1016/j.jamda.2012.04.007
63. Pijpers E, Ferreira I, van de Laar RJ, Stehouwer CD, Nieuwenhuijzen Kruseman AC. Predicting mortality of psychogeriatric patients: a simple prognostic frailty risk score. Postgrad Med J. 2009;85(1007):4649. doi:10.1136/pgmj.2008.073353
64. García-García FJ, Carcaillon L, Fernandez-Tresguerres J, et al. A new operational definition of frailty: the Frailty Trait Scale. J Am Med Dir Assoc. 2014;15(5):371.e7–371.e13. doi:10.1016/j.jamda.2014.01.004
65. Cardiovascular Health Study Collaborative Research Group, Fried LP, Tangen CM, Walston J, et al. Frailty in older adults: evidence for a phenotype. J Gerontol a Biol Sci Med Sci. 2001;56(3):M146–56. doi:10.1093/gerona/56.3.M146
66. Theou O, Stathokostas L, Roland KP, et al. The effectiveness of exercise interventions for the management of frailty: a systematic review. J Aging Res. 2011;2011:569194. doi:10.4061/2011/569194
67. Sun X, Liu W, Gao Y, et al. Comparative effectiveness of non-pharmacological interventions for frailty: a systematic review and network meta-analysis. Age Ageing. 2023;52(2):afad004. doi:10.1093/ageing/afad004
68. Zang W, Fang M, Meng L, et al. Exercise prescription prescriptions for frailty improvement in older adults: an evidence-based approach based on the 2024 older adult compendium. Arch Gerontol Geriatr. 2025;130:105717. doi:10.1016/j.archger.2024.105717
69. Chang SF. Frailty is a major related factor for at risk of malnutrition in community-dwelling older adults. J Nurs Scholarsh. 2017;49(1):63–72. doi:10.1111/jnu.12258
70. Crow RS, Lohman MC, Titus AJ, et al. Association of obesity and frailty in older adults: NHANES 1999-2004. J Nutr Health Aging. 2019;23(2):138–144. doi:10.1007/s12603-018-1138-x
71. Landré B, Czernichow S, Goldberg M, Zins M, Ankri J, Herr M. Association between life-course obesity and frailty in older adults: findings in the GAZEL cohort. Obesity. 2020;28(2):388–396. doi:10.1002/oby.22682
 © 2026 The Author(s). This work is published and licensed by Dove Medical Press Limited. The
full terms of this license are available at https://www.dovepress.com/terms
and incorporate the Creative Commons Attribution
- Non Commercial (unported, 4.0) License.
By accessing the work you hereby accept the Terms. Non-commercial uses of the work are permitted
without any further permission from Dove Medical Press Limited, provided the work is properly
attributed. For permission for commercial use of this work, please see paragraphs 4.2 and 5 of our Terms.
© 2026 The Author(s). This work is published and licensed by Dove Medical Press Limited. The
full terms of this license are available at https://www.dovepress.com/terms
and incorporate the Creative Commons Attribution
- Non Commercial (unported, 4.0) License.
By accessing the work you hereby accept the Terms. Non-commercial uses of the work are permitted
without any further permission from Dove Medical Press Limited, provided the work is properly
attributed. For permission for commercial use of this work, please see paragraphs 4.2 and 5 of our Terms.
Recommended articles
Gastroesophageal Reflux Disease and Preterm Birth: Univariate and Multivariate Mendelian Randomization
Han X, Wu TQ, Yao R, Liu C, Chen L, Feng X
International Journal of Women's Health 2024, 16:1389-1399
Published Date: 13 August 2024
From Phenotype to Molecules: Unveiling the Genetic and Immunological Bridges Between Autoimmune Diseases and Vitiligo
Hu Y, Wang SB, Wang K, He MJ
Clinical, Cosmetic and Investigational Dermatology 2024, 17:2475-2486
Published Date: 4 November 2024
Exploring the Causal Relationship Between Frailty and Chronic Obstructive Pulmonary Disease: Insights From Bidirectional Mendelian Randomization and Mediation Analysis
Cheng Z, Wu J, Xu C, Yan X
International Journal of Chronic Obstructive Pulmonary Disease 2025, 20:193-205
Published Date: 25 January 2025
Bidirectional causal associations between frailty measures and sleep disturbances: a two-sample Mendelian randomization study
Che L, Zang H, Bi Y, Wen B, Xu L
Nature and Science of Sleep 2025, 17:271-284
Published Date: 7 February 2025
Endometriosis Severity and Risk of Preeclampsia: A Combined Mendelian Randomization and Observational Study
Zu Y, Xie Y, Zhang H, Chen L, Yan S, Wang Z, Fang Z, Lin S, Yan J
International Journal of Women's Health 2025, 17:923-935
Published Date: 27 March 2025