Back to Journals » Risk Management and Healthcare Policy » Volume 15
Better Adherence to the Taiwan Daily Food Guide is Associated with a Reduced Risk of Osteoporosis: A Population-Based Study in Taiwan
Authors Li MC ![]()
Received 2 September 2022
Accepted for publication 14 October 2022
Published 2 November 2022 Volume 2022:15 Pages 2023—2030
DOI https://doi.org/10.2147/RMHP.S387506
Checked for plagiarism Yes
Review by Single anonymous peer review
Peer reviewer comments 2
Editor who approved publication: Dr Jongwha Chang
Ming-Chieh Li1,2
1Department of Health Promotion and Health Education, College of Education, National Taiwan Normal University, Taipei, Taiwan; 2Department of Public Health, College of Public Health, China Medical University, Taichung, Taiwan
Correspondence: Ming-Chieh Li, Department of Health Promotion and Health Education, College of Education, National Taiwan Normal University, 162, Section 1, Heping E. Rd, Taipei, 106, Taiwan, Tel +886277491698, Email [email protected]
Introduction: We conducted a study to examine whether adherence to the Taiwan Daily Food Guide was associated with bone mineral density (BMD).
Methods: A population-based cross-sectional study was conducted utilizing data from the Nutrition and Health Survey in Taiwan (NAHSIT) 2013– 2016. A total of seven BMD sites were evaluated, including the head, arms, legs, trunk, ribs, pelvis, and spine BMD. Besides, we further examined the association between the Daily Food Guide adherence score and osteoporosis (T-score of ≤ − 2.5 standard deviation (SD) of a measured total BMD). A validated food-frequency questionnaire (FFQ) was used for dietary assessment.
Results: We included a total of 555 participants with osteoporosis and 1977 without osteoporosis in the final analysis. We found negative associations between levels of adherence to the Daily Food Guide and the risk of osteoporosis. The odds ratio (OR) for participants in the highest quartile of the adherence level was 0.61 (95% CI = 0.42– 0.88), compared with those in the lowest quartile. When participants had total servings of six food groups higher than the recommendation, the protective effect still existed (OR = 0.59, 95% CI = 0.42– 0.84).
Conclusion: Better adherence to the Taiwan Daily Food Guide is associated with a lower risk of osteoporosis.
Keywords: bone health, osteoporosis, Daily Food Guide, diet, vegetables
Introduction
Decreased bone mineral density (BMD), resulting in osteopenia or osteoporosis, might weaken bone architecture, which leads to an increased risk of bone fragility and fracture.1 Studies have shown that osteoporotic fractures are one of the most common causes of disability, medical costs, and mortality.2,3 Unfortunately, patients might not experience any symptoms of low BMD until a fracture occurs, thus identifying preventive strategy is needed.
The loss of BMD has been associated with various factors, including age, sex, lifestyle, family history, disease status, and nutritional status.4 Diet has been considered one of the major determinants in the acquisition of peak bone mass in early adults.5,6 Some studies identified important roles of specific nutrients, such as calcium and vitamin D, on bone health.7,8 Some studies have focused on specific food groups, including dairy products, fruits, vegetables, and whole grains, that are beneficial to bone health.9–12 Recent studies have focused on different dietary patterns, but not a specific nutrient or food group, on bone health. For example, a recent systematic review and meta-analysis concluded that a Prudent dietary pattern was associated with a lower risk of fracture, whereas a Western dietary pattern was associated with a higher risk of fracture.13 Another meta-analysis also found that a healthy diet, characterized by higher intakes of vegetables and fruits, poultry, fish, and whole grains, was associated with a reduced risk of low BMD and fracture.14
Although previous studies have identified the potential beneficial effects of a single nutrient, food groups, or certain dietary patterns on bone health, policymakers rarely declared to adopt specific one as a national dietary guideline. Alternatively, the policymakers release a general dietary guideline or Daily Food Guide for health promotion.15,16 Similarly, a new Taiwan Daily Food Guide has been released in 2018.17 Although some studies in Taiwan have identified the associations between specific dietary patterns and health outcomes,18–20 little is known about how adherence to the Taiwan Daily Food Guide relates to disease status. Because different diseases might be associated with various nutritional statuses, it is possible that the adoption of the recommendation from the Daily Food Guide is beneficial for some diseases but not for others. Some experts have further argued that a dietary guideline might be more harmful than helpful.21,22 Therefore, instead of identifying certain dietary patterns that relate to BMD, here we conducted a study to examine whether adherence to the Taiwan Daily Food Guide was associated with BMD.
Methods
We conducted a population-based cross-sectional study utilizing data from the Nutrition and Health Survey in Taiwan (NAHSIT) 2013–2016, which was established to monitor and investigate the nutritional status of Taiwan’s general population. The details of the survey method could be found elsewhere.17,18,23 The sampling strategy was as follows: study samples were selected via three-stage probability sampling covering 359 townships or city districts. First, the probability proportional to size sampling method was used to select eight primary sampling units (townships and city districts) and a total of 160 townships or city districts. The second stage was to select starting households randomly and construct sampling clusters within each selected primary sampling unit. The final stage was to conduct door-to-door interviews until the required number of the age and sex groups was reached. To avoid seasonal variations that may affect dietary consumption and nutritional status, the Latin square design was utilized to allocate data collection times evenly over the four seasons. To avoid bias due to the age factor, the present study restricted participants to adults aged 19 and above according to the definition of the newest version of the Taiwan Daily Food Guide. Participants underwent a physical examination at a temporary health examination station. Face-to-face interviews were conducted to obtain demographic data, including age, sex, education, marital status, smoking status, alcohol drinking, exercise, and self-reported medical history.
Definition of Osteoporosis
Participants were invited to a temporary health examination station and a mobile dual-energy X-ray absorptiometry (DXA) was used to measure the BMD in each specific body region.19,24,25 A total of seven BMD sites were evaluated, including the head, arms, legs, trunk, ribs, pelvis, and spine BMD. The median value of BMD at different BMD sites was used as the cut-off point when evaluating the associations between adherence to Daily Food Guide and BMD. In addition, we further examined the association between adherence to the Daily Food Guide and osteoporosis. Osteoporosis was defined as a T-score of ≤ −2.5 standard deviation (SD) of a measured total BMD using the World Health Organization criteria.26
Measurement of the Levels of Adherence to the Daily Food Guide
Trained interviewers conducted face-to-face interviews to assess participants’ dietary intake using a validated 79-item food-frequency questionnaire (FFQ).19,27–29
To prevent nutrient deficiencies (70% Dietary Reference Intakes), the Taiwan Ministry of Health and Welfare released the most updated Daily Food Guide in 2018. The Taiwan Daily Food Guide was constructed based on evidence from epidemiologic studies and also to reduce the risk of metabolic and cardiovascular diseases.17 The Daily Food Guide contains six food groups as follows: 1) cereals and whole grains; 2) protein-rich foods (soybean, fish, egg, and meat); 3) dairy products; 4) vegetables; 5) fruits; and 6) fats, oils, and nuts. The Daily Food Guide recommends minimal servings for the above six food groups according to the individual daily energy needs.
We have then constructed a Daily Food Guide index to measure the levels of adherence to the Daily Food Guide.17 Supplemental Table S1, outlines the components of the index used to calculate a single score for each study participant, allowing for the ranking of individuals according to their adherence levels.30 We did not assess levels of adherence to fat and oil intake because fat and oil intake levels were not adequately assessed by FFQ.
For each participant, the appropriate quantity of each food group they should be consuming was estimated on the basis of their likely energy needs. The energy needs were calculated based on healthy weight, resting metabolic rate, and level of physical activity.30,31 Healthy weight was calculated for each participant using the standard body mass index (BMI) of 22. The score that a person received in any of the food categories is determined by the appropriate number of servings for given daily energy needs. For instance, a person who consumed the recommended number of servings from any food group would receive a score of 1 for that food group; a person consuming no serving from a food group would receive a score of 0. The score is calculated proportionately between 0 and 1.
Statistical Analysis
Only participants with complete data were included in the final analysis. We categorized participants by quartile of Daily Food Guide index score. We divided all participants into five groups according to the Daily Food Guide index score. If a person received a total score higher than 6, she/he was grouped into group 5, indicating that she/he had consumed more than recommended servings in total. The rest participants who receive scores equal to or less than 6, were then divided by quartile of the Daily Food Guide index score. The associations between baseline personal characteristics and osteoporosis status were evaluated using Chi-square or Fisher’s Exact tests. Potential confounding factors were evaluated on the basis of previous knowledge and also taking into consideration the associations of baseline characteristics with Daily Food Guide index scores and osteoporosis status. Logistic regression models were utilized to examine whether the Daily Food Guide index score was related to the osteoporosis status (present or not present) for each BMD site. All the logistic models were adjusted for age, sex, BMI, education level, alcohol drinking, smoking status, physical activity, marital status, and family income. High physical activity was defined as having high-intensity activity ≥ 30 minutes per day (eg, lifting heavy objects 10 kg or above; jogging); Medium physical activity was defined as having medium-intensity activity ≥ 30 minutes per day (eg, lifting objects 4.5 to 9 kg; brisk walking). Frequent alcohol consumption was defined as alcohol drinking three or more times a week. Smoking status was defined as never, ever smoke, or current smoke. All analyses were performed by SAS 9.4 (SAS Institute, Cary, NC).
Results
We included a total of 555 participants with osteoporosis and 1977 without osteoporosis in the final analysis. Table 1 shows the comparisons of demographic characteristics between the two groups. Compared with participants without osteoporosis, participants with osteoporosis were more likely to be women (68.83% vs 46.54%); to be older (age > 65: 55.14% vs 21.96%); to have lower BMI (BMI < 24: 65.95% vs 46.79%); to have lower education level (college or above: 10.27% vs 24.78%); to be non-drinker (61.08% vs 42.84%); to be non-smoker (78.74% vs 68.54%); to have lower physical activity (57.66% vs 33.64%); to be not married or not live together with partner (62.70% vs 70.11%); to have lower family income (family income < New Taiwan dollar (NT) $40,000: 39.46% vs 26.50%).
 |
Table 1 Demographic Characteristics of Study Participants (n=2532) |
Table 2 displays the associations of the Daily Food Guide adherence score with BMD at different BMD sites. We found positive associations of the Daily Food Guide adherence score with head, ribs, and pelvis BMD, after adjusting for age, sex, BMI, education level, alcohol drinking, smoking status, physical activity, marital status, and family income. The odds ratio (OR) for participants who were in the highest quartile for recommended total serving consumption were 1.37 (95% confidence interval (CI) = 1.03–1.83) for Head BMD, 1.42 (95% CI = 1.01–2.01) for rib BMD, and 1.42 (95% CI = 1.03–1.95) for pelvis BMD, compared with those in the lowest quartile. Participants consuming a higher number of total servings than recommended were associated with increased BMD for head (OR = 1.42, 95% CI = 1.08–1.86), ribs (OR = 1.43, 95% CI = 1.03–2.00), pelvis (OR = 1.57, 95% CI = 1.16–2.13), spine (OR = 1.41, 95% CI = 1.05–1.89), and total BMD (OR = 1.59, 95% CI = 1.16–2.16).
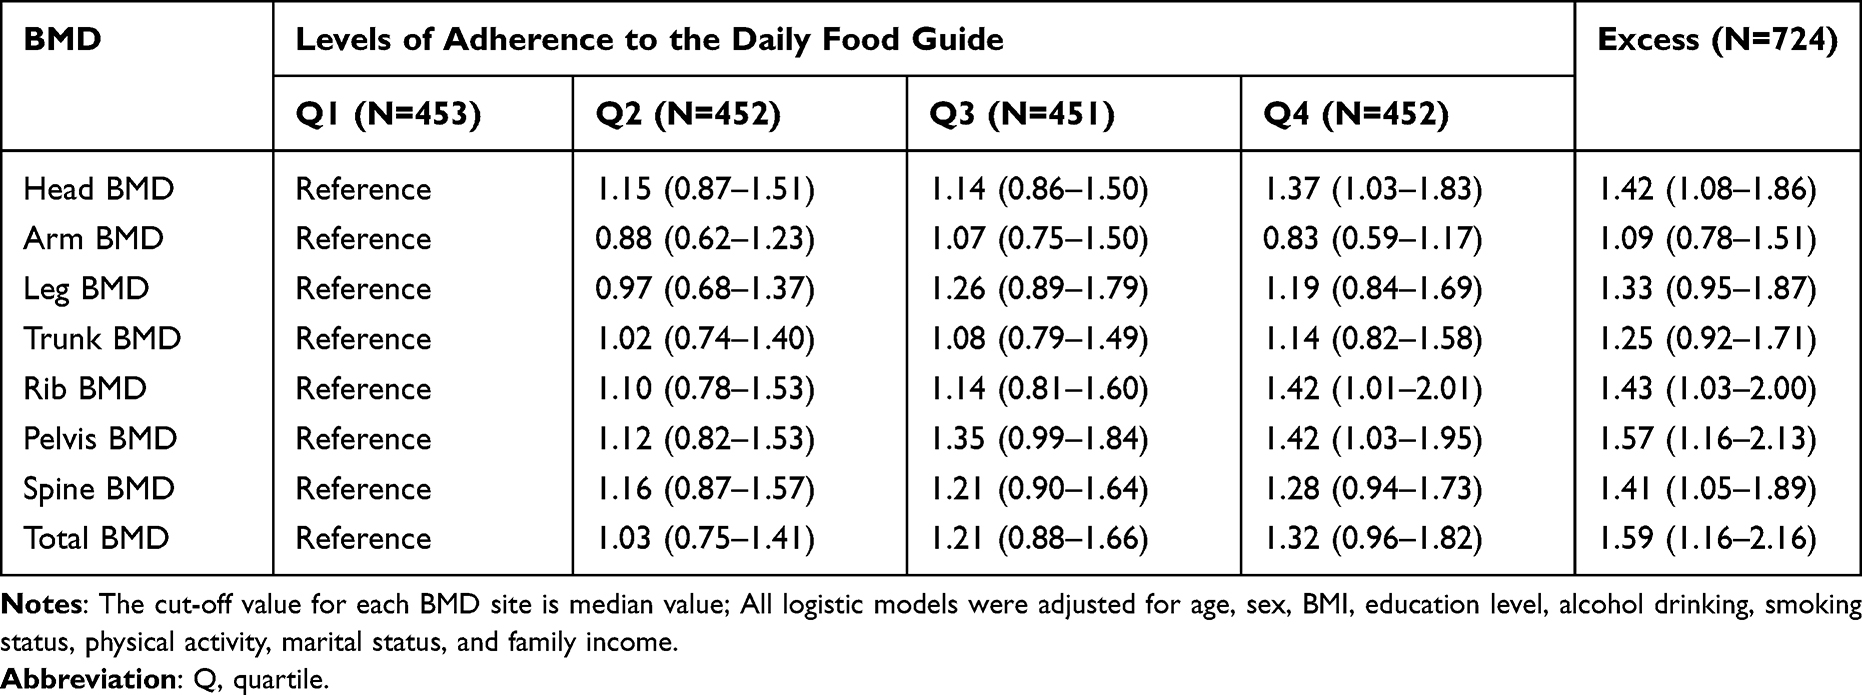 |
Table 2 Associations of Adherence to the Daily Food Guide Scores with BMD at Different BMD Sites |
Table 3 shows the associations between the Daily Food Guide adherence score and the risk of osteoporosis. We found a negative association between the Daily Food Guide adherence score and the risk of having osteoporosis, after adjusting for age, sex, BMI, education level, alcohol drinking, smoking status, physical activity, marital status, and family income. The OR for participants who were in the highest quartile for recommended total serving consumption was 0.61 (95% CI = 0.42–0.88), compared with those in the lowest quartile. Participants consuming a higher number of total servings than recommended were at reduced risk of osteoporosis (OR = 0.59, 95% CI = 0.42–0.84). We performed a sensitivity analysis adjusting all the models for the presence of type 2 diabetes and the findings did not change (data not shown).
 |
Table 3 Associations Between the Daily Food Guide Adherence Score and Risk of Having Osteoporosis |
Supplemental Table S2 displays the associations between adherence to individual food group index recommendations and the presence of osteoporosis. After adjusting for potential confounding factors, participants consumed half of the recommended servings or higher and did not higher than the recommended servings of each individual food group showed a protective effect on the risk of having osteoporosis. However, none of them reached statistically significant. Participants who consumed higher than the recommended servings of vegetables showed a significant protective effect on the risk of having osteoporosis.
Discussion
The current study suggested that participants reporting better adherence to the Taiwan Daily Food Guide, but not to recommended servings from a certain individual food group, was associated with increased BMD at several BMD sites, as well as a reduced risk of osteoporosis. Even though participants had consumed more than recommended total servings, the beneficial effects still existed. Unlike most previous studies, which examined the associations of a certain nutrient, food group, or dietary pattern with bone health, we examined how adherence to the government-published Daily Food Guide affected BMD. This might be a more useful approach because a government-published Daily Food Guide was more likely to be adopted by the public. Our study showed preliminary evidence that the Taiwan Daily Food Guide offers a potential benefit for bone health.
To our knowledge, limited studies have examined the associations between adherence to a general dietary guideline and bone health. Only one study conducted in the US examined if a diet consistent with the 2005 Dietary Guidelines for Americans was associated with higher BMD in men and women. However, they only presented the findings in an abstract. They found no association between adherence to the 2005 Dietary Guidelines and BMD sites in men or women.32 Most previous studies focused on the associations between dietary patterns and bone health.33 A scoping review concluded that better adherence to “healthy” dietary patterns, including the Mediterranean diet and the Healthy Eating Index (HEI), etc., were beneficial to BMD. On the contrary, the western dietary pattern might negatively impact bone health. A dietary pattern characterized by a high intake of fruit, vegetables, whole grains, poultry and fish, nuts and legumes, and low-fat dairy products was positively associated with bone health. The Taiwan Daily Food Guide also emphasized the intake of fruits and vegetables, whole grains, nuts, and dairy products. Our findings were generally consistent with previous studies.
Although examining the effects of individual food groups is not the main purpose of this study, we found that participants with higher vegetable intakes than recommended servings had a significant lower risk of osteoporosis. The finding was consistent with some previous studies, which suggested that a higher vegetable intake was associated with a lower risk of osteoporosis or osteopenia.9,11,34,35 However, some studies also identified no effect of vegetable intake.36–38 A systematic review and meta-analysis found a protective effect between fruit and vegetable intake and the risk of fractures. However, the meta-analysis did not differentiate the effects of vegetables and fruits.39 The possible mechanisms of the protective effect of vegetables are as follows:39 1) Fruit and vegetable intakes lead to mild alkalization of the body, increased calcium reabsorption, and resulted in reduced risk of bone loss.40 2) Intakes of fruits and vegetables have been associated with lower oxidative stress, which in turn increased the capacity of bone remodeling and improved bone repair capacity.41 3) Lower intakes of fruits and vegetables were linked to chronic inflammation, which has been associated with an increased risk of osteoporosis.42
This study has some limitations and strengths. The limitations are as follows: 1) We cannot establish causality due to the cross-sectional study design. 2) A one-time assessment of the dietary assessment might introduce misclassification of exposures and outcomes. However, if the misclassification is nondifferential, it usually leads to a bias toward the null and minimizes the associations. 3) We did not assess the fats and oils intakes because they were not adequately assessed by FFQ. How the fats and oils intakes affected the results was unclear. The strengths of this study are as follows: 1) The current study included a fair sample size so that we could better assess the possible associations. 2) The population-based design might allow us to generalize the findings to the general population.
Conclusion
In conclusion, adherence to the Taiwan Daily Food Guide shows positive associations with BMD. It could be a reference for developing national food guide for bone health. However, more prospective studies are still warranted to verify our findings.
Ethical Approval
This study was approved by the China Medical University & Hospital Research Ethics Center (CRREC-108-136). All participants originally gave informed consent to participate in the Nutrition and Health Survey in Taiwan including consent for their data to be used for future research purposes.
Acknowledgments
Dr. Ming-Chieh Li was supported by the National Science and Technology Council in Taiwan (NSTC 111-2410-H-003-100-SSS).
Disclosure
The author reports no conflict of interest in this work.
References
1. Ferdous H, Afsana F, Qureshi NK, Rouf RSB. Osteoporosis: a review. Birdem Med J. 2015;5(1):30–36. doi:10.3329/birdem.v5i1.28371
2. Bliuc D, Center JR. Determinants of mortality risk following osteoporotic fractures. Curr Opin Rheumatol. 2016;28(4):413–419. doi:10.1097/BOR.0000000000000300
3. Cummings SR, Melton LJ. Epidemiology and outcomes of osteoporotic fractures. Lancet. 2002;359(9319):1761–1767. doi:10.1016/S0140-6736(02)08657-9
4. Pouresmaeili F, Kamalidehghan B, Kamarehei M, Goh YM. A comprehensive overview on osteoporosis and its risk factors. Ther Clin Risk Manag. 2018;14:2029.
5. Matkovic V. Calcium and peak bone mass. J Intern Med. 1992;231(2):151–160.
6. Valimaki MJ, Karkkainen M, Lamberg-Allardt C, et al. Exercise, smoking, and calcium intake during adolescence and early adulthood as determinants of peak bone mass. BMJ. 1994;309(6949):230–235.
7. Dawson-Hughes B, Harris SS, Krall EA, Dallal GE. Effect of calcium and vitamin D supplementation on bone density in men and women 65 years of age or older. N Engl J Med. 1997;337(10):670–676. doi:10.1056/nejm199709043371003
8. Jackson RD, LaCroix AZ, Gass M, et al. Calcium plus vitamin D supplementation and the risk of fractures. N Engl J Med. 2006;354(7):669–683. doi:10.1056/NEJMoa055218
9. Macdonald HM, New SA, Golden MH, Campbell MK, Reid DM. Nutritional associations with bone loss during the menopausal transition: evidence of a beneficial effect of calcium, alcohol, and fruit and vegetable nutrients and of a detrimental effect of fatty acids. Am J Clin Nutr. 2004;79(1):155–165. doi:10.1093/ajcn/79.1.155
10. van den Heuvel E, Steijns J. Dairy products and bone health: how strong is the scientific evidence? Nutr Res Rev. 2018;31(2):164–178. doi:10.1017/s095442241800001x
11. Tucker KL, Hannan MT, Chen H, Cupples LA, Wilson PW, Kiel DP. Potassium, magnesium, and fruit and vegetable intakes are associated with greater bone mineral density in elderly men and women. Am J Clin Nutr. 1999;69(4):727–736. doi:10.1093/ajcn/69.4.727
12. McTiernan A, Wactawski-Wende J, Wu L, et al. Low-fat, increased fruit, vegetable, and grain dietary pattern, fractures, and bone mineral density: the women’s health initiative dietary modification trial. Am J Clin Nutr. 2009;89(6):1864–1876. doi:10.3945/ajcn.2008.26956
13. Denova-Gutiérrez E, Méndez-Sánchez L, Muñoz-Aguirre P, Tucker KL, Clark P. Dietary patterns, bone mineral density, and risk of fractures: a systematic review and meta-analysis. Nutrients. 2018;10(12):1922. doi:10.3390/nu10121922
14. Fabiani R, Naldini G, Chiavarini M. Dietary patterns in relation to low bone mineral density and fracture risk: a systematic review and meta-analysis. Adv Nutr. 2019;10(2):219–236. doi:10.1093/advances/nmy073
15. World Health Organization. Healthy Diet. World Health Organization; 2019.
16. DeSalvo KB, Olson R, Casavale KO. Dietary guidelines for Americans. JAMA. 2016;315(5):457–458. doi:10.1001/jama.2015.18396
17. Li MC, Fang HY. Adherence to daily food guides is associated with lower risk of metabolic syndrome: the nutrition and health survey in Taiwan. Nutrients. 2020;12(10):2955. doi:10.3390/nu12102955
18. Chuang S-Y, Lo Y-L, Wu S-Y, Wang P-N, Pan W-H. Dietary patterns and foods associated with cognitive function in Taiwanese older adults: the cross-sectional and longitudinal studies. J Am Med Dir Assoc. 2019;20(5):544–550. doi:10.1016/j.jamda.2018.10.017
19. Lo YL, Hsieh YT, Hsu LL, et al. Dietary pattern associated with frailty: results from nutrition and health survey in Taiwan. J Am Geriatr Soc. 2017;65(9):2009–2015. doi:10.1111/jgs.14972
20. Yeh C-J, Chang H-Y, Pan WH. Time trend of obesity, the metabolic syndrome and related dietary pattern in Taiwan: from NAHSIT 1993-1996 to NAHSIT 2005–2008. Asia Pac J Clin Nutr. 2011;20(2):292.
21. Albert Einstein College of Medicine. Do national dietary guidelines do more harm than good? Available from: https://www.sciencedaily.com/releases/2008/01/080122154703.htm.
22. Woolf SH, Nestle M. Do dietary guidelines explain the obesity epidemic? Am J Prev Med. 2008;34(3):263–265. doi:10.1016/j.amepre.2007.12.002
23. Chang HY, Suchindran CM, Pan WH. Using the overdispersed exponential family to estimate the distribution of usual daily intakes of people aged between 18 and 28 in Taiwan. Stat Med. 2001;20(15):2337–2350. doi:10.1002/sim.838
24. Lin YC, Pan WH. Bone mineral density in adults in Taiwan: results of the Nutrition and Health Survey in Taiwan 2005–2008 (NAHSIT 2005–2008). Asia Pac J Clin Nutr. 2011;20(2):283–291.
25. Lin SF, Fan YC, Pan WH, Bai CH. Bone and lean mass loss and cognitive impairment for healthy elder adults: analysis of the nutrition and health survey in Taiwan 2013–2016 and a validation study with structural equation modeling. Front Nutr. 2021;8:747877.
26. Cosman F, de Beur SJ, LeBoff MS, et al. Clinician’s guide to prevention and treatment of osteoporosis. Osteoporos Int. 2014;25(10):2359–2381. doi:10.1007/s00198-014-2794-2
27. Huang YC, Lee MS, Pan WH, Wahlqvist ML. Validation of a simplified food frequency questionnaire as used in the Nutrition and Health Survey in Taiwan (NAHSIT) for the elderly. Asia Pac J Clin Nutr. 2011;20(1):134–140.
28. Pan WH, Lee MM, Yu SL, Huang PC. Foods predictive of nutrient intake in Chinese diet in Taiwan: II. Vitamin A, vitamin B1, vitamin B2, vitamin C and calcium. Int J Epidemiol. 1992;21(5):929–934. doi:10.1093/ije/21.5.929
29. Lee MM, Pan WH, Yu SL, Huang PC. Foods predictive of nutrient intake in Chinese diet in Taiwan: i. Total calories, protein, fat and fatty acids. Int J Epidemiol. 1992;21(5):922–928. doi:10.1093/ije/21.5.922
30. Ministry of Health and Welfare. Daily food guides. Available from: https://www.hpa.gov.tw/Pages/EBook.aspx?nodeid=1208.
31. Academia Sinica Nutrition Information Network. How many calories should I eat? Available from:. https://www.ibms.sinica.edu.tw/health/plan.html.
32. Troy L, Hannan M, Booth S, et al. Are healthy diets that follow the 2005 Dietary Guidelines for Americans (DGA) associated with Bone Mineral Density (BMD) in men and women? J Bone Miner Res. 2006;21:S272–S272.
33. Movassagh EZ, Vatanparast H. Current evidence on the association of dietary patterns and bone health: a scoping review. Adv Nutr. 2017;8(1):1–16. doi:10.3945/an.116.013326
34. Vatanparast H, Baxter-Jones A, Faulkner RA, Bailey DA, Whiting SJ. Positive effects of vegetable and fruit consumption and calcium intake on bone mineral accrual in boys during growth from childhood to adolescence: the university of Saskatchewan pediatric bone mineral accrual study. Am J Clin Nutr. 2005;82(3):700–706. doi:10.1093/ajcn.82.3.700
35. Okubo H, Sasaki S, Horiguchi H, et al. Dietary patterns associated with bone mineral density in premenopausal Japanese farmwomen. Am J Clin Nutr. 2006;83(5):1185–1192. doi:10.1093/ajcn/83.5.1185
36. McGartland CP, Robson PJ, Murray LJ, et al. Fruit and vegetable consumption and bone mineral density: the Northern Ireland Young Hearts Project. Am J Clin Nutr. 2004;80(4):1019–1023. doi:10.1093/ajcn/80.4.1019
37. Langsetmo L, Poliquin S, Hanley DA, et al. Dietary patterns in Canadian men and women ages 25 and older: relationship to demographics, body mass index, and bone mineral density. BMC Musculoskelet Disord. 2010;11:20. doi:10.1186/1471-2474-11-20
38. Zalloua PA, Hsu YH, Terwedow H, et al. Impact of seafood and fruit consumption on bone mineral density. Maturitas. 2007;56(1):1–11. doi:10.1016/j.maturitas.2006.05.001
39. Brondani JE, Comim FV, Flores LM, Martini LA, Premaor MO. Fruit and vegetable intake and bones: a systematic review and meta-analysis. PLoS One. 2019;14(5):e0217223. doi:10.1371/journal.pone.0217223
40. New SA. Intake of fruit and vegetables: implications for bone health. Proc Nutr Soc. 2003;62(4):889–899. doi:10.1079/pns2003310
41. Harasym J, Oledzki R. Effect of fruit and vegetable antioxidants on total antioxidant capacity of blood plasma. Nutrition. 2014;30(5):511–517. doi:10.1016/j.nut.2013.08.019
42. Holt EM, Steffen LM, Moran A, et al. Fruit and vegetable consumption and its relation to markers of inflammation and oxidative stress in adolescents. J Am Diet Assoc. 2009;109(3):414–421. doi:10.1016/j.jada.2008.11.036
 © 2022 The Author(s). This work is published and licensed by Dove Medical Press Limited. The
full terms of this license are available at https://www.dovepress.com/terms
and incorporate the Creative Commons Attribution
- Non Commercial (unported, 3.0) License.
By accessing the work you hereby accept the Terms. Non-commercial uses of the work are permitted
without any further permission from Dove Medical Press Limited, provided the work is properly
attributed. For permission for commercial use of this work, please see paragraphs 4.2 and 5 of our Terms.
© 2022 The Author(s). This work is published and licensed by Dove Medical Press Limited. The
full terms of this license are available at https://www.dovepress.com/terms
and incorporate the Creative Commons Attribution
- Non Commercial (unported, 3.0) License.
By accessing the work you hereby accept the Terms. Non-commercial uses of the work are permitted
without any further permission from Dove Medical Press Limited, provided the work is properly
attributed. For permission for commercial use of this work, please see paragraphs 4.2 and 5 of our Terms.
Recommended articles
Associations Between Body Mass Index, WNT16 rs2908004 and Osteoporosis: Findings from Taiwan Biobank
Wu CL, Nfor ON, Tantoh DM, Lu WY, Liaw YP
Journal of Multidisciplinary Healthcare 2022, 15:2751-2758
Published Date: 6 December 2022
Evaluation of Bone Health in Postmenopausal Women Using Long-Term Levothyroxine Treatment Due to Post-Procedural Hypothyroidism
Apaydin M, Surel F, Kazan S
International Journal of General Medicine 2024, 17:6139-6144
Published Date: 12 December 2024