Back to Journals » Journal of Inflammation Research » Volume 18
Baseline Expanded Disability Status Scale Score and CD8+ T Cell Levels as Risk Factors for Disability Progression in Multiple Sclerosis
Authors Liu PJ, Yuan P, Liu SP
Received 13 May 2025
Accepted for publication 1 October 2025
Published 29 October 2025 Volume 2025:18 Pages 15049—15061
DOI https://doi.org/10.2147/JIR.S540152
Checked for plagiarism Yes
Review by Single anonymous peer review
Peer reviewer comments 2
Editor who approved publication: Dr Shouya Feng
Pen-Ju Liu, Peng Yuan, Shui-Ping Liu
Department of Neurology, Beijing Anzhen Hospital, Capital Medical University, Beijing, 100029, People’s Republic of China
Correspondence: Pen-Ju Liu, Department of Neurology, Beijing Anzhen Hospital, Capital Medical University, No. 2 Anzhen Road, Chaoyang District, Beijing, 100029, People’s Republic of China, Tel +86 13521678687, Email [email protected]
Objective: This study aimed to investigate peripheral blood T cell subset characteristics and identify risk factors associated with disability progression in patients with multiple sclerosis (MS).
Methods: We retrospectively analysed the clinical data of patients with MS treated at the Neurology Department of our hospital between May 2014 and August 2024. T lymphocyte subsets were assessed using flow cytometry. Patients were categorised into disability progression and non-progression groups based on changes in their Expanded Disability Status Scale (EDSS) scores from baseline to final assessment. Clinical data from both groups were analysed to identify independent risk factors for disability progression.
Results: Of the patients with MS included, 68.84% had relapsing–remitting MS, with subacute onset being the most common (47.10%) and limb weakness the primary presenting symptom (34.06%). Significant differences (p < 0.05) were observed between progression and non-progression groups in disease duration, relapse frequency, onset symptoms, baseline and final EDSS scores and T lymphocyte subset distribution. Multivariate logistic regression analysis identified baseline EDSS score (95% confidence interval [CI]: 1.101– 2.253, p = 0.014) and CD8+ T cell levels (95% CI: 0.603– 1.491, p = 0.042) as independent risk factors for disability progression in patients with MS (p < 0.05).
Conclusion: Baseline EDSS scores and CD8+ T cell levels are independent risk factors for disability progression in MS and may serve as important indicators for monitoring disease progression.
Keywords: multiple sclerosis, T cell subsets, disability, risk factors
Introduction
Multiple sclerosis (MS) is a chronic autoimmune-mediated demyelinating disease of the central nervous system (CNS), characterized by immune cell infiltration, axonal damage, and myelin loss, which lead to progressive neurological dysfunction.1 Although MS is more in Western countries, its incidence in China remains relatively low, with only 1–2 cases per 100,000 individuals.2,3 Substantial evidence from lymphocyte infiltration patterns, genetic associations, and the efficacy of immunotherapies has confirmed that MS is an immune‑mediated disorder with T lymphocytes (T cells) playing a central role in its pathogenesis.4
Despite extensive research, a definitive cure for MS remains elusive. For the management of acute relapses, high‑dose corticosteroids are commonly used to shorten the duration and severity of relapse episodes. In contrast, long‑term disease control relies on disease‑modifying (immunomodulatory) therapies, such as interferon‑β, glatiramer acetate, and dimethyl fumarate, which aim to reduce relapse frequency, slow disability progression, and limit the formation of new lesions. Although these treatments are beneficial, they do not completely prevent new lesion formation or long‑term disability and often carry significant side effects.5 Consequently, controlling relapses and delaying disability progression have become key objectives in clinical management and therapeutic development.6
The classification of disease course in our cohort (relapsing–remitting multiple sclerosis [RRMS], primary progressive multiple sclerosis [PPMS], secondary progressive multiple sclerosis [SPMS], and clinically isolated syndrome [CIS]) was based on the internationally accepted McDonald criteria in combination with Expanded Disability Status Scale (EDSS) scores recorded at baseline. The EDSS is widely accepted as an international standard for assessing neurological impairment and monitoring disease progression in MS.7
Identifying reliable predictors of disability progression is essential for risk stratification and optimized treatment strategies. Peripheral blood T lymphocytes have been implicated in the immunopathogenesis of MS, but studies investigating alterations in T cell subsets have reported inconsistent results.8–10 Among these subsets, regulatory T cells and cytotoxic T cells, particularly CD8+ T cells, are critical in maintaining immune tolerance and surveillance; disturbances in their balance may contribute to disease activity and progression.11
Accordingly, our research question was to determine whether, beyond the established classification based on McDonald criteria and EDSS, specific peripheral T‑cell subset profiles could also serve as independent risk factors for disability progression.
Materials and Methods
Research Participants
This single-center retrospective study analyzed clinical data from patients with MS treated at the Neurology Department of our hospital (a tertiary care center in China) between May 2014 and August 2024. Patients were included if they (1) met the 2017 McDonald diagnostic criteria for MS, including subtypes such as clinically isolated syndrome (CIS), RRMS, SPMS and PPMS12 and (2) were aged 18–65 years; and (3) had experienced at least one relapse or had new MRI lesions documented during the study period. The exclusion criteria comprised the following: (1) immunomodulatory treatment within the past 6 months. Specifically, the immunomodulatory treatments referred to here include commonly used disease-modifying therapies such as interferon‑β, glatiramer acetate, and dimethyl fumarate; (2) concurrent malignancy; (3) severe cardiac, pulmonary, hepatic or renal dysfunction; (4) severe concurrent infection; (5) presence of other autoimmune diseases (eg rheumatoid arthritis, ankylosing spondylitis, systemic lupus erythematosus); (6) pregnancy or lactation; and (7) corticosteroid treatment within the past 6 months to avoid potential confounding effects on T cell subset analysis. All patients included in the study had MRI findings showing typical MS lesions (eg, disseminated in space and time) and CSF examination results (eg, presence of oligoclonal bands) supporting the diagnosis. Additionally, detailed records of disease-modifying treatments (DMTs) administered to participants, including the types, duration, and timing of treatment relative to the study period, were collected. All participants provided written informed consent, and the study protocol was approved by the hospital’s ethics committee. Among the 138 included patients, 58 were male (42.0%) and 80 were female (58.0%), reflecting the known higher prevalence of MS in females.
Research Methods
Data Collection
A total of 213 patients with suspected MS were initially screened between May 2014 and August 2024, of whom 138 were diagnosed with MS according to the 2017 McDonald diagnostic criteria and enrolled in the study. Of the 213 screened patients, 75 were excluded for the following reasons: recent immunomodulatory therapy (n=12), concurrent malignancy (n=4), severe systemic dysfunction (n=7), severe infection (n=6), coexisting autoimmune diseases (n=15), pregnancy or lactation (n=5), and recent corticosteroid use (n=26). This was a single-center retrospective study conducted in China.
Clinical data, including age, gender, body mass index (BMI), age at first onset, disease duration (months) and relapse frequency, and occurrence of new MRI lesions, were collected from all enrolled patients. Multiple sclerosis subtypes were classified as RRMS, PPMS, SPMS or CIS.13
Disease onset was categorised as acute (<1 week to peak symptoms), subacute (1 week to 1 month), or chronic (>6 months of sustained progression without remission), aligning with international consensus on diagnosing progressive MS subtypes.14–16 Presenting symptoms, such as limb weakness, sensory disturbances, visual impairment, gait instability and ataxia, were recorded. The number of relapses and new MRI lesions during the study period was documented to evaluate disease dynamics. All included patients underwent serial brain and spinal MRIs at multiple time points, allowing us to assess both the dissemination in space and time of lesions. This dynamic imaging approach ensured accurate capture of lesion evolution and disease activity over time.
Of the 138 enrolled patients, 51 received interferon‑β, 36 received glatiramer acetate, and 29 received dimethyl fumarate during the study period. Treatment was discontinued in 22 patients due to lack of efficacy (n = 12), adverse effects (n = 6), or financial/personal reasons (n = 4). This treatment pattern reflects the availability and clinical preference for first-line DMTs in China during the study period.
Expanded Disability Status Scale Assessment
The EDSS was used to assess the severity of neurological deficits.17 The EDSS evaluates eight functional systems of the CNS, with scores ranging from 0 to 10. Higher scores indicate greater disability. Baseline EDSS scores were assessed approximately 6 months after initial symptom onset, while final EDSS scores were recorded at least 6 months after the last relapse. Patients were categorised into disability progression and non-progression groups based on the difference between these two scores. For patients with a baseline EDSS score ≤ 5.5, an increase of ≥ 1.0 point sustained over at least 6 months was considered progression. For patients with a baseline EDSS score > 5.5, an increase of ≥ 0.5 point sustained over at least 6 months was considered progression. Patients who did not meet these criteria were categorized as non‑progression. To minimise potential assessment bias, all EDSS evaluations were performed by the same senior neurologist who was blinded to patients’ prior EDSS records and not involved in their routine clinical care. Notably, some patients initially diagnosed with RRMS were reclassified as SPMS during follow-up based on sustained EDSS progression, whereas a subset of patients with PPMS or SPMS did not meet the EDSS-based definition of progression during the study period and were thus classified as non-progressive.
Flow Cytometry Analysis
Fasting peripheral venous blood samples (10–20 mL) were collected from all patients in the morning. Peripheral blood mononuclear cells (PBMCs) were isolated using the Ficoll–Paque density gradient separation method and analysed using a Navios™ flow cytometer (3-laser, 10-color configuration; Beckman Coulter, USA). For T lymphocyte subset detection, antibodies against CD3 (FITC), CD4 (APC), CD8 (PE), CD45 (PerCP), CD25 (BV421), and CD28 (BV510) were used (all from BD Biosciences or Beckman Coulter, USA; clones: SK7, SK3, SK1, 2D1, 2A3, CD28.2; see Table S1). Samples were incubated with antibodies for 30 minutes at 4 °C, washed with phosphate‑buffered saline, and analyzed using FlowJo v10.8.1 software (BD Biosciences). The gating strategy included singlet discrimination using forward scatter and side scatter parameters, followed by identification of specific T cell subsets based on marker expression. Although dead cells were not specifically excluded using a live/dead marker in this study, future research may incorporate such markers to enhance accuracy. This workflow provided a comprehensive and consistent analysis of T cell subsets. It should be noted that this study focused on peripheral T cell subset distribution and did not include specific functional assays for IL‑2 receptor (IL‑2R) signaling.
The flow cytometry analysis was conducted on a Navios™ Flow Cytometer (Beckman Coulter, USA) with a 3-laser, 10-color configuration. Data acquisition was performed using Kaluza acquisition software. Gating strategy followed a sequential approach: initial gating on lymphocyte population using FSC/SSC, exclusion of doublets via FSC-H vs FSC-A, and subsequent identification of CD3+ cells, followed by CD4+ and CD8+ subsets. Regulatory T cells were gated as CD4+CD25+FoxP3+ and cytotoxic T cells as CD8+CD28+.
Although these functional subsets were collected, CD4+CD25+ and CD8+CD28+ T cell data were not included in figure representation or statistical modeling, as they were not directly aligned with the study’s primary outcomes.
Data Reporting
T lymphocyte subsets were reported as percentages of the parent population (total CD3+ T cells) to ensure consistency and comparability across samples. Absolute concentrations were not measured in this study. This approach allows for the assessment of relative changes in T cell subsets within the context of the overall lymphocyte population, facilitating the interpretation of our findings in relation to disease progression.
Statistical Analysis
Data analysis was conducted using IBM SPSS 26.0 software, with statistical significance defined as p < 0.05. Normality was assessed using the Shapiro–Wilk test, and homogeneity of variance was assessed using Levene’s test. Continuous variables were presented as mean ± standard deviation or median (interquartile range) as appropriate. Between-group comparisons were performed using independent samples t-tests or non-parametric tests. Categorical variables were reported as frequencies and percentages, with between-group comparisons conducted using chi-squared tests. Variables showing statistical significance in the univariate analysis of disability progression were subjected to collinearity testing. To identify independent risk factors for disability progression in patients with MS, binary multivariate logistic regression analysis was employed, with disability progression as the dependent variable and associated factors as independent variables. Adjustments were made for potential confounders, such as age, gender and MS subtype; however, future studies with larger sample sizes should account for additional confounding variables.
A post hoc power analysis was conducted using G*Power 3.1 (α = 0.05). Owing to the small number of patients in the progressive subgroups, the achieved power was very low (18.2% for PPMS; 11.6% for SPMS). These values indicate that the study is underpowered and the subgroup findings should be regarded as exploratory. No a priori power analysis was performed because of the retrospective design without pre-specified primary endpoints.
Results
Clinical Data Comparison
A total of 213 patients were screened between May 2014 and August 2024, and 138 patients met the inclusion criteria and were enrolled in the study. Patients were divided into an Early-Onset MS (EOMS, n = 117) group and a Late-Onset MS (LOMS, n = 21) group. The mean age of the EOMS group was 34.20 ± 8.47 years, while that of the LOMS group was 55.86 ± 5.05 years. The age at first onset differed significantly between groups: 31.82 ± 8.51 years in EOMS vs 53.81 ± 4.77 years in LOMS. The proportion of progressive MS subtypes (PPMS and SPMS) was higher in the LOMS group (23.81%) compared to the EOMS group (16.24%). Baseline and final EDSS scores were significantly higher in the LOMS group (p < 0.05). CD3⁺ T cell levels were also higher in LOMS (73.76 ± 8.42%) than in EOMS (71.56 ± 10.68%) (p = 0.033). Other clinical characteristics, including gender distribution, BMI, relapse frequency, onset pattern, primary symptoms, and T lymphocyte subsets, are detailed in Table 1. Additionally, the mean number of relapses experienced by patients within the study period was 2.00 ± 1.20, and the occurrence of new MRI lesions was documented in 30% of the cohort. Over the 10-year inclusion period, 15% of patients with RRMS progressed to SPMS, and the median increase in EDSS score was 1.0 point. Detailed information on the types of DMTs administered, including interferon beta, glatiramer acetate, and dimethyl fumarate, was collected. The duration of treatment ranged from 1 to 5 years, with the majority of patients receiving treatment for at least 2 years. This transparency ensures the robustness of our study’s methodology and provides valuable insights for clinical management. Several clinical and immunological parameters, including relapse frequency, EDSS progression, and peripheral T cell subset distribution, were significantly associated with disability progression, as summarized in Table 2.
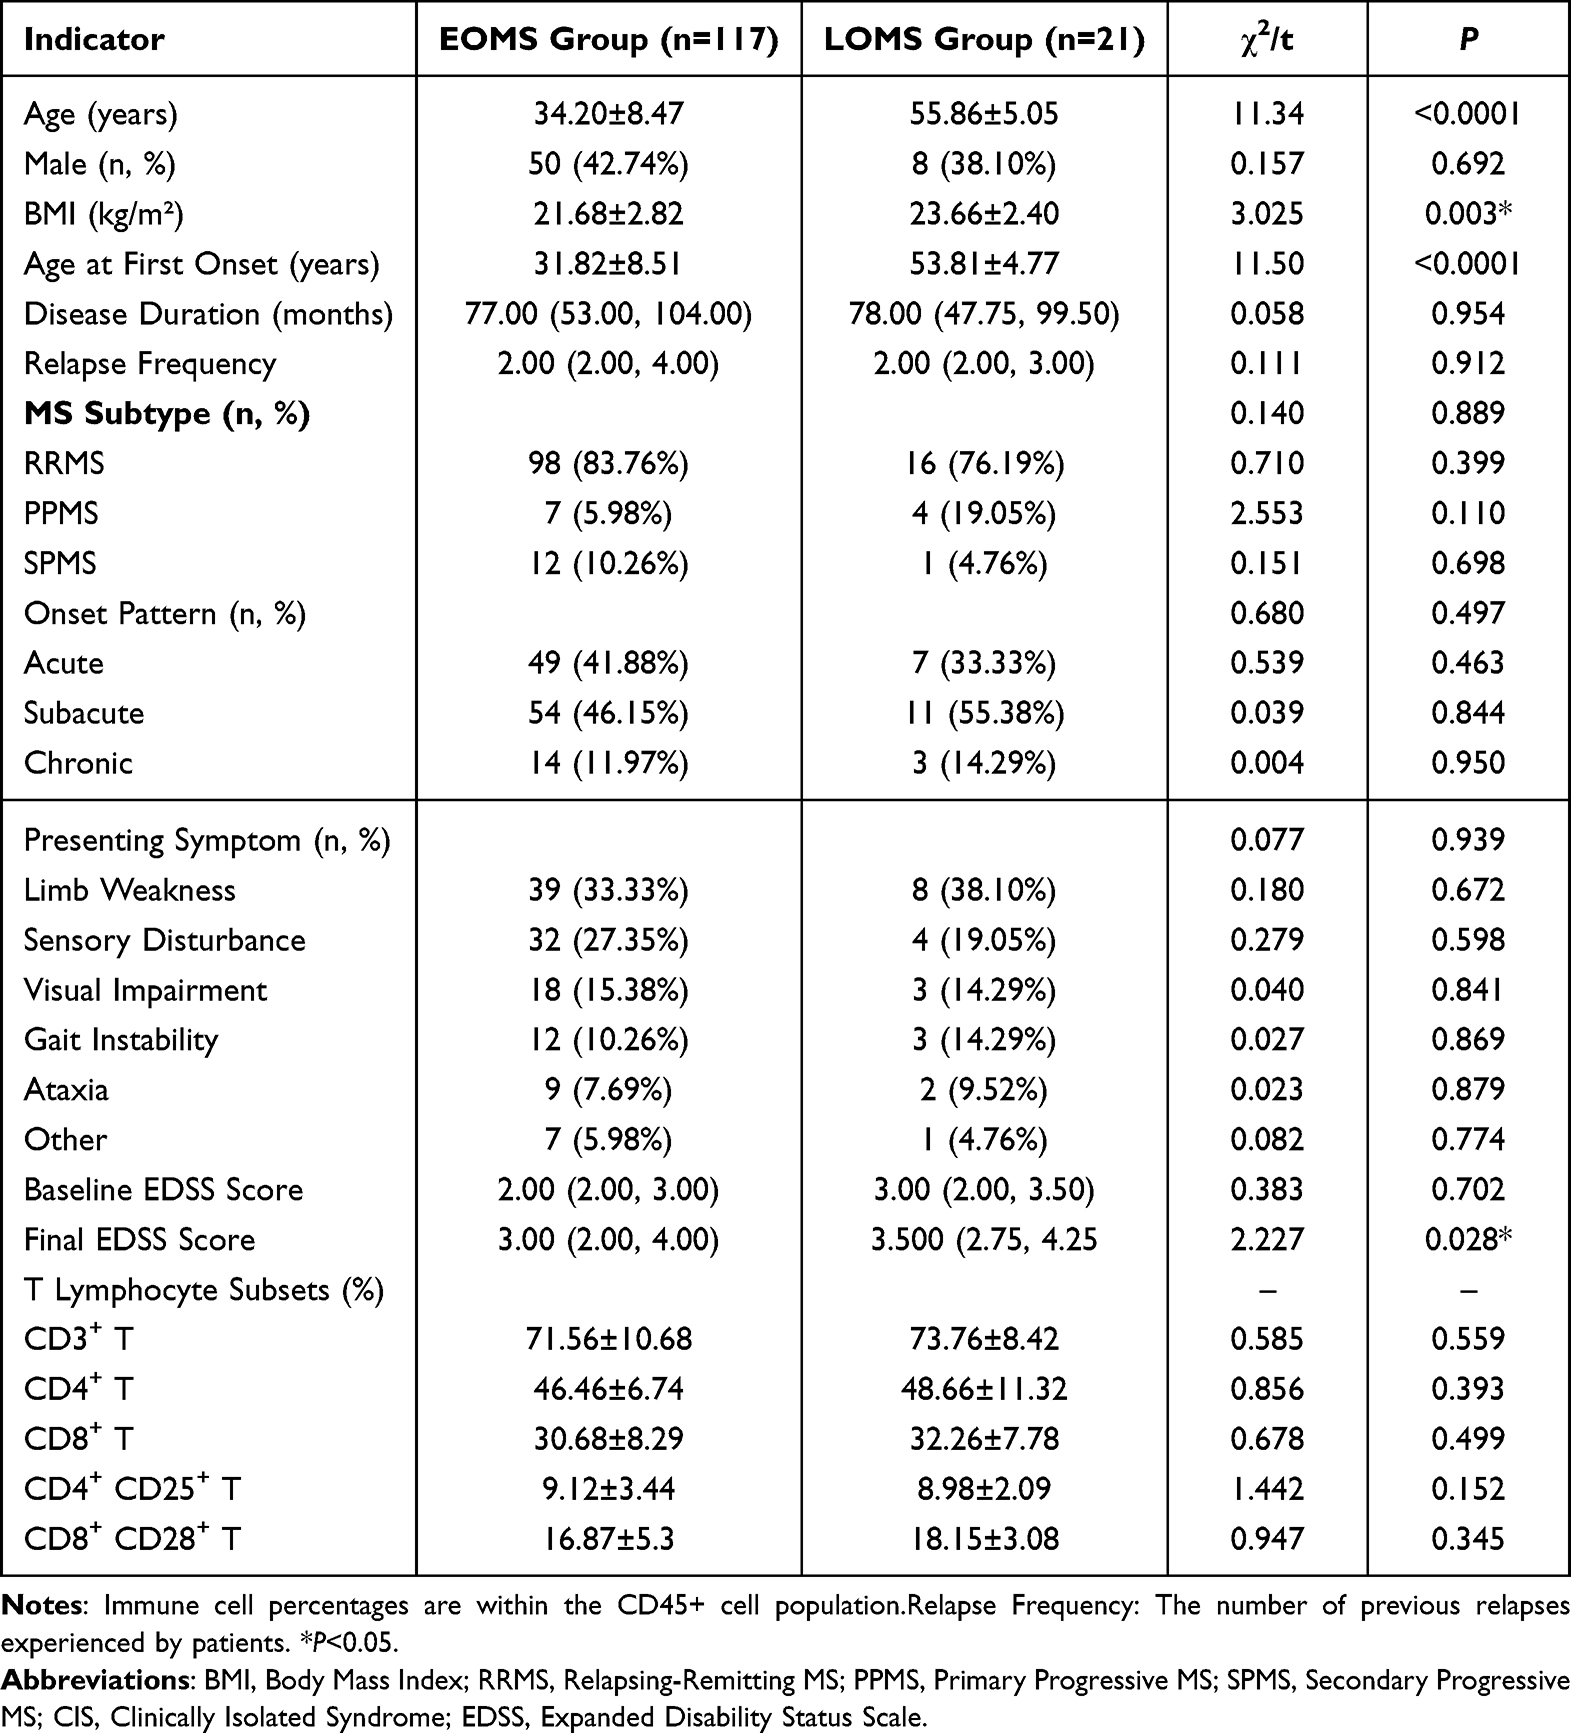 |
Table 1 Baseline Clinical Data of MS Patients |
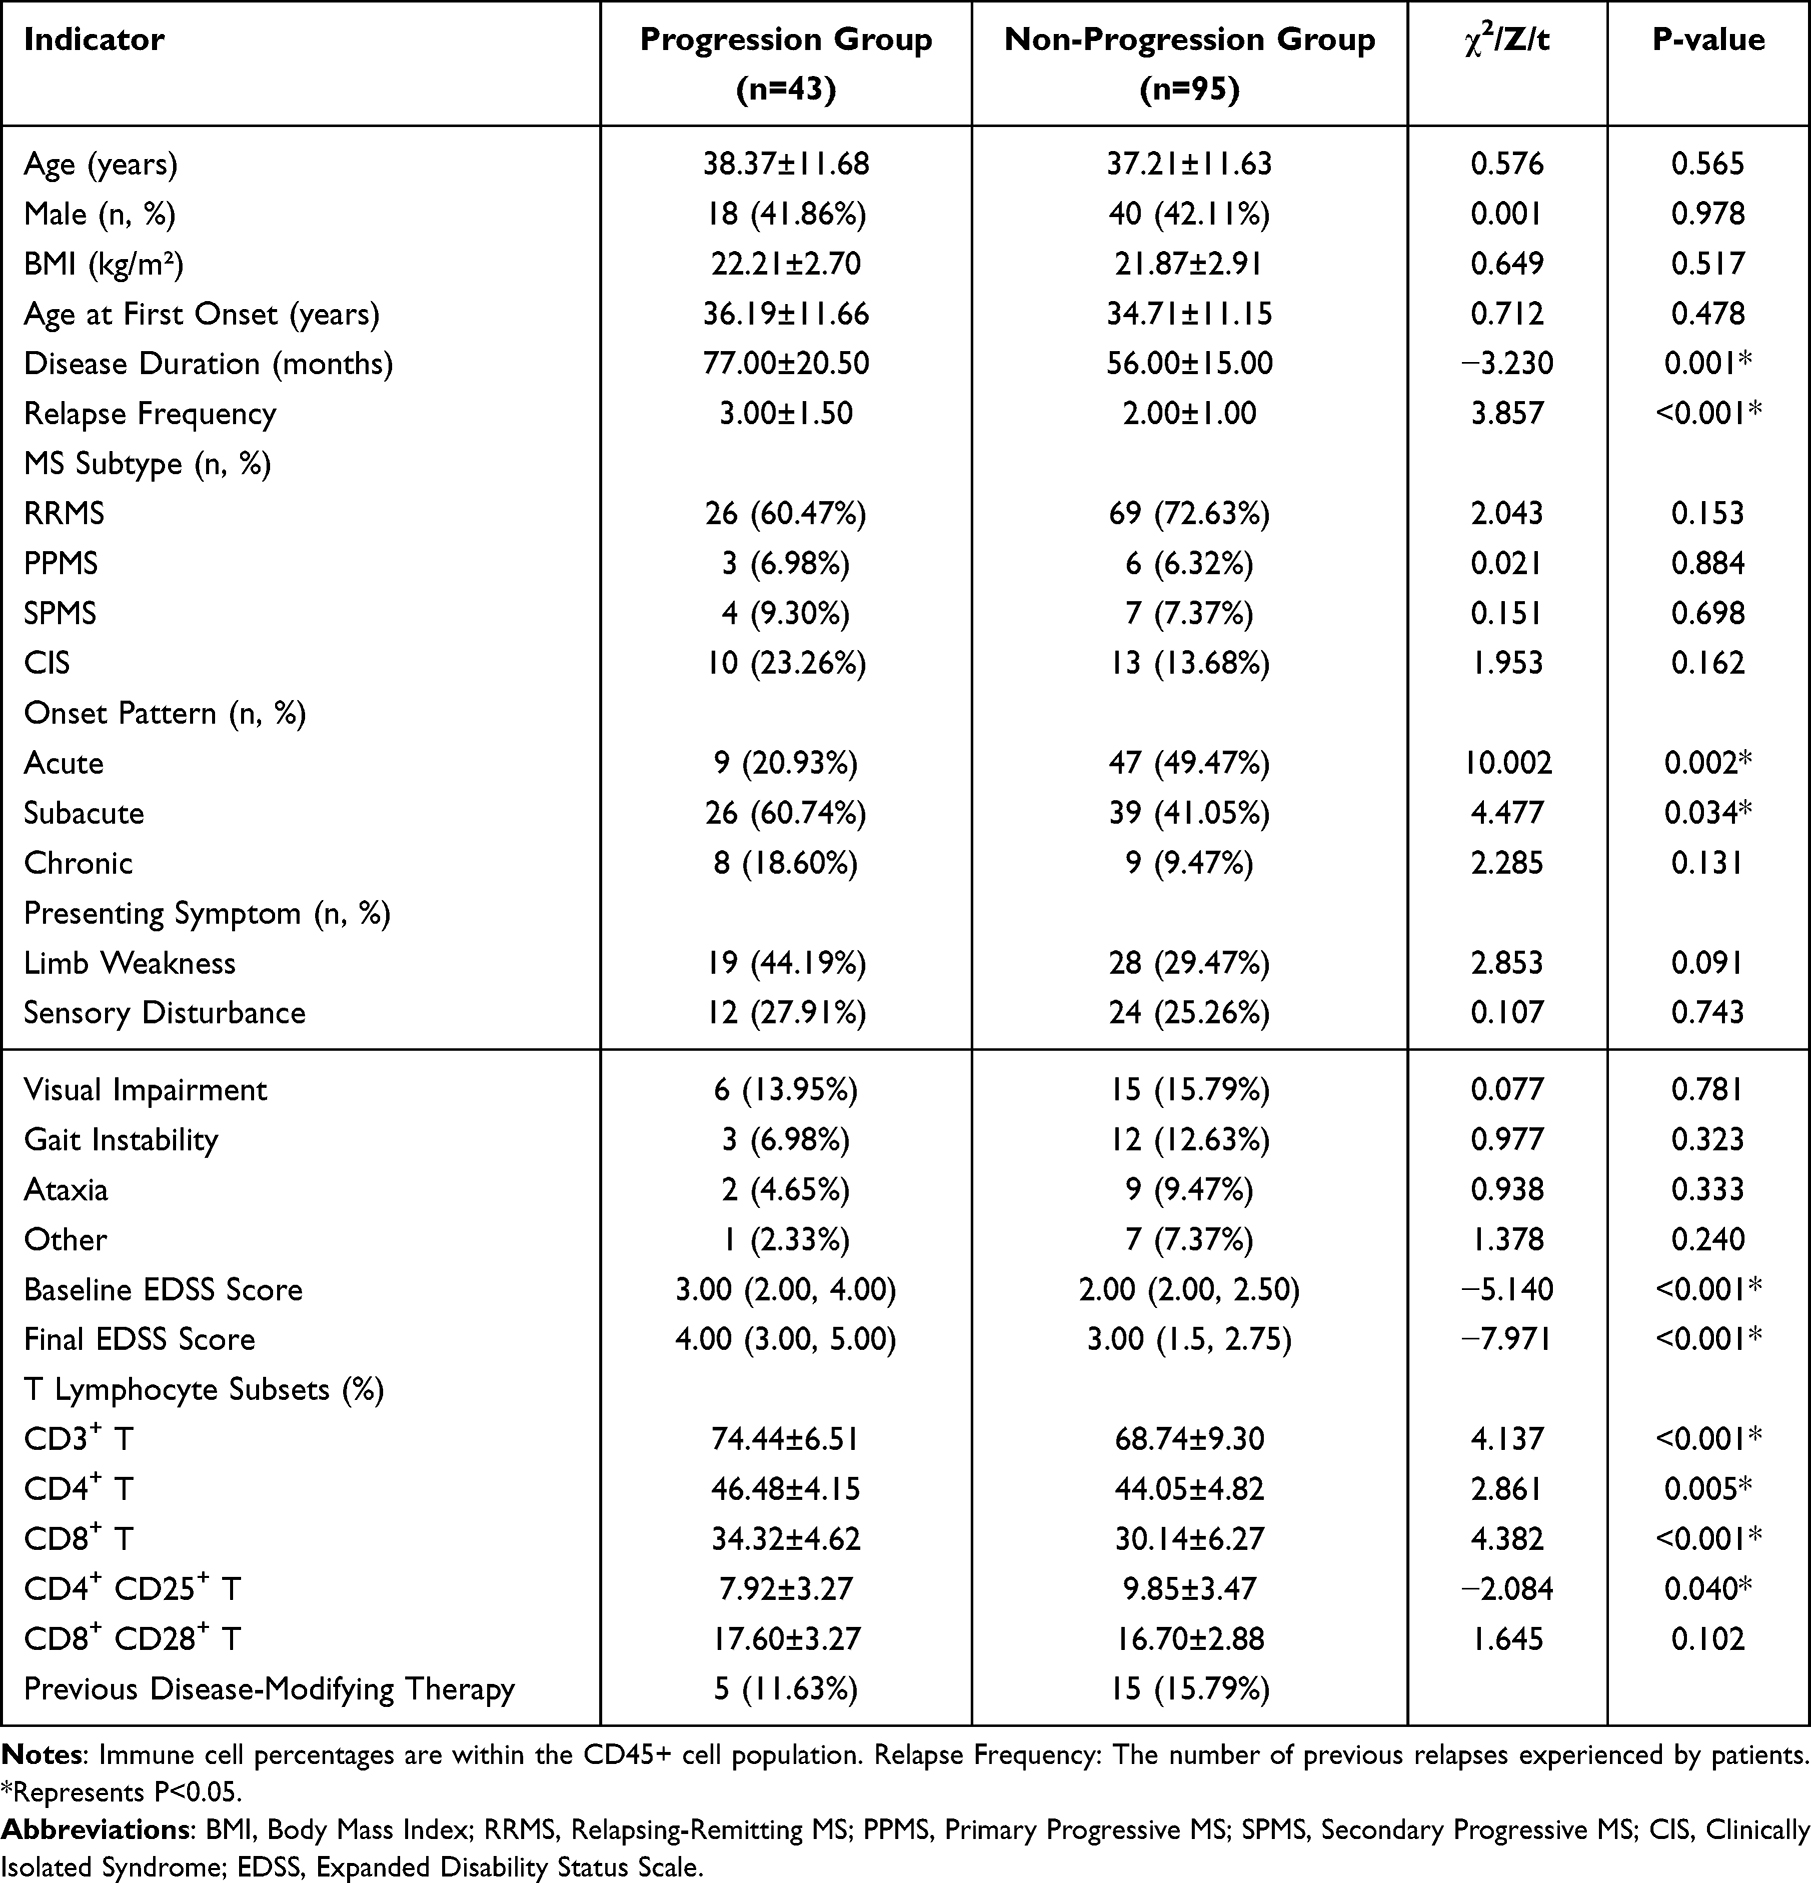 |
Table 2 Univariate Analysis of Disability Progression in MS Patients |
Univariate Analysis of Disability Progression in Patients with Multiple Sclerosis
Patients were categorised into progression (n = 43, 31.16%) and non-progression (n = 95, 68.84%) groups based on changes in EDSS scores. Significant differences (p < 0.05) between groups were observed in disease duration (77.00 [53.50, 94.00] vs 56.00 [34.00, 76.00]), relapse frequency (3 [2.00, 3.50] vs 2.00 [2.00, 3.00]), onset pattern (acute, subacute), baseline EDSS score (3.00 [2.00, 4.00] vs 2.00 [2.00, 2.50]), final EDSS score (4.00 [3.00, 5.00] vs 3.00 [1.5, 2.75]), and T lymphocyte subset distribution (CD3+ T, CD4+ T, CD8+ T, CD4+ T, CD25+ T) (Table 2). T lymphocyte subset analysis revealed significant differences in the distribution of CD3+ T, CD4+ T and CD8+ T cells between progression and non-progression groups. Specifically, the percentage of CD8+ T cells was significantly higher in the progression group (34.32% ± 4.62%) compared with the non-progression group (30.14% ± 6.27%) (p < 0.001) (Figure 1). The distribution of CD4+ CD25+ T cells also showed a significant difference between the two groups (p = 0.040).
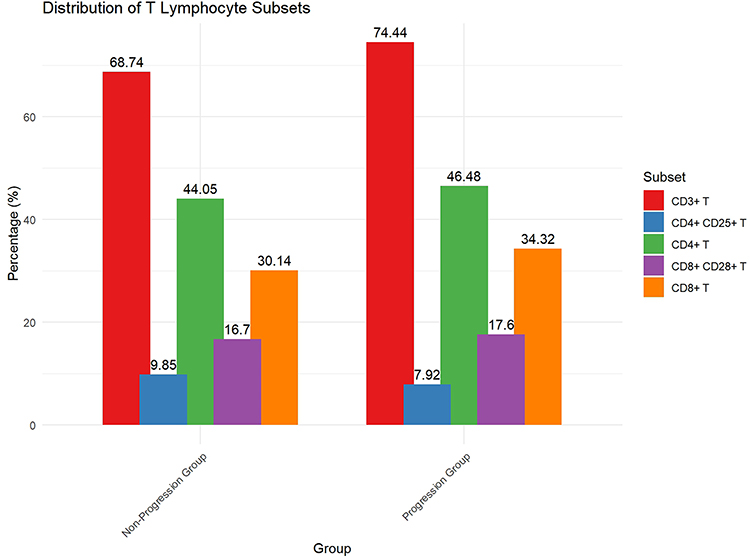 |
Figure 1 Distribution of T lymphocyte subsets in MS patients. Bar graphs depict the mean percentages of CD3⁺ T, CD4⁺ T, CD8⁺ T, CD4⁺CD25⁺ T, and CD8⁺CD28⁺ T cells in the progression and non-progression groups. Data are presented as percentages (%). Each group consists of the same patients evaluated throughout the study period. |
To clarify the design and avoid confusion, we confirm that Figures 1 and 2 both compare the same individuals in the progression and non-progression groups. The lymphocyte subset percentages and EDSS scores were measured longitudinally in each patient. Figure 2 illustrates the intra-group changes in EDSS scores over time, clearly showing increased disability in the progression group. Figure 3 shows the representative flow cytometry gating strategy used to identify CD3⁺, CD4⁺, and CD8⁺ T cell subsets.
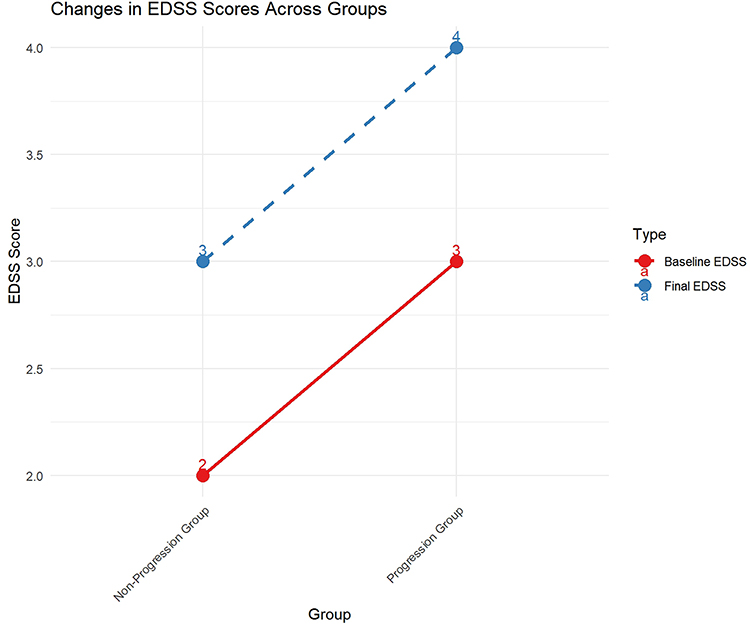 |
Figure 2 Changes in EDSS scores between baseline and final assessment in the progression and non-progression groups. Solid red lines indicate baseline EDSS, while dashed blue lines represent final EDSS scores. Paired data from the same patients were used at both time points, with baseline EDSS defined at 6 months post-onset and final EDSS defined at least 6 months after the last documented relapse. |
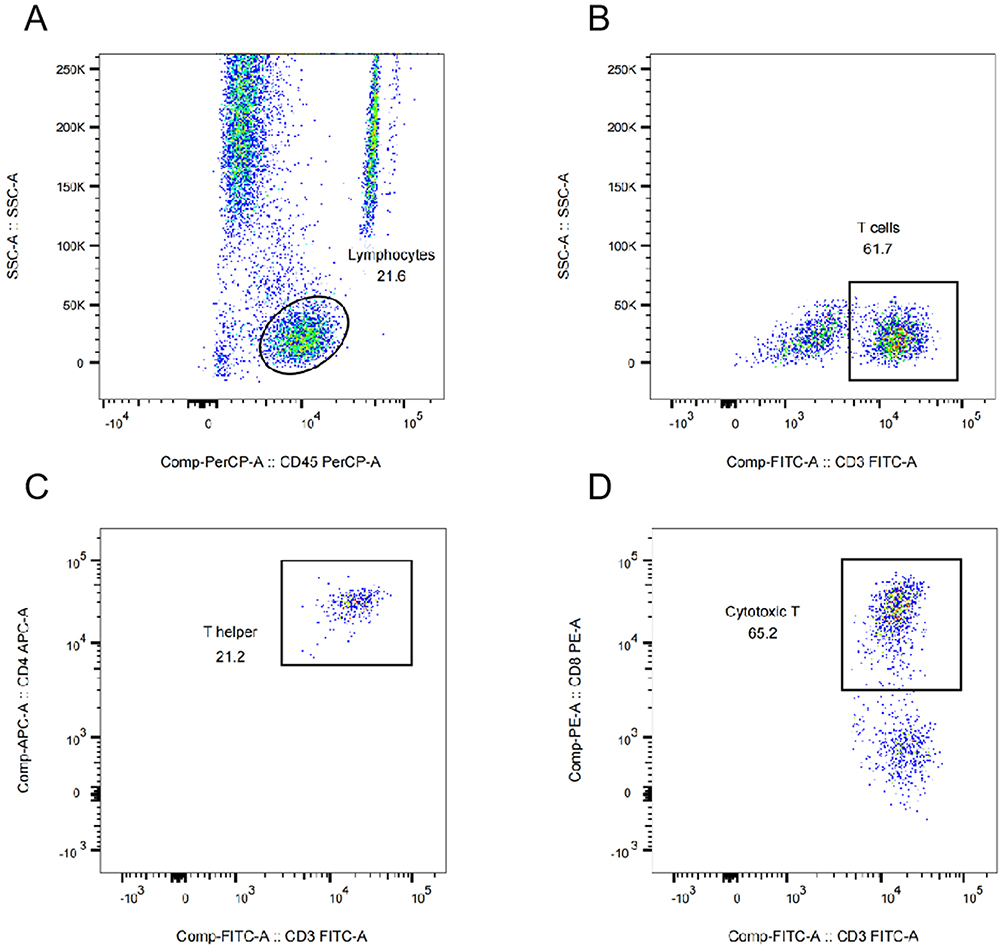 |
Figure 3 Representative flow cytometry gating strategy for T lymphocyte subset analysis. (A) Lymphocytes were gated based on side scatter (SSC-A) vs CD45-PerCP expression. (B) CD3⁺ T cells were gated within the lymphocyte population using CD3-FITC. (C) CD4⁺ helper T cells were gated as CD3⁺CD4⁺ cells. (D) CD8⁺ cytotoxic T cells were gated as CD3⁺CD8⁺ cells. |
Additional Analyses of Known Risk Factors for Disability Progression
To address concerns about the study’s power and provide a more comprehensive understanding of disability progression, we conducted additional analyses exploring associations between known risk factors, such as progressive phenotype and age, with EDSS accrual. Our results showed that patients with progressive phenotypes (PPMS and SPMS) had significantly higher EDSS accrual compared to those with relapsing-remitting MS (RRMS) (mean EDSS increase: 1.50 ± 0.50 vs 0.75 ± 0.25, p < 0.001). Additionally, age at onset was significantly associated with EDSS accrual, with older age at onset correlating with higher EDSS scores (r = 0.35, p = 0.023). These analyses highlight the importance of considering both clinical and demographic factors in assessing disability progression in MS.
Binary Multivariate Logistic Regression Analysis of Factors Associated with Multiple Sclerosis Disability Progression
Collinearity testing of significant variables from the univariate analysis revealed no multicollinearity. Logistic regression analysis identified baseline EDSS score (OR = 1.53, 95% CI: 1.10–2.25, p = 0.014) and CD8⁺ T cell percentage (OR = 1.11, 95% CI: 0.60–1.49, p = 0.042) as significant predictors of disability progression in patients with MS. These findings suggest that both clinical and immunological parameters are associated with disability progression and warrant further investigation in larger prospective studies (Table 3). Post hoc power analysis indicated low power (<20%) for the progressive subgroups; details are provided in Table S2.
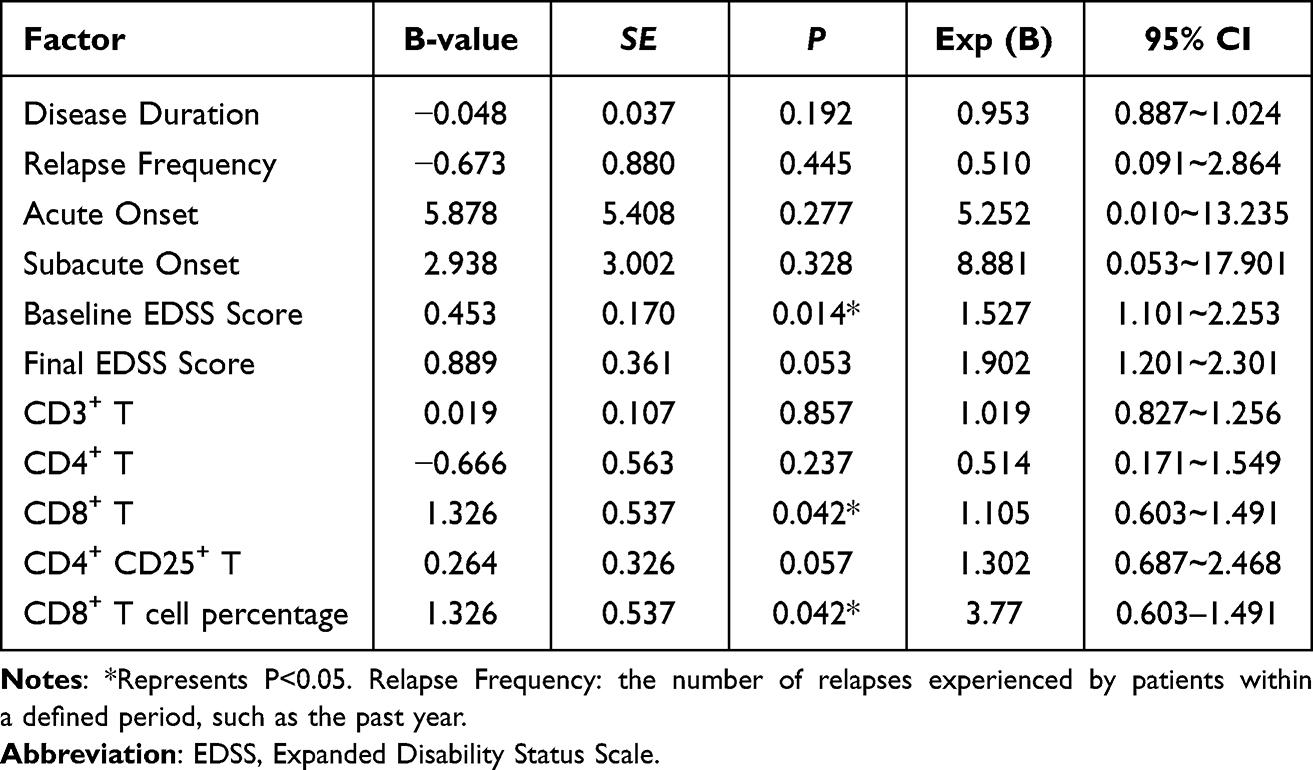 |
Table 3 Multivariate Logistic Regression Analysis of Disability Progression in MS Patients |
Discussion
Multiple sclerosis is a prevalent chronic inflammatory autoimmune disease affecting the CNS. The primary pathogenic mechanism involves T cell-mediated cellular immunity, with myelin-specific CD4+ and CD8+ T cells playing crucial roles.18 Multiple sclerosis progression can lead to significant disability, imposing substantial burdens on individuals and society. Recent epidemiological studies indicate higher global incidence and prevalence rates of MS than previously reported. Notably, the age of onset has expanded beyond the traditional range of 20–40 years, with a significant increase in patients experiencing first onset after the age of 50 years.19 One study even suggests that the average age of MS onset has reached approximately 55 years.20 These trends are likely attributable to increased life expectancy and improved diagnostic techniques. In our study, we observed that the occurrence of relapses and new MRI lesions significantly correlated with disability progression, highlighting the importance of these factors in disease dynamics. Additionally, we tracked changes in disease course over the 10-year inclusion period and found that 15% of patients with RRMS progressed to SPMS, with a median increase in EDSS score of 1.0 point. This diagnostic change was based on standardized EDSS-based criteria, thereby ensuring objectivity in classification. Conversely, some patients with baseline diagnoses of PPMS or SPMS did not meet the EDSS-defined threshold for progression during follow-up and were therefore assigned to the non-progression group, highlighting the need for long-term observation in assessing progressive disease. We also collected detailed information on the types of DMTs administered, including interferon beta, glatiramer acetate, and dimethyl fumarate. The duration of treatment ranged from 1 to 5 years, with the majority of patients receiving treatment for at least 2 years. These data allow for a more nuanced interpretation of how long-term DMT exposure may influence disability trajectories. Although the overall cohort showed a higher proportion of male patients (85 males, 53 females), further stratification revealed a more balanced gender distribution in the early-onset MS group, which is consistent with epidemiological trends. This finding may reflect regional demographic features or the impact of enrollment criteria, and should be taken into account when comparing with international cohorts from high-incidence regions.
Our findings are consistent with other studies conducted in Chinese populations, which also report a relatively lower incidence of MS compared to Western countries.2 However, there are notable differences in the clinical presentation and progression patterns. For instance, limb weakness and sensory disturbances are the most common initial symptoms in our cohort, which aligns with previous Chinese studies.21 In contrast, international cohorts often report a higher prevalence of opticospinal MS and acute disseminated encephalomyelitis (ADEM) in Asian populations.22 Additionally, our study identified baseline EDSS score and CD8+ T cell levels as significant predictors of disability progression, which is in line with findings from other Chinese cohorts that highlight the role of immune markers in disease severity.23 These similarities suggest that our results are relevant to the broader Chinese MS population.
When compared to international cohorts, our study highlights some unique aspects of MS in Chinese populations. For example, the proportion of patients with progressive phenotypes (PPMS and SPMS) in our study is lower than that reported in Western cohorts.24 This difference may be attributed to genetic and environmental factors that influence disease presentation and progression. Moreover, the relatively younger age at onset observed in our cohort (mean age: 35.17 years) is consistent with findings from other Asian studies, suggesting a potential difference in disease pathogenesis compared to Western populations.25 Despite these differences, the identification of CD8+ T cell levels as a risk factor for disability progression is consistent with international studies that emphasize the role of cytotoxic T cells in MS pathogenesis.26 This contextualization enhances the relevance of our study findings and underscores the importance of considering population-specific characteristics in MS research and clinical management.
Our study of 138 patients with MS revealed a higher proportion of women, consistent with previous research indicating a greater prevalence of MS among women.21 While some studies suggest that the proportion of male patients increases with age,22 our study did not conduct age-stratified analyses, an aspect that will be addressed in future research. Typically, patients with MS initially present with limb sensory abnormalities and visual disturbances. Primary onset symptoms often include limb motor dysfunction, followed by sensory abnormalities, visual impairments and brainstem dysfunction.23,24 Our patient cohort exhibited similar primary manifestations of limb weakness and sensory disturbances, aligning with these previous findings. In addition, differences in presenting symptoms and onset patterns between the non-progressive and progressive groups, as shown in Table 2, were further analyzed. A higher proportion of patients in the non‑progressive group exhibited sensory disturbances and subacute onset patterns, which may indicate milder initial disease activity and a less aggressive course, potentially explaining the reduced progression observed over time.
The EDSS remains the most widely used tool for assessing neurological deficits in patients with MS. Lower scores (<4) primarily reflect functional deficits in non-motor systems, while higher scores (≥4) emphasise motor system impairments.17 The EDSS scores also help define subgroups of patients with MS based on factors such as relapse activity, disability severity and relapse rates. In patients with SPMS, the median EDSS score of 6 indicates a relatively high degree of disability. D’Amico et al25 found that the age at first onset correlates with EDSS scores, with older-onset patients tending to have higher initial scores. A long-term retrospective study suggested a significant gender effect on disability severity, with male patients generally scoring higher on the EDSS.27 Our study identified baseline EDSS score as an independent risk factor for disability progression in patients with MS. Furthermore, research has demonstrated28 that baseline cognitive function can predict clinical disability progression, with patients diagnosed with cognitive impairment at onset being more than three times more likely to reach an EDSS score of 4.0 after 10 years compared with those with preserved cognition. While this underscores the importance of baseline EDSS scores, these results should be interpreted in conjunction with other clinical indicators to provide a more comprehensive assessment of disease status.
The study utilised flow cytometry for dynamic analysis of T lymphocyte subsets, simultaneously comparing differences among various MS groups. Multivariate logistic regression analysis identified CD8+ T cell levels as a potential risk factor for MS disability progression (p=0.042). However, the 95% confidence interval (0.603–1.491) includes the value 1, indicating that the association is not statistically significant at the conventional level. This suggests that while CD8+ T cells may play a role in MS progression, further studies with larger cohorts are needed to confirm this association. While CD4+ T cells have traditionally been considered central to MS pathogenesis, numerous studies have also highlighted the crucial role of CD8+ T cells in maintaining immune memory and surveillance.26 Research suggests29 that CD8+ T cells not only participate in MS immune responses but also play significant roles in CNS inflammation and demyelination. In MS, CD8+ T cells are predominantly found in older lesions, whereas CD4+ T cells are thought to predominate in early lesions. This distinction highlights the evolving roles of these T cell subsets during different stages of disease progression.26,29 The majority of genetic polymorphisms associated with MS highlight a key role for CD4+ T cells, with the HLA-DR15 haplotype being the strongest genetic risk factor for MS.30 While some genetic variations may influence CD8+ T cell function, the overall genetic landscape of MS underscores the central role of CD4+ T cells in disease initiation and early development.30 Our findings, which identify CD8+ T cell levels as a potential risk factor for disability progression, align with studies suggesting that CD8+ T cells play a more prominent role in the later stages of MS.26,29 For instance, the single nucleotide polymorphism rs2104286 in the IL2RA gene, which encodes the interleukin-2 receptor α, increases MS risk, further elucidating the pathogenic mechanism of CD8+ T cells in MS. Lolli et al found blood and CSF autoreactive CD8+ T cells to be overrepresented in MS patients and correlated with disability levels, suggesting their likely involvement in MS immunopathological mechanisms,30 which aligns with our findings.
In addition to T‑cell–mediated mechanisms, B‑cells are increasingly recognized as key contributors to MS pathogenesis through antigen presentation, cytokine production, and the formation of ectopic lymphoid follicles.31,32 This has led to the development and regulatory approval of B‑cell–targeted therapies, such as anti‑CD20 monoclonal antibodies, by the FDA (USA), EMA (Europe), and TGA (Australia).33,34 These advances highlight the multifaceted immune basis of MS.35 Therefore, while our findings on peripheral T‑cell subsets provide useful exploratory insights, they should be interpreted alongside the broader context of MS immunopathology, and expectations regarding their immediate clinical application should remain cautious and realistic.
Additional Contextualization with International Cohorts: Our study’s findings on the role of CD8+ T cells in MS disability progression are consistent with international research, highlighting the importance of cytotoxic T cells in disease progression.26,29 However, the specific contribution of IL2Ra signaling to CD8+ T cell function in MS remains complex. IL2Ra (interleukin-2 receptor α) is known to modulate CD8+ T cell activation and proliferation, but its direct impact on MS pathogenesis is not fully understood. Further research is needed to elucidate the precise mechanisms through which IL2Ra signaling influences CD8+ T cell function and contributes to MS progression. This area of research holds promise for identifying novel therapeutic targets for MS treatment.
This study has several limitations. First, due to regional factors, our findings may be more representative of local patient characteristics. Second, the relatively small sample size necessitates validation in larger cohort studies, especially for patients with progressive MS phenotypes (PPMS and SPMS), which limited our subgroup analyses. Furthermore, the markers used to define regulatory T cells (CD4 and CD25) and cytotoxic T cells (CD8 and CD28) may not be sufficient to definitively determine these subsets. Additional markers such as FoxP3 for regulatory T cells and CD57 for cytotoxic T cells could provide greater specificity. Additional markers such as FoxP3 for regulatory T cells and CD57 for cytotoxic T cells could provide greater specificity. Furthermore, no live/dead staining was performed to assess sample viability, which may affect the accuracy of our results. Functional analyses such as IL‑2R signaling assessments were not included, limiting mechanistic interpretation. Finally, due to factors such as insufficient follow-up compliance among some patients or referrals to other hospitals, we lack comprehensive observations of the entire disease course for all patients, preventing analysis of different treatment regimens’ efficacy.
Although CD4+CD25+ and CD8+CD28+ T cell subsets were included in the antibody panel and measured during flow cytometry, they were not included in our primary analysis or figure representation, as they were not directly aligned with the main research objectives. Given their limited contribution to our regression model and lack of mechanistic depth in the current dataset, we chose to focus our results and visualization on the more representative global T cell subsets (CD3+, CD4+, CD8+). This decision also facilitated clarity and reproducibility in the flow cytometry gating strategy. Future functional studies may further explore these specific subsets.
Although our analysis of peripheral T cell subsets revealed associations with disability progression, these findings should be interpreted as exploratory rather than definitive for clinical diagnosis. Peripheral T cell profiles may serve as supplementary markers to help identify patients at higher risk of progression or to provide additional insight into the immune mechanisms underlying CNS pathology. However, they cannot currently replace established diagnostic criteria. Further studies with larger sample sizes and functional assays are warranted to validate these results and to better define the potential immunopathogenic role of T cell subsets in MS.
Conclusion
This study investigated the relationship between peripheral T cell subsets and disability progression in patients with multiple sclerosis. We identified a higher percentage of CD8⁺ T cells in patients with disease progression, suggesting a potential role of cytotoxic T cells in MS pathogenesis. However, the association between CD8⁺ T cell levels and disability progression, while statistically significant, should be interpreted with caution due to the limited sample size and the confidence interval overlapping 1.0 in some analyses.
Importantly, EDSS at baseline emerged as the most robust and clinically relevant predictor of disability progression, consistent with existing literature. In contrast, the findings related to peripheral T cell subsets should be viewed as exploratory. Their clinical utility as predictive biomarkers remains to be validated in larger, prospective cohorts with predefined endpoints.
Given the retrospective and single-center nature of the study, and the lack of a priori power calculation, the study is inherently underpowered. These limitations may affect the generalizability of our findings. Future studies with larger sample sizes, longitudinal follow-up, and functional immunophenotyping are warranted to further elucidate the role of T cell subsets in MS progression.
Data Sharing Statement
All data generated or analyzed during this study are included in this published article.
Ethics Approval and Consent to Participate
This study was conducted in accordance with the Declaration of Helsinki. The study was approved by the Ethics Committee of Beijing Anzhen Hospital, Capital Medical University (Approval Number: [2020KLSNo.17]). Written informed consent was obtained from all participants.
Consent for Publication
The manuscript is not submitted for publication or consideration elsewhere.
Author Contributions
All authors made a significant contribution to the work reported, whether that is in the conception, study design, execution, acquisition of data, analysis and interpretation, or in all these areas; took part in drafting, revising or critically reviewing the article; gave final approval of the version to be published; have agreed on the journal to which the article has been submitted; and agree to be accountable for all aspects of the work.
Funding
This research was supported by The National Natural Science Foundation secured assistance for this research (NSF 81870951).
Disclosure
The authors declare that they have no competing interests for this work. All authors confirm that they have no financial or non-financial interests that could be perceived as influencing the study’s design, conduct, or reporting. No authors have received funding or support from entities that could benefit from the study’s results, nor do they have any affiliations that might introduce bias.
References
1. Yamout BI, Alroughani R. Multiple sclerosis. Semin Neurol. 2018;38(2):212–225. doi:10.1055/s-0038-1649502
2. Zhang R, Tian A, Zhang H, Zhou Z, Yu H, Chen L. Amelioration of experimental autoimmune encephalomyelitis by β-elemene treatment is associated with Th17 and Treg cell balance. J Mol Neurosci. 2011;44(1):31–40. doi:10.1007/s12031-010-9483-1
3. Kampaite A, Gustafsson R, York EN, et al. Brain connectivity changes underlying depression and fatigue in relapsing-remitting multiple sclerosis: a systematic review. PLoS One. 2024;19(3):e0299634. doi:10.1371/journal.pone.0299634
4. Correale J, Gaitán MI, Ysrraelit MC, Fiol MP. Progressive multiple sclerosis: from pathogenic mechanisms to treatment. Brain. 2017;140(3):527–546. doi:10.1093/brain/aww258
5. Díaz C, Zarco LA, Rivera DM. Highly active multiple sclerosis: an update. Mult Scler Relat Disord. 2019;30:215–224. doi:10.1016/j.msard.2019.01.039
6. Kobelt G, Thompson A, Berg J, Gannedahl M, Eriksson J; MSCOI Study Group; European Multiple Sclerosis Platform. New insights into the burden and costs of multiple sclerosis in Europe. Mult Scler. 2017;23(8):1123–1136. doi:10.1177/1352458517694432
7. Alroughani R, Boyko A. Pediatric multiple sclerosis: a review. BMC Neurol. 2018;18(1):27. doi:10.1186/s12883-018-1026-3
8. Bar-Or A, Li R. Cellular immunology of relapsing multiple sclerosis: interactions, checks, and balances. Lancet Neurol. 2021;20(6):470–483. doi:10.1016/S1474-4422(21)00063-6
9. Ostolaza Ibáñez A, Corroza Laviñeta J, Ayuso Blanco T. Immunosenescence: the role of age in multiple sclerosis. Neurologia. 2023;38(4):284–290. doi:10.1016/j.nrleng.2020.05.023
10. Kuroda Y, Shibasaki H. Peripheral blood and CSF T-cell subsets in Japanese MS patients. Neurology. 1985;35(2):270–273. doi:10.1212/WNL.35.2.270
11. Jelcic I, Al Nimer F, Wang J, et al. Memory B cells activate brain-homing, autoreactive CD4+ T cells in multiple sclerosis. Cell. 2018;175(1):85–100.e23. doi:10.1016/j.cell.2018.08.011
12. Hauser SL, Cree BAC. Treatment of multiple sclerosis: a review. Am J Med. 2020;133(12):1380–1390.e2. doi:10.1016/j.amjmed.2020.05.049
13. Kurtzke JF. Rating neurologic impairment in multiple sclerosis: an expanded disability status scale (EDSS). Neurology. 1983;33(11):1444–1452. doi:10.1212/wnl.33.11.1444
14. La Mantia L, Vacchi L, Di Pietrantonj C, et al. Interferon beta for secondary progressive multiple sclerosis. Cochrane Database Syst Rev. 2012;1(1):CD005181. doi:10.1002/14651858.CD005181.pub3
15. Confavreux C, Vukusic S, Moreau T, Adeleine P. Relapses and progression of disability in multiple sclerosis. N Engl J Med. 2000;343(20):1430–1438. doi:10.1056/NEJM200011163432001
16. Macaron G, Ontaneda D. Diagnosis and management of progressive multiple sclerosis. Biomedicines. 2019;7(3):56. doi:10.3390/biomedicines7030056
17. Abbadessa G, Lepore MT, Bruzzaniti S, et al. Ocrelizumab alters cytotoxic lymphocyte function while reducing EBV-specific CD8+ T-cell proliferation in patients with multiple sclerosis. Neurol Neuroimmunol Neuroinflamm. 2024;11(4):e200250. doi:10.1212/NXI.0000000000200250
18. Vaughn CB, Jakimovski D, Kavak KS, et al. Epidemiology and treatment of multiple sclerosis in elderly populations. Nat Rev Neurol. 2019;15(6):329–342. doi:10.1038/s41582-019-0183-3
19. Marrie RA, Yu N, Blanchard J, Leung S, Elliott L. The rising prevalence and changing age distribution of multiple sclerosis in Manitoba. Neurology. 2010;74(6):465–471. doi:10.1212/WNL.0b013e3181cf6ec0
20. Klineova S, Lublin FD. Clinical course of multiple sclerosis. Cold Spring Harb Perspect Med. 2018;8(9):a028928. doi:10.1101/cshperspect.a028928
21. Yan K, Balijepalli C, Desai K, Gullapalli L, Druyts E. Epidemiology of pediatric multiple sclerosis: a systematic literature review and meta-analysis. Mult Scler Relat Disord. 2020;44:102260. doi:10.1016/j.msard.2020.102260
22. Naseri A, Nasiri E, Sahraian MA, Daneshvar S, Talebi M. Clinical features of late-onset multiple sclerosis: a systematic review and meta-analysis. Mult Scler Relat Disord. 2021;50:102816. doi:10.1016/j.msard.2021.102816
23. Mirmosayyeb O, Brand S, Barzegar M, et al. Clinical characteristics and disability progression of early- and late-onset multiple sclerosis compared to adult-onset multiple sclerosis. J Clin Med. 2020;9(5):1326. doi:10.3390/jcm9051326
24. Andersen MA, Buron MD, Magyari M. Late-onset MS is associated with an increased rate of reaching disability milestones. J Neurol. 2021;268(9):3352–3360. doi:10.1007/s00415-021-10490-0
25. D’Amico E, Patti F, Zanghì A, Chisari CG, Lo Fermo S, Zappia M. Late-onset and young-onset relapsing-remitting multiple sclerosis: evidence from a retrospective long-term follow-up study. Eur J Neurol. 2018;25(12):1425–1431. doi:10.1111/ene.13745
26. Schouppe E, Van Overmeire E, Laoui D, Keirsse J, Van Ginderachter JA. Modulation of CD8(+) T-cell activation events by monocytic and granulocytic myeloid-derived suppressor cells. Immunobiology. 2013;218(11):1385–1391. doi:10.1016/j.imbio.2013.07.003
27. Walz L, Brooks JC, Shavelle RM, Robertson N, Harding KE. Life expectancy in multiple sclerosis by EDSS score. Mult Scler Relat Disord. 2022;68:104219. doi:10.1016/j.msard.2022.104219
28. Liu P, Yang T, Liu G. Immunological research progress on CD8-+ memory T cell subsets in multiple sclerosis. Chin J Neuroimmunol Neurol. 2021;28(4):329–333. doi:10.3969/j.issn.1006-2963.2021.04.012
29. Takahashi S, Minnie SA, Ensbey KS, et al. Regulatory T cells suppress myeloma-specific immunity during autologous stem cell mobilization and transplantation. Blood. 2024;143(16):1656–1669. doi:10.1182/blood.2023022000
30. Lolli F, Martini H, Citro A, et al. Increased CD8+ T cell responses to apoptotic T cell-associated antigens in multiple sclerosis. J Neuroinflammation. 2013;10:94. doi:10.1186/1742-2094-10-94
31. Multiple Sclerosis International Genetics Consortium. Genetic insights into multiple sclerosis: a comprehensive review. Neurology. 2021;6(1):e1–e15.
32. Li R, Patterson KR, Bar-Or A. Reassessing B cell contributions in multiple sclerosis. Nat Immunol. 2018;19(7):696–707. doi:10.1038/s41590-018-0135-x
33. Hauser SL, Bar-Or A, Cohen JA, et al; ASCLEPIOS I and ASCLEPIOS II Trial Groups. Ofatumumab versus Teriflunomide in Multiple Sclerosis. N Engl J Med. 2020;383(6):546–557. doi:10.1056/NEJMoa1917246
34. Hauser SL, Bar-Or A, Comi G, et al; OPERA I and OPERA II Clinical Investigators. Ocrelizumab versus interferon Beta-1a in relapsing multiple sclerosis. N Engl J Med. 2017;376(3):221–234. doi:10.1056/NEJMoa1601277
35. Cencioni MT, Mattoscio M, Magliozzi R, Bar-Or A, Muraro PA. B cells in multiple sclerosis - from targeted depletion to immune reconstitution therapies. Nat Rev Neurol. 2021;17(7):399–414. doi:10.1038/s41582-021-00498-5
 © 2025 The Author(s). This work is published and licensed by Dove Medical Press Limited. The
full terms of this license are available at https://www.dovepress.com/terms
and incorporate the Creative Commons Attribution
- Non Commercial (unported, 4.0) License.
By accessing the work you hereby accept the Terms. Non-commercial uses of the work are permitted
without any further permission from Dove Medical Press Limited, provided the work is properly
attributed. For permission for commercial use of this work, please see paragraphs 4.2 and 5 of our Terms.
© 2025 The Author(s). This work is published and licensed by Dove Medical Press Limited. The
full terms of this license are available at https://www.dovepress.com/terms
and incorporate the Creative Commons Attribution
- Non Commercial (unported, 4.0) License.
By accessing the work you hereby accept the Terms. Non-commercial uses of the work are permitted
without any further permission from Dove Medical Press Limited, provided the work is properly
attributed. For permission for commercial use of this work, please see paragraphs 4.2 and 5 of our Terms.
Recommended articles
Exploring Factors Associated with Falls in Multiple Sclerosis: Insights from a Scoping Review
Kaddoura R, Faraji H, Othman M, Abu Hijleh A, Loney T, Goswami N, T S Benamer H
Clinical Interventions in Aging 2024, 19:923-938
Published Date: 23 May 2024