Back to Journals » Journal of Multidisciplinary Healthcare » Volume 18
Automated Filtering and Visualization of Patient-Centered Data from Electronic Health Records in Emergency Care: A Scoping Review
Authors Lenz J ![]() , Richter I, Meister S
, Richter I, Meister S ![]()
Received 29 July 2025
Accepted for publication 30 September 2025
Published 9 October 2025 Volume 2025:18 Pages 6503—6517
DOI https://doi.org/10.2147/JMDH.S555000
Checked for plagiarism Yes
Review by Single anonymous peer review
Peer reviewer comments 2
Editor who approved publication: Professor Charles V Pollack
Janek Lenz,1,* Isabel Richter,1,* Sven Meister1,2
1Health Care Informatics, Faculty of Health/School of Medicine, Witten/Herdecke University, Witten, Germany; 2Department Healthcare, Fraunhofer Institute for Software and Systems Engineering, Dortmund, Germany
*These authors contributed equally to this work
Correspondence: Janek Lenz, Health Care Informatics, Faculty of Health/School of Medicine, Witten/Herdecke University, Alfred-Herrhausen-Strasse 50, Witten, 58455, Germany, Email [email protected]
Aim: As the volume and complexity of electronic health record (EHR) data continue to grow, clinicians face increasing cognitive burden when retrieving and interpreting patient data. This is particularly problematic in high-pressure environments such as emergency care, where time-critical decisions must be made based on rapidly accessible, relevant information. Across the included studies and in consistency with findings in the broader literature poor EHR usability and unfiltered data presentation contribute to inefficiencies, errors, and clinician burnout. Patient-centered dashboards and tools that automatically extract and visually organize relevant clinical data offer a promising strategy to mitigate these challenges.
Purpose: This scoping review aims to map the current literature on the automated extraction and visualization of patient-centered information from EHRs for emergency settings. It investigates 1) how clinically relevant data is selected and filtered, 2) which design strategies are used in dashboard development, and 3) what information is considered essential for overview displays in acute care and comparable contexts.
Methods: The review follows the PRISMA-ScR framework. A comprehensive literature search was conducted across major databases (PubMed, Scopus, IEEE Xplore) for studies published from 2010 onwards. Studies were included if they examined automated data filtering, visualization, or dashboard design using EHR data.
Results: Included studies demonstrate a range of approaches to data filtering, from rule-based systems to Artificial Intelligence-driven models. They emphasize the importance of aligning visualizations with clinicians’ cognitive workflows. Relevant parameters frequently included medications, allergies, vital signs, past medical history, and care directives. Design processes often incorporated user-centered and iterative methods, though evaluation rigor varied widely. Several studies report improvements in decision-making efficiency, treatment, and cognitive load reduction.
Conclusion: Automated, patient-centered dashboards can improve EHR usability and support safer, faster decision-making in acute care. However, further research is needed to evaluate clinical impact, ensure interoperability, and define core data elements across settings.
Keywords: Electronic health record, information filtering, artificial intelligence, clinical dashboard, emergency medicine, information filtering, scoping review
Introduction
The digitalization of healthcare has profoundly transformed the way patient information is collected, stored, accessed, and utilized.1 An electronic health record (EHR) serves as the central data storage location for an increasingly vast amount of clinical data (ISO/TR 20514 2005). It is enabling easier sharing of patient data across different facilities, departments and clinical settings, allowing continuity of care and access to essential information whenever and wherever it is needed.2 Especially in time sensitive environments such as emergency departments (ED), where immediate access to essential information such as medication, allergies or medical history is crucial, EHRs hold the potential to significantly improve patient safety and treatment efficiency.3
Despite these advantages, the implementation of EHRs has also introduced substantial challenges. Clinicians often struggle with fragmented information, inconsistently structured, and overly complex user interfaces. These factors are leading to information overload, inefficient workflows, and increased cognitive burden.2,4 Navigating large volumes of unfiltered clinical data can be time-consuming and error prone.5 Cognitive load, which is linked to information overload, is a critical factor affecting clinician performance. Especially high mental workload has been shown to impair attention, working memory, clinical judgment, while also contributing to physician’s burnout. Ultimately this increases the likelihood of diagnostic or therapeutic error.4,5 This is particularly important in the ED, where clinicians must quickly locate, prioritize, and synthesize information to make complex, high-stakes decisions for multiple patients.5,6 In such high-acuity setting, having all relevant data readily available can significantly influence clinical decisions and shape the overall trajectory of care.7 As highlighted by Mijwi et al.8 AI-driven tools and automated data visualization hold significant potential to reduce cognitive burden, improving information accessibility, and enhancing decision making und time pressure.
However, current approaches to structuring essential data often fall short. For instance, in Germany, the “Notfalldatensatz” (emergency dataset) within the electronic patient record (ePA) is intended to provide key patient information in acute scenarios. Yet, since this dataset depends on manual data entry by providers, it is frequently incomplete or outdated—highlighting the urgent need for automated systems capable of dynamically extracting and updating clinically relevant information in real time.3
To address these challenges, patient-centered dashboards have emerged as promising tools to intelligently summarize and present relevant information to clinicians.9 A central goal of these dashboards is the reduction of cognitive load, by organizing data in a way that supports clinical reasoning and rapid comprehension.10 The design and usability of EHR interfaces play a significant role in influencing clinicians’ cognitive workload. Studies examining the relation between EHR design and cognitive load show that poorly structured interfaces characterized by excessive information and data entry, slow system responses and poor navigability contribute significantly to clinician stress, burnout and reduced care quality.9,11 On the contrary studies showed well-designed dashboards tools can improve situational awareness, reduce time spent searching for information, lower cognitive burden and support safer more efficient care.12 Evidently Asgari et al4 note that, improving EHR visualization and data retrieval can “help to reduce cognitive load, support working memory, and potentially reduce physician workload while enhancing patient care”.
Current research in this area focuses on two main aspects. First, the development and testing of intelligent filtering algorithms that identify the most clinically relevant parameters for a specific context.13,14 Secondly, research efforts go to the design of intuitive, user-friendly interfaces and visualizations that try to align with clinician’s mental models and work practices.14
Artificial intelligence (AI) methods play an increasingly important role in both areas, not only in supporting diagnostic or therapeutic decision-making,15,16 but also in enabling the intelligent extraction, filtering, and contextual presentation of patient-centered information from EHRs. In this review, we focus on this latter function: the use of automated approaches to structure and present data in a way that supports, rather than replaces, clinical reasoning.
Therefore, understanding how clinically relevant information is selected, prioritized, and presented in patient overview dashboard is essential for improving EHR usability, support clinical workflows, and ultimately enhance patient safety and care quality in the ED.
Objective
This scoping review aims to systematically map current literature on the automated extraction and display of patient-centered information from EHRs, to subsequently enhance the individual patient care in an emergency setting. Specifically, the review addresses the following objectives:
- To describe how EHR data is automatically filtered and selected for patient-centered dashboards, particularly in time-critical environments such as emergency care.
- To identify design strategies and methods testing the dashboard development.
- To summarize which clinical parameters are considered relevant for inclusion in patient-centered overview displays, including those seen as essential in emergency settings.
Methods
The scoping review aims to assess the current research about automation and presentation of relevant patient data in the ED. The review is in accordance with the Prisma-Scr Checklist17 and the methodology proposed by Arksey and O’Malley18 and Levac et al.19
Stage 1: Identifying Research Question
To assess the various research about EHRs and identify different and related concepts of automation and visualization of patient data, we choose a broader research question: “Automated display of relevant information from the electronic health record for individual patient care in the ED”. Containing the different parts of our research project: the emergency setting, individual patient care, automated filtering of relevant data and the electronic health record.
Stage 2: Identifying Relevant Studies
A literature search was conducted in PubMed, Scopus, and IEEE Xplore to reflect the interdisciplinary scope of this review covering clinical, health science, and technical research. The search strategy was guided by the SPIDER framework,20 focusing on: Sample (clinicians in emergency settings), Phenomenon of Interest (automated filtering of EHR data), Design (studies involving electronic health records), Evaluation (outcomes related to usability and clinical decision-making), and Research type (not explicitly predefined). Search terms covered four key areas: 1) emergency setting, 2) individual patient care, 3) automated data filtering, and 4) electronic patient records. Terms were kept broad to capture a wide range of approaches. Full search terms and MeSH combinations are provided in Appendix 1. The search was limited to English and German from the past 10 years and was conducted on 22.08.2023. Citation searching of included articles was performed to identify additional relevant studies.
Stage 3: Study Selection
The study selection was done using a two-step process. First, the two researchers, IR and JL, independently screened the titles and abstracts using Rayyan.21 A full-text review of the selected abstracts was then performed. Any disagreements were discussed. If there was no consensus a third reviewer (SM) was consulted. Studies were included or excluded according to the following criteria (see Table 1).
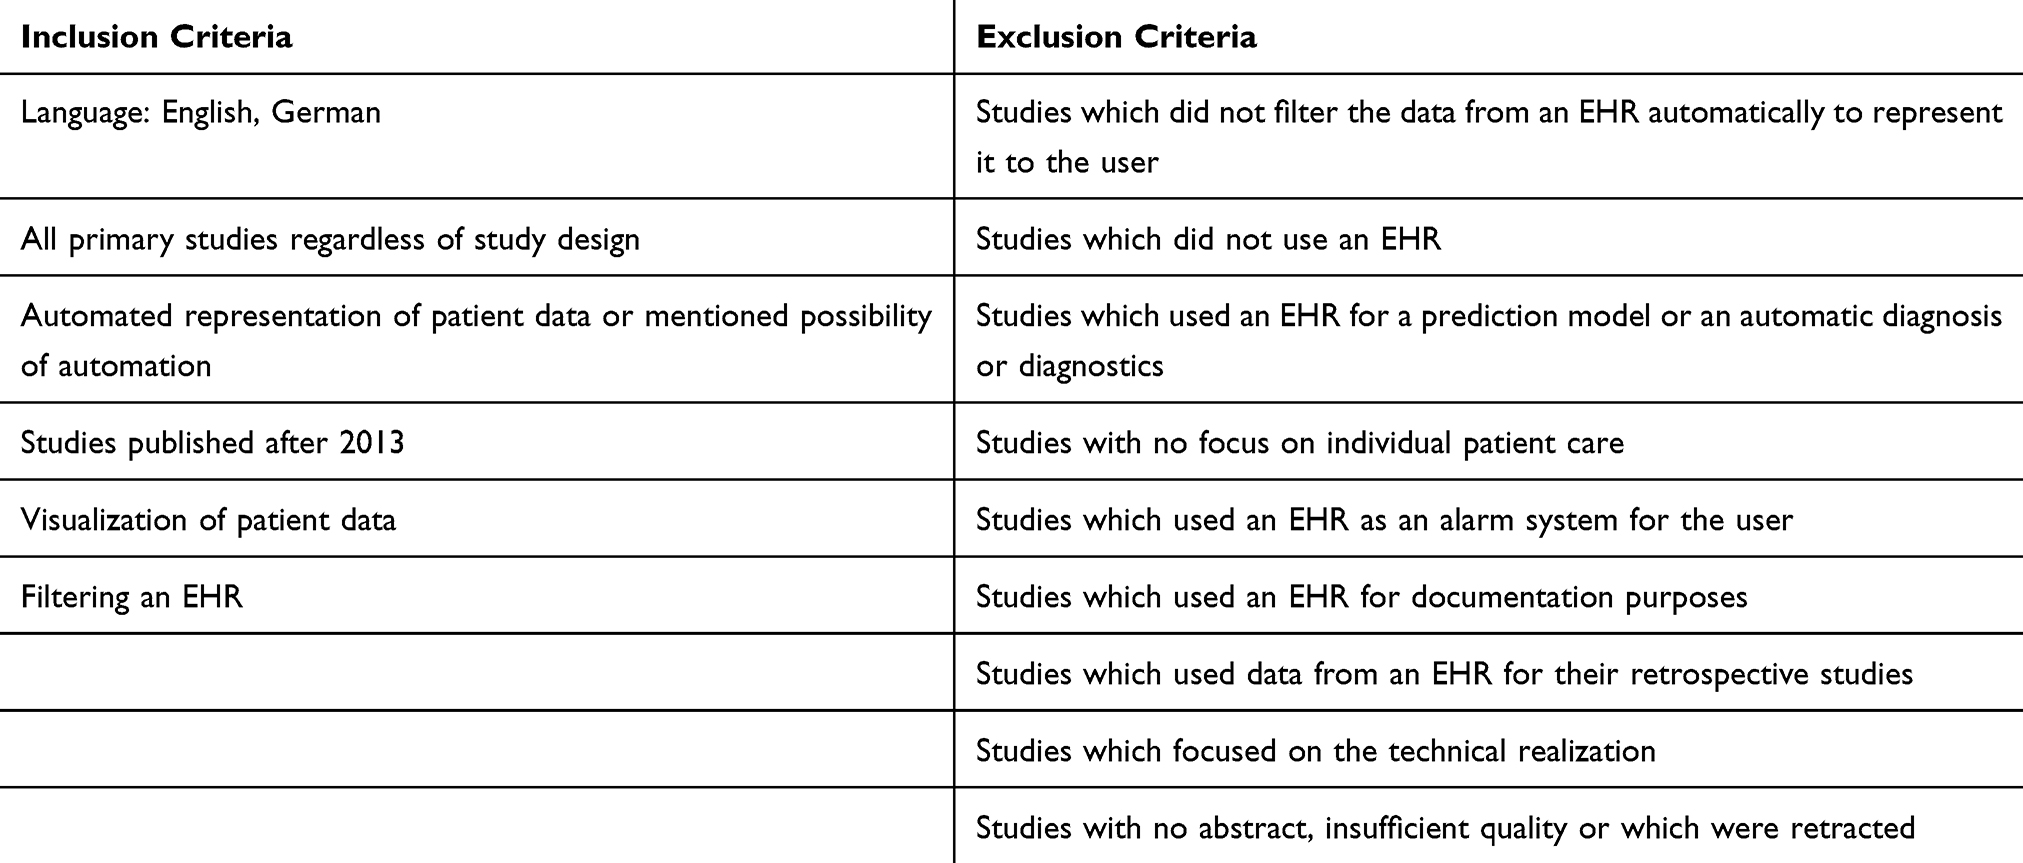 |
Table 1 Inclusion and Exclusion Criteria |
Studies were selected for screening if they had been published in English or German and if they were published after 2013, since we wanted to focus on the most recent developments in the research. Screened were all primary studies and systematic reviews, regardless of experimental, observational, or qualitative study design. The central inclusion criterion was the automated representation of patient data in a way that supports clinical workflow and decisions by aggregating and displaying relevant information to the user. Studies were excluded if they did not use an EHR, did not automatically filter EHR data or mentioned a possibility of automation before presenting it to the clinician, or used an EHR solely for documentation, retrospective data analysis, technical development, or as an alarm system or predictive model. Additionally, studies were excluded if they lacked a focus on individual patient care, had no abstract, were of insufficient quality, or had been retracted.
In this review, we defined the “relevance” of automated filtering or visualization as the presence of a clearly specified algorithm, rule-based filter, or AI driven approach designed to extract, prioritize, or display patient-level data in direct support of clinical workflows and decision making. Only studies that produced patient centered outputs were included.
Although this review emphasizes emergency care, where quick access to relevant information is especially important, it also includes studies from other care settings (eg, chronic or primary care) when they address comparable challenges in data filtering, visualization and information overload. Many of the usability issues and design considerations are shared across settings, offering valuable and transferable insights.
The search yielded a total of 1125 papers. After the removal of 43 duplicates and one paper that was withdrawn, the screening was conducted with 1081 papers. After screening the titles and abstracts, 39 papers remained for full text screening. After full text screening, 6 papers met all inclusion criteria. In addition, one paper was found through reference screening. A total of 7 studies were included in the final review. This study selection process followed the Preferred Reporting Items for Systematic Reviews and Meta-Analyses for Scoping Review (PRISMA-Scr) guidelines17 and can be seen in the following flow diagram (Figure 1).
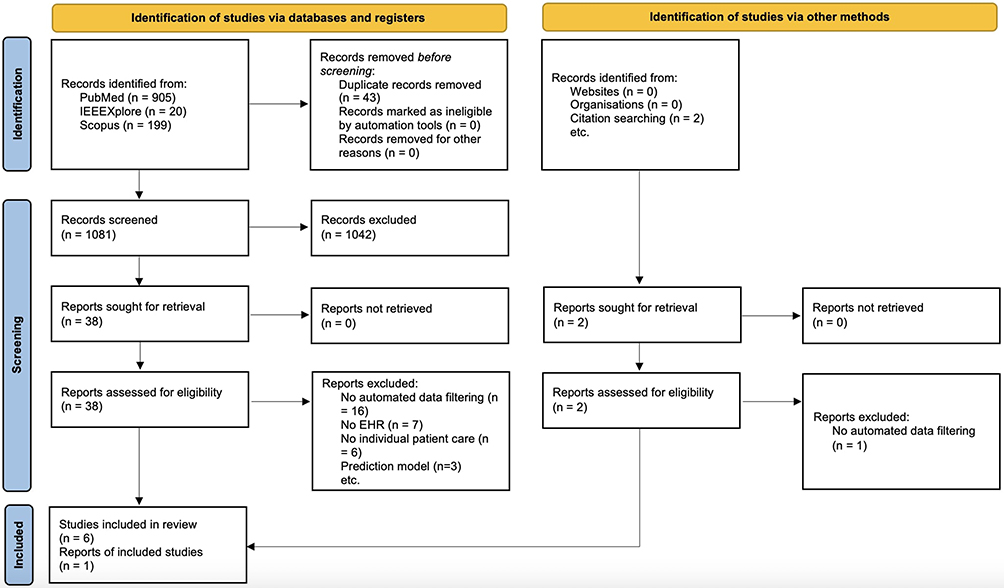 |
Figure 1 PRISMA 2020 flow diagram for new systematic reviews which included searches of databases, registers and other sources.22 |
Stage 4: Charting Data
One reviewer (JL) performed the data extraction using a structured Excel form developed by the authors (see Appendix 2). To assess reliability, a second reviewer (IR) independently extracted data from two sample studies for comparison. The form included information on the study authors, year of publication, title, study type, country, study methods, sample size, study objective, key findings, method of automatization, and the patient information considered relevant for providing an overview of the patient data. In line with our inclusion criteria, automated filtering or visualization was defined as any system or approach that applied rule-based, algorithmic, or AI-driven methods to extract prioritize, or display patient information in a manner that directly supported clinical workflows All discrepancies between the two reviewers were discussed and resolved through consensus. In cases where no agreement could be reached, a third reviewer (SM) was consulted to make the final decision.
Stage 5: Summarizing Results
Following the extraction and charting of the data from the six included studies, a qualitative content analysis was conducted, and the results and key findings of the studies were summarized by the reviewer (JL), aiming to answer the review question and therefore identifying key topics related to the automated filtering and presentation of EHR data. Following an analysis approach based on Levac et al.19 This structured evaluation process served to gain key insights regarding the questions posed in the overview and to derive potential research needs.
Quality Assessment
The included research showed a spectrum of different study designs and methods. Therefore to assess the quality of the included studies the Mixed Methods Appraisal Tool (MMAT, 2018 version)23 was used.
Results
Characteristics of the Studies
Seven studies fulfilled the inclusion criteria and form the basis of this review. Despite variation in methodology and study focus, all studies addressed key aspects of automated data extraction or visualization from EHRs in clinical settings. The results are presented with regard to study characteristics, data filtering methods, dashboard design strategies, and evaluated outcomes.
Table 2 summarizes the key characteristics of the included studies, while detailed results are provided in Appendix 2.
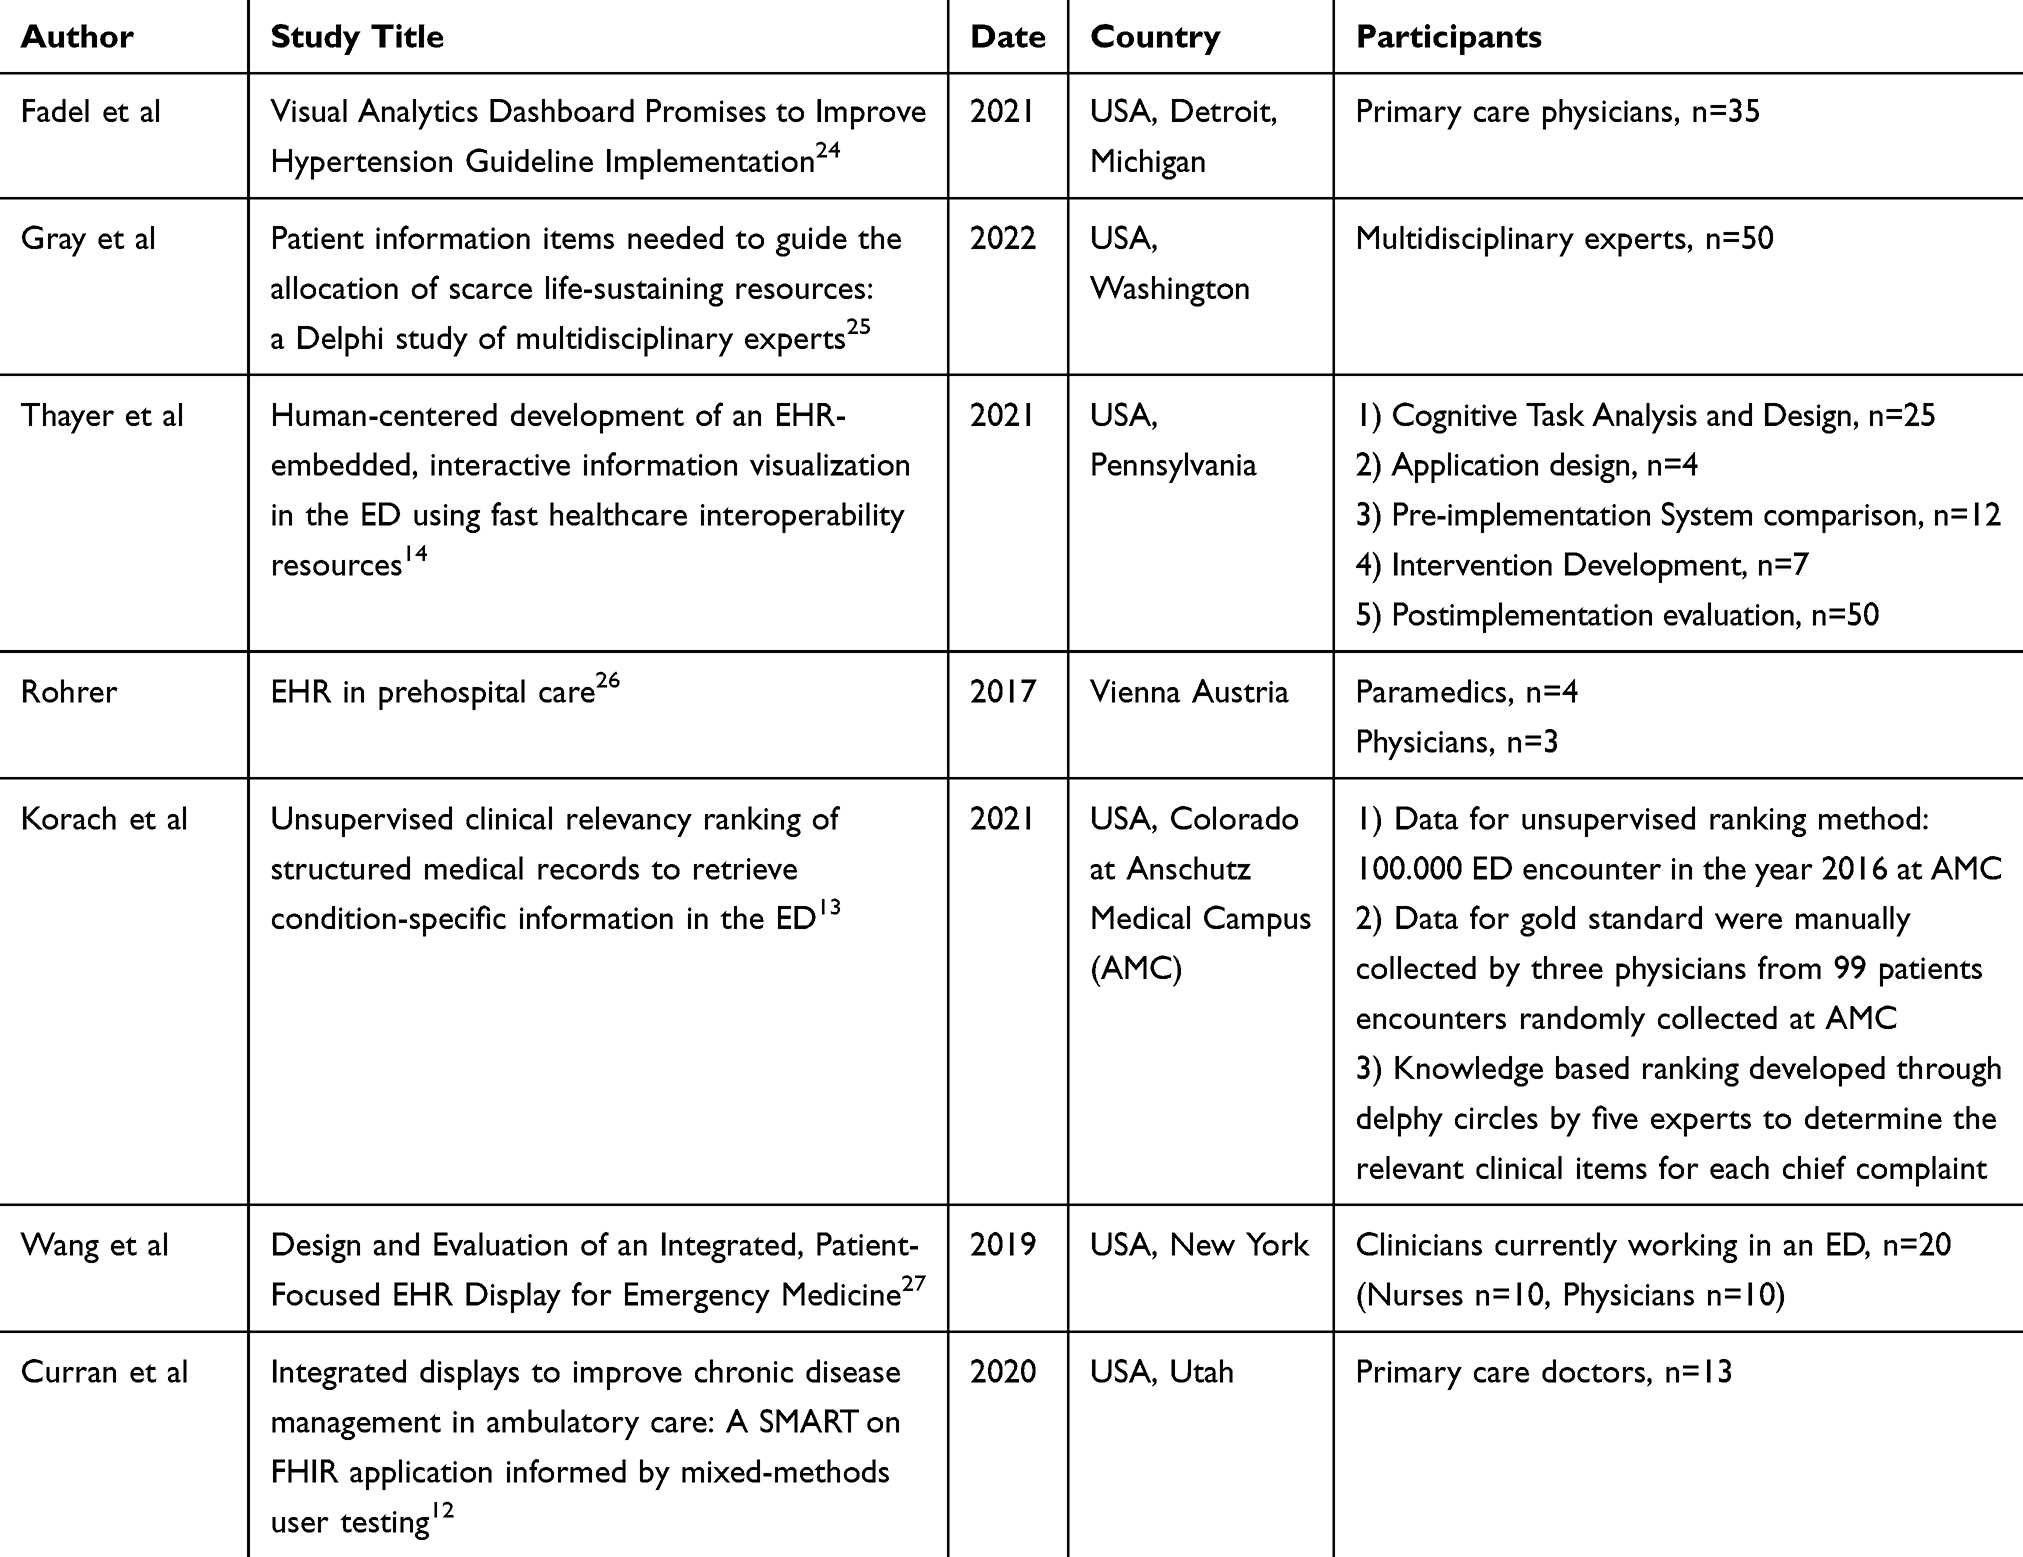 |
Table 2 Key Characteristics |
The included studies were published between 2017 and 2022. Except for one, all were conducted in the United States. Overall, the number of participants ranged from 7 to 50. In one study patient data from 100.000 EHRs was used for training a machine learning algorithm. The study population was overall healthcare professionals from various fields. All included studies were primary research, although the methodologies and study design used, varied considerably across studies ranging from qualitative semi-structured interviews to prospective useability testing.
Critical Appraisal
The methodological quality of the included studies was assessed using the Mixed Methods Appraisal Tool (MMAT, 2018 version).23
The study by Wang et al27 demonstrated a clear rationale for combining qualitative and quantitative approaches, provided detailed descriptions of data collection and analysis, and appropriately integrated findings from both components. Although discrepancies between physicians’ varying performance outcomes and their consistently high satisfaction ratings were acknowledged, the study did not offer a clear explanation for these inconsistencies. It was therefore assessed as methodologically high quality, with an MMAT score of 4/5.
The study by Fadel et al24 was evaluated as a quantitative comparative study. While most criteria for randomized controlled trials were fulfilled, the randomization process and the use of an intention-to-treat analysis were not clearly described. Despite these limitations, the study demonstrated consistent intervention execution and complete outcome reporting. It was assessed as having moderate methodological quality, with an MMAT score of 2/5.
The study by Rohrer26 was evaluated as a qualitative study, as the reported results were purely qualitative in nature—despite the study being labeled as mixed methods. It employed semi-structured interviews and observational reporting to explore needs and barriers in the preclinical setting concerning EHR use. However, the analysis process and reporting of findings lacked transparency, and the rationale behind key assumptions was insufficiently documented. The study was therefore rated as methodologically weak (MMAT score of 2/5).
The study conducted by Korach et al13 was assessed as a quantitative descriptive study. It provided a clear rationale for the research design, along with comprehensive descriptions of data collection, sampling, measurement, and analysis. It was rated as methodologically strong, with a high-quality MMAT score of 5/5.
The study by Gray et al25 was evaluated as a qualitative study, based on findings derived from Delphi rounds involving multidisciplinary experts. The qualitative approach was well aligned with the research objective, and both methodology and data collection were clearly reported. The findings and resulting interpretations were coherent and well substantiated. Accordingly, the study was rated as high quality MMAT score: 5/5.
The study conducted by Thayer et al14 provided a strong rationale for combining methodologies, reported data collection and analysis procedures in detail, and demonstrated effective integration of findings. The study was therefore rated as methodologically high quality, with a final MMAT score of 5/5.
The study conducted by Curran et al12 was evaluated as a mixed methods study. It demonstrated a clear rationale for combining qualitative and quantitative approaches, and the methodology for both components, including data collection and analysis, was well documented. The qualitative findings complemented the quantitative results, showing coherence between both types of data. However, the small sample size limited the strength of the quantitative conclusions. Despite this limitation, the overall methodological quality was judged to be good, and the study received an MMAT score of 5 out of 5.
Overview About Objectives and Setting
The primary aim of the included studies was to develop tools that provide a comprehensive overview of individual patients to support clinical decision-making, particularly in emergency settings13,25–27 and chronic care management.12,14,24 Several studies went beyond conceptual development by designing and implementing dashboard solutions that were subsequently evaluated in clinical or simulated environments.12,14,24,27 Some studies focused on the comparison of a summarizing dashboard versus an EHR in total12,24,27 while others looked at the design, development and evaluation of new visualization tools or automated data-filtering approaches.13,14 However, only one study by Thayer et al implemented the dashboard in routine clinical practice and subsequently evaluated its impact on clinical workflows and decision-making.14
Three studies specifically focused on the visualization of longitudinal patient data to support clinicians in understanding complex disease histories. These focused on conditions such as hypertension,24 asthma,14 and chronic obstructive pulmonary disease.12 In contrast, other studies concentrated on the integration of automated systems, with either an emphasis on the development of filtering algorithms13 or presenting of pre-determined relevant patient information to improve data presentation and reduce cognitive load.25,27
The clinical settings of the included studies varied, reflecting the broad application areas of dashboards and data visualization tools across different areas of healthcare (see Table 3). Two studies were situated in the context of primary care, aiming to support chronic disease management and enhance decision-making during routine outpatient visits.12,24 In contrast, four studies were conducted in the high-paced environment of EDs, where rapid access to relevant patient information is critical for effective triage and acute care.13,14,25,27 Additionally, one study addressed the unique requirements of preclinical emergency care, focusing on the information needs and documentation practices of emergency medical services at the scene of the incident.26 This diversity in settings underscores the versatility of digital dashboard solutions and highlights the necessity for adapted approaches depending on the clinical context.
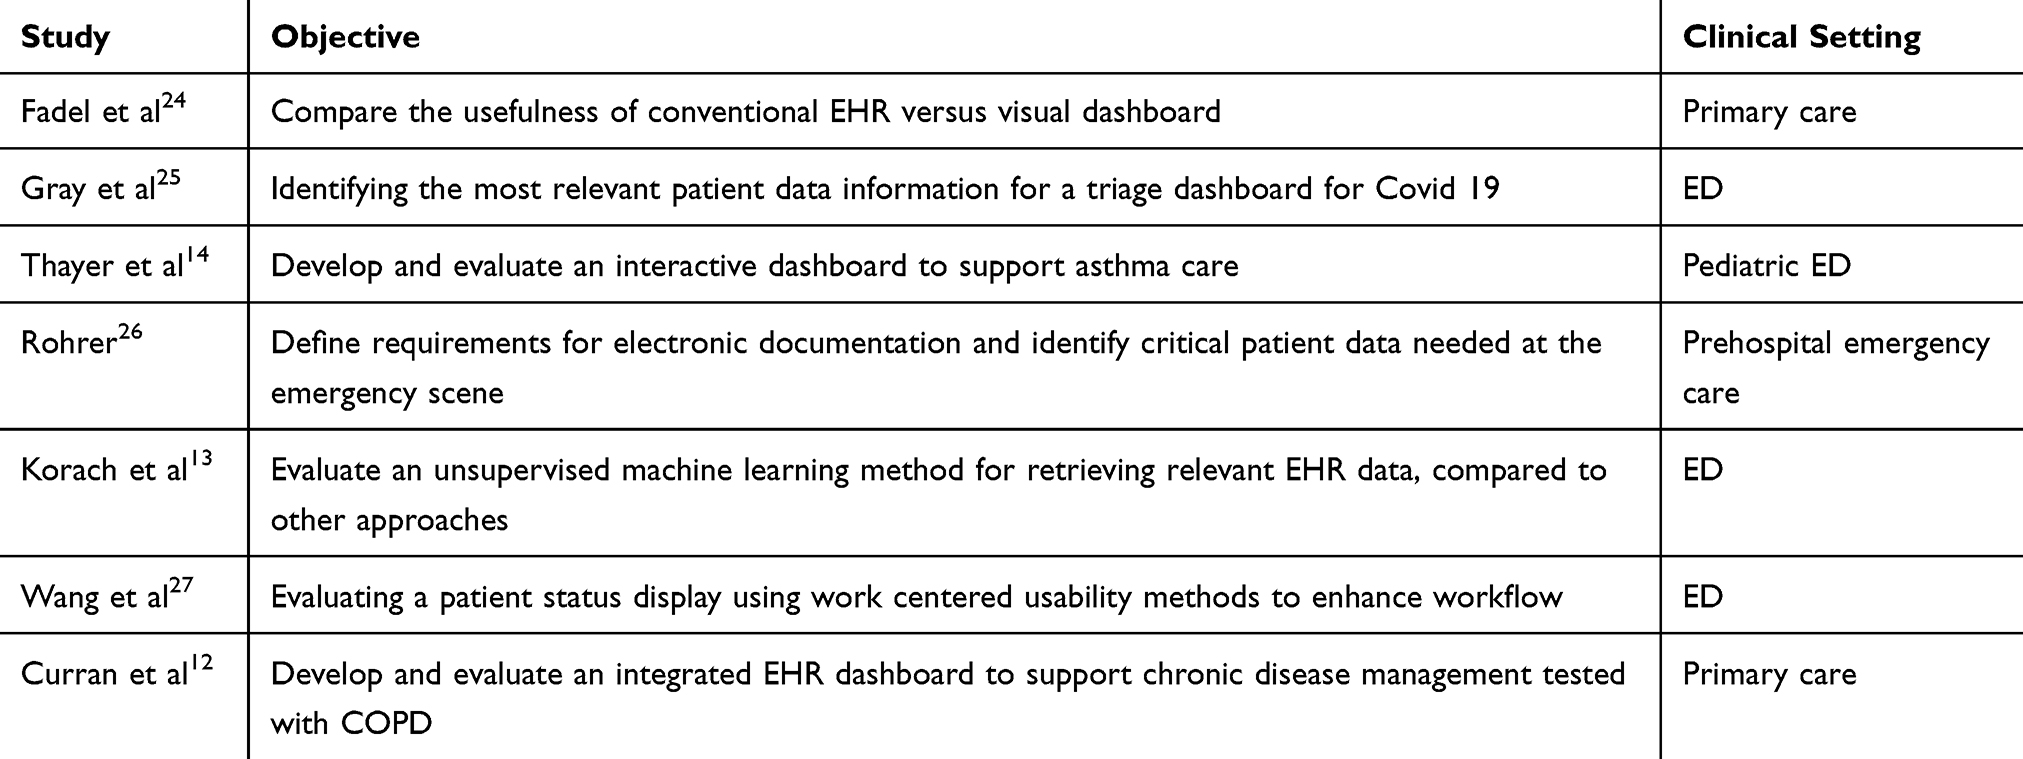 |
Table 3 Objective and Study Setting |
Filtering Approaches
Our literature review indicates that the development and implementation of filtering mechanisms and algorithms for the automated summarization of key patient information remain a relatively niche area within the broader context of clinical decision support. Only a limited number of studies addressed the use of algorithms specifically designed to extract and present relevant data from EHRs in a structured, automated format.13,14 In contrast, a significant portion of the broader literature focuses on the use of artificial intelligence (AI) and machine learning (ML) to support diagnostic decision-making or predict patient outcomes, rather than summarizing existing clinical data.
Among the studies included in this review, a few explored the potential of automation—either by prioritizing patient data for visualization12,25 or proposing frameworks for algorithmic filtering.13 However, none of these approaches achieved full integration of automated data summarization into clinical workflows. In most cases, automation was limited to specific use cases and did not extend to comprehensive integration across EHR systems or patient populations.12–14
The methods used to filter and prioritize patient data varied. Some studies employed rule-based approaches, where relevant clinical parameters were identified before and then used as filters to extract data from EHRs.12,14 On the other hand the study done by Korach et al,13 utilized machine learning-based methods that operated without predefined relevance criteria. This unsupervised model aimed to learn patterns from the data itself to identify and prioritize information seen as relevant, offering more flexibility but less transparency compared to rule-based systems.
Barriers to Implementation of Automated Information Gathering
Several challenges to the full integration of automated dashboards into clinical workflows were identified in the literature, particularly regarding technical compatibility and workflow integration.
One major barrier is the lack of seamless integration into existing EHR systems, partly because so many different EHR systems exist. For instance, Thayer et al14 noted that “no native EHR feature existed that allowed the Asthma Timeline Application to integrate seamlessly into the workflow of ED providers.” This highlights a key issue: even technically advanced dashboards may remain underutilized if they disrupt the clinical workflow or require additional manual steps to access.
A potential solution is demonstrated by Curran et al,12 who used the SMART on FHIR framework—Substitutable Medical Applications and Reusable Technologies on Fast Healthcare Interoperability Resources—to develop an interoperable EHR add-on application. This is an information exchange standard tool. It allows third-party applications to run on top of an EHR, similar to how mobile apps integrate into smartphone operating systems.12,28 While promising, this approach is primarily available to EHRs in the United States and lacks global standardization. Furthermore, as Thayer et al14 also pointed out, SMART on FHIR applications often require launching a separate interface, which can disrupt clinical workflows—especially in time-critical settings like the ED.
Another example of a potential implementation strategy comes from Korach et al,13 who developed an unsupervised machine learning algorithm tailored specifically to the structure and content of their institution’s EHR system. While this approach enabled effective internal data filtering, the lack of generalizability and external validation limits its scalability. Other institutions cannot directly apply or test the algorithm without significant adaptation to their own systems and data models.
Dashboard - Technical and Functional Features
The dashboards developed or proposed in the studies varied in both technical architecture and functional capabilities. Most were designed as web-based interfaces integrated into or compatible with existing EHR systems.12,14 Core features across the dashboards included timeline views for longitudinal data, graphical representations of vitals and labs, alerts for abnormal findings, and summaries of key patient metrics (eg, comorbidities, medications, recent encounters).14,27 Some dashboards incorporated filtering functions or interactive elements allowing clinicians to adjust the view according to their needs.14 User-centered design principles were frequently cited, though actual clinician involvement during the design process varied across studies.
Although a lot of studies aimed to improve clinical decision-making or reduce cognitive burden, few reported systematic evaluations. Among the included studies, Thayer et al14 was the only one to evaluate the integration into their clinical praxis and to quantitatively observe the dashboard’s effect on clinical workflow. Their results demonstrated that use of the Asthma Timeline Dashboard significantly reduced task completion time, improved the accuracy of information retrieval, and received higher satisfaction ratings from clinicians compared to standard EHR use.14 These findings suggest a meaningful potential to enhance both efficiency and quality of care.
The majority of studies documented evaluations intended to provide direction for future development and improvement, such as evaluations on usability testing and user interviews with a limited number of clinicians.
Reported outcomes were generally positive, highlighting improved information accessibility and perceived utility. Table 4 provides a detailed overview of the reported outcomes across studies. However, objective measures such as decision accuracy, time-to-decision, or clinical outcomes were rarely reported, limiting generalizability and evidence strength.
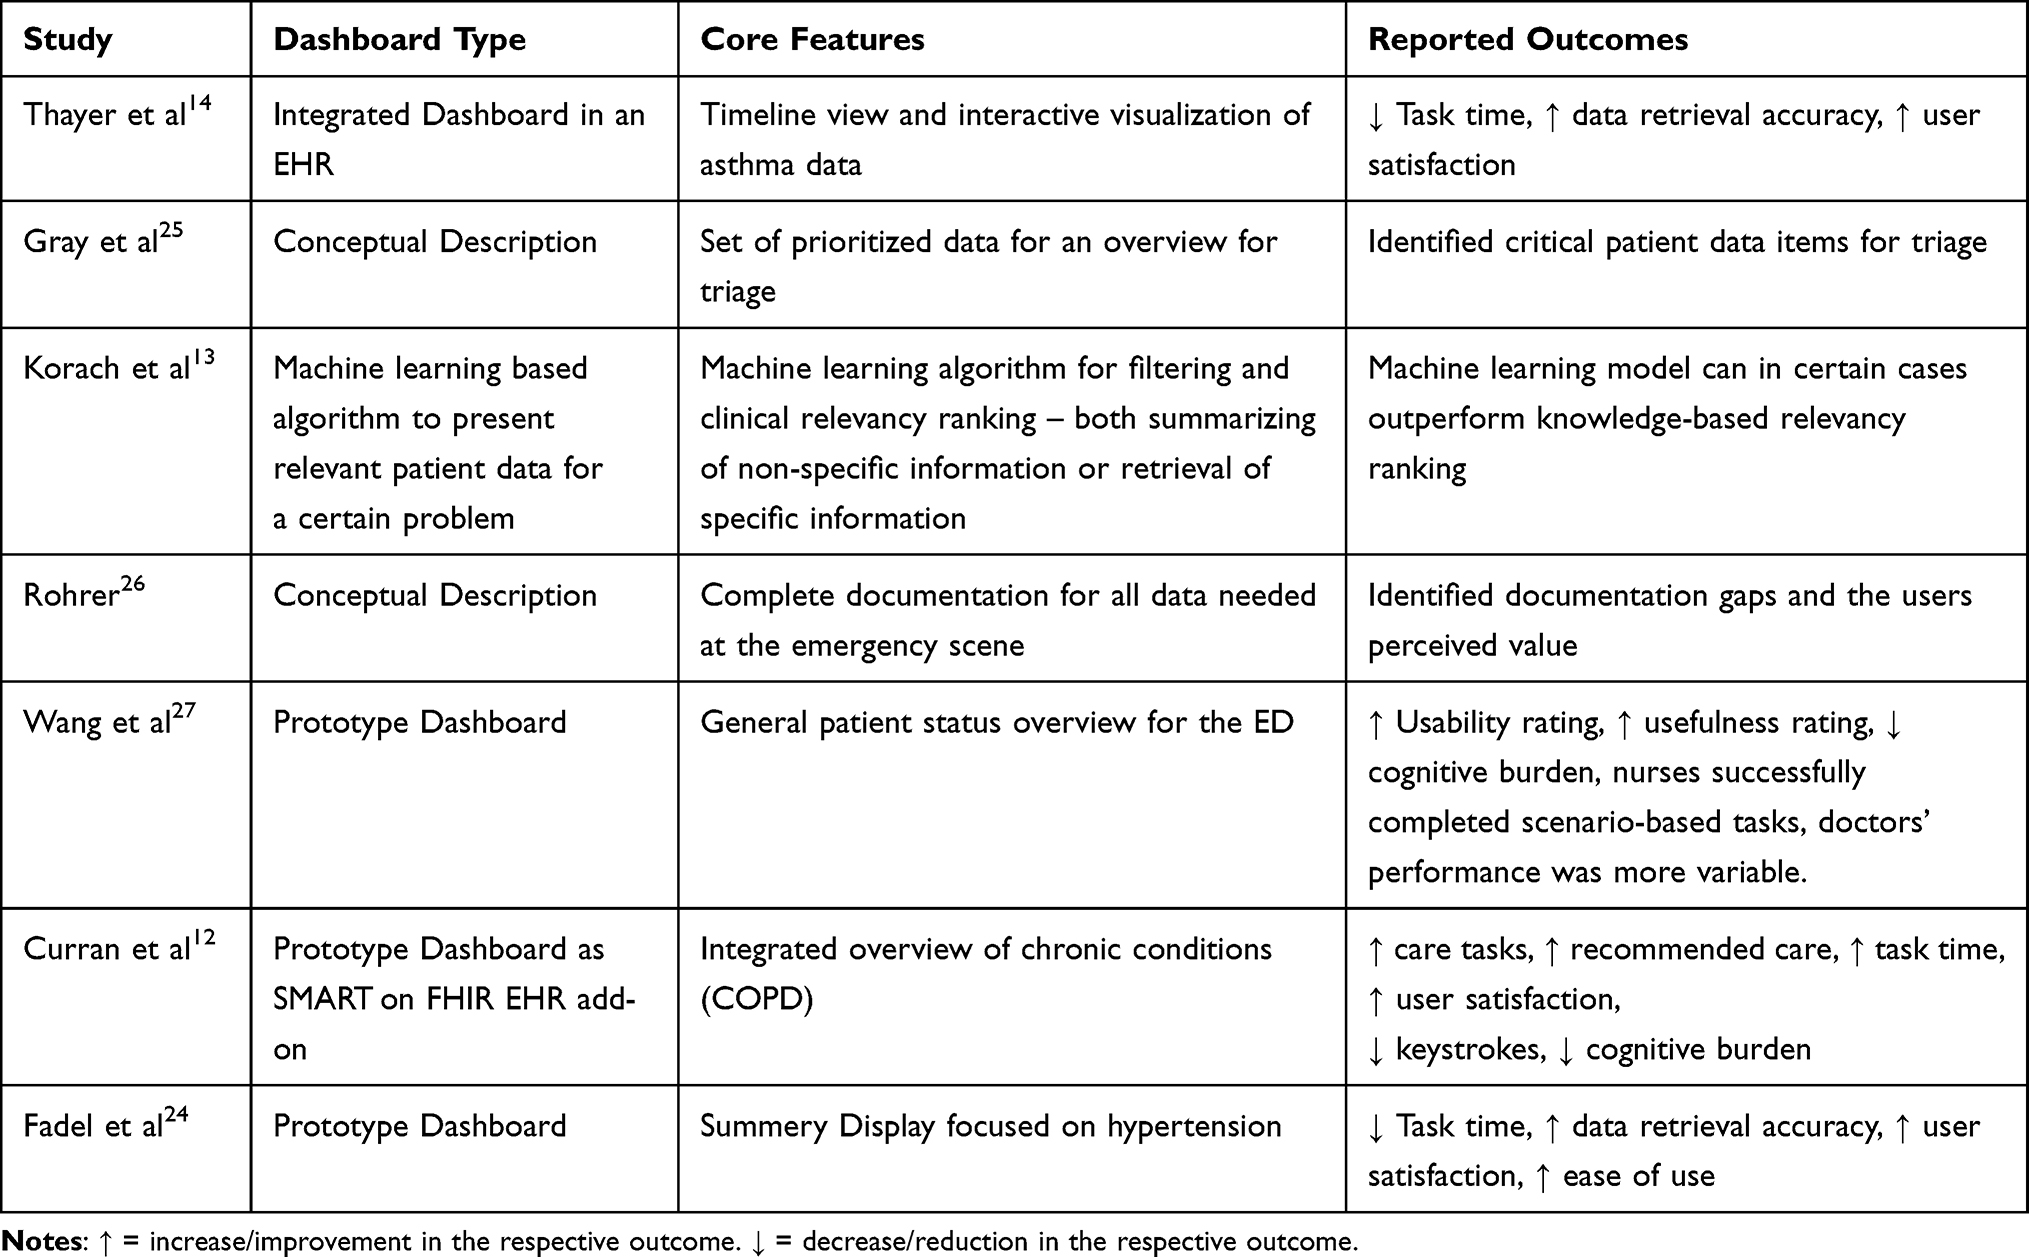 |
Table 4 Dashboard’s Core Features and Outcomes Reported |
Evaluation Methods
Understanding the methodologies applied in the included studies is essential to identify future research needs in this field. The approaches used were heterogeneous, reflecting a broad spectrum of strategies in dashboard development and evaluation. These ranged from qualitative user needs assessments26 to quantitative analyses measuring user performance when interacting with the dashboards.27
A common theme across most studies was the application of mixed methods designs. For a detailed overview of study methodologies, see Table 5. Many studies combined qualitative methods, such as semi-structured interviews or user observations, with quantitative assessments, for example in usability testing or time-on-task measurements.11,23,26,29 One study included validation components for filtering algorithms.13
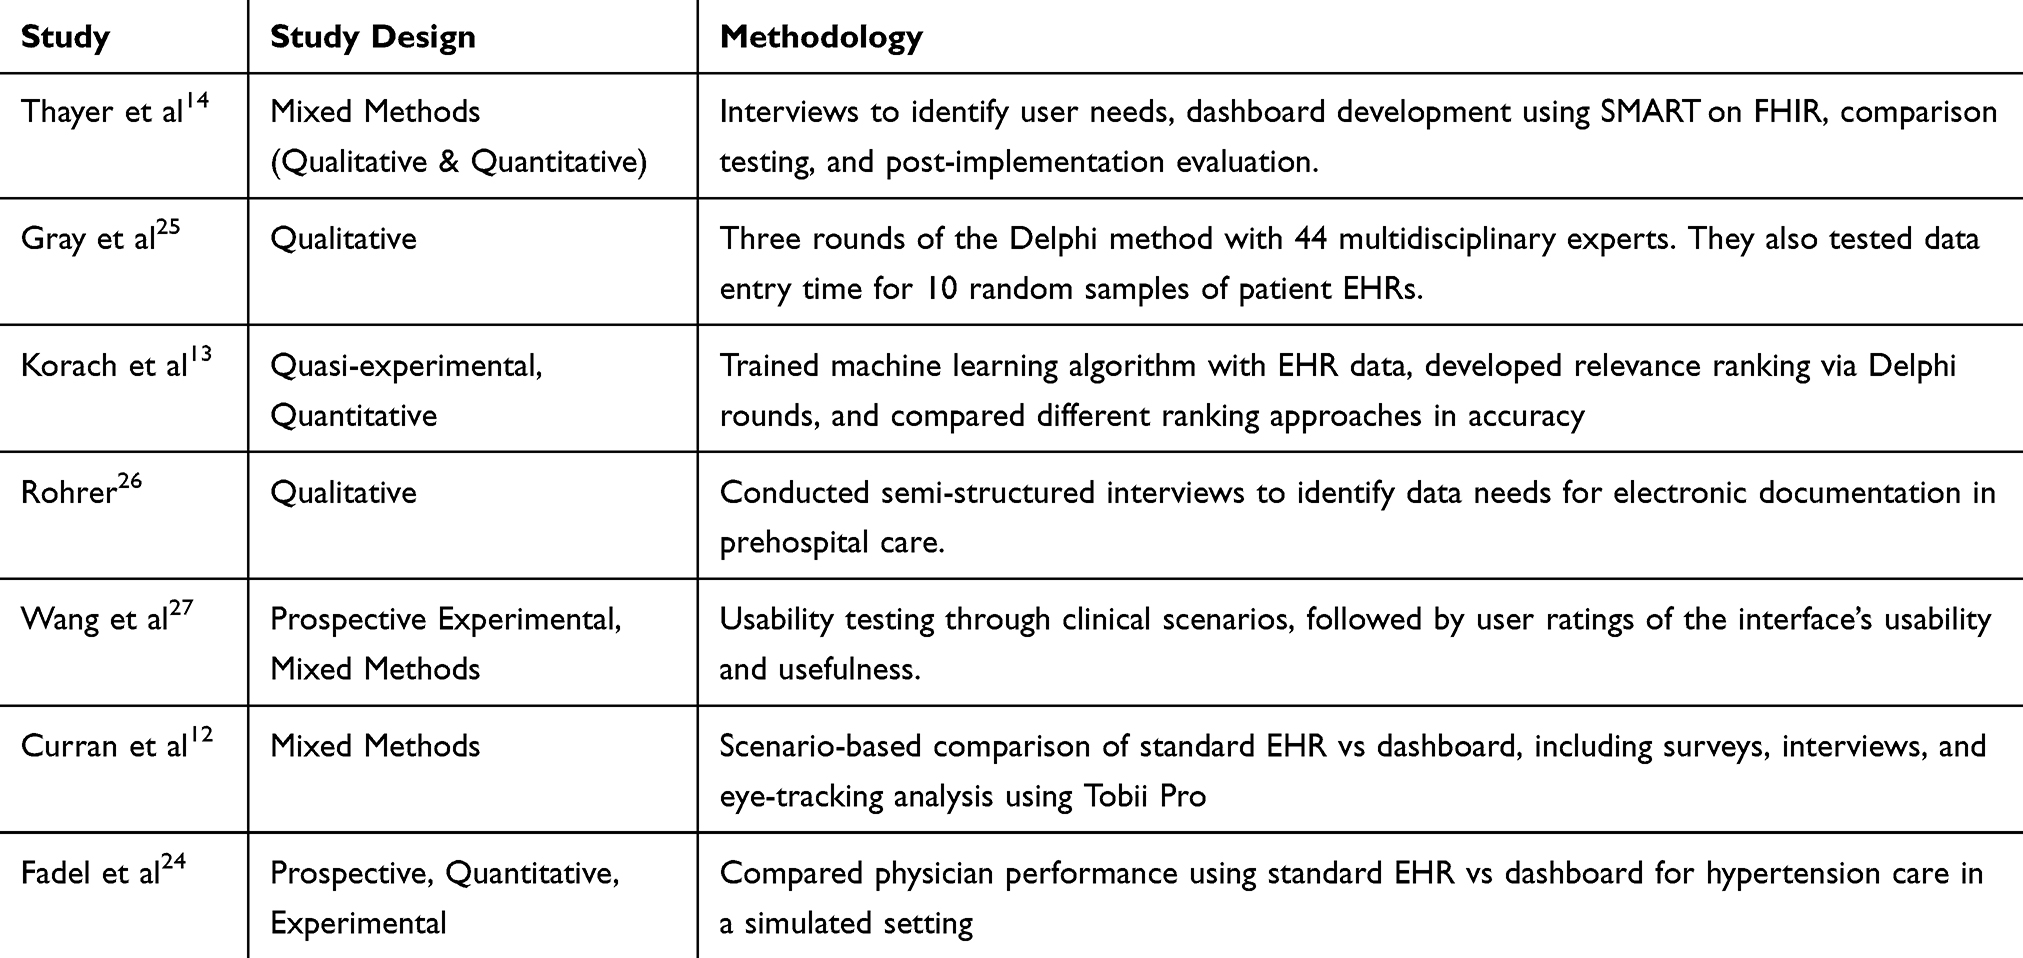 |
Table 5 Methodology Applied in Included Studies |
Notably, the majority of studies explicitly stated that they followed a user-centered design process. They emphasized the importance of incorporating end-user feedback—typically from clinicians—throughout the design and development stages.27 This focus on real-world applicability aimed to ensure that the dashboards addressed actual clinical needs and could be feasibly integrated into existing workflows.
Despite this, the depth of user involvement varied across studies. In some, users were engaged throughout the entire process, from early requirement gathering to final usability testing,14 while others involved users more selectively, such as only during prototype evaluation.
Patient Data Overview
The dashboards presented in the included studies offered varying approaches to defining and displaying relevant patient data. While the structure and detail of each dashboard differed depending on its clinical context and goals, a number of recurring data categories emerged across the studies. These categories reflected the information deemed most essential for clinical decision-making in both emergency and primary care settings.
Determining the Clinical Parameters
Determining relevant patient parameters was approached through a range of methodologies. Some studies, such as those by Fadel et al24 and Curran et al,12 relied on clinical guidelines (eg, ACC/AHA or GOLD) in combination with input from practicing clinicians to define the key variables for their dashboards. Others, like Gray et al,25 applied a Delphi method with large panels of experts to reach consensus on the most important data elements. Thayer et al14 and Rohrer30 conducted interviews and direct observations with emergency clinicians to gather insights into practical information needs, while Korach et al13 used an unsupervised machine learning algorithm to automatically identify relevant data without predefining it. Wang et al27 employed a multidisciplinary design team to synthesize prior research with new input from ED (ED) staff in order to guide their parameter selection.
Clinical Parameters
Across the dashboards, the most commonly included data elements were medications, vital signs, and patient demographics.25,27 Several dashboards included structured summaries of comorbidities or chronic conditions, as well as current complaints, clinical history, and treatment plans.12,24 Notably, more general dashboards such as those developed by Wang et al27 also integrated real-time clinical data such as order history, lab results, critical alerts, and event timelines, enabling a more dynamic and continuous understanding of the patient’s clinical trajectory.
Other dashboards prioritized specific types of information tailored to their setting. For instance, Rohrer et al26 focused on prehospital emergency care, and thus included environmental data, emergency protocols, and on-scene vital signs. Meanwhile, Curran et al,12 who targeted chronic disease management in outpatient care, incorporated preventive measures such as smoking cessation status, vaccination history, and lung cancer screening.
Only some dashboards included decision support elements, such as risk scores (eg, ASCVD risk, COPD stage), automated recommendations, or highlighted care plans based on best practice guidelines.12,24 Additionally, only a few dashboards displayed care preferences, end-of-life directives, or ICU limitations, which are often critical but underrepresented in digital systems.27
In terms of presentation formats, timelines and graphical visualizations were employed to support longitudinal understanding and facilitate quick comprehension of complex histories.14 Interactive filters and modular displays also allowed clinicians to adapt the interface to their information needs.
Discussion
The aim of this scoping review was to map the current body of literature concerning the automated extraction and visualization of relevant patient data from EHRs. Overall, it became evident that this research area—particularly at the intersection with AI—is still in its early stages and remains relatively underexplored, despite growing interest and frequent discussion in the field. While several of the included studies addressed relevant aspects of automated dashboards, most focused on isolated components or specific use cases, rather than presenting comprehensive or generalizable solutions applicable across broader clinical contexts. For example, the study by Thayer et al14 evaluated a dashboard specifically tailored to asthma patients. While it demonstrated valuable insights into clinical visualization and workflow integration, its narrow focus and condition-specific features limit its generalizability to other disease contexts.
Despite the methodological diversity and varying study objectives, a common trend emerged: well-designed and well-integrated dashboards have the potential to save clinicians time, reduce cognitive load, and enhance the quality of care. Effective visualization of critical patient information can make data more actionable and intuitive, which is particularly important in high-pressure environments such as EDs.
Moreover, the literature consistently highlights clinicians’ appreciation for dashboards that streamline access to relevant data—especially in contrast to traditional EHR systems, which are often described as cluttered and difficult to navigate. This usability gap reinforces the value of dashboards as a layer that enhances existing health IT infrastructure. Their potential is especially significant in time-sensitive settings, where rapid access to critical information can directly impact clinical decision-making and patient outcomes.
Principal Findings
Across the included studies, approaches to defining relevant patient information varied widely. Some, like Fadel et al24 and Gray et al,25 relied on clinical guidelines or expert consensus, while others, such as Thayer et al,14 used user-centered design methods. Korach et al13 introduced machine learning for ranking data relevance based on the chief complaint, highlighting the potential of AI in automating data prioritization.
Despite these diverse strategies, many studies were narrow in focus—targeting single use cases (eg, hypertension or asthma)—and often conducted in simulated or localized settings. Only Thayer et al14 evaluated a dashboard in a real clinical setting, showing improved task time, reduced cognitive load, and increased accuracy of information retrieval. Fadel et al24 similarly reported enhanced workflow and adherence to treatment guidelines, but findings were based on simulated scenarios.
A consistent theme across studies was the critical importance of integrating dashboards into clinical workflows and designing interfaces that are both intuitive and visually clear. Visual summaries alone were shown to improve clinician satisfaction and efficiency. However, several studies, including those by Gray et al25 and Rohrer,30 lacked full automation.
Notably, few studies evaluated dashboards against clinical outcomes. While some reported usability gains, most lacked robust testing in real-world settings.12,13,25,27 This gap underscores the need for future research that includes clear clinical endpoints and evaluates the effectiveness of automation in diverse care environments.
In terms of evaluation rigor, the included studies demonstrated substantial variability. Stronger approaches, such as Thayer et al14 combined quantitative measures (eg task time, retrieval accuracy) with subjective assessments of cognitive load, providing a more comprehensive picture of dashboard performance in real-world use. Similarly, Curran et al12 systematically examined workflow efficiency and adherence to guidelines. By contrast, weaker evaluations, such as Rohrer30 and Fadel et al24 offered limited methodological transparency and relied largely on descriptive findings or user impressions, with limited objective performance metrics. This inconsistency limits comparability across studies and highlights the need for standardized, multi-dimensional evaluation frameworks that combine usability testing, workflow impact and clinical patient outcomes.
Comparison to Prior Work
When examining the current body of literature, it becomes evident that research specifically addressing the automated visualization of relevant patient parameters from an EHR remains limited. While individual components of such systems have been explored, comprehensive, fully integrated solutions are rare. For instance, the studies by Ford et al31 and Curran et al12 have investigated methods for highlighting critical clinical information, primarily focusing on improving the clarity and prioritization of EHR content. In contrast, Korach et al13 proposed an automated relevance ranking system that leverages machine learning to prioritize patient data based on the chief complaint – an important step toward scalable automation, though not yet tested in real-world clinical workflow.
Beyond visualization, some systems utilize artificial intelligence for clinical decision support, offering automated recommendations derived from structured EHR data. For example, Coombs et al32 developed a tool that identifies candidates for home-based acute care, illustrating how rule-based automation can enhance patient triage and care planning. However, such tools typically operate independently of visual dashboards and do not directly address the usability challenges clinicians face in navigating complex patient records.
A related perspective is provided by Cara et al33 who developed a machine learning model to predict 30-day hospital readmission using structured EHR data. Their work highlights the importance of carefully selecting relevant clinical variables to predict patient readmission. Although not focused on visualization, this study demonstrates how structured data extraction and feature selection can inform automated systems and serves as a methodological reference point for future dashboard development.
A broader perspective is offered by a scoping review from Bucalon et al,34 which examined the landscape of dashboards used in clinical settings. Their work categorized dashboards by clinical purpose and general use cases but did not focus on automated data extraction or visualization pipelines, nor did it address integration with EHR systems.
In this context, emerging platforms such as Abstractive Health35 represent a promising direction. By applying large language models to generate real-time textual summaries directly from patient records and integrating with EHRs via SMART on FHIR. These tools aim to reduce information overload and support efficient clinical decision-making—especially in high-acuity settings like EDs this could be helpful. However, while these solutions provide valuable narrative summaries, they lack empirical validation and do not include visual representations, which are crucial for rapid comprehension, reducing cognitive load, and decision support under time pressure.
Taken together, the literature highlights fragmented but growing efforts in the field. Current solutions often address either information extraction,24 visual presentation,27 or decision support,15 but rarely all three in an integrated, automated, and validated system. Future research should aim to bridge these gaps by developing and evaluating EHR-integrated dashboards that combine intelligent data selection, intuitive visualization, and clinical impact assessment in real-world settings.
Limitations
Limitations of Included Studies
Most included studies were conducted in simulated settings or limited to single institutions—primarily in the U.S.—reducing generalizability. Only Thayer et al14 tested their dashboard in a real clinical workflow. Several studies addressed narrow use cases, such as Fadel et al24 focusing on hypertension in primary care, limiting broader applicability. Methodological heterogeneity further complicated comparisons, and some studies, such as Rohrer’s,30 lacked transparency in data collection and analysis, lowering their reliability.
Limitations of the Review Process
Despite a comprehensive search, relevant studies may have been missed—particularly grey literature or non-indexed research involving emerging technologies. The search was restricted to the last ten years to focus on recent advances, potentially excluding earlier foundational work. The diversity of study designs precluded quantitative synthesis, we followed a qualitative approach, in line with Arksey and O’Malley’s scoping review framework.18 This approach allows for mapping of the evidence landscape but does not provide conclusions about effectiveness or comparative performance across interventions. Another limitation is that our search concluded in August 2023, meaning that most of the included studies were published prior to this date. Given the rapid pace of developments in this field, particularly with the rise of large language models and other AI-driven solutions, this may raise concerns about the timeliness of the findings. Nevertheless, even after revisiting the more recent literature, we found that the central research question remains insufficiently addressed. We therefore believe that our synthesis continues to provide relevant and timely insights despite this limitation.
Implications for Future Study Designs and Research
This review highlights the need for further investigation to fully understand the impact of automated data filtering and visualization of relevant patient information from EHRs. Despite promising findings, the field is still emerging, and research is needed to translate prototype systems into clinically effective tools. Future studies should aim to address the following priorities:
- User-Centered Design: Dashboards must be developed with strong end-user involvement from the earliest stages of the design process. Co-design approaches that actively engage clinicians, nurses, and other stakeholders are essential to ensure usability and adoption in clinical practice.
- Definition and Validation of Relevant Parameters: The identification of clinically relevant data elements should be context-specific and based on consensus with practicing clinicians. This includes validating parameter sets tailored to specific clinical scenarios (eg, emergency triage, chronic disease management).
- Integration of Automation Techniques: Emerging technologies—including machine learning, general AI, and/or rule-based algorithms—should be integrated into dashboards and EHR systems to support real-time data extraction, filtering, and summarization. The impact of these automated systems should be evaluated in real-world clinical settings.
- Comparative Studies of Manual vs Automated Data Presentation: Future research should assess the differential effects of manual versus automated data filtering and summarization on clinical outcomes.
- Definition and Measurement of Clinical Outcomes: Studies should clearly define and measure clinically meaningful outcomes—such as improvements in patient safety, diagnostic accuracy, time-to-treatment, and resource utilization—to allow for standardized comparison across research initiatives.
- Focus on Interoperability and Generalizability: Dashboard development should prioritize technical frameworks that promote scalability and integration across different clinical environments. Standards such as SMART on FHIR offer a foundation for building interoperable tools that can be deployed and tested across multiple healthcare systems.
By aligning future research with these priorities, the field can progress toward clinically effective, scalable solutions that enhance decision-making, reduce cognitive burden, and ultimately improve patient care.
Conclusion
This scoping review highlights the significant potential of clinical dashboards to enhance patient care, particularly in complex and time-sensitive environments such as EDs. The included studies suggest that structured and visually intuitive presentations of relevant patient data can improve clinical decision-making, increase efficiency, and reduce the time required for data retrieval. Moreover, such dashboards have been associated with higher clinician satisfaction and reduced cognitive workload.
Despite these promising findings, the current body of literature remains highly heterogeneous in terms of design, implementation strategies and evaluation methods. Future research should prioritize user-centered development approaches that ensure seamless integration into existing clinical workflows. Furthermore, additional research is required to validate the selection of relevant clinical parameters, assess the role of automation, and thoroughly evaluate dashboard interventions in real-world settings using clearly defined clinical outcomes.
Acknowledgments
This manuscript was prepared with the assistance of ChatGPT (GPT-4.5, July 2025),36 developed by OpenAI. The tool was used to support the writing process by helping with language editing during the preparation of the introduction and discussion sections. The use of the AI tool aimed to enhance the language quality and improve the readability of the manuscript. All content was reviewed and critically edited by the authors to ensure accuracy.
Disclosure
The authors report no conflicts of interest in this work.
References
1. Blumenthal D, Tavenner M. The “Meaningful use” regulation for electronic health records. N Engl J Med. 2010;363(6):501–504. doi:10.1056/NEJMp1006114
2. Vest JR, Gamm LD. Health information exchange: persistent challenges and new strategies. J Am Med Inform Assoc. 2010;17(3):288–294. doi:10.1136/jamia.2010.003673
3. Born J, Albert J, Bohn A, et al. Der Notfalldatensatz für die elektronische Gesundheitskarte: die Sicht von Notfallmedizinern und Rettungsdienstpersonal. Notfall Rettungsmed. 2017;20(1):32–37. doi:10.1007/s10049-016-0197-y
4. Asgari E, Kaur J, Nuredini G, et al. Impact of electronic health record use on cognitive load and burnout among clinicians: narrative review. JMIR Med Inform. 2024:
5. Budd J. Burnout related to electronic health record use in primary care. J Prim Care Community Health. 2023;14:21501319231166921. doi:10.1177/21501319231166921
6. Born J, Bohn A, Kümpers P, Juhra C. Verfügbarkeit von Patienteninformationen in der Notaufnahme. Med Klin Intensivmed Notfmed. 2023;118(1):54–61. doi:10.1007/s00063-021-00881-6
7. Lorsbach M, Gillessen A, Revering K, Juhra C. Informationen zur medizinischen Vorgeschichte in der Notaufnahme. Med Klin Intensivmed Notfmed. 2021;116(4):345–352. doi:10.1007/s00063-020-00661-8
8. Mijwil MM, Unogwu OJ, Kumar K. The role of artificial intelligence in emergency medicine: a comprehensive overview. Mesopotamian J Artificial Int Healthcare. 2023;2023:1–6. doi:10.58496/MJAIH/2023/001
9. Pollack AH, Pratt W. Association of health record visualizations with physicians’ cognitive load when prioritizing hospitalized patients. JAMA Network Open. 2020;3(1):e1919301. doi:10.1001/jamanetworkopen.2019.19301
10. Swartz JL, Cimino JJ, Fred MR, Green RA, Vawdrey DK. Designing a clinical dashboard to fill information gaps in the emergency department. AMIA Annu Symp Proc. 2014;2014:1098–1104.
11. Kroth PJ, Morioka-Douglas N, Veres S, et al. Association of electronic health record design and use factors with clinician stress and burnout. JAMA Network Open. 2019;2(8):e199609. doi:10.1001/jamanetworkopen.2019.9609
12. Curran RL, Kukhareva PV, Taft T, et al. Integrated displays to improve chronic disease management in ambulatory care: a SMART on FHIR application informed by mixed-methods user testing. J Am Med Inform Assoc. 2020;27(8):1225–1234. doi:10.1093/jamia/ocaa099
13. Korach ZT, Gradwohl S, Messinger A, et al. Unsupervised clinical relevancy ranking of structured medical records to retrieve condition-specific information in the emergency department. Int J Med Inform. 2021;149:104410. doi:10.1016/j.ijmedinf.2021.104410
14. Thayer JG, Ferro DF, Miller JM, et al. Human-centered development of an electronic health record-embedded, interactive information visualization in the emergency department using fast healthcare interoperability resources. J Am Med Inform Assoc. 2021;28(7):1401–1410. doi:10.1093/jamia/ocab016
15. Ritter Z, Vogel S, Schultze F, et al. Using explainable artificial Intelligence Models (ML) to predict suspected diagnoses as clinical decision support. Stud Health Technol Inform. 2022;294:573–574. doi:10.3233/SHTI220529
16. Despins LA. Automated detection of sepsis using electronic medical record data: a systematic review. J Healthc Qual. 2017;39(6):322–333. doi:10.1097/JHQ.0000000000000066
17. Tricco AC, Lillie E, Zarin W, et al. PRISMA extension for scoping reviews (PRISMA-ScR): checklist and explanation. Ann Intern Med. 2018;169(7):467–473. doi:10.7326/M18-0850
18. Arksey H, O’Malley L. Scoping studies: towards a methodological framework. Int J Soc Res Methodol. 2005;8(1):19–32. doi:10.1080/1364557032000119616
19. Levac D, Colquhoun H, O’Brien KK. Scoping studies: advancing the methodology. Implement Sci. 2010;5(1):69. doi:10.1186/1748-5908-5-69
20. Methley AM, Campbell S, Chew-Graham C, McNally R, Cheraghi-Sohi S. PICO, PICOS and SPIDER: a comparison study of specificity and sensitivity in three search tools for qualitative systematic reviews. BMC Health Serv Res. 2014;14(1):579. doi:10.1186/s12913-014-0579-0
21. Ouzzani M, Hammady H, Fedorowicz Z, et al. Rayyan — a web and mobile app for systematic reviews. 2016. 5:210. doi:10.1186/s13643-016-0384-4
22. Page M, McKenzie J, Bossuyt P, Boutron I, Hoffmann T, Mulrow C. PRISMA 2020 flow diagram. PRISMA statement. Available from: https://www.prisma-statement.org/prisma-2020-flow-diagram.
23. Available from: http://mixedmethodsappraisaltoolpublic.pbworks.com/w/file/fetch/127916259/MMAT_2018_criteria-manual_2018-08-01_ENG.pdf.
24. Fadel RA, Ross J, Asmar T, et al. Visual Analytics Dashboard Promises to Improve Hypertension Guideline Implementation. Am J Hypertens. 2021;34(10):1078–1082. doi:10.1093/ajh/hpab081
25. Patient information items needed to guide the allocation of scarce life-sustaining resources: a delphi study of multidisciplinary experts | disaster medicine and public health preparedness | cambridge core. Available from: https://www.cambridge.org/core/journals/disaster-medicine-and-public-health-preparedness/article/patient-information-items-needed-to-guide-the-allocation-of-scarce-lifesustaining-resources-a-delphi-study-of-multidisciplinary-experts/1A028F1B9BA7C0722C09A2C3FC4B71DE.
26. Rohrer K. Electronic health records in prehospital care. In: Health Informatics Meets eHealth. IOS Press; 2017:227–234. doi:10.3233/978-1-61499-759-7-227
27. Wang X, Kim TC, Hegde S, et al. Design and evaluation of an integrated, patient-focused electronic health record display for emergency medicine. Appl Clin Inform. 2019;10(4):693–706. doi:10.1055/s-0039-1695800
28. SMART Health IT. SMART Health IT. Available from: https://smarthealthit.org/.
29. King AJ. The Development and Evaluation of a Learning Electronic Medical Record System. Univercity of Pittsburgh; 2018.
30. Rohrer K. Electronic health records in prehospital care. Stud Health Technol Inform. 2017;236:227–234.
31. Ford JP, Huang L, Richards D, Ambinder EP, Rosenberger JLRAPID. (Root aggregated prioritized information display): a single screen display for efficient digital triaging of medical reports. J Biomed Informat. 2016;61:214–223. doi:10.1016/j.jbi.2016.04.001
32. Coombs L, Orlando A, Wang X, et al. A machine learning framework supporting prospective clinical decisions applied to risk prediction in oncology. Npj Digital Med. 2022;5(1). doi:10.1038/s41746-022-00660-3
33. Cara R, Dhoska K, Cara F, Kayusi F, Juma L. An artificial intelligence model for predicting hospital readmission using electronic health records data. Mesopotamian J Artificial Int Healthcare. 2025;2025:116–123. doi:10.58496/MJAIH/2025/012
34. Bucalon B, Shaw T, Brown K, Kay J. State-of-the-art dashboards on clinical indicator data to support reflection on practice: scoping review. JMIR Med Info. 2022;10(2):e32695. doi:10.2196/32695
35. Abstractive Health. AI Medical Record Summary. https://www.abstractivehealth.com/.
36. OpenAI. ChatGPT [large language model]. Avaiable from: https://chatgpt.com.
 © 2025 The Author(s). This work is published and licensed by Dove Medical Press Limited. The
full terms of this license are available at https://www.dovepress.com/terms
and incorporate the Creative Commons Attribution
- Non Commercial (unported, 4.0) License.
By accessing the work you hereby accept the Terms. Non-commercial uses of the work are permitted
without any further permission from Dove Medical Press Limited, provided the work is properly
attributed. For permission for commercial use of this work, please see paragraphs 4.2 and 5 of our Terms.
© 2025 The Author(s). This work is published and licensed by Dove Medical Press Limited. The
full terms of this license are available at https://www.dovepress.com/terms
and incorporate the Creative Commons Attribution
- Non Commercial (unported, 4.0) License.
By accessing the work you hereby accept the Terms. Non-commercial uses of the work are permitted
without any further permission from Dove Medical Press Limited, provided the work is properly
attributed. For permission for commercial use of this work, please see paragraphs 4.2 and 5 of our Terms.
Recommended articles
Artificial Intelligence in Emergency Trauma Care: A Preliminary Scoping Review
Ventura CAI, Denton EE, David JA
Medical Devices: Evidence and Research 2024, 17:191-211
Published Date: 23 May 2024
Examining the Use of Machine Learning Algorithms to Enhance the Pediatric Triaging Approach
Aljubran HJ, Aljubran MJ, AlAwami AM, Aljubran MJ, Alkhalifah MA, Alkhalifah MM, Alkhalifah AS, Alabdullah TS
Open Access Emergency Medicine 2025, 17:51-61
Published Date: 30 January 2025
Artificial Intelligence in Cardiopulmonary Resuscitation: Revolutionizing Resuscitation Through Precision and Prediction – A Narrative Review
Parizad R, Hatwal J, Javanshir E, Batta A, Mohan B
Vascular Health and Risk Management 2025, 21:847-857
Published Date: 21 October 2025
Artificial Intelligence Integration in Multidisciplinary Wound Management: A Scoping Review of Barriers and Facilitators in Clinical Workflows
Sa’ban FZ, Purba CIH, Rahayu U, Aziz MA, Afriana R, Yudha F
Journal of Multidisciplinary Healthcare 2026, 19:619318
Published Date: 8 June 2026
Barriers and Facilitators to Electronic Health Record Documentation Compliance in Multidisciplinary Hospital Settings: A Scoping Review
Sijabat PB, Somantri I, Komariah M, Aziz MA, Afriana R
Journal of Multidisciplinary Healthcare 2026, 19:620050
Published Date: 10 July 2026