Back to Journals » Drug Design, Development and Therapy » Volume 20
Atorvastatin Attenuates Vancomycin-Induced Nephrotoxicity via PPARα-Associated Regulation of SLC Transporters
Authors Lin K, Li T, Kong X, Li T, Zuo Y, Dong D, Yang S, Zhu Y ![]()
Received 3 October 2025
Accepted for publication 3 April 2026
Published 24 April 2026 Volume 2026:20 571916
DOI https://doi.org/10.2147/DDDT.S571916
Checked for plagiarism Yes
Review by Single anonymous peer review
Peer reviewer comments 2
Editor who approved publication: Dr Leonidas Panos
Kexin Lin,1,* Tingyu Li,2,* Xiaorui Kong,1 Tong Li,1 Yawen Zuo,1 Deshi Dong,1 Shilei Yang,1 Yanna Zhu1
1Department of Pharmacy, The First Affiliated Hospital of Dalian Medical University, Dalian, People’s Republic of China; 2Department of Pharmaceutics, Dalian Women and Children’s Medical Group, Dalian, Liaoning, 116012, People’s Republic of China
*These authors contributed equally to this work
Correspondence: Shilei Yang, Email [email protected] Yanna Zhu, Email [email protected]
Background: Vancomycin (VCM) is a first-line antibiotic for severe infections, but its clinical utility is limited by nephrotoxicity. Atorvastatin (ATO), a widely used lipid-lowering agent, has shown renoprotective potential. However, whether ATO mitigates vancomycin-induced nephrotoxicity (VIN) remains unclear.
Methods: We investigated the effects of ATO on VIN using male C57BL/6 mice and HK-2 cells. Renal function, histopathology, inflammation, oxidative stress, and apoptosis were assessed. Transcriptome sequencing of renal tissue was performed to explore underlying mechanisms.
Results: In vivo, ATO significantly improved VCM-induced renal dysfunction and renal pathological damage in mice. It significantly suppressed the release of inflammatory cytokines, enhanced renal antioxidant capacity, and reduced renal cell apoptosis. In vitro, ATO significantly increased HK-2 cell viability while reducing inflammation, reactive oxygen species (ROS) production, and renal cell apoptosis. Transcriptomic analysis revealed that ATO modulated peroxisome proliferator-activated receptor α (PPARα) signaling activity, which was accompanied by upregulated expression of solute carrier (SLC) transporters.
Conclusion: This preclinical study demonstrates for the first time that ATO attenuates VIN by a PPARα-associated signaling pathway that orchestrates the upregulation of SLC transporters (including OAT1, OAT3, OCT2, and MATE1) to promote the excretion of endogenous toxins, with concomitant integrated protective effects against inflammation, oxidative stress, and apoptosis. These findings identify a novel mechanism and potential therapeutic strategy for VIN.
Keywords: atorvastatin, vancomycin, nephrotoxicity, PPARα, SLC transporters
Introduction
Drug-resistant Gram-positive cocci, such methicillin-resistant Staphylococcus aureus (MRSA), are becoming more common as a result of the widespread use of antimicrobial medications and the rising frequency of nosocomial infections. These infections are not only difficult to treat, but also associated with a high morbidity and mortality rates, which has become an important clinical challenge. Vancomycin (VCM) is a commonly used glycopeptide antibiotic in clinical practice. Guidelines in recent years have indicated that increasing the dosage and blood concentration of VCM can enhance its therapeutic efficacy and reduce the emergence of drug-resistant strains. However, the incidence of vancomycin-induced nephrotoxicity (VIN) caused by high dosages or elevated blood concentrations has also increased significantly, reaching as high as 35%.1–3 Meanwhile, many patients treated with VCM have complex medical conditions, severely impaired renal function, or are concomitant use of other nephrotoxic drugs, all these factors further increase the risk of VIN.4,5 Despite this, VCM has remained the first-line therapy for MRSA infections for over half a century, as endorsed by international guidelines.6 Therefore, how to effectively reduce the occurrence of VIN has become a pressing clinical issue that needs to be addressed urgently. Previous research has demonstrated that the primary pathogenic processes of VIN are oxidative stress, mitochondrial malfunction, and apoptosis.7–9 Although natural products (such as rutin10 and renogrit11) have demonstrated certain renoprotective effects through multi-target interventions, they have not yet been translated into clinical practice due to limitations in their drug-likeness. In contrast, drug repositioning of already-marketed drugs with established safety profiles—such as atorvastatin (ATO)—offers a more efficient and directly translatable strategy to address urgent clinical challenges like VIN, bypassing the lengthy timelines and high costs associated with new drug development.
ATO, a widely used cholesterol-lowering agent, has demonstrated renoprotective potential in various models of kidney injury beyond its established cardiovascular benefits, with effects commonly attributed to mechanisms such as anti-inflammation, antioxidant activity, and anti-apoptosis.12–15 However, whether these known mechanisms adequately explain its specific renoprotection against VIN remains incompletely understood. Notably, renal transporters play a central role in the clearance of drugs and endogenous toxins. VCM has been reported to alter the expression and function of specific transporters, including organic anion/cation transporters (OATs/OCTs), leading to impaired toxin clearance and kidney injury.16,17 In contrast, ATO has been shown to modulate the expression of such transporters, thereby promoting the efflux of endogenous toxins and reducing intrarenal drug accumulation.18,19 Interestingly, some pleiotropic effects of statins, including anti-inflammatory and metabolic regulation, are associated with the modulation of nuclear receptor signaling activity, particularly that of peroxisome proliferator-activated receptor α (PPARα).20,21 Furthermore, PPARα is a key transcriptional regulator of several solute carrier (SLC) transporters.22–27 Therefore, this study aims to investigate whether the renoprotective effect of ATO against VIN is mediated through modulation of the PPARα-associated signaling pathway, leading to transcriptional regulation of downstream SLC transporters, thereby revealing a novel mechanism beyond its conventional pathways of action.
To address this knowledge gap, the study aims to establish a VCM-induced kidney injury model in C57BL/6 mice and human renal tubular epithelial cells (HK-2 cells), evaluate the renoprotective effects of ATO against VIN, and investigate its potential mechanism using transcriptomic analysis, with a particular focus on PPARα signaling and downstream SLC transporter regulation, so as to provide a novel target and therapeutic strategies for the prevention and treatment of VIN.
Materials and Methods
A single-blinded design was implemented throughout the present study for all experimental data acquisition, including microscopic image capture, Western blot detection, histopathological evaluation, and Terminal deoxynucleotidyl transferase dUTP nick-end labeling (TUNEL) staining scoring, as well as subsequent quantitative analysis including ImageJ-based blot quantification, image analysis, and quantitative real-time polymerase chain reaction (qRT-PCR) data processing. Operators and analysts were kept unaware of the sample grouping information to minimize potential unconscious experimental bias.
Reagents
VCM (purity > 98%) and ATO (purity > 98.5%) were purchased from Dalian Meilun Biotechnology Co., Ltd. (Dalian, China). Dulbecco’s Modified Eagle Medium Nutrient Mixture F-12 (DMEM/F-12), fetal bovine serum (FBS), penicillin streptomycin antibiotic mixture, and PPARα inhibitor GW6471 purchased from Sigma Chemical, Co. (St. Louis, MO, USA). The Reactive Oxygen Species (ROS) Detection Kit, Hoechst 33342 Staining Solution, Hematoxylin-Eosin (HE) Staining Kit, and TUNEL Kit were purchased from Shanghai Beyotime Biotechnology Co., Ltd. (Shanghai, China). The creatinine (CR) assay kit, blood urea nitrogen (BUN) assay kit, superoxide dismutase (SOD) assay kit, glutathione (GSH) assay kit, and catalase (CAT) assay kit were purchased from Nanjing Jiancheng Bioengineering Institute (Nanjing, China). The enzyme-linked immunosorbent assay (ELISA) kits for detecting tumor necrosis factor-α (TNF-α), interleukin-6 (IL-6), and interleukin-1β (IL-1β) in mice were purchased from Wuhan Bionly Biological Technology Co., Ltd. (Wuhan, China). The Cell Counting Kit-8 (CCK-8) was purchased from Yunhe Biotechnology Co., Ltd. (Nanjing, China). The reverse transcription kit and PCR amplification kit were purchased from Novozam Biotech Co., Ltd. (Nanjing, China). All antibodies employed in the present study were as follows: Bcl-2 (AF6139, 1:1000 dilution, Affinity Biosciences, USA), Bax (AF0120, 1:1000 dilution, Affinity Biosciences, USA), FABP3 (10,676-1-AP, 1:2000 dilution, SanYing Biotechnology Co., Ltd., Wuhan, China), ACOX2 (17,571-1-AP, 1:1000 dilution, SanYing Biotechnology Co., Ltd., Wuhan, China), FATP2 (14,048-1-AP, 1:2000 dilution, SanYing Biotechnology Co., Ltd., Wuhan, China), OAT1 (26,574-1-AP, 1:1000 dilution, SanYing Biotechnology Co., Ltd., Wuhan, China), OCT2 (18,996-1-AP, 1:1000 dilution, SanYing Biotechnology Co., Ltd., Wuhan, China), OAT3 (16,844-1-AP, 1:1000 dilution, SanYing Biotechnology Co., Ltd., Wuhan, China), MATE1 (20,898-1-AP, 1:1000 dilution, SanYing Biotechnology Co., Ltd., Wuhan, China), β-actin (20536-1-AP, 1:5000 dilution, SanYing Biotechnology Co., Ltd., Wuhan, China), and horseradish peroxidase (HRP)-conjugated goat anti-rabbit IgG (H + L) secondary antibody (SA00001-2, 1:5000 dilution, SanYing Biotechnology Co., Ltd., Wuhan, China).
Animal Management
Male C57BL/6 mice aged 6–8 weeks and weighing 20–22 g (obtained from Liaoning Changsheng Technology Co., Ltd.) were selected for the animal experiment. The mice were housed in an environment with a temperature of 22.5±2 °C, a 12-hour light-dark cycle, and a humidity of 50–70% for an adaptive feeding period of 7 days. During this period, they had free access to water and food. The animal experiment of this project was approved by the Animal Ethics Committee of Dalian Medical University, and the animal ethics number was AEE24267. All experimental animals were treated under anesthesia. This study only employed male mice, which constitutes a sex bias and is a limitation of the present research.
ATO was suspended in a 0.5% sodium carboxymethylcellulose (CMC-Na) solution, and VCM was dissolved in normal saline. The mice were randomly divided into 5 groups (n=6), and the interventions were as follows: (1) CONTROL group: Intraperitoneal injection of normal saline and oral gavage with 0.5% CMC-Na. (2) ATO single administration group: Oral gavage at a dose of 10 mg/kg/d, with intraperitoneal injection of normal saline. (3) VCM model group: Intraperitoneal injection of VCM at a dose of 600 mg/kg/d, and oral gavage with 0.5% CMC-Na. (4) Low-dose ATO protection group: Oral gavage at a dose of 5 mg/kg/d, with intraperitoneal injection of VCM at a dose of 600 mg/kg/d. (5) High-dose ATO protection group: Oral gavage at a dose of 10 mg/kg/d, with intraperitoneal injection of VCM at a dose of 600 mg/kg/d. Although the VCM dose (600 mg/kg/d) exceeds typical clinical exposure, it is a widely accepted and reproducibly effective regimen for inducing acute nephrotoxicity in murine models, as supported by numerous previous studies.28,29 ATO was administered by oral gavage for 10 consecutive days. Starting from the 4th day, 0.5 h after the oral gavage of ATO, either normal saline or VCM was administered by intraperitoneal injection for 7 consecutive days. On the 11th day, the mice were sacrificed under isoflurane anesthesia. The whole blood of the mice was collected and placed in heparinized EP tubes, centrifuged at 5000 rpm for 10 minutes. Subsequently, the supernatant was removed, and the plasma was transferred to a new EP tube and stored frozen (−80 °C) for future measurement. After the kidneys of the mice were removed, they were divided into two parts. One part was fixed in 4% paraformaldehyde for HE staining and TUNEL staining, and the remaining part was quickly frozen with liquid nitrogen and stored in a −80 °C refrigerator for subsequent experiments.
Kidney Histology
The kidneys of the mice were fixed in 4% paraformaldehyde and then dehydrated sequentially with a gradient of alcohol. Subsequently, they were embedded in paraffin, and the paraffin blocks were cut into sections with a thickness of 5 μM. The morphological examination of the mouse kidneys and the detection of cell apoptosis were carried out using the HE staining kit and the TUNEL kit.
Biochemical Analysis
The plasma samples stored at −80 °C were taken out and placed on ice. According to the steps in the instruction manual, the levels of CR and BUN in the mouse plasma were measured to evaluate the renal function of the mice.Approximately 50 mg of kidney tissue was weighed and washed with pre-cooled normal saline. The moisture was blotted dry with filter paper, and the kidney tissue was placed in an enzyme-free EP tube. An appropriate amount of normal saline was added, and the mixture was ground and disrupted using a tissue homogenizer to prepare a 10% kidney tissue homogenate. After centrifugation at 3000 r/min for 15 minutes at 4 °C, the supernatant was taken and placed on ice for future use. Before the measurement, the supernatant was diluted with normal saline, and then according to the steps in the instruction manual, the activities of SOD, GSH, and CAT in the kidney tissue were measured to assess the degree of oxidative stress in the mice.
Elisa
The plasma samples stored at −80 °C were taken out and placed on ice. According to the steps in the instruction manual, the levels of TNF-α, IL-6, and IL-1β in the mouse plasma were measured.
Transcriptome Sequencing
Only the VCM and VCM + ATO high-dose groups were used for transcriptomic sequencing, as high-dose ATO showed the most obvious renoprotective effect. In this study, we utilized the polyA structure at the 3′-end of messenger RNA within the total RNA of mouse renal tissues. Libraries were sequenced on an Illumina NovaSeq platform with paired-end reads (150 bp). The sequencing depth was sufficient to ensure reliable gene expression quantification. The transcriptome data are available from the corresponding author upon reasonable request. By applying relevant molecular biology techniques, a series of treatments were carried out on the intact total RNA from different treatment groups. We successfully constructed a sequencing library that met the quality control standards and was compatible with the Illumina platform. For the differentially expressed genes (DEGs) screened out, we conducted enrichment analyses using Kyoto Encyclopedia of Genes and Genomes (KEGG), Gene Ontology (GO), and Reactome to deeply explore the gene functions and the signaling pathways they are involved in. The screening criteria for DEGs were set as |log2Fold Change| ≥ 1 and a false discovery rate (FDR) < 0.05. Finally, the analysis of the research results was assisted by Wuhan Metware Biotechnology Co., Ltd. Since transcriptomic and phenotypic data were collected at the same endpoint, the temporal order between transcriptomic changes and phenotypic recovery could not be determined.
Cell Culture
The HK-2 cells were purchased from the Cell Bank of the Chinese Academy of Sciences. For cell culture, DMEM/F-12 medium was used, supplemented with FBS at a volume fraction of 10% and 1% antibiotics. The cells were cultured in a humidified incubator at 37°C with 5% CO2. HK-2 cells do not fully recapitulate primary proximal tubular physiology, which constitutes a limitation of the present in vitro study.
Cell Viability Assay
In a 96-well plate, 1×10⁴ HK-2 cells in good condition were seeded per well, and 200 μL of PBS was added to the peripheral wells to prevent liquid evaporation. After the cells adhered and reached a stable growth state, the following experiments were carried out: (1) VCM was first dissolved directly in cell culture medium to prepare a stock solution, which was subsequently diluted to serial working concentrations of 0, 2, 4, 6, 8 and 10 mM. Then, 100 μL of VCM solution at the corresponding final concentration was added to each well individually, and the cells were further incubated for 24 h after drug treatment. Subsequently, 100 μL of 10% CCK-8 reagent was added to each well, and the plate was incubated at 37 °C for 4 h. The absorbance at 450 nm was measured using a microplate reader, and the cell viability was calculated according to the manufacturer’s instructions. Then, the IC50 value of VCM on HK-2 cells was calculated. (2) ATO and VCM combination experiment: 100 μL of mixed solutions containing different final concentrations of ATO (2 μM and 10 μM)15,30–32 and 4 mM VCM were added to each well and incubated for 24 h. After that, 100 μL of 10% CCK-8 reagent was added to each well, and the plate was incubated at 37 °C for 4 h. The absorbance at 450 nm was measured, and the cell viability was calculated according to the manufacturer’s instructions. (3) PPARα inhibitor GW6471 intervention experiment: 100 μL of the following three solutions were added to different wells respectively: 4 mM VCM, 4 mM VCM + 10 μM ATO, 4 mM VCM + 10 μM ATO + 10 μM GW6471. After incubation for 24 h, 100 μL of 10% CCK-8 reagent was added to each well, and the plate was incubated at 37 °C for 4 h. The absorbance at 450 nm was measured, and the cell viability was calculated according to the manufacturer’s instructions.
Determination of ROS Within Cells
5×10⁴ HK-2 cells in good condition were seeded into 6 - well plates and cultured overnight. On the following day, in accordance with the requirements of different treatment groups, the corresponding solutions were added to each well, and the cells were cultured for an additional 24 h. On the third day, DCFH-DA was diluted with serum - free cell culture medium at a ratio of 1:1000 to reach a final concentration of 10 μM/L. After discarding the cell culture medium, 1 mL of the diluted DCFH-DA was added to each well, and the plate was incubated in a 37 °C cell incubator for 20 min. Subsequently, the cells were washed three times with serum-free cell culture medium to completely remove the non - internalized DCFH-DA. Subsequently, the cells were observed and photographed under a fluorescence microscope.
Hoechst 33342 Staining
In a 96-well plate, 1×10⁴ HK-2 cells in good condition were seeded per well, and 200 μL of PBS was added to the peripheral wells to prevent liquid evaporation. The 96-well plate was then placed in a constant-temperature incubator at 37 °C with 5% CO2 and appropriate humidity for 24 h of culture. On the next day, according to the requirements of different treatment groups, the corresponding solutions were added, and the cells were continuously cultured for another 24 h. On the third day, the culture medium was discarded, and 100 μL of Hoechst 33342 dye was added to each well. The plate was incubated at 37 °C in the dark for 20 min, allowing the dye to penetrate the cell membrane and bind specifically to DNA. Subsequently, the staining solution was removed, and the cells were gently washed three times with PBS to remove the residual dye, after which fluorescence detection could be performed. When apoptosis occurred in the cells, under a fluorescence microscope, the nuclei of the apoptotic cells could be observed to exhibit dense staining, nuclear shrinkage, and fragmentation.
Western Blot
Approximately 50 mg of renal tissue or 5×10⁵ cells were taken from each sample and lysed using RIPA buffer containing 1 mM phenylmethylsulfonyl fluoride (PMSF). After lysis, the samples were centrifuged at 12,000 rpm at 4 °C, and then the total protein in the supernatant was collected. The collected total protein was quantified using the BCA method to ensure consistent loading in each lane. Subsequently, the protein samples were heat-denatured.
Subsequently, the heat - denatured total protein was electrophoretically separated through an 8–12% SDS-PAGE gel. After electrophoresis, the proteins on the gel were transferred to a polyvinylidene fluoride (PVDF) membrane. The target proteins and the internal control (β-actin) were electrophoresed on the same gel and transferred onto the same PVDF membrane. Before incubation with antibodies, the PVDF membrane needed to be blocked. The blocking condition was to use a 5% skim milk solution for 2 h. After blocking, the PVDF membrane was incubated with the primary antibody at 4 °C overnight, and then with the secondary antibody at room temperature for 1 h the next day. After incubation, the immunoblot bands were visualized using ECL reagent, and the results were quantitatively analyzed with the assistance of ImageJ software, with β-actin used as the normalization internal reference standard during the analysis.
qRT-PCR
Total RNA was extracted from cellular or tissue samples using Trizol reagent. Using 1 μg of the total RNA as a template, cDNA was synthesized with a reverse transcription kit on a reverse transcription PCR thermal cycler (Bio-Rad Laboratories, USA). Specific primers were designed by Sangon Biotech Co., Ltd. (Shanghai, China), and the detailed sequences are presented in Table 1. The qRT-PCR reactions were performed in a 20 μL reaction volume using SYBR Green Master Mix on a Real-Time PCR System (Thermo Fisher Scientific, USA) under the following conditions: initial predenaturation at 95 °C for 30 seconds, followed by 40 cycles of denaturation at 95 °C for 10 seconds and annealing/extension at 60 °C for 30 seconds. During the experiment, GAPDH was used as an endogenous reference gene, and the final results were analyzed using the 2−ΔΔCt method.
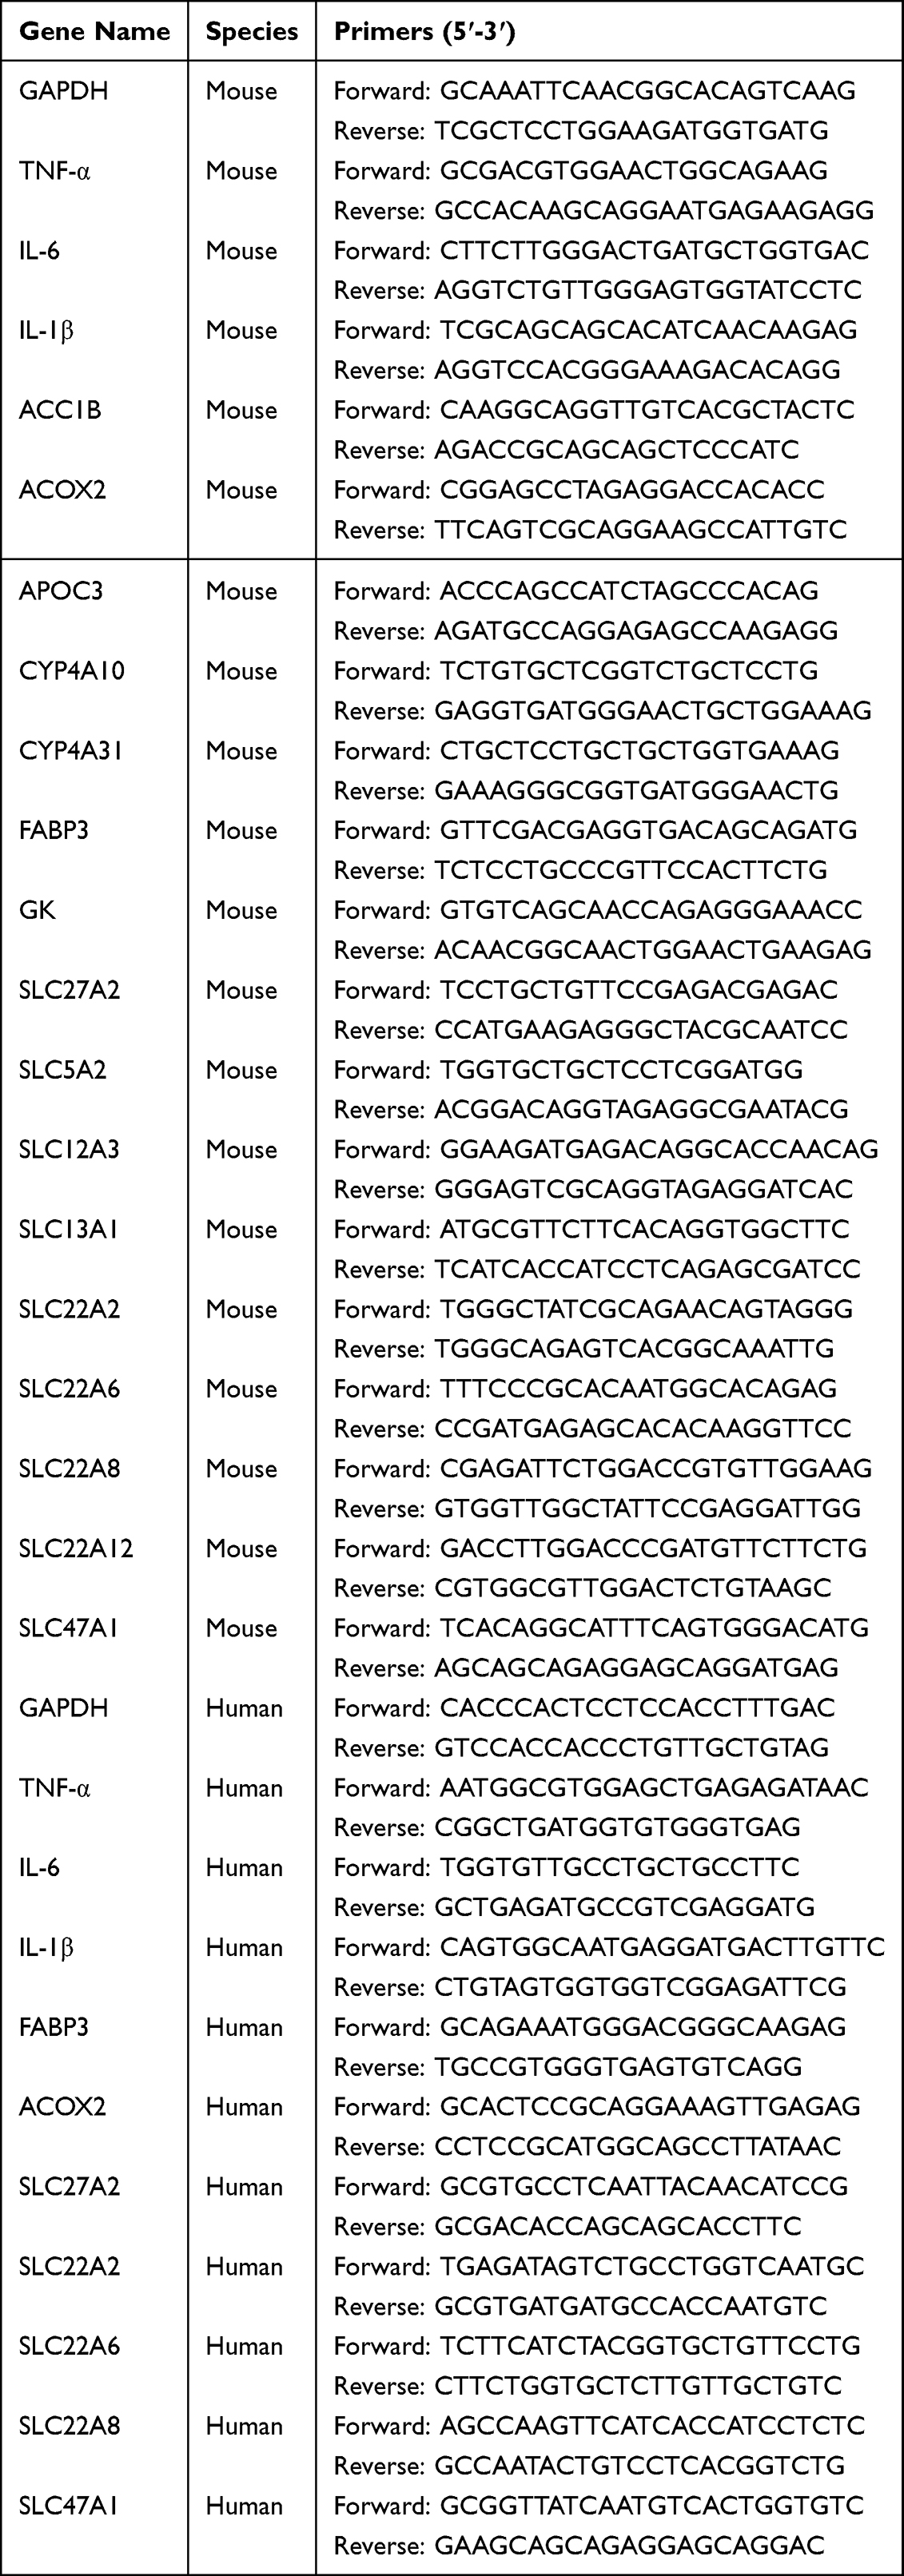 |
Table 1 Primers Sequence |
Statistical Analysis
Statistical analyses were performed using GraphPad Prism 9.0 software, with data presented as mean ± standard deviation (SD). The normality of data distribution was assessed by the Shapiro–Wilk test, and the homogeneity of variances was verified by the Brown-Forsythe test. For comparisons among multiple groups, one-way ANOVA was performed. For most in vivo and in vitro experiments, Dunnett’s post hoc test was used to compare all other experimental groups against the VCM model group. For specific in vitro analyses requiring all pairwise comparisons, Tukey’s post hoc test was applied. For comparisons between two groups, an unpaired Student’s t-test was used. The in vitro experiments and Western blot analyses, conducted with a limited number of biological replicates (n = 3), are acknowledged as exploratory; parametric tests were applied as the data met the assumptions of normality and equal variance. Exact P values are reported for all key comparisons in the figures and results. The threshold for statistical significance was set at P < 0.05.
 |
Figure 1 Renoprotective effect of ATO. (A) Morphological changes of the kidneys; (B) Statistical analysis of the ratio of wet kidney weight to body weight (mg/g); (C) Changes in plasma CR levels; (D) Changes in plasma BUN levels; (E) Representative images of hematoxylin and eosin (H&E) staining of kidney sections (original magnification ×400); (F) Score of kidney injury. The data are presented as mean ± SD, n = 6, analyzed by one-way ANOVA followed by Dunnett’s post hoc test. Compared with the CONTROL group, ***P < 0.001; compared with the VCM model group, ###P < 0.001. |
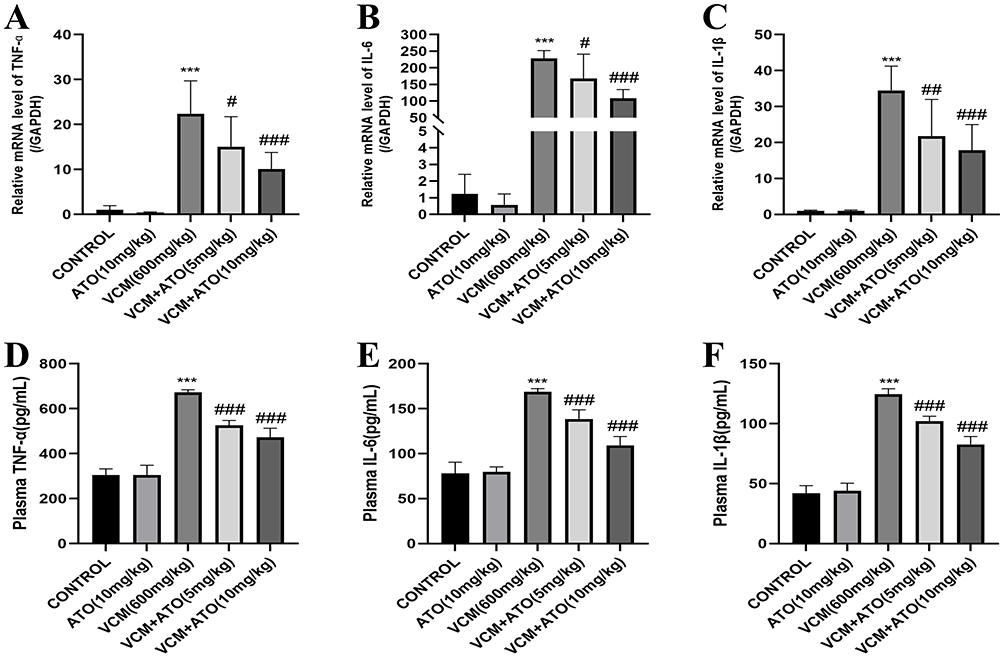 |
Figure 2 ATO attenuates VCM-induced renal inflammation in mice. (A-C) qRT-PCR and (D-F) ELISA analyses show that ATO reduces the mRNA and protein expression of inflammatory factors including TNF-α, IL-6, and IL-1β. The data are presented as mean ± SD, n = 6, analyzed by one-way ANOVA followed by Dunnett’s post hoc test. Compared with the CONTROL group, ***P < 0.001; compared with the VCM model group, #P < 0.05, ##P < 0.01, ###P < 0.001. For comparisons with the VCM model group: (A) VCM vs. VCM + ATO (5 mg/kg), P = 0.0437; VCM vs. VCM + ATO (10 mg/kg), P = 0.0006. (B) VCM vs. VCM + ATO (5 mg/kg), P = 0.0288; VCM vs. VCM + ATO (10 mg/kg), P < 0.0001. (C) VCM vs. VCM + ATO (5 mg/kg), P = 0.0068; VCM vs. VCM + ATO (10 mg/kg), P = 0.0005. (D-F) VCM vs. VCM + ATO (5 mg/kg), P < 0.0001; VCM vs. VCM + ATO (10 mg/kg), P < 0.0001. |
 |
Figure 3 ATO attenuates VCM-induced oxidative stress in the renal tissues of mice. (A-C) Levels of SOD, GSH, and CAT in renal tissues. The data are presented as mean ± SD, n = 6, analyzed by one-way ANOVA followed by Dunnett’s post hoc test. Compared with the CONTROL group, ***P < 0.001; compared with the VCM model group, #P < 0.05, ##P < 0.01, ###P < 0.001. For comparisons with the VCM model group: (A) VCM vs. VCM + ATO (5 mg/kg), ns, no significant difference; VCM vs. VCM + ATO (10 mg/kg), P = 0.0040. (B) VCM vs. VCM + ATO (5 mg/kg), P = 0.0278; VCM vs. VCM + ATO (10 mg/kg), P = 0.0002. (C) VCM vs. VCM + ATO (5 mg/kg), P = 0.0004; VCM vs. VCM + ATO (10 mg/kg), P < 0.0001. |
Results
ATO Attenuates VIN in C57 Mice
We evaluated the renoprotective effect of ATO against VIN. Firstly, we tested the acute toxicity of ATO in mice. Mice administered with ATO via gavage at a dose of 10 mg/kg/d alone for 10 days did not experience death or nephrotoxicity, indicating that ATO did not affect renal function. In the subsequent protective experiments, we observed the morphological changes of the kidneys in mice of each group, the ratio of kidney weight to body weight in mice, the levels of plasma CR and BUN, as well as the histopathological changes observed under the microscope. The experimental results are shown in Figure 1. Compared with the CONTROL group, the kidneys of mice in the VCM model group were significantly enlarged and showed a yellowish-white color (Figure 1A), and the ratio of kidney weight to body weight was significantly increased (Figure 1B). The levels of plasma CR (Figure 1C) and BUN (Figure 1D) were significantly elevated. However, after the co-administration of ATO, compared with the VCM model group, the kidneys appeared smaller in appearance, the color tended to be normal, the ratios of kidney weight to body weight gradually decreased, and the levels of plasma CR and BUN were significantly reduced. In the VCM model group, HE staining showed severe renal injury, manifested as extensive dilation, desquamation, vacuolization, necrosis, atrophy of the renal tubules, interstitial inflammatory cell infiltration, and edema. In contrast, compared with the VCM model group, the renal tissue injury in the ATO protection group was attenuated in a dose-dependent manner (Figure 1E and F).
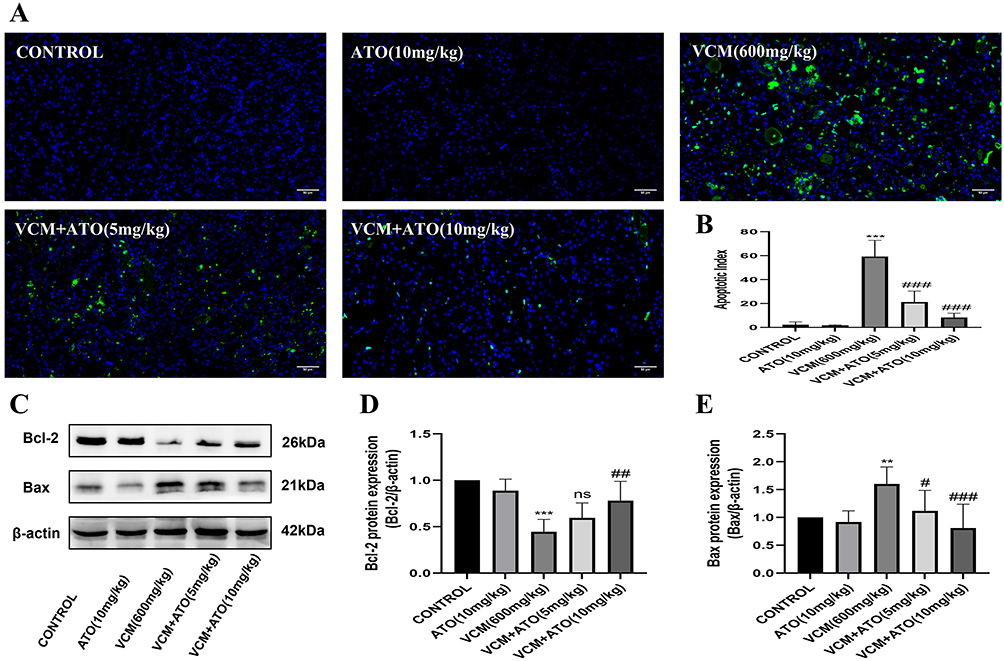 |
Figure 4 ATO attenuates VCM-induced renal cell apoptosis in mice. (A) Representative TUNEL staining images of renal tubular cells (original magnification ×400); (B) Quantification of TUNEL-positive cells; (C) Western blot analysis of Bcl-2 and Bax expression in renal tissues; (D) Quantification of Bcl-2 protein levels; (E) Quantification of Bax protein levels. The data are presented as mean ± SD, n = 6, analyzed by one-way ANOVA followed by Dunnett’s post hoc test. Compared with the CONTROL group, **P < 0.01, ***P < 0.001; compared with the VCM model group, #P < 0.05, ##P < 0.01, ###P < 0.001. For comparisons with the VCM model group: (B) VCM vs. VCM + ATO (5 mg/kg), P < 0.0001; VCM vs. VCM + ATO (10 mg/kg), P < 0.0001. (D) VCM vs. VCM + ATO (5 mg/kg), ns, no significant difference; VCM vs. VCM + ATO (10 mg/kg), P = 0.0016. (E) VCM vs. VCM + ATO (5 mg/kg), P = 0.0333; VCM vs. VCM + ATO (10 mg/kg), P = 0.0005. |
ATO Attenuates the Inflammatory Response Induced by VCM in C57 Mice
To investigate whether ATO could exert an anti-inflammatory effect to attenuate VIN, we detected the relevant inflammatory factors using qRT-PCR and ELISA experiments. The results confirmed that ATO could reduce the renal inflammatory response caused by VCM, decrease the expression levels of inflammatory factors such as TNF-α, IL-6, and IL-1β (Figure 2), and exert an anti-inflammatory effect, thus attenuating VIN.
 |
Figure 5 DEGs in renal tissues between the VCM and VCM + ATO (10 mg/kg) groups. (A) Volcano plot showing DEGs. Red dots: significantly upregulated genes; blue dots: significantly downregulated genes (|log2FC| ≥ 1, FDR < 0.05); gray dots: non-significant genes; (B) Heatmap of DEGs with hierarchical clustering. Red: high expression; blue: low expression. |
ATO Attenuates the Oxidative Stress Induced by VCM in C57 Mice
To investigate whether ATO could exert an antioxidant effect to attenuate VIN, we measured the levels of SOD, GSH, and CAT in renal tissues. Compared with the CONTROL group, the levels of SOD, GSH, and CAT in the renal tissues of the VCM model group were significantly decreased (Figure 3). However, after the co-administration of ATO, these levels increased in a dose-dependent manner. These results indicate that the level of oxidative stress in the renal tissues of mice was reduced, and ATO exerted an antioxidant effect, thereby attenuating VIN.
 |
Figure 6 KEGG enrichment analysis of DEGs. (A) Bar chart of KEGG enrichment; (B) Scatter plot of KEGG enrichment. The red arrows in (A) and (B) indicate the PPAR signaling pathway. |
ATO Attenuates Renal Apoptosis Induced by VCM in C57 Mice
To further elucidate whether the effect of ATO against VIN is related to its anti-apoptotic effect, we conducted a TUNEL staining experiment on renal tissues and detected the protein expression levels of the anti-apoptotic protein Bcl-2 and the apoptotic protein Bax in the apoptosis family proteins. Through the TUNEL staining experiment, we found that compared with the CONTROL group, cell apoptosis increased in the VCM model group, while it was significantly improved in the ATO protection group (Figure 4A and B). In addition, the results of Western blot showed that ATO could upregulate the protein expression of Bcl-2 and downregulate the protein expression of Bax in a dose-dependent manner (Figure 4C–E). The above results consistently indicate that ATO exerts an anti-apoptotic effect, thereby attenuating VIN.
 |
Figure 7 GO enrichment analysis of DEGs. (A) Bar chart of GO classification; (B) Scatter plot of GO enrichment. The red arrows in (A) and (B) indicate enriched terms related to transporter activity. |
Transcriptome Sequencing
DEGs
Total RNA was extracted from the renal tissues of mice in the VCM model group and the high-dose ATO protection group, with 6 mice in each group, and then RNA transcriptome analysis was performed. The screening criteria for DEGs were |log2Fold Change| ≥ 1 and FDR < 0.05. Compared with the VCM model group, 23,334 genes did not show significant changes, and the expression of 1,523 genes was significantly different. Among the significantly DEGs, 958 genes were upregulated and 565 genes were downregulated (Figure 5A). The DEGs were normalized using the Z-score method, and a clustering heatmap of the union of DEGs in all comparison groups and a clustering heatmap for each differentially expressed gene group were plotted, as shown in Figure 5B.
 |
Figure 8 Reactome enrichment analysis of DEGs. (A) Bar chart of Reactome enrichment; (B) Scatter plot of Reactome enrichment. The red arrow in (A) and (B) indicates SLC-mediated transmembrane transport. |
KEGG Enrichment Analysis of DEGs
KEGG systematically analyzes the functional roles of gene products in biological networks by integrating genomic, metabolic pathway, and molecular interaction data. We screened out 50 KEGG pathways with the lowest Q-values from the enrichment analysis results and plotted a bar chart of the enrichment terms based on this information (Figure 6A). Subsequently, we further selected 20 pathways with the most significant enrichment and plotted a scatter plot of the enrichment (Figure 6B). Through the analysis of the KEGG enrichment results, it can be inferred that the mechanism by which ATO attenuates VIN may be related to the PPAR signaling pathway.
 |
Figure 9 Validation of DEGs associated with the PPAR signaling pathway by qRT-PCR. (A-H) Validation of DEGs related to the PPAR signaling pathway, including CYP4A10, ACOX2, SLC27A2, FABP3, ACAA1B, APOC3, CYP4A31, and GK (panels A-H, respectively). The data are presented as mean ± SD, n = 6. Statistical analyses were performed using unpaired Student’s t-test for comparisons between the VCM model group and the VCM + ATO (10 mg/kg) group. In transcriptome sequencing, compared with the VCM model group, **P < 0.01, ***P < 0.001; in qRT-PCR, compared with the VCM model group, #P < 0.05, ##P < 0.01, ###P < 0.001. |
GO Enrichment Analysis of DEGs
GO is an internationally recognized standard for gene function classification, aiming to provide a unified description of the functions of genes and proteins across different species and is updated with the progress of research. GO is divided into three parts: biological process, cellular component, and molecular function. For the GO second-level classification of DEGs, they were sorted in descending order according to the number of genes, and the top 15 GO terms of the three major categories of biological process, cellular component, and molecular function were respectively displayed (if there were less than 15 terms, all of them were shown), and a GO classification bar chart was plotted (Figure 7A). As can be seen from the GO classification bar chart (Figure 7A), the DEGs were significantly enriched in the “Transporter Activity” pathway, indicating that these genes may affect the homeostasis of the intracellular and extracellular environment or physiological functions by regulating substance transport. In addition, from the GO enrichment scatter plot of DEGs (Figure 7B), it can be seen that the DEGs were significantly enriched in the transporter protein function network, covering their molecular activities such as active transmembrane transport activity, sodium symporter activity, secondary active transmembrane transport activity, transport processes such as anion transport, organic anion transport, and ion-specific transport functions, suggesting that the DEGs mediate transmembrane substance exchange by regulating transporters. As shown by the above results, the mechanism by which ATO attenuates VIN may be related to the regulation of transporter protein expression.
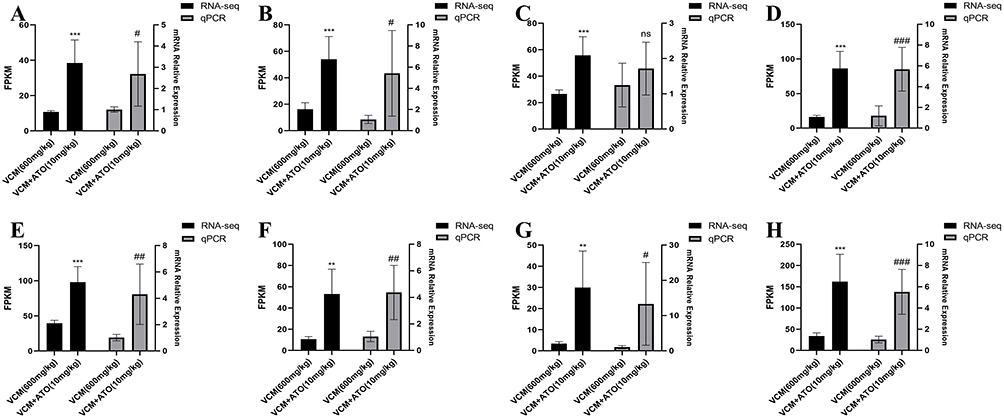 |
Figure 10 Validation of DEGs associated with SLC-mediated transmembrane transport by qRT-PCR. (A-H) Validation of DEGs related to SLC-mediated transmembrane transport, including SLC5A2, SLC12A3, SLC22A2, SLC13A1, SLC47A1, SLC22A6, SLC22A8, and SLC22A12 (panels A-H, respectively). The data are presented as mean ± SD, n = 6. Statistical analyses were performed using unpaired Student’s t-test for comparisons between the VCM model group and the VCM + ATO (10 mg/kg) group. In transcriptome sequencing, compared with the VCM model group, **P < 0.01, ***P < 0.001; in qRT-PCR, compared with the VCM model group, #P < 0.05, ##P < 0.01, ###P < 0.001. |
Reactome Enrichment Analysis of DEGs
The Reactome database aggregates various reactions and biological pathways of model species such as humans. The Reactome significance enrichment analysis takes specific entries in the Reactome database as units and applies the hypergeometric test to identify the entries that are significantly enriched in the DEGs compared to the entire genomic background.33 Twenty entries with the lowest Q-values in the enrichment analysis results were selected to plot a bar chart of the enrichment entries (Figure 8A) and a scatter plot of the enrichment (Figure 8B). The Reactome enrichment results further indicate that the mechanism by which ATO attenuates VIN is closely related to the transmembrane transport mediated by SLC transporters.
 |
Figure 11 Validation of DEGs related to the PPAR signaling pathway and SLC-mediated transmembrane transport by Western blot.Validation of DEGs related to the PPAR signaling pathway by Western blot. (A) Western blot analysis of FABP3, ACOX2, and FATP2 protein expression in renal tissues; (B) Western blot analysis of OAT1, OCT2, OAT3, and MATE1 protein expression in renal tissues. |
Validate the DEGs by qRT-PCR
To verify the reliability of the gene expression results obtained from the transcriptome data, 16 DEGs with large fold changes or high expression levels were selected from the DEGs for validation by qRT-PCR. These DEGs are mainly involved in the PPAR signaling pathway (Figure 9) and the transmembrane transport mediated by SLC transporters (Figure 10). As shown in Figures 9 and 10, the qRT-PCR results of the 16 DEGs were basically consistent with the results of the transcriptome analysis, indicating that the results of the transcriptome analysis are reliable.
Validate the DEGs by Western Blot
We further selected three DEGs from the PPAR signaling pathway (Figure 11A), namely the fatty acid binding protein 3 gene (FABP3), the acetyl-CoA oxidase 2 gene (ACOX2), and the fatty acid transport protein 2 gene (SLC27A2), with their corresponding proteins being FABP3, ACOX2, and FATP2, respectively. Meanwhile, we chose four DEGs related to the SLC transporter-mediated transmembrane transport (Figure 11B), which were the solute carrier family 22 member 6 gene (SLC22A6), the solute carrier family 22 member 2 gene (SLC22A2), the solute carrier family 22 member 8 gene (SLC22A8), and the solute carrier family 47 member 1 gene (SLC47A1), with their corresponding proteins being the organic anion transporter 1 (OAT1), the organic cation transporter 2 (OCT2), the organic anion transporter 3 (OAT3), and the multidrug and toxin extrusion protein 1 (MATE1) in sequence. We used Western blot experiments to validate these genes at the protein level.
 |
Figure 12 Effects of VCM and ATO on the viability of HK-2 cells. (A) Effects of different concentrations of VCM on HK-2 cell viability; (B) IC50 value of VCM in HK-2 cells; (C) ATO attenuates VCM (4 mM)-induced cytotoxicity and improves cell viability. The data are presented as mean ± SD, n = 3, analyzed by one-way ANOVA followed by Dunnett’s post hoc test. Compared with the CONTROL group, ***P < 0.001; compared with the VCM model group, #P < 0.05, ###P < 0.001. For comparisons with the VCM model group: (C) VCM vs. VCM + ATO (2 μM), P = 0.0294; VCM vs. VCM + ATO (10 μM), P = 0.0002. |
The results showed that the differential expression of the above-mentioned genes observed in the transcriptome analysis was consistent with the expression trends of their encoded proteins. This consistency verification not only supports the reliability of the transcriptome data but also provides molecular evidence at the protein level for deciphering the PPAR signaling regulatory network and the functional disorders of transmembrane transport mediated by SLC transporters (such as abnormal drug metabolism and toxin accumulation).
ATO Attenuates VIN in HK-2 Cells
In order to eliminate the influence of various interfering factors in living organisms, more accurately verify the protective effect of ATO against VIN, and deeply explore its potential mechanism of action, this study used the CCK-8 method to detect cytotoxicity and investigate the effect of ATO intervention on the viability of HK-2 cells. The experimental results showed that VCM at a concentration of 4 mM or higher could significantly exhibit cytotoxicity, leading to a large number of deaths of HK-2 cells and a significant decrease in cell viability (Figure 12A). The half maximal inhibitory concentration (IC50) value of VCM was 4.078 mM (Figure 12B). Therefore, we selected 4 mM VCM as the dose for establishing the cytotoxicity model. ATO concentrations were selected based on previous studies15,30–32 and preliminary experiments. ATO has relatively low toxic and side effects. ATO at a concentration of 10 μM is non-toxic and does not cause cell death. Moreover, ATO has a protective effect against the cytotoxicity induced by VCM (4 mM), which can increase the viability of HK-2 cells, and this protective effect is concentration-dependent (Figure 12C). Therefore, for the subsequent experiments, we selected two concentrations of ATO for the protective groups, namely low and high concentrations (2 μM and 10 μM).
 |
Figure 13 ATO attenuates VCM-induced inflammatory response in HK-2 cells. (A-C) qRT-PCR analysis shows that ATO reduces mRNA expression of the inflammatory factors TNF-α, IL-6, and IL-1β. The data are presented as mean ± SD, n = 3, analyzed by one-way ANOVA followed by Dunnett’s post hoc test. Compared with the CONTROL group, ***P < 0.001; compared with the VCM model group, ##P < 0.01, ###P < 0.001. For comparisons with the VCM model group: (A-B) VCM vs. VCM + ATO (2 μM), P < 0.0001; VCM vs. VCM + ATO (10 μM), P < 0.0001. (C) VCM vs. VCM + ATO (2 μM), P = 0.0015; VCM vs. VCM + ATO (10 μM), P < 0.0001. |
ATO Attenuates the Inflammatory Response Induced by VCM in HK-2 Cells
To further investigate whether the alleviation of VIN by ATO is related to its anti-inflammatory effect, we used qRT-PCR to detect the mRNA expression levels of relevant inflammatory factors in HK-2 cells. The results confirmed that ATO could attenuate the inflammatory response induced by VCM and reduce the expressions of inflammatory factors such as TNF-α (Figure 13A), IL-6 (Figure 13B), and IL-1β (Figure 13C). These findings indicate that ATO can also exert an anti-inflammatory effect during VCM-induced cytotoxicity, thereby attenuating the injury of HK-2 cells.
 |
Figure 14 ATO attenuates VCM-induced oxidative stress in HK-2 cells. (A) Representative fluorescent images of ROS detection in each group (original magnification ×200); (B) Quantitative analysis of intracellular ROS levels. The data are presented as mean ± SD, n = 3, analyzed by one-way ANOVA followed by Dunnett’s post hoc test. Compared with the CONTROL group, ***P < 0.001; compared with the VCM model group, #P < 0.05, ###P < 0.001. For comparisons with the VCM model group: (B) VCM vs. VCM + ATO (2 μM), P = 0.0185; VCM vs. VCM + ATO (10 μM), P < 0.0001. |
ATO Attenuates the Oxidative Stress Induced by VCM in HK-2 Cells
To further investigate whether the alleviation of VIN by ATO is related to its antioxidant effect, we measured the levels of ROS in HK-2 cells of each group. The experimental results showed that, compared with the CONTROL group, the level of ROS in the cells of the VCM model group increased significantly. However, after the administration of ATO, the intracellular ROS level decreased obviously. These results indicate that ATO can also exert an antioxidant effect during the cytotoxicity induced by VCM, thereby attenuating the injury of HK-2 cells (Figure 14).
 |
Figure 15 ATO attenuates VCM-induced apoptosis in HK-2 cells. (A) Representative images of HK-2 cell apoptosis detected by Hoechst 33342 staining (original magnification ×100); (B) Quantification of apoptotic cell percentage; (C) Western blot analysis of Bcl-2 and Bax protein expression in HK-2 cells; (D) Quantification of Bcl-2 protein levels; (E) Quantification of Bax protein levels. The data are presented as mean ± SD, n = 3, analyzed by one-way ANOVA followed by Dunnett’s post hoc test. Compared with the CONTROL group, ***P < 0.001; compared with the VCM model group, #P < 0.05, ##P < 0.01, ###P < 0.001. For comparisons with the VCM model group: (B) VCM vs. VCM + ATO (2 μM), P = 0.0002; VCM vs. VCM + ATO (10 μM), P < 0.0001. (D) VCM vs. VCM + ATO (2 μM), P = 0.0436; VCM vs. VCM + ATO (10 μM), P = 0.0023. (E) VCM vs. VCM + ATO (2 μM), P = 0.0334; VCM vs. VCM + ATO (10 μM), P = 0.0012. |
ATO Attenuates the Apoptosis Induced by VCM in HK-2 Cells
To further investigate whether the alleviation of VIN by ATO is related to its anti-apoptotic effect, we conducted a Hoechst 33342 nuclear staining experiment. The results showed that, compared with the CONTROL group, in the VCM model group, some nuclei in HK-2 cells exhibited shrinkage, nuclear condensation, and nuclear fragmentation, suggesting the occurrence of apoptosis. In contrast, the ATO protection group could significantly reduce apoptosis (Figures 15A and B). In addition, the Western blot results indicated that VCM downregulated the protein expression of Bcl-2 and upregulated the protein expression of Bax, while ATO could reverse these effects (Figures 15C–E). The above results consistently demonstrate that ATO can also exert an anti-apoptotic effect in VCM-induced cytotoxicity, attenuating the damage of HK-2 cells.
 |
Figure 16 Mechanistic study of the protective effects of ATO against VIN. (A) GW6471 (10 μM) reverses the cytoprotective effect of ATO against VCM-induced injury; (B) qRT-PCR analysis of PPARα pathway downstream target genes; (C) qRT-PCR analysis of SLC transporter genes. The data are presented as mean ± SD, n = 3. Statistical analyses were performed using Tukey’s post hoc test for all pairwise comparisons. Compared with the CONTROL group, ***P < 0.001; compared with the VCM model group, #P < 0.05, ##P < 0.01, ###P < 0.001; compared with the VCM + ATO (10 μM) group, &P < 0.05, &&P < 0.01, &&&P < 0.001. (A) CONTROL vs. VCM, P < 0.0001; VCM vs. VCM + ATO (10 μM), P = 0.0002; VCM + ATO (10 μM) vs. VCM + ATO (10 μM) + GW6471, P = 0.0032. (B-FABP3) VCM vs. VCM + ATO (10 μM), P = 0.0028; VCM + ATO (10 μM) vs. VCM + ATO (10 μM) + GW6471, P = 0.0002. (B-AOX2) VCM vs. VCM + ATO (10 μM), P = 0.0055; VCM + ATO (10 μM) vs. VCM + ATO (10 μM) + GW6471, P = 0.0153. (B-SLC27A2) VCM vs. VCM + ATO (10 μM), P = 0.0001; VCM + ATO (10 μM) vs. VCM + ATO (10 μM) + GW6471, P < 0.0001. (C-SLC22A6) VCM vs. VCM + ATO (10 μM), P = 0.0115; VCM + ATO (10 μM) vs. VCM + ATO (10 μM) + GW6471, P = 0.0084. (C-SLC22A2) VCM vs. VCM + ATO (10 μM), P < 0.0001; VCM + ATO (10 μM) vs. VCM + ATO (10 μM) + GW6471, P = 0.0001. (C-SLC22A8) VCM vs. VCM + ATO (10 μM), P = 0.0347; VCM + ATO (10 μM) vs. VCM + ATO (10 μM) + GW6471, P = 0.0148. (C-SLC47A1) VCM vs. VCM + ATO (10 μM), P = 0.0034; VCM + ATO (10 μM) vs. VCM + ATO (10 μM) + GW6471, P = 0.0009. |
Study on the Mechanism of ATO Against VIN
Based on the transcriptomic analysis results, to further explore whether the renoprotective mechanism of ATO against VIN is dependent on the PPARα signaling pathway and the subsequent modulation of SLC transporter expression, we co-administered the classical PPARα antagonist GW6471 with ATO to investigate the impact of PPARα functional inhibition on ATO’s renoprotective effects. Results demonstrated that in the ATO + GW6471 co-treatment group, compared with the high-dose ATO (10 μM) protection group, HK-2 cell viability was significantly reduced (Figure 16A), indicating that PPARα functional inhibition impairs ATO’s renoprotective effects. In the same co-treatment group, the mRNA levels of key downstream target genes of PPARα (FABP3, ACOX2, SLC27A2) were significantly lower than those in the high-dose ATO (10 μM) protection group (Figure 16B), confirming that GW6471 effectively abrogates ATO-mediated PPARα signaling activity. Furthermore, PPARα functional inhibition also led to a significant downregulation of the mRNA expression of key SLC transporter genes (SLC22A6, SLC22A2, SLC22A8, SLC47A1) (Figure 16C). Collectively, these results indicate that PPARα functional inhibition reverses ATO’s upregulatory effect on SLC transporter transcriptional expression, revealing that the PPARα/SLC transporters signaling axis is a critical mediator of ATO’s renoprotective effects in alleviating VIN.
Discussion
As the first-line therapeutic agent for drug-resistant Gram-positive bacterial infections including MRSA, VCM’s clinical utility is constrained by its dose-dependent nephrotoxicity. Recent guideline-recommended dose escalation strategies (eg., AUC/MIC-based regimens) to optimize antimicrobial efficacy have markedly increased the incidence of VIN, reaching up to 35%.1,34 This risk is exacerbated in patients with pre-existing renal impairment, advanced age, or concomitant use of nephrotoxic agents (eg., piperacillin-tazobactam), in whom combination therapies elevate nephrotoxicity risk by 5.36-fold.35 The pathogenesis of VIN involves multifactorial mechanisms: mitochondrial bioenergetic dysfunction, oxidative stress (eg., ROS overproduction), and inflammatory-apoptotic cascades (eg., TNF-α/IL-6 signaling activation, Bax/Bcl-2 imbalance).36 Although clinical interventions such as therapeutic drug monitoring (TDM) or continuous renal replacement therapy (CRRT) partially mitigate VIN, they are unable to molecularly disrupt the amplification of toxic signaling cascades.37 Consequently, developing novel multi-targeted protective strategies has become an urgent priority. Our team initially discovered16 that VIN significantly downregulates both gene expression and protein levels of renal transporters OAT1/3, OCT2, multidrug resistance-associated protein 2 (MRP2), and P-glycoprotein (P-gp), impairing the excretion of endogenous nephrotoxins and aggravating renal injury. This discovery expands the understanding of the mechanisms of VIN and suggests that modulating renal transporter activity to enhance toxin clearance may represent a novel protective approach. In parallel, our prior experimental work demonstrated17 that rhein can accelerate the excretion of toxins to attenuate acute kidney injury by regulating the nuclear factor E2-related factor 2 (Nrf2) signaling pathway and increasing the protein expression of renal uptake transporters OAT1/3, OCT2, and efflux transporters P-gp, MRP2, and MATE1 during VIN. At the same time, rhein can also exert anti-inflammatory and antioxidant effects and inhibit apoptosis. This multi-target renal protection gives us hope for solving VIN. However, rhein cannot be directly applied to clinical trials for the time being. To overcome this deficiency, a drug repositioning strategy can be used to find an already-marketed drug that can exert multi-targeted renal protection, overcoming the shortcomings of long research cycles for new drugs and their inability to be immediately put into clinical use.
As an HMG-CoA reductase inhibitor, ATO has been widely used in the treatment of cardiovascular diseases due to its classic lipid-lowering effect. However, recent studies have found that its pleiotropic effects show unique value in kidney diseases. Nevertheless, it is still unclear whether ATO can attenuate VIN. Given this knowledge gap and our need for a clinically translatable protective agent, we carried out this research project. Based on the experimental results of scholars28,29,38,39 and the conclusions of our own preliminary experiments, we finally determined the dosage of VCM for modeling as 600 mg/kg/d, the low protective dosage of ATO as 5 mg/kg/d, and the high protective dosage of ATO as 10 mg/kg/d. The administration method was oral gavage, and the administration lasted for 10 days. Starting from the 4th day, 0.5 h after oral gavage of ATO, normal saline or VCM was intraperitoneally injected, and the administration was continuous for 7 days. After the samples were collected on the 11th day, we observed the morphological changes of the kidneys of mice in each group, the ratio of kidney weight to body weight of mice, the levels of plasma CR and BUN, as well as the pathological and histological changes under the microscope. Compared with the CONTROL group, in the VCM model group, the kidneys of mice were significantly enlarged, showing a yellowish-white color (Figure 1A), and the ratio of kidney weight to body weight increased significantly (Figure 1B). The levels of plasma CR (Figure 1C) and BUN (Figure 1D) increased significantly. HE staining showed severe kidney damage, manifested as extensive dilation, desquamation, vacuolization, necrosis, atrophy of the renal tubules, interstitial inflammatory cell infiltration, and edema. The above results indicate that the VCM modeling in our study was successful. After the administration of ATO, compared with the VCM model group, in terms of appearance, the kidneys became smaller, the color tended to be normal, the ratio of kidney weight to body weight gradually decreased, and the levels of plasma CR and BUN decreased significantly. HE staining showed that the damage of renal tissues was attenuated (Figure 1E and F). The above results suggest that ATO can attenuate VIN in a dose-dependent manner.
To further demonstrate that ATO can effectively attenuate VIN, we conducted in vitro experiments and performed a CCK-8 cytotoxicity assay using HK-2 cells. The results of the cell experiments showed that VCM at a concentration of 4 mM could significantly exert cytotoxicity and induce cell death (Figures 12A and B). ATO has low toxic and side effects, and 10 μM of ATO is non-toxic and will not cause cell death. Moreover, ATO has a protective effect against the cytotoxicity induced by VCM (4 mM), which can increase the survival rate of HK-2 cells, and this protective effect is concentration-dependent (Figure 12C). Together with the in vivo findings, these in vitro results consistently confirm the renoprotective effect of ATO against VIN.
The renoprotective effects of ATO involve multiple aspects, including anti-inflammation, anti-oxidation, and anti-apoptosis. Specifically, ATO reduces the expression of pro-inflammatory cytokines (TNF-α, IL-6, and IL-1β) at both the mRNA and protein levels (Figures 2 and 13), enhances antioxidant capacity by increasing the activities of SOD, GSH, and CAT and reducing ROS production (Figures 3 and 14), and inhibits cell apoptosis through TUNEL staining, Hoechst 33342 nuclear staining, and regulation of Bax/Bcl-2 expression (Figures 4 and 15). These findings confirm that ATO exerts multi-faceted cytoprotective effects against VIN in both in vivo and in vitro models, mediated by its anti-inflammatory, anti-oxidative, and anti-apoptotic activities.
The processes of drug absorption, distribution, and excretion in the body all rely on the participation of transporters. Their main function is to expel toxins and related substrates within cells from the body, maintaining the stability of the body’s internal environment. Transporters have a direct impact on the in vivo disposition of drugs, as well as their ultimate therapeutic effects and toxic side effects. The kidney is a crucial pathway for drug excretion, and its excretion process includes glomerular filtration, tubular secretion, and tubular reabsorption. At the stages of tubular secretion and reabsorption, numerous transporters play an important role.40 Recent studies have shown that ATO can regulate the expression of renal transporters, thereby reducing kidney injury. In a relevant study, Pen. et al19 used rats with obesity-induced kidney injury as experimental subjects and observed a significant decrease in the expression of OAT3 in the renal tissues of the model rats. After intervention with ATO, the expression level of OAT3 in the renal tissues of the rats significantly increased, and the renal function was also significantly improved. Coincidentally, Jai.’s study18 also showed that for rats with gentamicin-induced nephrotoxicity, ATO could also upregulate the expression level of OAT3 in their renal tissues and effectively improve renal function. In this study, we found that the protein expressions of OAT1, OAT3, OCT2, and MATE1 were significantly decreased in the VCM model group, leading to the accumulation of endogenous toxins. However, ATO could upregulate the protein expressions of the above transporters, promote the excretion of endogenous toxins, and attenuate kidney injury (Figure 11B). Our discovery not only further enriches the research content related to ATO-mediated transporters but also provides a new idea for solving VIN.
Combining the results of KEGG (Figure 6), GO (Figure 7), and Reactome (Figure 8) enrichment analyses of the DEGs from the transcriptome sequencing, the DEGs between the VCM group and the VCM + ATO (10 mg/kg) group are mainly closely related to the PPAR signaling pathway and SLC transporters. PPAR is a type of nuclear receptor transcription factor and belongs to the nuclear hormone receptor superfamily. Upon ligand activation, it can regulate the expression of a variety of genes and is deeply involved in key physiological processes such as energy metabolism, inflammatory response, and cell differentiation. The PPAR family consists of three subtypes: PPARα, PPARβ/δ, and PPARγ. Among them, PPARα is highly expressed in tissues such as the liver, heart, kidney, and skeletal muscle, and plays an important role in the regulation of lipid metabolism, glucose metabolism, inflammatory response, and redox reactions.41,42 In previous studies, ATO has been shown to exert biological effects in a PPARα-associated manner, which further regulates downstream factors to exert lipid metabolism regulation, anti-inflammation, anti-oxidation, and anti-apoptosis effects. Both the experiments and computational analyses by Bas et al20 have shown that the expression of PPARα is decreased in experimental colitis, and ATO can reverse this phenomenon, with the beneficial effect of ATO in colitis being dependent on PPARα. Xiang et al21 observed through in vivo and in vitro experiments that in the type 1 diabetes model, the expression of PPARα was downregulated, and this phenomenon was reversed after treatment with ATO. In addition, a large number of studies have shown that PPARα plays a crucial regulatory role in the expression of a variety of transporters, including the novel organic cation transporters 2/3 (OCTN2/3),23,24,27 organic cation transporter 1 (OCT1),25 OCT2, and MATE1,22,26 etc. PPARα binds to specific sequences in the promoter regions of these transporter genes, regulating their transcription and expression levels, and thus influencing the processes of substance transportation, distribution, and metabolism in the body. Based on the transcriptome sequencing analysis of mouse renal tissues (Figures 6–8) and the subsequent verification of cellular mechanism experiments (Figure 16), this study for the first time reveals a new mechanism by which ATO attenuates VIN. Specifically, ATO exerts its renoprotective effect via a PPARα-associated mechanism, as evidenced by the abrogation of ATO’s renoprotective benefits by the PPARα antagonist GW6471, and this mechanism orchestrates the upregulation of SLC transporters (SLC22A6/OAT1, SLC22A2/OCT2, SLC22A8/OAT3, SLC47A1/MATE1) to promote endogenous toxin excretion, thereby effectively alleviating VIN. This central PPARα-associated mechanism is also accompanied by a significant amelioration of inflammation, oxidative stress, and apoptosis.
Notably, although our previous study based on the rhein/Nrf2 pathway17 has preliminarily verified the feasibility of multi-target intervention in VIN, the present study is not a simple replacement of the protective agent and signaling pathway, but represents a critical breakthrough in terms of both translational strategy and mechanistic depth. First, ATO possesses unique advantages in clinical translation. As an HMG-CoA reductase inhibitor widely used in clinical practice, with well-defined pharmacokinetic characteristics, fully validated safety and high clinical accessibility, ATO can be directly applied for drug repurposing. Its clinical translational feasibility is far higher than that of rhein—a natural product still in the preclinical stage and unavailable for clinical trials—thus effectively circumventing the key bottlenecks of long cycles and high costs in new drug development. Second, there are striking differences in their protective mechanisms: Nrf2 functions primarily as a core regulator of the antioxidant stress response;43 whereas PPARα is a nuclear transcription factor governing lipid metabolism, energy homeostasis and the renal transporter network.44,45 It is widely involved in multiple renal pathological processes including inflammation and oxidative stress, thereby exerting multi-dimensional and systematic pleiotropic protective effects. Collectively, the findings of the present study based on the ATO/PPARα pathway represent an expansion and deepening of our previous work on the rhein/Nrf2 pathway, rather than a simple repetition.
Regarding clinical translation, potential drug-drug interactions (DDIs) between ATO and VCM should be considered. VCM is predominantly eliminated by glomerular filtration, with 80–90% excreted unchanged via the kidneys.46 And there is no direct evidence that VCM is a substrate for renal transporters such as OCTs or OATs. The secretion process in renal tubular epithelial cells mediated by renal transporters has a minor effect on the renal excretion of VCM. Therefore, the regulation of these renal transporters by ATO does not directly affect the renal excretion of vancomycin. However, this mechanism promotes the clearance of endogenous toxins, thereby alleviating VIN. The renoprotective effect of ATO may improve glomerular filtration function, thereby indirectly promoting the elimination of VCM. On the other hand, ATO is mainly metabolized by CYP3A4 and eliminated via biliary excretion, with less than 2% excreted in urine.47 Furthermore, no significant pharmacokinetic interactions between ATO and VCM were identified using the Drug Interaction Checker tool on Medscape (https://reference.medscape.com/drug-interactionchecker). Collectively, these observations suggest that no obvious pharmacokinetic interaction is anticipated between ATO and VCM. Nevertheless, in clinical practice, therapeutic drug monitoring (TDM) of VCM is recommended to adjust doses in a timely manner when co-administered with ATO, ensuring both antimicrobial efficacy and renal safety.
By adopting the strategy of repurposing an approved clinical drug and targeting a novel core metabolic regulatory pathway, this study provides a more reliable and translationally valuable approach for the prevention and treatment of VIN.
Limitations and Future Perspectives
Notably, this study has two key limitations that need to be acknowledged. First, the conclusion that ATO exerts effects via a PPARα-associated mechanism is based on indirect evidence including downstream target gene upregulation and PPARα inhibitor assays, and direct molecular evidence for PPARα activation (eg., reporter gene assay, nuclear translocation analysis, direct binding assay, or PPARα knockdown/knockout) is lacking in the present study. Second, this study only verified the upregulation of SLC transporter gene expression at the mRNA and protein levels, and functional data confirming that the increased SLC transporter expression is associated with enhanced cellular transport activity is still lacking. The above limitations provide clear directions for our future investigations. In subsequent studies, we will address the shortcomings of existing research to further improve the scientific rigor of our work.
Conclusion
In conclusion, ATO attenuates VIN via a PPARα-associated signaling pathway that orchestrates the upregulation of SLC transporters to promote the excretion of endogenous toxins, and this core renoprotective mechanism is accompanied by significant anti-inflammatory, antioxidant, and anti-apoptotic effects (Figure 17). These findings provide a preclinical basis for further investigation of ATO as a potential adjunctive strategy against VIN.
 |
Figure 17 Mechanistic diagram of the protective effect of ATO against VIN. Schematic illustration showing that ATO attenuates VIN via a PPARα-dependent signaling pathway that orchestrates the upregulation of SLC transporters to promote the excretion of endogenous toxins, and this core renoprotective mechanism is accompanied by significant anti-inflammatory, antioxidant, and anti-apoptotic effects. Upward arrows (↑) indicate increased expression, activity, or excretion; downward arrows (↓) indicate decreased levels or activity. |
Abbreviations
VCM, Vancomycin; ATO, Atorvastatin; PPARα, Peroxisome Proliferator-Activated Receptor Alpha; SLC, Solute Carrier; ABC, ATP-Binding Cassette; MRSA, Methicillin-Resistant Staphylococcus Aureus; VIN, Vancomycin-Induced Nephrotoxicity; HMG-CoA, 3-Hydroxy-3-Methylglutaryl Coenzyme A; Bcl-2, B-cell lymphoma 2; Bax, Bcl-2 Associated X protein; OATs, Organic Anion Transporters; OCTs, Organic Cation Transporters; MATE, Multidrug and Toxin Extrusion Transporter; MRP2, Multidrug Resistance-Associated Protein 2; P-gp, P-glycoprotein; FABP3, Fatty Acid Binding Protein 3; FATP2, Fatty Acid Transport Protein 2; ACOX2, Acyl Coenzyme A Oxidase 2; HK-2, Human renal tubular epithelial cells; CR, Creatinine; BUN, Blood Urea Nitrogen; ROS, Reactive Oxygen Species; HE, Hematoxylin and Eosin; SOD, Superoxide Dismutase; GSH, Glutathione; CAT, Catalase; ELISA, Enzyme-Linked Immunosorbent Assay; TUNEL, Terminal-deoxynucleotidyl Transferase Mediated Nick End Labeling; TNF-α, Tumor Necrosis Factor - alpha; IL-6, Interleukin - 6; IL-1β, Interleukin - 1 beta; RNA-seq, RNA Sequencing; DEGs, Differentially Expressed Genes; GO, Gene Ontology; KEGG, Kyoto Encyclopedia of Genes and Genomes.
Data Sharing Statement
All data included in this study are available upon request by contact with the corresponding author Yanna Zhu.
Ethics Approval
The animal experiment of this project was approved by the Animal Ethics Committee of Dalian Medical University, the animal ethics number was AEE24267, and followed national guidelines for animal care and use.
Author Contributions
All authors made a significant contribution to the work reported, whether that is in the conception, study design, execution, acquisition of data, analysis and interpretation, or in all these areas; took part in drafting, revising or critically reviewing the article; gave final approval of the version to be published; have agreed on the journal to which the article has been submitted; and agree to be accountable for all aspects of the work.
Funding
This work was supported by the National Natural Science Foundation of China (Grant No. 82003837), the Liaoning Provincial Science and Technology Plan Joint Plan (Natural Science Foundation-General Program, Grant No. 2025-MSLH-204), and China International Medical Exchange Foundation - Medical Clinical and Outcomes Translation Fund - Clinical Pharmacy Development Research Fund (Grant No. Z-2014-08-2309-10).
Disclosure
The author(s) report no conflicts of interest in this work.
References
1. Appel GB, Given DB, Levine LR, Cooper GL. Vancomycin, the kidney. Am J Kidney Dis. 1986;8f:75–23.
2. Filippone EJ, Kraft WK, Farber JL. The nephrotoxicity of vancomycin. Clin Pharmacol Ther. 2017;102:459–469. doi:10.1002/cpt.726
3. Wilhelm MP. Vancomycin. Mayo Clin Proc. 1991;66:1165–1170.
4. Levy JH, Marty AT. Vancomycin and adverse drug reactions. Crit Care Med. 1993;21:1107–1108.
5. Rybak MJ. The pharmacokinetic and pharmacodynamic properties of vancomycin. Clin Infect Dis. 2006;42:S35–S39.
6. Stevens DL. The role of vancomycin in the treatment paradigm. Clin Infect Dis. 2006;42:S51–S57.
7. Arimura Y, Yano T, Hirano M, Sakamoto Y, Egashira N, Oishi R. Mitochondrial superoxide production contributes to vancomycin-induced renal tubular cell apoptosis. Free Radic Biol Med. 2012;52:1865–1873. doi:10.1016/j.freeradbiomed.2012.02.038
8. Pais GM, Liu J, Zepcan S, et al. Vancomycin-Induced kidney injury: animal models of toxicodynamics, mechanisms of injury, human translation, and potential strategies for prevention. Pharmacotherapy. 2020;40:438–454. doi:10.1002/phar.2388
9. Uckun Z, Guzel S, Canacankatan N, Yalaza C, Kibar D, Coskun Yilmaz B. Potential protective effects of naringenin against vancomycin-induced nephrotoxicity via reduction on apoptotic and oxidative stress markers in rats. Drug Chem Toxicol. 2020;43:104–111. doi:10.1080/01480545.2018.1512612
10. Qu S, Dai C, Lang F, et al. Rutin attenuates vancomycin-induced nephrotoxicity by ameliorating oxidative stress, apoptosis, and inflammation in rats. Antimicrob Agents Chemother. 2019;63. doi:10.1128/AAC.01545-18
11. Balkrishna A, Sharma S, Gohel V, et al. Renogrit attenuates Vancomycin-induced nephrotoxicity in human renal spheroids and in Sprague-Dawley rats by regulating kidney injury biomarkers and creatinine/urea clearance. PLoS One. 2023;18:e0293605. doi:10.1371/journal.pone.0293605
12. Allison SJ. Acute kidney injury: atorvastatin may reduce risk of contrast-induced AKI. Nat Rev Nephrol. 2013;9:66. doi:10.1038/nrneph.2012.277
13. De Zeeuw D, Anzalone DA, Cain VA, et al. Renal effects of atorvastatin and rosuvastatin in patients with diabetes who have progressive renal disease (PLANET I): a randomised clinical trial. Lancet Diabetes Endocrinol. 2015;3:181–190. doi:10.1016/S2213-8587(14)70246-3
14. El-Moselhy MA, El-Sheikh AAK. Protective mechanisms of atorvastatin against doxorubicin-induced hepato-renal toxicity. Biomed Pharmacother. 2014;68:101–110. doi:10.1016/j.biopha.2013.09.001
15. Zhang Y, Qu Y, Cai R, et al. Atorvastatin ameliorates diabetic nephropathy through inhibiting oxidative stress and ferroptosis signaling. Eur J Pharmacol. 2024;976:176699. doi:10.1016/j.ejphar.2024.176699
16. Wen S, Wang C, Huo X, et al. JBP485 attenuates vancomycin-induced nephrotoxicity by regulating the expressions of organic anion transporter (Oat) 1, Oat3, organic cation transporter 2 (Oct2), multidrug resistance-associated protein 2 (Mrp2) and P-glycoprotein (P-gp) in rats. Toxicol Lett. 2018;295:195–204. doi:10.1016/j.toxlet.2018.06.1220
17. Zhu Y, Jin H, Huo X, et al. Protective effect of Rhein against vancomycin-induced nephrotoxicity through regulating renal transporters and Nrf2 pathway. Phytother Res. 2022;36:4244–4262. doi:10.1002/ptr.7559
18. Jaikumkao K, Pongchaidecha A, Chattipakorn N, et al. Atorvastatin improves renal organic anion transporter 3 and renal function in gentamicin-induced nephrotoxicity in rats. Exp Physiol. 2016;101:743–753. doi:10.1113/EP085571
19. Pengrattanachot N, Cherngwelling R, Jaikumkao K, et al. Atorvastatin attenuates obese-induced kidney injury and impaired renal organic anion transporter 3 function through inhibition of oxidative stress and inflammation. Biochim Biophys Acta Mol Basis Dis. 2020;1866:165741. doi:10.1016/j.bbadis.2020.165741
20. Basso PJ, Sales-Campos H, Nardini V, et al. Peroxisome proliferator-activated receptor alpha mediates the beneficial effects of atorvastatin in experimental colitis. Front Immunol. 2021;12:618365. doi:10.3389/fimmu.2021.618365
21. Xiang J, Zhang H, Zhou X, et al. Atorvastatin restores PPARα inhibition of lipid metabolism disorders by downregulating miR-21 expression to improve mitochondrial function and alleviate diabetic nephropathy progression. Front Pharmacol. 2022;13:819787. doi:10.3389/fphar.2022.819787
22. Arruda AC, Perilhão MS, Santos WA, et al. PPARα-Dependent modulation by metformin of the expression of OCT-2 and MATE-1 in the kidney of mice. Molecules. 2020;25. doi:10.3390/molecules25020392
23. Eder K, Ringseis R. The role of peroxisome proliferator-activated receptor alpha in transcriptional regulation of novel organic cation transporters. Eur J Pharmacol. 2010;628:1–5. doi:10.1016/j.ejphar.2009.11.042
24. Koch A, König B, Stangl GI, Eder K. PPAR alpha mediates transcriptional upregulation of novel organic cation transporters-2 and −3 and enzymes involved in hepatic carnitine synthesis. Exp Biol Med. 2008;233:356–365. doi:10.3181/0706-RM-168
25. Nie W, Sweetser S, Rinella M, Green RM. Transcriptional regulation of murine Slc22a1 (Oct1) by peroxisome proliferator agonist receptor-alpha and -gamma. Am J Physiol Gastrointest Liver Physiol. 2005;288:G207–G212.
26. Oda M, Koyanagi S, Tsurudome Y, Kanemitsu T, Matsunaga N, Ohdo S. Renal circadian clock regulates the dosing-time dependency of cisplatin-induced nephrotoxicity in mice. Mol Pharmacol. 2014;85:715–722. doi:10.1124/mol.113.089805
27. Ringseis R, Pösel S, Hirche F, Eder K. Treatment with pharmacological peroxisome proliferator-activated receptor alpha agonist clofibrate causes upregulation of organic cation transporter 2 in liver and small intestine of rats. Pharmacol Res. 2007;56:175–183.
28. Wang M, Zhou Y, Hao G, et al. Recombinant klotho alleviates vancomycin-induced acute kidney injury by upregulating anti-oxidative capacity via JAK2/STAT3/GPx3 axis. Toxicology. 2023;499:153657. doi:10.1016/j.tox.2023.153657
29. Yin X, Gao Q, Li C, Yang Q, HongliangDong ZL. Leonurine alleviates vancomycin nephrotoxicity via activating PPARγ and inhibiting the TLR4/NF-κB/TNF-α pathway. Int Immunopharmacol. 2024;131:111898. doi:10.1016/j.intimp.2024.111898
30. Liu G-L, Lei R, Duan S-B, Tang -M-M, Luo M, Xu Q. Atorvastatin alleviates iodinated contrast media-induced cytotoxicity in human proximal renal tubular epithelial cells. Exp Ther Med. 2017;14:3309–3313. doi:10.3892/etm.2017.4859
31. Sun Y, Liu Y, Guan X, et al. Atorvastatin inhibits renal inflammatory response induced by calcium oxalate crystals via inhibiting the activation of TLR4/NF-κB and NLRP3 inflammasome. IUBMB Life. 2020;72:1065–1074. doi:10.1002/iub.2250
32. Yang J, Zhou R, Zhou M, Li X. Atorvastatin inhibits ischemia‒reperfusion-associated renal tubular cell ferroptosis by blocking the PGE2/EP4 signaling pathway. Vitro Cell Dev Biol Anim. 2025;61:275–287. doi:10.1007/s11626-025-01020-7
33. Gillespie M, Jassal B, Stephan R, et al. The reactome pathway knowledgebase 2022. Nucleic Acids Res. 2022;50:D687–D692. doi:10.1093/nar/gkab1028
34. McClure S, McElroy L, Gugkaeva Z. Implementation of vancomycin AUC/MIC dosing vs traditional trough dosing and incidence of acute kidney injury at a rural community hospital. Am J Health Syst Pharm. 2024;81:e283–e288. doi:10.1093/ajhp/zxae014
35. Luther MK, Timbrook TT, Caffrey AR, Dosa D, Lodise TP, LaPlante KL. Vancomycin plus piperacillin-tazobactam and acute kidney injury in adults: a systematic review and meta-analysis. Crit Care Med. 2018;46:12–20. doi:10.1097/CCM.0000000000002769
36. Kan W-C, Chen Y-C, Wu V-C, Shiao -C-C. Vancomycin-Associated acute kidney injury: a narrative review from pathophysiology to clinical application. Int J Mol Sci. 2022;23. doi:10.3390/ijms23042052
37. van Hal SJ, Paterson DL, Lodise TP. Systematic review and meta-analysis of vancomycin-induced nephrotoxicity associated with dosing schedules that maintain troughs between 15 and 20 milligrams per liter. Antimicrob Agents Chemother. 2013;57:734–744. doi:10.1128/AAC.01568-12
38. Bruder-Nascimento T, Callera GE, Montezano AC, et al. Vascular injury in diabetic db/db mice is ameliorated by atorvastatin: role of Rac1/2-sensitive nox-dependent pathways. Clin Sci. 2015;128:411–423. doi:10.1042/CS20140456
39. Zahr RS, Chappa P, Yin H, Brown LA, Ataga KI, Archer DR. Renal protection by atorvastatin in a murine model of sickle cell nephropathy. Br J Haematol. 2018;181:111–121. doi:10.1111/bjh.15157
40. Ivanyuk A, Livio F, Biollaz J, Buclin T. Renal drug transporters and drug interactions. Clin Pharmacokinet. 2017;56:825–892. doi:10.1007/s40262-017-0506-8
41. Cheng HS, Tan WR, Low ZS, Marvalim C, Lee JYH, Tan NS. Exploration and development of PPAR modulators in health and disease: an update of clinical evidence. Int J Mol Sci. 2019;20. doi:10.3390/ijms20205055
42. Mirza AZ, Althagafi II, Shamshad H. Role of PPAR receptor in different diseases and their ligands: physiological importance and clinical implications. Eur J Med Chem. 2019;166:502–513. doi:10.1016/j.ejmech.2019.01.067
43. Bellezza I, Giambanco I, Minelli A, Donato R. Nrf2-Keap1 signaling in oxidative and reductive stress. Biochim Biophys Acta Mol Cell Res. 2018;1865:721–733. doi:10.1016/j.bbamcr.2018.02.010
44. Gao J, Gu Z. The role of peroxisome proliferator-activated receptors in kidney diseases. Front Pharmacol. 2022;13:832732. doi:10.3389/fphar.2022.832732
45. Lefebvre P, Chinetti G, Fruchart J-C, Staels B. Sorting out the roles of PPAR alpha in energy metabolism and vascular homeostasis. J Clin Invest. 2006;116:571–580.
46. Zaric RZ, Milovanovic J, Rosic N, et al. Pharmacokinetics of vancomycin in patients with different renal function levels. Open Med. 2018;13:512–519. doi:10.1515/med-2018-0068
47. Bellosta S, Corsini A. Statin drug interactions and related adverse reactions: an update. Expert Opin Drug Saf. 2017;17:25–37. doi:10.1080/14740338.2018.1394455
 © 2026 The Author(s). This work is published and licensed by Dove Medical Press Limited. The
full terms of this license are available at https://www.dovepress.com/terms
and incorporate the Creative Commons Attribution
- Non Commercial (unported, 4.0) License.
By accessing the work you hereby accept the Terms. Non-commercial uses of the work are permitted
without any further permission from Dove Medical Press Limited, provided the work is properly
attributed. For permission for commercial use of this work, please see paragraphs 4.2 and 5 of our Terms.
© 2026 The Author(s). This work is published and licensed by Dove Medical Press Limited. The
full terms of this license are available at https://www.dovepress.com/terms
and incorporate the Creative Commons Attribution
- Non Commercial (unported, 4.0) License.
By accessing the work you hereby accept the Terms. Non-commercial uses of the work are permitted
without any further permission from Dove Medical Press Limited, provided the work is properly
attributed. For permission for commercial use of this work, please see paragraphs 4.2 and 5 of our Terms.
Recommended articles
Vancomycin Loading Doses and Nephrotoxicity on Medicine Teaching Services
Wagner P, Arnold J, Sheridan K
International Journal of General Medicine 2022, 15:7685-7692
Published Date: 6 October 2022