")
Back to Journals » Diabetes, Metabolic Syndrome and Obesity » Volume 17
Associations of Serum Uric Acid to High-Density Lipoprotein Cholesterol Ratio with Trunk Fat Mass and Visceral Fat Accumulation
Authors Wang Y, Xu Y, Hu T, Xiao Y, Wang Y, Ma X, Yu H, Bao Y
Received 11 October 2023
Accepted for publication 28 December 2023
Published 9 January 2024 Volume 2024:17 Pages 121—129
DOI https://doi.org/10.2147/DMSO.S444142
Checked for plagiarism Yes
Review by Single anonymous peer review
Peer reviewer comments 3
Editor who approved publication: Dr Konstantinos Tziomalos
Yansu Wang,1,* Yiting Xu,1,* Tingting Hu,1 Yunfeng Xiao,2 Yufei Wang,1 Xiaojing Ma,1 Haoyong Yu,1 Yuqian Bao1
1Department of Endocrinology and Metabolism, Shanghai Sixth People’s Hospital Affiliated to Shanghai Jiao Tong University School of Medicine, Shanghai Clinical Center for Diabetes, Shanghai Diabetes Institute, Shanghai Key Laboratory of Diabetes Mellitus, Shanghai, People’s Republic of China; 2Department of Radiology, Shanghai Sixth People’s Hospital Affiliated to Shanghai Jiao Tong University School of Medicine, Shanghai, People’s Republic of China
*These authors contributed equally to this work
Correspondence: Yuqian Bao, Department of Endocrinology and Metabolism, Shanghai Sixth People’s Hospital Affiliated to Shanghai Jiao Tong University School of Medicine, 600 Yishan Road, Shanghai, 200233, People’s Republic of China, Tel +86-21-64369181, Fax +86-21-64368031, Email [email protected]
Background: It has been reported recently that the ratio of uric acid to high-density lipoprotein cholesterol (UHR) is correlated with several metabolic disorders. The present study aimed to investigate the associations of UHR with body fat content and distribution.
Methods: This study enrolled 300 participants (58 men and 242 women) aged 18 to 65 years. The levels of serum uric acid and high-density lipoprotein cholesterol were measured by standard enzymatic methods. The overall fat content and segmental fat distribution were assessed with an automatic bioelectrical impedance analyzer. In the population with obesity, the visceral fat area (VFA) and subcutaneous fat area (SFA) were measured using magnetic resonance imaging.
Results: Among the study population, 219 individuals (73.0%) were with obesity. The median level of UHR in individuals with obesity was 33.7% (26.2% - 45.9%), which was significantly higher than that in those without obesity [22.6% (17.0% - 34.4%), P < 0.01]. UHR was positively associated with overall fat content and segmental fat distribution parameters (all P < 0.01). In multivariate linear regression analysis, compared with body mass index, waist circumference was more closely associated with UHR (standardized β = 0.427, P < 0.001) after adjusting for confounding factors. Additionally, total fat mass (standardized β = 0.225, P = 0.002) and trunk fat mass (standardized β = 0.296, P = 0.036) were more closely linked to UHR than total fat-free mass and leg fat mass, respectively. In the population with obesity, VFA was independently correlated with UHR (P < 0.01), while SFA was not associated with UHR.
Conclusion: UHR was significantly associated with overall fat content and trunk fat accumulation. In the population with obesity, UHR was positively associated with VFA. Attention should be paid to the role of excessive trunk fat mass in the relationship between UHR and metabolic disorders.
Keywords: fat distribution, the UHR index, trunk fat mass, visceral fat area
Introduction
Obesity is currently recognized as one of the major public health issues in the world, which has a great impact on human health and imposes a substantial cost on social and economic development. Accumulating evidence has established close relationships between obesity and a variety of metabolic disorders and cardiovascular diseases. According to the most recent epidemiologic data, the overweight and obesity rates in the Chinese adult population were 34.3% and 16.4%, respectively.1 Therefore, it is crucial to strengthen the control of obesity and its associated comorbidities.
Elevated uric acid (UA) levels and decreased high-density lipoprotein cholesterol (HDL-c) levels are two common metabolic abnormalities associated with obesity. UA is a weak organic acid generated from xanthine by xanthine-oxidase. It is the ultimate breakdown product of purine nucleotides in circulation. UA is generated mainly in the liver and small intestine and eliminated by the kidney and intestine. When the body’s purine metabolism is disrupted, or UA excretion is irregular, serum UA levels are increased. Gout can occur if the quantity of UA in the bloodstream surpasses its saturation point.2 Numerous studies provide evidence that hyperuricemia and gout are independent risk factors for several disorders, including chronic renal disease, hypertension, type 2 diabetes, and cardiovascular diseases.3,4 In recent years, some clinical studies have demonstrated an association between increased serum UA levels and aberrant body fat distribution, especially abdominal fat accumulation.5,6 HDL-c is an essential serum lipoprotein that transports cholesterol from peripheral tissues to the liver for degradation, minimizing its buildup in peripheral vascular walls.7 HDL-c is considered a health-beneficial cholesterol and a potential protective factor against atherosclerosis.8 A low level of HDL-c is one of the components of metabolic syndrome. Previous clinical research has demonstrated that intra-abdominal fat deposition was significantly associated with serum HDL-c levels.9 Notably, the combination of serum UA and HDL-c levels, known as UA/HDL-c (UHR), has been demonstrated to be linked to metabolic disorders. UHR was first proposed by Kocak et al10 in 2018 as an effective and reliable indicator for predicting metabolic syndrome in individuals with type 2 diabetes. Similarly, another research involving 817 participants discovered that UHR was an independent risk factor for metabolic syndrome after adjusting for several confounders.11
The connections between UHR and metabolic and cardiovascular diseases have attracted significant attention recently. Population-based studies have reported positive associations between UHR levels and major adverse cardiovascular events, diabetic kidney disease, acute myocardial infarction, and non-alcoholic fatty liver disease.12–15 Patients with metabolic disorders are often accompanied by abnormal body fat distribution, especially abdominal fat accumulation. However, the association between UHR and body fat distribution has yet to be discovered.
The present study aimed to explore the relationship between UHR and body fat distribution. The body mass index (BMI) and waist circumference (WC) were widely used to assess overall and abdominal obesity. They are both straightforward and reliable indicators but have some limitations. Neither can they differentiate between fat-free mass (FFM) and fat mass (FM), nor can they accurately depict the body fat distribution. Therefore, we acquired the overall fat content and segmental fat distribution with an automatic bioelectrical impedance analyzer. In addition, we also explored the association between UHR and visceral fat area (VFA) and subcutaneous fat area (SFA) that were measured by magnetic resonance imaging (MRI) in the population with obesity.
Methods
Study Participants
The present study enrolled individuals who intended to undergo weight loss treatment in the Department of Endocrinology and Metabolism in the Sixth People’s Hospital Affiliated to Shanghai Jiao Tong University School of Medicine from July 2019 to August 2020. The inclusion criteria were being obese (BMI ≥ 28 kg/m2) and aged between 18 and 65 years. The exclusion criteria were as follows: a history of gout or UA lowering therapy, severe hepatic or renal dysfunction, thyroid dysfunction, a history of thyroid hormone or steroid hormone treatment, and malignancy. A total of 219 individuals with obesity were included. In addition, we enrolled 81 individuals without obesity who underwent cholecystectomy in the Department of General Surgery as controls. Together, a total of 300 individuals were included in the final analysis.
The present study was approved by the Ethics Committee of the Sixth People’s Hospital Affiliated to Shanghai Jiao Tong University School of Medicine (Ethical approval number 2019-KY-011(K); approval date: February 18, 2019; registration number: ChiCTR1900028513). All participants signed written informed consent for their participation.
Assessments of Overall and Segmental Fat Distribution
Total FM, total fat percentage (fat%), leg FM, leg fat%, trunk FM, and trunk fat% were measured with a body composition analyzer (MC-780MA; Tanita Corp, Tokyo, Japan) in all participants. In the population with obesity, the determination of VFA and SFA was carried out by an experienced radiologist, as previously described.16 VFA and SFA were measured briefly using a 3.0T clinical MRI scanner (Archiva; Philips Medical Systems Amsterdam, Netherlands) that captured images of the participant’s supine abdomen between the L4 and L5 vertebrae. The Slice-O-Matic image analysis program, version 4.2 (Tomovision Inc., Montreal, QC, Canada), was used to segment the VFA and SFA in the pictures.
Biochemical and Anthropometric Measurements
All participants were asked to rest well (≥ 8 hours) before the survey, and the blood samples were collected during the morning visit. The following biochemical variables were determined: fasting plasma glucose (FPG), glycated hemoglobin (HbA1c), aspartate aminotransferase (AST), alanine aminotransferase (ALT), total cholesterol (TC), triglycerides (TG), HDL-c, low-density lipoprotein cholesterol (LDL-c), and UA. Height, weight, and WC were determined with standardized methods.13 BMI was calculated as weight (kg)/height2 (m2). Systolic blood pressure (SBP) and diastolic blood pressure (DBP) were assessed with standardized methods in the resting state.17
Definitions of Metabolic Diseases
The participants were diagnosed as obese according to the criterion (BMI ≥ 28 kg/m2) of WS/T428-2013 Adult Weight Determination criteria.18 Diabetes was diagnosed based on the 2021 American Diabetes Criteria.19 Dyslipidemia was diagnosed based on the Chinese guidelines.20 Hypertension was diagnosed according to the 1999 World Health Organization definition.21 Hyperuricemia was interpreted as a UA level higher than 420 μmol/L.22
Statistical Analyses
All statistical analyses were performed using SPSS software, version 24.0 (IBM Corp., Armonk, NY, USA). All variables were examined for normality. Data with normal distribution were represented as means ± standard deviations, while data with skewed distribution were represented as medians with interquartile ranges. Categorical variables were presented as numbers and percentages. For variables with a normal distribution, the independent-sample t-test was used to analyze the differences between the obese and non-obese groups. For variables with a skewed distribution, the Wilcoxon rank sum test was used. Spearman correlation and multivariate linear regression analyses were used to evaluate associations between UHR and body fat distribution parameters. All reported P values were two-tailed, and statistical significance was set at P < 0.05.
Results
Characteristics of Participants
Table 1 summarized the participants’ clinical characteristics based on their BMI levels. In total, 300 individuals (58 men and 242 women) aged between 18 and 65 years were enrolled. Among these, 219 (73.0%) were diagnosed as obese, 67 (22.3%) had type 2 diabetes, 48 (16.0%) had hypertension, 202 (67.3%) had dyslipidemia, and 112 (37.3%) had hyperuricemia. Compared with non-obese individuals, those with obesity had significantly increased serum UA levels [416 (349–476) μmol/L versus 303 (242–358) μmol/L, P < 0.01]. Obese and non-obese individuals had comparable HDL-c levels [1.19 (1.01–1.42) mmol/L versus 1.22 (1.00–1.54) mmol/L, P = 0.34]. The mean UHR level of individuals with obesity was significantly higher [obese versus non-obese, 33.7% (26.2% - 45.9%) versus 22.6% (17.0%-34.4%), P < 0.01]. Furthermore, individuals with obesity had elevated FPG, HbA1c, ALT, AST, SBP, DBP, TC, TG, and LDL-c levels (all P < 0.05). In terms of body adiposity indices, individuals with obesity had notably higher overall and segmental fat contents (all P < 0.01).
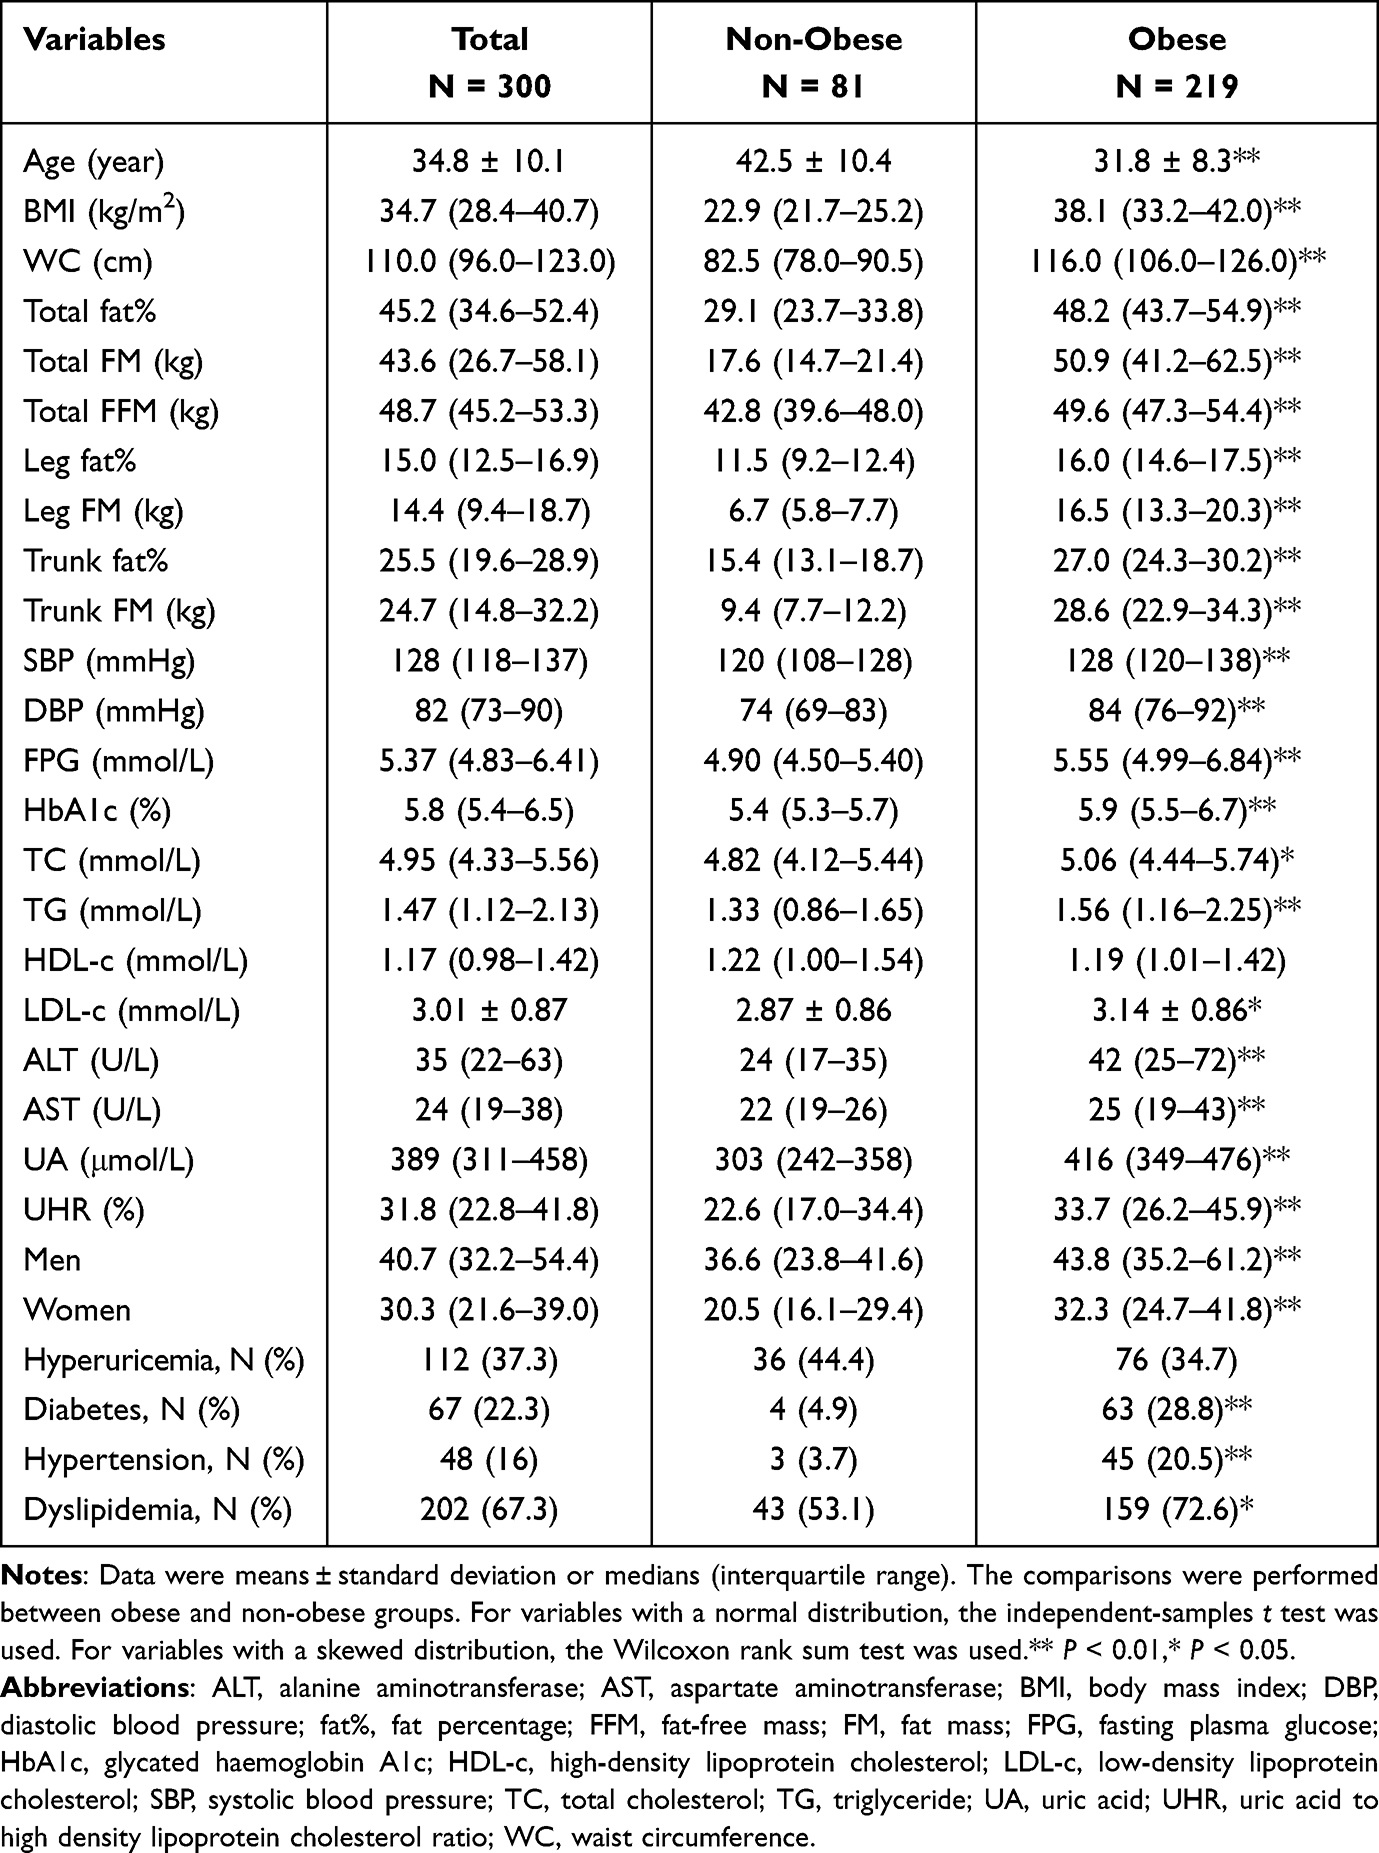 |
Table 1 Clinical Characteristics of Participants |
Correlations of UHR with Body Fat Distribution Parameters
Spearman correlation analysis was performed to evaluate the relationship between UHR and body fat distribution parameters. As shown in Figure 1, UHR was found to be positively correlated with the indicators of overall obesity, including BMI (r = 0.41, P < 0.001), total fat% (r = 0.26, P < 0.001), total FM (r = 0.38, P < 0.001), and total FFM (r = 0.45, P < 0.001). Moreover, UHR was also positively correlated with indicators of regional fat accumulation, including WC (r = 0.48, P < 0.001), leg fat% (r = 0.26, P < 0.001), leg FM (r = 0.39, P < 0.001), trunk fat% (r = 0.25, P < 0.001), and trunk FM (r = 0.38, P < 0.001).
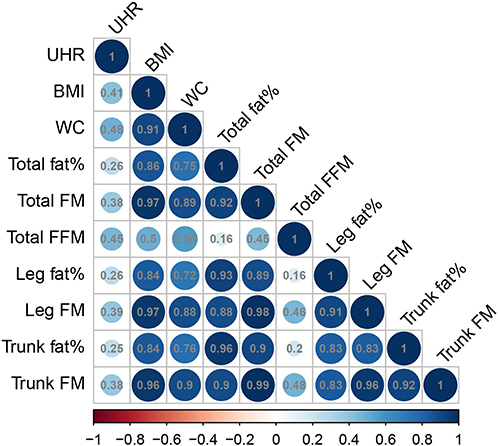 |
Figure 1 Spearman correlation analysis of UHR and fat distribution parameters. Abbreviations: BMI, body mass index; fat%, fat percentage; FFM, fat-free mass; FM, fat mass; UHR, uric acid to high-density lipoprotein cholesterol ratio; WC, waist circumference. |
Multivariate Linear Regression Analysis of UHR
To further clarify the relationship between UHR and body adiposity indices, the multivariate linear regression analysis was performed. Three regression models with UHR as the dependent variable were constructed. As shown in Figure 2, in model 1, BMI and WC were included. After adjusting for age, gender, SBP, DBP, ALT, AST, HbA1c, TG, and LDL-c, WC was positively correlated with UHR (standardized β = 0.427, P < 0.001), while BMI was not related to UHR (standardized β = −0.150, P = 0.226). In model 2, BMI and WC were replaced with total FM and FFM, with other variables constant. Total FM exhibited a positive correlation with UHR (standardized β = 0.225, P = 0.002); however, FFM demonstrated no such correlation (standardized β = 0.072, P = 0.599). Given the critical and opposite functions of trunk fat and leg fat, model 3 was further created. In model 3, leg FM, trunk FM, and other variables mentioned in model 1 were included. The results showed a positive correlation between trunk FM and UHR (standardized β = 0.296, P = 0.036), while no such correlation was found between UHR and leg FM (standardized β = −0.049, P = 0.733).
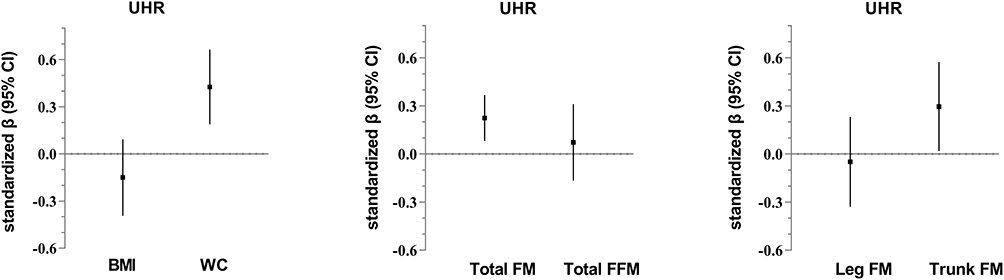 |
Figure 2 Adjusted associations of standardized adiposity measure with UHR. Adjusted associations of fat distribution parameters with UHR. Results were based on linear regression analyses and expressed as standardized β with a 95% confidence interval in UHR per standard deviation of adiposity measure. The adjustment was for age, gender, SBP, DBP, ALT, AST, TG, LDL-c, and HbA1c. Abbreviations: BMI, body mass index; WC, waist circumference; FM, fat mass; FFM, fat-free mass; UHR, uric acid to high-density lipoprotein cholesterol ratio; CI, confidence interval. |
Relationship Between UHR and Abdominal Fat Distribution in the Population with Obesity
Given that abdominal fat is an essential component of trunk fat, the association between UHR and abdominal fat distribution was further explored in individuals with obesity. The VFA and SFA of the population with obesity in the present study were 188.5 ± 70.0 cm2 and 434.8 (400.0–538.6) cm2, respectively. Spearman correlation analysis showed that UHR was positively correlated with VFA (r = 0.19, P = 0.004) and SFA (r = 0.23, P = 0.001). As shown in Table 2, the multivariate linear regression analysis indicated that VFA was independently associated with UHR (standardized β = 0.188, P = 0.008). In contrast, no static significance was observed between UHR and SFA (standardized β = 0.016, P = 0.807). Further analysis was performed to determine the influence of metabolic disorders on the correlations mentioned above. The results showed that adding diabetes to model 1 did not influence the positive correlation between UHR and VFA (standardized β = 0.188, P = 0.009). Similarly, when hypertension or dyslipidemia were added to model 2 or model 3, positive associations still existed between VFA and UHR (P < 0.01).
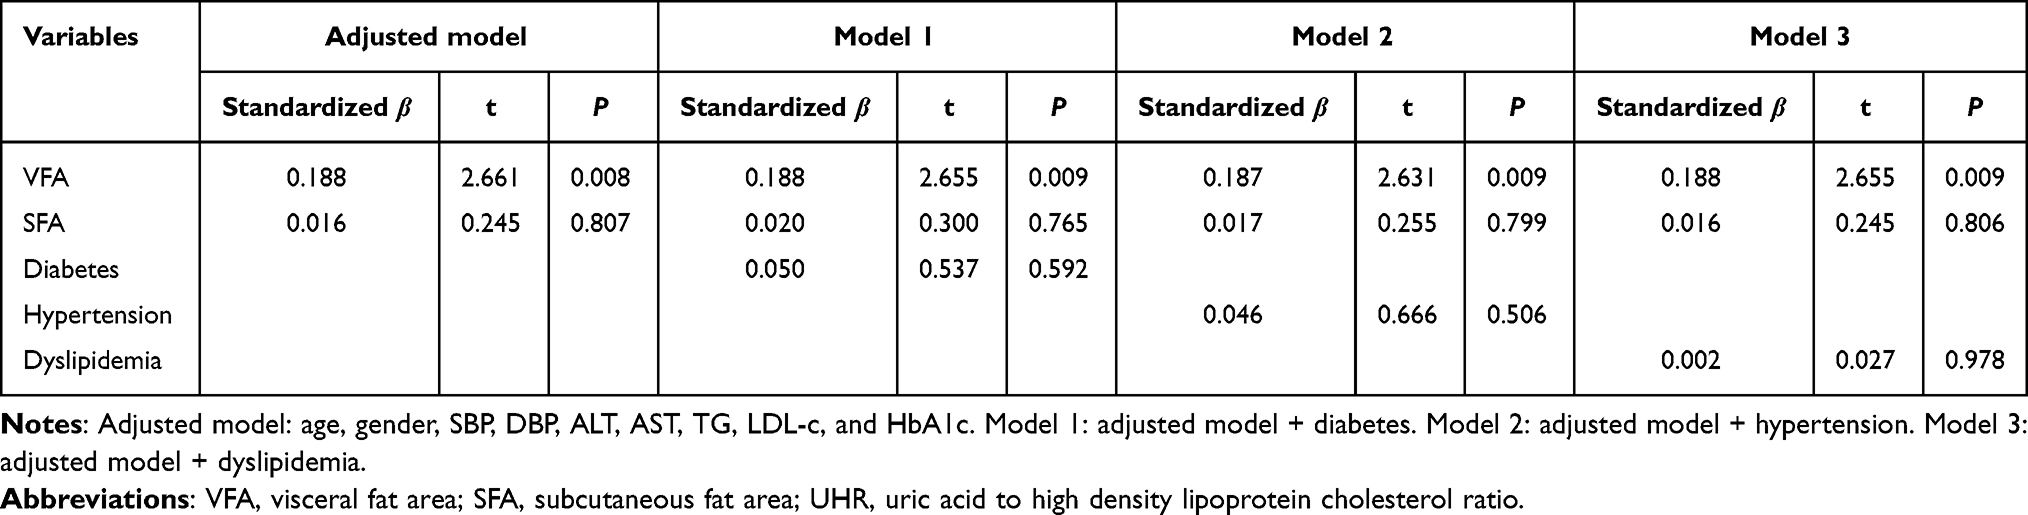 |
Table 2 Correlations of VFA and SFA with UHR in Participants with Obesity |
Discussion
The results of the present study suggested that UHR levels are independently associated with total FM and trunk FM. In individuals with obesity, VFA was observed to be an independent contributor to UHR.
UHR has been proposed as a new indicator for several metabolic and cardiovascular diseases. Yazdi et al11 enrolled 817 individuals, 96 of whom had metabolic syndrome, and they found that UHR effectively identified metabolic syndrome with a specificity and sensitivity of 55% and 86%, respectively. Zhang et al23 conducted a study that included 6285 Chinese individuals with normal weight (BMI < 24 kg/m2) and found that UHR was independently associated with increased risks of non-alcoholic fatty liver disease (NAFLD). Another study involving 6258 individuals with normal serum lipid levels showed that participants in the fifth quantile of UHR at baseline had an approximately 76% increased risk of NAFLD, suggesting that UHR can be used as an early indicator of NAFLD.24 Insulin resistance is identified as a core ingredient in the pathogenesis of these metabolic diseases. It is hypothesized that UHR can be used as an early indicator of insulin resistance, even in individuals with normal weight or metabolic status. In terms of cardiovascular events, a Chinese study comprising 1953 patients on peritoneal dialysis showed that after a follow-up of 61.3 months, patients with the highest UHR at baseline were at an increased risk for all-cause mortality of 35% and cardiovascular mortality of 46%, respectively.25 Furthermore, a large-scale cohort study from Korea demonstrated that UHR was a reliable predictor of future ischemic heart disease.26 These findings emphasized the importance of UHR in the early detection of cardiovascular disease.
Central obesity is accepted as a core component of metabolic syndrome. Trunk fat depots, particularly abdominal fat deposits, have a high lipid turnover rate and are strongly responsive to stress hormones. Conversely, leg fat depots utilize non-esterified free fatty acids released from the trunk fat depots and confer protection against lipotoxicity.27 Excessive deposition of trunk fat promotes systemic hypo-inflammation, leading to hyperglycemia and reactive hyperinsulinemia, which promotes ectopic lipid accumulation and further exacerbates insulin resistance.27 The present study displayed associations of UHR with total FM and trunk FM, providing new evidence regarding the relationship between UHR and adverse metabolic states. Additionally, in the population with obesity, UHR was influenced by VFA rather than SFA. It might be due to VFA being more strongly associated with inflammation and adverse metabolic status than SFA. Excessive visceral fat deposit is a detrimental factor driving metabolic disorders by increasing sympathetic excitability, triggering insulin resistance, inducing pancreatic steatosis, and secreting inflammatory cytokines.28–30 Whether the correlation between UHR and VFA exists in individuals with normal weight needs further exploration.
The mechanism involving UHR and abdominal fat accumulation is not yet clear. UHR is the ratio of UA to HDL-c; thus, an increase in the former, a decrease in the latter, or both may contribute to the results. Given the strong relationship between UHR and metabolic disorders, it has been hypothesized that insulin resistance is responsible for the link between UHR and metabolic diseases and their comorbidities. Previous animal experiments have confirmed that high UA levels can activate NLPR3 inflammasome, aggravating hepatic steatosis and insulin resistance.31 Another in vitro experiment showed that increased UA promotes monocyte chemokine production in adipocytes, mediating inflammation in adipocytes.32 In addition, Jakubiak et al33 have reported that obesity and insulin resistance were the most significant contributors to the relationship between metabolic syndrome and oxidative stress. The concentration of uric acid in the blood is one of the markers of oxidative stress. In turn, high UA levels are also known to activate mitochondrial oxidative stress-related pathways in hepatocytes, promoting citric acid release into the cytoplasm, which leads to an increased de novo lipogenesis in hepatocytes and accelerates insulin resistance.34 It is widely accepted that HDL-c has anti-atherogenic properties. HDL-c exerts antioxidant and anti-inflammatory ability by upregulating the expression of endothelial nitric oxide synthase, enhancing nitric oxide production, strengthening the integrity of endothelial cells, and down-regulating the expression of several adhesion molecules.35 In light of previous research findings and our results, it can be speculated that elevated UA and low HDL-c levels work synergistically to promote the development of metabolic disorders.
The study provided evidence of the relationship between UHR and total fat content and segmental fat distribution, strengthening the critical role of UHR in obesity and related comorbidities. UHR might serve as a simple and reliable biomarker of metabolic disorders in the future. This study had some limitations. First, body fat was measured using a bioelectrical impedance analyzer rather than the gold standard dual-energy X-ray absorptiometry. However, a previous study evaluating the correlation between these two methods found a correlation coefficient of 0.87 between the two techniques, supporting the reliability of the estimates made in this study.36 Second, whether the correlation between UHR and VFA still exists in individuals with normal weight is unclear; thus, further analysis in non-obese populations with a larger sample size is necessary. Third, the present study could not deduce the causality between UHR and body fat.
Conclusions
The present study demonstrated a significant association of UHR with overall fat content and trunk fat accumulation. Additionally, it was also observed that UHR was influenced by VFA in individuals with obesity. Attention should be paid to the role of excessive trunk fat mass in the relationship between UHR and metabolic disorders.
Data Sharing Statement
The data that support the findings of this study are available from the corresponding author upon reasonable request.
Statement of Ethics
Our study complied with the Declaration of Helsinki. All participants provided written informed consent. The present study was approved by the Ethics Committee of the Sixth People’s Hospital Affiliated to Shanghai Jiao Tong University School of Medicine (Ethical approval number 2019-KY-011(K); approval date: February 18, 2019).
Author Contributions
All authors made a significant contribution to the work reported, whether that is in the conception, study design, execution, acquisition of data, analysis and interpretation, or in all these areas; took part in drafting, revising or critically reviewing the article; gave final approval of the version to be published; have agreed on the journal to which the article has been submitted; and agree to be accountable for all aspects of the work.
Funding
This work was supported by Clinical Research Plan of SHDC (No. SHDC2020CR1017B), Shanghai Research Center for Endocrine and Metabolic Diseases (2022ZZ01002), and Shanghai Municipal Key Clinical Specialty.
Disclosure
The authors have no conflicts of interest to declare.
References
1. Zeng Q, Li N, Pan X, Chen L, Pan A. Clinical management and treatment of obesity in China. Lancet Diabetes Endocrinol. 2021;9(6):393–405. doi:10.1016/S2213-8587(21)00047-4
2. Richette P, Bardin T. Gout. Lancet. 2010;375(9711):318–328. doi:10.1016/S0140-6736(09)60883-7
3. Ponticelli C, Podestà MA, Moroni G. Hyperuricemia as a trigger of immune response in hypertension and chronic kidney disease. Kidney Int. 2020;98(5):1149–1159. doi:10.1016/j.kint.2020.05.056
4. Sharaf El Din UAA, Salem MM, Abdulazim DO. Uric acid in the pathogenesis of metabolic, renal, and cardiovascular diseases: a review. J Adv Res. 2017;8:537–548. doi:10.1016/j.jare.2016.11.004
5. Zhang Y, Cai M, Dilimulati D, et al. Correlation Between Serum Uric Acid and Body Fat Distribution in Patients With Polycystic Ovary Syndrome. Front Endocrinol. 2021;12:782808. doi:10.3389/fendo.2021.782808
6. Zong J, Sun Y, Zhang Y, et al. Correlation Between Serum Uric Acid Level and Central Body Fat Distribution in Patients with Type 2 Diabetes. Diabetes Metab Syndr Obes. 2020;13:2521–2531. doi:10.2147/DMSO.S260891
7. Ouimet M, Barrett TJ, Fisher EA. HDL and Reverse Cholesterol Transport. Circ Res. 2019;124(10):1505–1518. doi:10.1161/CIRCRESAHA.119.312617
8. Rader DJ, Hovingh GK. HDL and cardiovascular disease. Lancet. 2014;384:618–625. doi:10.1016/S0140-6736(14)61217-4
9. Song SO, Hwang YC, Kahn SE, Leonetti DL, Fujimoto WY, Boyko EJ. Intra-Abdominal Fat and High Density Lipoprotein Cholesterol Are Associated in a Non-Linear Pattern in Japanese-Americans. Diabetes Metab J. 2020;44:277–285. doi:10.4093/dmj.2019.0008
10. Kocak MZ, Aktas G, Erkus E, Sincer I, Atak B, Duman T. Serum uric acid to HDL-cholesterol ratio is a strong predictor of metabolic syndrome in type 2 diabetes mellitus. Rev Assoc Med Bras. 2019;65(1):9–15. doi:10.1590/1806-9282.65.1.9
11. Yazdi F, Baghaei MH, Baniasad A, Naghibzadeh-Tahami A, Najafipour H, Gozashti MH. Investigating the relationship between serum uric acid to high-density lipoprotein ratio and metabolic syndrome. Endocrinol Diabetes Metab. 2022;5:e00311. doi:10.1002/edm2.311
12. Xuan Y, Zhang W, Wang Y, et al. Association Between Uric Acid to HDL Cholesterol Ratio and Diabetic Complications in Men and Postmenopausal Women. Diabetes Metab Syndr Obes. 2023;19(16):167–177. doi:10.2147/DMSO.S387726
13. Yang Y, Zhang J, Jia L, Su J, Ma M, Lin X. The interaction between uric acid and high-density lipoprotein cholesterol on the prognosis of patients with acute myocardial infarction. Front Cardiovasc Med. 2023;10(10):1226108. doi:10.3389/fcvm.2023.1226108
14. Yang Y, Zhang J, Lin J, Su J, Ma M, Lin X. Uric acid to high-density lipoprotein cholesterol ratio predicts adverse cardiovascular events in patients with coronary chronic total occlusion. Nutr, Metab Cardiovasc Dis. 2023;33(12):2471–2478. doi:10.1016/j.numecd.2023.07.037
15. Zhao H, Qiu X, Li H, Cui J, Sun Y. Association between Serum Uric Acid to HDL-Cholesterol Ratio and Nonalcoholic Fatty Liver Disease Risk among Chinese Adults. Biomed Environ Sci. 2023;36(1):1–9. doi:10.3967/bes2022.111
16. Bao Y, Ma X, Yang R, et al. Inverse relationship between serum osteocalcin levels and visceral fat area in Chinese men. J Clin Endocrinol Metab. 2013;98(1):345–351. doi:10.1210/jc.2012-2906
17. Cao W, Xu Y, Shen Y, et al. Change of neck circumference in relation to visceral fat area: a Chinese community-based longitudinal cohort study. Int J Obes Lond. 2022;46(9):1633–1637. doi:10.1038/s41366-022-01160-w
18. Chen C, Zhao W, Yang X, et al. WS/T 428-2013 Criteria of weight for adults. National Health Family Planning Commission People’s Republic China. 2013;2.
19. American Diabetes Association. Classification and Diagnosis of Diabetes. Standards of Medical Care in Diabetes-2021. Diabetes Care. 2021;44:S15–S33. doi:10.2337/dc21-S002
20. Zhu J, Gao R, Zhao S, et al. 2016 Chinese guideline for the management of dyslipidemia in adults. Chin J Cardiol. 2016;833–853.
21. Chalmers J, MacMahon S, Mancia G, et al. 1999 World Health Organization-International Society of Hypertension Guidelines for the management of hypertension. Guidelines Sub-Committee World Health Org Clin Exp Hypertens. 1999;21:1009–1060.
22. Li C, Lv Z, Sun M, Chen Y. Guideline for the diagnosis and management of hyperuricemia and gout in China (2019). Chin J Endocrinol Metab. 2020;1–13.
23. Zhang YN, Wang QQ, Chen YS, Shen C, Xu CF. Association between Serum Uric Acid to HDL-Cholesterol Ratio and Nonalcoholic Fatty Liver Disease in Lean Chinese Adults. Int J Endocrinol. 2020;2020:5953461. doi:10.1155/2020/5953461
24. Zhu W, Liang A, Shi P, et al. Higher serum uric acid to HDL-cholesterol ratio is associated with onset of non-alcoholic fatty liver disease in a non-obese Chinese population with normal blood lipid levels. BMC Gastroenterol. 2022;22:196. doi:10.1186/s12876-022-02263-4
25. Liu R, Peng Y, Wu H, et al. Uric acid to high-density lipoprotein cholesterol ratio predicts cardiovascular mortality in patients on peritoneal dialysis. Nutr, Metab Cardiovasc Dis. 2021;31(2):561–569. doi:10.1016/j.numecd.2020.10.005
26. Park B, Jung DH, Lee YJ. Predictive Value of Serum Uric Acid to HDL Cholesterol Ratio for Incident Ischemic Heart Disease in Non-Diabetic Koreans. Biomedicines. 2022;10. doi:10.3390/biomedicines11010010
27. Karpe F, Pinnick KE. Biology of upper-body and lower-body adipose tissue--link to whole-body phenotypes. Nat Rev Endocrinol. 2015;11:90–100. doi:10.1038/nrendo.2014.185
28. Kahn CR, Wang G, Lee KY. Altered adipose tissue and adipocyte function in the pathogenesis of metabolic syndrome. J Clin Invest. 2019;129(10):3990–4000. doi:10.1172/JCI129187
29. Lee MJ, Wu Y, Fried SK. Adipose tissue heterogeneity: implication of depot differences in adipose tissue for obesity complications. Mol Aspects Med. 2013;34:1–11. doi:10.1016/j.mam.2012.10.001
30. Blaho M, Macháčková J, Dítě P, et al. Use of Magnetic Resonance Imaging to Quantify Fat and Steatosis in the Pancreas in Patients after Bariatric Surgery: a Retrospective Study. Obes Surg. 2022;32(11):3666–3674. doi:10.1007/s11695-022-06278-4
31. Wan X, Xu C, Lin Y, et al. Uric acid regulates hepatic steatosis and insulin resistance through the NLRP3 inflammasome-dependent mechanism. J Hepatol. 2016;64(4):925–932. doi:10.1016/j.jhep.2015.11.022
32. Baldwin W, McRae S, Marek G, et al. Hyperuricemia as a mediator of the proinflammatory endocrine imbalance in the adipose tissue in a murine model of the metabolic syndrome. Diabetes. 2011;60(4):1258–1269. doi:10.2337/db10-0916
33. Jakubiak GK, Osadnik K, Lejawa M, et al. “Obesity and Insulin Resistance” Is the Component of the Metabolic Syndrome Most Strongly Associated with Oxidative Stress. Antioxidants. 2021;11(1):79. doi:10.3390/antiox11010079
34. Lanaspa MA, Sanchez-Lozada LG, Choi YJ, et al. Uric acid induces hepatic steatosis by generation of mitochondrial oxidative stress: potential role in fructose-dependent and -independent fatty liver. J Biol Chem. 2012;287:40732–40744. doi:10.1074/jbc.M112.399899
35. Marsche G, Saemann MD, Heinemann A, Holzer M. Inflammation alters HDL composition and function: implications for HDL-raising therapies. Pharmacol Ther. 2013;137(3):341–351. doi:10.1016/j.pharmthera.2012.12.001
36. Lee MM, Jebb SA, Oke J, Piernas C. Reference values for skeletal muscle mass and fat mass measured by bioelectrical impedance in 390 565 UK adults. J Cachexia, Sarcopenia Muscle. 2020;11:487–496. doi:10.1002/jcsm.12523
 © 2024 The Author(s). This work is published and licensed by Dove Medical Press Limited. The full terms of this license are available at https://www.dovepress.com/terms.php and incorporate the Creative Commons Attribution - Non Commercial (unported, v3.0) License.
By accessing the work you hereby accept the Terms. Non-commercial uses of the work are permitted without any further permission from Dove Medical Press Limited, provided the work is properly attributed. For permission for commercial use of this work, please see paragraphs 4.2 and 5 of our Terms.
© 2024 The Author(s). This work is published and licensed by Dove Medical Press Limited. The full terms of this license are available at https://www.dovepress.com/terms.php and incorporate the Creative Commons Attribution - Non Commercial (unported, v3.0) License.
By accessing the work you hereby accept the Terms. Non-commercial uses of the work are permitted without any further permission from Dove Medical Press Limited, provided the work is properly attributed. For permission for commercial use of this work, please see paragraphs 4.2 and 5 of our Terms.