Back to Journals » Clinical Epidemiology » Volume 15
Associations Between Mean HbA1c, HbA1c Variability, and Both Mortality and Macrovascular Complications in Patients with Diabetes Mellitus: A Registry-Based Cohort Study
Authors Tan JK ![]() , Lim GH, Mohamed Salim NN, Chia SY
, Lim GH, Mohamed Salim NN, Chia SY ![]() , Thumboo J, Bee YM
, Thumboo J, Bee YM ![]()
Received 29 September 2022
Accepted for publication 20 January 2023
Published 25 January 2023 Volume 2023:15 Pages 137—149
DOI https://doi.org/10.2147/CLEP.S391749
Checked for plagiarism Yes
Review by Single anonymous peer review
Peer reviewer comments 3
Editor who approved publication: Dr Eyal Cohen
Joshua Kuan Tan,1 Gek Hsiang Lim,1 Nur Nasyitah Mohamed Salim,1 Sing Yi Chia,1 Julian Thumboo,1 Yong Mong Bee2
1Health Services Research Unit, Singapore General Hospital, Singapore, 169608, Singapore; 2Department of Endocrinology, Singapore General Hospital, Singapore, 169608, Singapore
Correspondence: Yong Mong Bee, Department of Endocrinology, Singapore General Hospital, Singapore, 169608, Singapore, Tel +65 6321 3753, Email [email protected]
Background: We investigate the association between mean HbA1c, HbA1c variability, and all-cause mortality and diabetes-related macrovascular complications in patients with diabetes.
Methods: We performed a retrospective cohort study using patients present in the Singapore Health Services diabetes registry (SDR) during 2013 to 2014. We assessed mean HbA1c using three models: a baseline mean HbA1c for 2013– 14, the mean across the whole follow-up period, and a time-varying yearly updated mean. We assessed HbA1c variability at baseline using the patient’s HbA1c variability score (HVS) for 2013– 14. The association between mean HbA1c, HVS, and 6 outcomes were assessed using Cox proportional hazard models.
Results: We included 43,837– 53,934 individuals in the analysis; 99.3% had type 2 diabetes mellitus. The data showed a J-shaped distribution in adjusted hazard ratios (HRs) for all-cause mortality, ischemic heart disease, acute myocardial infarction, peripheral arterial disease, and ischemic stroke, with an increased risk of developing these outcomes at HbA1c < 6% (42 mmol/mol) and ≥ 8% (64 mmol/mol). With the addition of HVS, the J-shaped distribution was maintained for the above outcomes, but HRs were greater at HbA1c < 6.0% (42 mmol/mol) and reduced at HbA1c ≥ 8.0% (64 mmol/mol) when compared to models without HVS. The risk for all outcomes increased substantially with increasing glycaemic variability.
Conclusion: Both low (< 6.0% [42 mmol/mol]) and high (≥ 8.0% [64 mmol/mol]) levels of glycaemic control are associated with increased all-cause mortality and diabetes-related macrovascular complications. Glycaemic variability is independently associated with increased risk for these outcomes. Therefore, patients with stable glycaemic level of 6– 8% (42– 64mmol/mol) are at lowest risk of all-cause mortality and diabetes-related macrovascular complications.
Keywords: diabetes mellitus, diabetes mellitus complications, glycated haemoglobin, glycated haemoglobin analysis, cardiovascular diseases
Plain Language Summary
Many studies have shown a bimodal distribution for death and long-term diabetes control (determined by HbA1c levels) with increased risk of death if diabetes is poorly controlled (high HbA1c levels) or overly strict control (low HbA1c levels). A few studies have demonstrated an increased risk of death and complications with long-term variability in diabetes control. The units of measure used to determine long-term variability are difficult to understand for both physicians and patients. The HbA1c Variability Score (HVS) was recently introduced and provides a meaningful assessment of the long-term variability in diabetes control. HVS considers significant changes in diabetes control by indicating how frequently the HbA1c level rises or decreases by ≥0.5% (5.5 mmol/mol).
In this study, we investigate the relative impact of glycaemic control and glycaemic variability (as measured by HVS) on death and diabetes-related large-vessel (macrovascular) complications. We analysed patients present in the Singapore Health Services diabetes registry (SDR) during 2013 to 2014 and followed up until 2020.
The study included 43,837–53,934 individuals in the analysis of various outcomes. We confirmed that both strict (<6.0% [42 mmol/mol]) and poor (≥8.0% [64 mmol/mol]) levels of diabetes control are associated with an increased risk of death and diabetes-related macrovascular complications. Long-term variability in diabetes control is also associated with increased risk for death and diabetes-related macrovascular complications. Patients with stable diabetes control at HbA1c levels of 6–8% (42–64mmol/mol) are at lowest risk of death and diabetes-related macrovascular complications.
Therefore, from this study, clinical guidelines for diabetes should emphasize early glycaemic control coupled with the stabilization of diabetes control within the HbA1c range of 6.0–8.0% (42–64 mmol/mol) and reduce long-term variability in diabetes control.
Introduction
Diabetes mellitus is a growing health problem with a significant global disease burden. The global prevalence of diabetes mellitus (DM) is on the rise. Early intervention with lifestyle and pharmacologic therapies is important in controlling DM and preventing macro- and microvascular complications. However, there is uncertainty regarding the benefits of very stringent glycaemic control1 as multiple observation studies have shown a bimodal distribution for mortality and glycaemic control with increased mortality risk at not only high HbA1c levels but also low levels (HbA1c <6.0% [42 mmol/mol]); this has variously been described as a J-, U-, or V-shaped distributions.2,3
In addition to glycaemic control, recent studies have shown that glycaemic variability is an important predictor for outcomes and mortality. Glycaemic variability can be measured as short-term and long-term glycaemic variability;4 the latter is a focus of this research. Multiple different metrics have been used to assess long-term glycaemic variability including HbA1c standard deviation (SD), HbA1c coefficient of variation (CV), and recently the HbA1c variability score.5–8 Using these metrics, it has been shown that glycaemic variability is associated with adverse outcomes and mortality.5–8 Most studies used HbA1c SD and CV, however, it is recognized that both SD and CV are not easily interpretable in the clinical context.7 Consequently, Forbes et al developed the HbA1c variability score (HVS), a novel method to define glycaemic variability in a clinically meaningful way.6 HVS considers clinically significant changes in glycaemic control by indicating how frequently HbA1c rises or decreases by ≥0.5% (5.5 mmol/mol) and is more clinically translatable.6,7 The number of studies using HVS is increasing, and emerging evidence shows that high HVS is associated with increased risk of all-cause mortality,6 cardiovascular mortality,9 and diabetic micro- and macrovascular complications.7–9 In this study, we conducted a retrospective cohort study using registry data from a health system in Singapore to investigate the relative impact of glycaemic control and glycaemic variability (as measured by HVS) on mortality and macrovascular complications in a cohort of patients with diabetes.
Materials and Methods
We performed a 6-year retrospective cohort study using data from the multi-institutional Singapore Health Services (SingHealth) Diabetes Registry (SDR). The SDR has been described previously.10 Briefly, SDR is a repository for diabetes-related patient data from across the SingHealth cluster. The SDR was initiated in 2015 and populated retrospectively and prospectively from SingHealth’s electronic medical records (EMR) and clinical databases to cover the period 2013 to 2020. The registry includes all individuals aged 18 and above with diabetes mellitus, excluding those with pre-diabetes. Cases are annually ascertained using criteria that include diagnosis codes (International Classification of Disease, Nine [ICD-9] and Ten [ICD-10]), prescription records, and laboratory test records.10
This study cohort included patients in the SDR during the years 2013 and 2014. The sample included patients with both type 1 and type 2 diabetes. There were no age criteria for the patients. Patients were included if they (1) were present in the SDR in 2013 or 2014, (2) had at least 3 or more HbA1c measurements throughout 2013 and 2014, (3) no more than one consecutive calendar year of missing annual mean HbA1c.
Our primary exposure variables were long-term glycaemic control (measured using mean HbA1c) and HbA1c variability (measured using HVS, described below). To assess mean HbA1c, we used the exposure models similar to Forbes et al6 the mean of the annual mean HbA1c for 2013 and 2014 (model 1 – baseline mean); mean of the annual mean HbA1c from 2013 to the year before the outcome occurred or the last year of follow-up (model 2 – total exposure mean); and the updated annual mean from 2013 onwards (used in a time-varying model; model 3 – time varying mean). As explained by Forbes et al models 1 and 2 were intended to identify long-term effects of glycaemic control, whereas model 3 was intended to identify more short-term effects.6 If mean HbA1c was missing for a given year in all three models, it was imputed from the mean of the non-missing annual means from the year before, and year after the missing year6 – eg if the person was alive in 2020 and the mean for 2019 was missing, the imputed mean for 2019 is the average of 2018 and 2020 means. Mean HbA1c for each individual was grouped by 0.5% (5.5 mmol/mol) HbA1c increments between 6% (42 mmol/mol) and 10% (86 mmol/mol) into eight categories; two other categories included outlier values less than 6% (<42 mmol/mol) and values greater or equal to 10% (≥86 mmol/mol) (see Supplemental Table 1).6 HbA1c variability was evaluated using HVS which is the number of times successive HbA1c readings differed by 0.5% (5.5 mmol/mol) or more, divided by the number of comparisons, and then multiplied by 100. HVS is thus represented as a percentage. For analysis, we group HVS into five categories: 0–20, 21–40, 41–60, 61–80, and 81–100.6
The baseline exposure period was Jan 1, 2013, to Dec 31, 2014, and this was the period in which the mean for model 1 was determined and data for other variables such as cholesterol levels and body mass index (BMI) were calculated. The patient’s age and diabetes duration (see Supplementary Techniques) were defined as age and duration since diabetes diagnosis on Jan 1, 2015 (respectively). In our analyses, we attempted to address heterogeneity and complexity within the population by adjusting for factors known to influence mortality and/or macrovascular complications, including age, ethnicity, socio-economic status (SES) (determined by housing type), diabetes duration, BMI, smoking status, hypertension, low-density lipoprotein (LDL) cholesterol, and glucose-lowering medication.
Housing type was used as a proxy measure of SES because, in Singapore, more than 80% of the resident population live in public housing under a tiered subsidy scheme, and smaller sized flats of 1–2 room size have caps on household monthly income for eligibility.11 Local studies have demonstrated that housing type is correlated to socioeconomic status11 and health outcomes.12 Glucose-lowering medications available in the SDR and used for adjusting included metformin, sulphonylurea, meglitinide, acarbose, thiazolidinedione, dipeptidyl-peptidase-4 (DPP4) inhibitors, sodium-glucose cotransporter-2 (SGLT-2) inhibitors, glucagon-like peptide-1 (GLP-1) receptor agonists, and insulin. When data for a variable were missing, an unknown category was added. Age, diabetes duration, BMI, and LDL cholesterol were continuous variables. There were four ethnic groups representing the major ethnic groups in Singapore, namely—Chinese, Malay, Indian, other. Housing type consisted of seven categories: 1 and 2 room public housing (PH), 3 room PH, 4 room PH, 5 room PH and executive flats, private condominiums, private landed housing, and unknown.
The study period was from 2013 to 2020 and consisted of the baseline exposure period (2013–2014) and the observation period (2015–2020). We evaluated outcomes during the observation period. We included all-cause mortality and five diabetes-related macrovascular complications: ischemic heart disease (IHD), peripheral arterial disease (PAD), haemorrhagic stroke, ischemic stroke, and acute myocardial infarction (AMI). Outcome ascertainment was performed through coding criterion (see Supplementary Techniques and Supplemental Table 2).
We used Cox regression to calculate the unadjusted and adjusted hazard ratios (HRs) for the HbA1c group (reference category ≥7.0% to <7.5% [≥53 to <58 mmol/mol]) and glycaemic variability score quintiles (reference category 0–20) in models 1–3,6 with outcomes being all-cause mortality, as well as occurrence of the five diabetes-related complications. The time to the diabetes-related complication was calculated from 1 January 2015 to the first date of diagnosis of the complication. Patients without the complication were censored at the end of the study period (31 December 2020), at date of death or date of last follow-up, whichever came earlier.
All variables in the adjusted models 1–3 were tested individually for non-proportionality. We considered the proportional hazards assumptions to be violated if the global P value was <0.01. We performed all analyses using Stata 14.0 (StataCorp. 2015. Stata Statistical Software: Release 14. College Station, TX: StataCorp LP).13 A two-tailed P-value of less than 0.05 was considered statistically significant.
Results
The study cohort consisted of 75,334 people with a similar number of men and women (Table 1). The mean age was 66.5 years (SD 12.0 years), interquartile range was 59 to 75 years with a minimum age of 19 years and a maximum of 105 years on 1 January 2015. The study cohort comprised 72.0% Chinese, 14.2% Malays, and 10.5% Indians, which closely resembled that of the Singapore population.14 Most subjects lived in public housing apartments, with the largest proportion being 4-room public housing (29.3%). Almost all patients in the register had type 2 DM (99.3%), a small proportion of patients had type 1 (0.6%) or other types (0.1%) of DM. Mean duration of diabetes was 10.7 years (SD 6.8 years), mean BMI was 26.5 kg/m2 (SD 4.95 kg/m2). At baseline, 1.4% of the cohort were smokers, 3.6% were ex-smokers, 31.1% had never smoked, and 63.9% had unknown smoking status. 88.6% had hypertension, 9.9% did not have hypertension, and 1.5% had unknown hypertension status. The mean LDL cholesterol at baseline was 2.35 mmol/L (SD 0.76 mmol/L). During the baseline exposure period, 17.7% of patients were not on any medications, 78.4% were on oral glucose-lowering agents; of which 61.1% of all patients were on oral agents only, and 17.3% were on both oral agents and insulin. 3.9% of patients were on insulin only. Detailed description of patients on oral agents is described in Table 1.
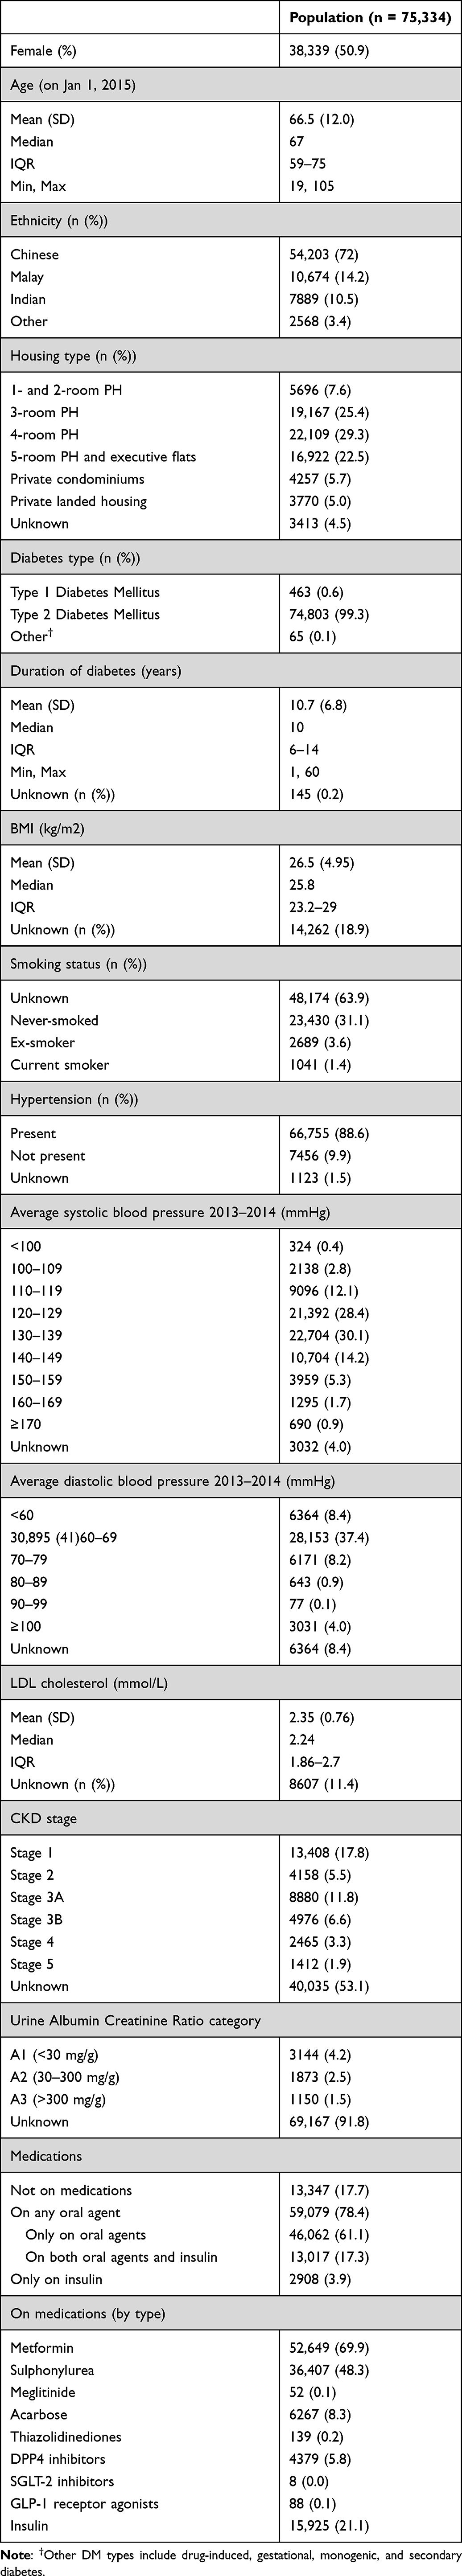 |
Table 1 Baseline Characteristics of Overall Study Population |
During the baseline exposure period, the mean HbA1c was 7.3% (SD 1.26%) [57 mmol/mol [SD 13.8 mmol/mol]] (Supplemental Table 3). At baseline (model 1), 23.6% of the cohort had a mean HbA1c in category 3 (6.5% to <7.0%), followed by 19.9% in category 4 (7.0% to <7.5%), then 15.6% in category 2 (6.0% to <6.5%). Total exposure mean (model 2) was calculated for all-cause mortality and other complications, the detailed result for each outcome is presented in Supplemental Table 3. The distribution of HbA1c categories was generally consistent across all outcomes in model 2. However, when compared to model 1, a smaller proportion of the cohort across all outcomes in model 2 were in HbA1c category 1 and 2 (Supplemental Table 3). The mean HVS score for the baseline exposure period (2013–2014) was 41.39% (SD 29.57), and the distribution of HVS scores is described in Supplemental Table 3.
The distribution of events during the observation period is described in Supplemental Table 4. Survival data for HbA1c categories (in models 1 and 2) and HVS categories are provided in Supplemental Tables 5–7 (respectively). The survival data indicate that survival reduces incrementally with HbA1c values greater or equal to 8% (≥64 mmol/mol) in models 1 and 2 for all outcomes except for haemorrhagic stroke. In models 1 and 2, the reduction in survival is more pronounced for IHD and all-cause mortality. A reduction in survival is also observed in HbA1c <6% (42 mmol/mol) in models 1 and 2 for all outcomes except for PAD and haemorrhagic stroke. Survival is inversely associated with HVS score for all outcomes except haemorrhagic stroke and is strongest for IHD and all-cause mortality.
The adjusted HRs by HbA1c category for all-cause mortality and other outcomes in the three Cox regression models are shown in Figure 1 and detailed in Supplemental Table 8. Between 43,837 and 53,934 individuals were involved in the analyses of each outcome (Supplemental Table 8). The data showed a J-shaped distribution for all-cause mortality, IHD, AMI, PAD, and ischemic stroke, with an increased risk of developing these outcomes at HbA1c ≥8% (64 mmol/mol). The risk for all-cause mortality, IHD, and AMI increases significantly with HbA1c <6% (42 mmol/mol), this trend was less pronounced for ischemic stroke and PAD. For all-cause mortality, IHD, AMI, PAD, and ischemic stroke, the HRs for models 1 and 2 closely approximate each other with overlapping 95% confidence intervals (CI) across a range of HbA1c values. At HbA1c ≥8% (64 mmol/mol) the HRs for model 3 (short-term effects) were smaller than models 1 and 2 (longer-term effects). Interestingly, the HRs of model 3 was larger than models 1 and 2 when HbA1c values were less than 6.0% (<42 mmol/mol).
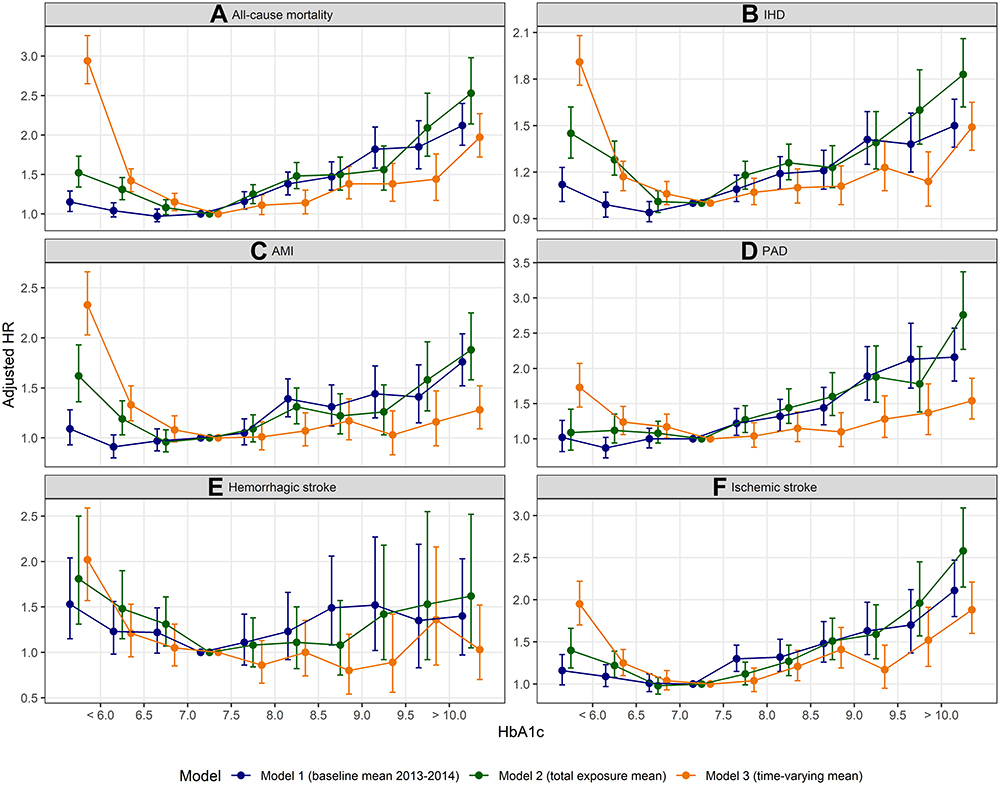 |
Figure 1 Adjusted HRs by HbA1c level for (A) all-cause mortality, (B) IHD, (C) AMI, (D) PAD, (E) haemorrhagic stroke and (F) ischemic stroke. |
Figure 2 demonstrates the adjusted HRs by HbA1c category for all outcomes in the three Cox regression models with baseline HVS, and the detailed HRs are provided in Supplemental Table 9. With the addition of HVS, the HRs at HbA1c ≥8.0% (64 mmol/mol) were slightly reduced, although the data maintained a J-shaped distribution for all outcomes except haemorrhagic stroke. Interestingly, at HbA1c <6.0% (42 mmol/mol), the HRs were larger for all outcomes in all 3 models, which included HVS. Figure 3 depicts the adjusted HRs by HVS for all outcomes, the detailed HRs are provided in Supplemental Table 9. The risk for all outcomes increased substantially with increasing glycaemic variability, although this effect was stronger for model 3 than models 1 and 2. The distribution of HRs for HVS closely approximate each other in all three models and for all outcomes except for AMI. For AMI, we observed some divergence in HR in the three models, with higher HRs of model 3 followed by model 2 and then model 1.
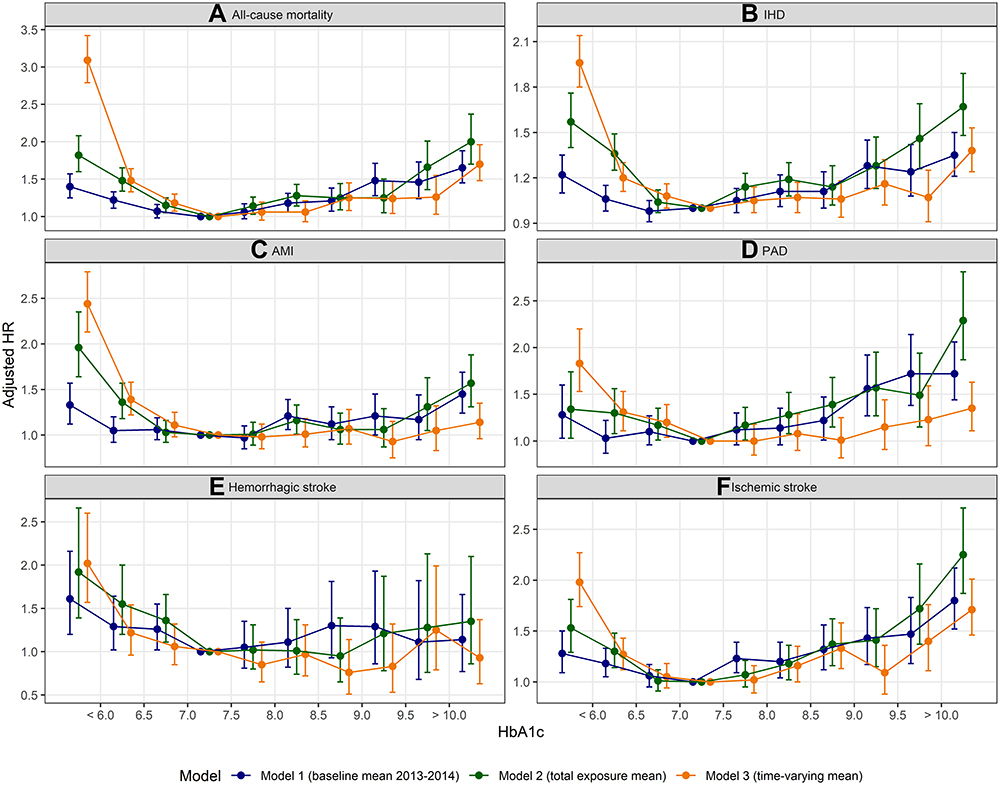 |
Figure 2 Adjusted HRs by HbA1c level, with HVS included in the model, for (A) all-cause mortality, (B) IHD, (C) AMI, (D) PAD, (E) haemorrhagic stroke and (F) ischemic stroke. |
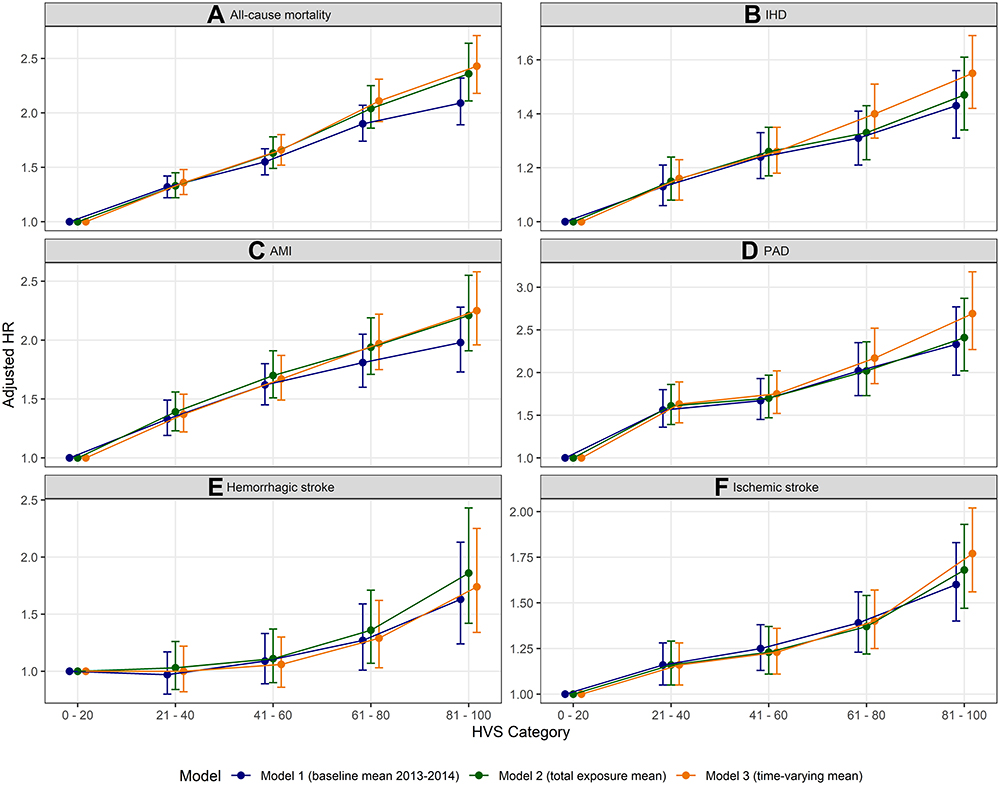 |
Figure 3 Adjusted HRs by HbA1c Variability Score, for (A) all-cause mortality, (B) IHD, (C) AMI, (D) PAD, (E) haemorrhagic stroke and (F) ischemic stroke. |
Discussion
In this study of a large multi-ethnic cohort of patients with DM, we found elevated risks for all-cause mortality, IHD, AMI, PAD, and ischemic stroke in patients with HbA1c <6.0% (42 mmol/mol) and ≥8.0% (64 mmol/mol). Our study also demonstrated that glycaemic variability increases the risk of all-cause mortality and DM-related macrovascular complications. To the best of our knowledge, this is the first population-based study to investigate the association between HbA1c, HbA1c variability, and DM-related macrovascular complications using comprehensive cardiovascular clinical endpoints; most other studies have evaluated either HbA1c or HbA1c variability and their association with all-cause mortality or DM-related complications.
The J-shaped relationship between HbA1c and all-cause mortality has been previously described.2,6 Our study reiterates that both loose (HbA1c ≥8.0% [64 mmol/mol]) and intensive (HbA1c <6.0% [42 mmol/mol]) glycaemic control is associated with higher mortality risk. However, the causative relationship between hyperglycaemia and cardiovascular risk has been debated,15,16 and the effects of lowering glycaemic control below contemporary guideline levels (<7.0% [53 mmol/mol]) on cardiovascular risk are less conclusive.17–19 Population surveys, cross-sectional studies, and short-term intervention trials have produced mixed results in addressing whether tighter glucose control lowers cardiovascular complications.17,20–24 In the United Kingdom prospective diabetes study (UKPDS), high glucose levels (analysed across three broad groups of HbA1c values) were associated with coronary artery disease and myocardial infarction.25 However, between the intensive (average HbA1c 7.0% [53 mmol/mol]) and conventional treatment (average HbA1c 7.9% [63 mmol/mol]) groups, the risk reduction for myocardial infarction was 16% and not statistically significant.20 In post-trial monitoring of UKPDS patients, 1 year after the end of the trial, no significant difference in HbA1c was present. Despite this, relative reduction in risk persisted at 10 years for risk reductions for myocardial infarction and all-cause mortality.17
Other clinical trials have been conducted to determine if cardiovascular events could be reduced further with lower HbA1c targets. In the Veterans Affairs Diabetes Trial (VADT), intensive glucose lowering was associated with a non-significant increase in cardiovascular events and no difference in total and cardiovascular mortality between intensive and standard treatment arms.21 In the Action to Control Cardiovascular Risk in Diabetes (ACCORD) trial, the study demonstrated no reduction in major cardiovascular events with intensive therapy (target HbA1c <6.0% [42 mmol/mol]) as compared to a standard glycaemic control (target HbA1c 7.0–7.9% [53–63 mmol/mol]), instead the study showed an increased rate of death from any cause and cardiovascular causes after a mean of 3.5 years.22 In the Action in Diabetes and Vascular Disease: Preterax and Diamicron Modified Release Controlled Evaluation (ADVANCE) trial, there was no significant differences in the number of macrovascular events between the intensive control (mean HbA1c 6.5% [48 mmol/mol]) and the standard control group (mean HbA1c 7.3% [56 mmol/mol]). A minor effect on cardiovascular disease was observed, with a 12% reduction in cardiovascular mortality, albeit not statistically significant.23 Relative risk reduction was observed for microvascular events, specifically diabetic nephropathy, in the intensive control group.23 The ADVANCE trial also demonstrated that, in the short term (3–5 years), tightening glycaemic control from moderate to tight levels of HbA1c (6–6.5% [42–48 mmol/mol]) had no significant effect in reducing macrovascular disease. In our study, we observed that the risk for all-cause mortality, IHD, and AMI increased significantly with HbA1c <6% (42 mmol/mol), and all 3 models had higher HRs (for HbA1c <6% [42 mmol/mol]) when HVS was included model (Figures 1 vs 2; Supplemental Tables 8 vs 9). This could suggest that at HbA1c <6% (42 mmol/mol), the increased risk of all-cause mortality, IHD, and AMI can be attributed to excess glucose lowering, hypoglycemia, and concomitant glycemic variability, a finding reported by other researchers.9,26
Our data also concur with other observational studies. In a large cohort study of the US Veterans Affairs Healthcare System, the Cox proportional hazards models showed a J-shape association between HBA1c and all-cause mortality. HbA1c <6% (42 mmol/mol) was associated with higher all-cause mortality compared with HbA1c 6% to 6.9% over short- (2–5 years) and long-term (>5 years) follow-up times but was associated only with higher short-term CVD mortality.27 In another large cohort study in Sweden, HbA1c outside the target range (≥7.0% [53 mmol/mol]) was the strongest predictor of AMI and stroke; in the Cox models a linear association was seen between HbA1c level and AMI, and a J-shape relationship between HbA1c and all-cause mortality, stroke, and heart failure was observed.24 Compared to these studies, our study provides more specific estimations of the risk between HbA1c and macrovascular complications by using fine HbA1c increments (0.5% [5.5 mmol/mol]).
Our study adds to the existing literature about the relationship between glycaemic control and the risks of DM-related macrovascular complications. Our results demonstrate that a J-shape relationship exists between HbA1c levels and the development of IHD, AMI, PAD, and ischemic stroke. In all models, the risk of all-cause mortality, IHD, AMI, PAD, and ischemic stroke increase incrementally at HbA1c ≥8.0% (≥64 mmol/mol) with overlaps in the 95% CI of the models; this finding is robust for models with and without HVS. We observed that at HbA1c levels <6.0% (42 mmol/mol), the adjusted HRs for all-cause mortality, IHD, AMI, PAD, and ischemic stroke were higher than the reference category (reference category ≥7.0% to <7.5% (≥53 mmol/mol to <58 mmol/mol)). Our study supports the growing body of evidence that tight glycaemic control to HbA1c <6.0% (42 mmol/mol) is not protective and idiosyncratically results in a high risk of DM-related macrovascular complications.3,24,27
The three models used in our analysis provided insights into the short- and long-term effects of glycaemic control on all-cause mortality and DM-related macrovascular complications. As mentioned earlier, models 1 and 2 (baseline mean and total exposure mean, respectively) were designed to study long-term effects, whereas model 3 (time-varying mean) was designed to study short-term effects.6 When compared to model 3, models 1 and 2 had larger HRs at HbA1c levels ≥8.0% (64 mmol/mol) for all-cause mortality, IHD, AMI, PAD, and ischemic stroke. This finding has two important implications. Firstly, model 1 suggests that historical HbA1c can have legacy effects. Historical hyperglycaemia may be associated with increased risk of all-cause mortality, IHD, AMI, PAD, and ischemic stroke. Lind et al reached a similar conclusion for all-cause mortality and AMI.28 Secondly, model 2 suggests that prolonged duration in hyperglycaemia is associated with increased risk of all-cause mortality, IHD, AMI, PAD, and ischemic stroke. Taken together, early glycaemic control coupled with the maintenance of HbA1c within ranges suggested by contemporary guidelines might be beneficial in reducing the risk of all-cause mortality and DM-related macrovascular complications.
Interestingly, we observed that for all-cause mortality, IHD, AMI, PAD, and ischemic stroke, at HbA1c levels <6.0% (42 mmol/mol) model 3 had higher HRs than models 1 and 2; with little to no overlap of 95% CIs between model 3 and those of models 1 and 2. This could suggest that tight glycaemic control (HbA1c levels <6.0% [<42 mmol/mol]) could increase the risk of all-cause mortality, IHD, AMI, PAD, and ischemic stroke in the short term. We are unable to explain the pathophysiological mechanism behind this finding. Additional research is needed to understand the effects of tight glycaemic control in the short and long term.
In our study, the relationship between HbA1c and haemorrhagic stroke was not clear in all models as HRs had very wide hazard ratios. In addition, more patients in the cohort had ischemic stroke (n=6213) than haemorrhagic stroke (n=1452) (see Supplemental Table 4). This finding suggests that there might be a lack of association between HbA1c and haemorrhagic stroke and is consistent with the findings of other studies on stroke patterns in diabetic patients. A recent meta-analysis found that the prevalence of diabetes was higher in people with ischemic stroke compared with haemorrhagic stroke.29 Another meta-analysis by Tsai et al found that compared to patients with haemorrhagic stroke, patients with ischemic stroke had a higher prevalence of diabetes.30 Our study supports the hypothesis that the pathophysiology underlying ischemic and haemorrhagic stroke is different.30
Previous studies have shown that variability in HbA1c increases risk of diabetes complications and mortality.5–7,26 Our findings are concordant with those of Forbes et al and Li et al who showed that patients with larger HVS scores were at greater risk of all-cause mortality6 and cardiovascular events.7 Addition of HVS in our models for glycaemic control altered the risk distribution for all-cause mortality, IHD, and AMI. For these outcomes, models with HVS had elevated HR at low HbA1c levels (HbA1c <6.0% [42 mmol/mol]) and a reduction in HR at high HbA1c levels (HbA1c ≥8.0% [64 mmol/mol]). Interestingly, Forbes et al observed a similar phenomenon for all-cause mortality and HVS.6 Our study adds to the growing body of evidence that suggests that frequent fluctuations of HbA1c in patients with diabetes may be an independent risk factor for poor prognosis and more stable HbA1c control may benefit patients in clinical practice.7
The underlying pathophysiological mechanisms to explain the association between glycaemic variability and increased cardiovascular risk remain unclear.6,7 In recent studies, it has been suggested that glycaemic variability was correlated with oxidative stress and erythrocyte membrane stability, mechanisms which are related to the pathogenesis of related complications.31,32
The strengths of our study include the use of a large multi-ethnic cohort to evaluate the effects of glycaemic control and glycaemic variability (using HVS) on all-cause mortality and five clinically important diabetes complications. Our study demonstrated consistent results across macrovascular end points. In line with existing evidence, we showed that glycaemic control and variability might underlie the development of ischemic stroke more so than haemorrhagic stroke. Our study data is based on real-world data of diabetes care in Singapore, making these results directly translatable to clinical practice. Finally, we used HVS, which is clinically more meaningful than SD or CV of HbA1c.6,7
We recognize some important limitations of our study. In the current study, we adjusted for risk factors at baseline, although we acknowledge that there could be residual confounding. Our results are based on observational data, and causal inference cannot be made. We were limited by not having data to adjust for overall comorbidity load. This limitation might be remedied in the future as efforts are underway to make the Charlson Comorbidity Index available in the SDR. We adjusted for diabetes medications during the baseline period but did not adjust for medications as a time-varying variable, this would be beyond the scope of this research but could be considered for future research. We did not adjust for CKD stage and albuminuria (using UACR) in our study because large amounts of data for CKD and albuminuria was missing. In a previous study, we noted that in 2013 and 2014, about 60% of the patients in the SDR had an annual kidney screen consisting of serum creatinine/estimated glomerular filtration rate (eGFR) and/or urine albumin–creatinine ratio (uACR) and/or urine protein–creatinine ratio (uPCR) test performed.33 Adjusting for CKD and albuminuria could be an area for future research as more physicians comply with process measures to screen for kidney disease regularly and data within the SDR become more complete. In our study, we studied glycaemic variability during the exposure period and did not calculate HVS for the whole follow-up period (ie from 2013 to the year before the participant died, an outcome event occurred, or the last year of follow-up). In our context, determining the HVS for the whole follow-up period might not be feasible as the SDR cohort is dynamic and detailed HbA1c records across the observation period (ie 2015 onwards) might not be available to accurately and meaningfully determine HVS scores. Our study evaluated DM-related complications in the medium term (6 years), there is evidence that the benefits of glycaemic control on cardiovascular complications might only be realized in the long term (>10 years);1,17 future studies using SDR could study cardiovascular complications in the long term. Lastly, as with studies using data from routinely collected data, the HbA1c data was not collected in a controlled time-specified way; a more regulated framework of data collection would have reduced potential measurement bias.6
Conclusions
In conclusion, our study shows that both low (<6.0% [42 mmol/mol]) and high (≥8.0% [64 mmol/mol]) levels of glycaemic control are associated with increased all-cause mortality and diabetes-related macrovascular complications. Glycaemic variability is positively associated with increased risk for these outcomes. Therefore, for diabetic patients, early glycaemic control coupled with the stabilization of HbA1c within the range 6.0–8.0% (42–64 mmol/mol) will reduce the risk of all-cause mortality and DM-related macrovascular complications.
Abbreviations
DM, diabetes mellitus; SD, standard deviation; CV, coefficient of variation; HVS, HbA1c variability score; SDR, Singhealth Diabetes Registry; EMR, electronic medical records; ICD-9, international classification of disease nine; ICD-10, international classification of disease 10; BMI, body mass index; LDL, low-density lipoprotein; PH, public housing; IHD, ischemic heart disease; PAD, peripheral arterial disease; AMI, acute myocardial infarction; HRs, hazard ratios; DPP4, dipeptidyl-peptidase-4; SGLT-2, sodium-glucose cotransporter-2; GLP-1, glucagon-like peptide-1.
Data Sharing Statement
The datasets generated during and/or analysed during the current study are not publicly available as the data belongs to the SingHealth Regional Health System and was collected as part of its routine activities, and not specifically for research purposes. Our institution has declined to allow this dataset to be placed in a public repository on the basis that there is sufficient information available for re-identification of individuals. Should there be interest in accessing the data to check our analyses, the data can be made available from the corresponding author on reasonable request.
Ethics Approval and Informed Consent
Ethics approval was obtained from the SingHealth Centralised Institutional Review Board prior to initiating this study (SingHealth CIRB reference number: 2022/2133). As all participant data was de-identified, a waiver for participant consent was also obtained.
Author Contributions
All authors contributed to data analysis, drafting or revising the article, have agreed on the journal to which the article will be submitted, gave final approval of the version to be published, and agree to be accountable for all aspects of the work.
Funding
This research is supported by A*STAR, Singapore under its Industry Alignment Pre-Positioning Fund (Grant No. H19/01/a0/023 – Diabetes Clinic of the Future). The funder supported the maintenance of the SingHealth Diabetes Registry for financial year 2022. The funder was not involved in the design of the study; the collection, analysis, and interpretation of data; writing the report; and did not impose any restrictions regarding the publication of the report.
Disclosure
The authors declare that they have no competing interests.
References
1. Huang ES, Davis AM. Glycemic control in older adults with diabetes mellitus. JAMA. 2015;314(14):1509. doi:10.1001/jama.2015.8345
2. Arnold LW, Wang Z. The HbA1c and all-cause mortality relationship in patients with type 2 diabetes is j-shaped: a meta-analysis of observational studies. Rev Diabet Stud. 2014;11(2):138–152. doi:10.1900/RDS.2014.11.138
3. Huang ES, Liu JY, Moffet HH, John PM, Karter AJ. Glycemic control, complications, and death in older diabetic patients: the diabetes and aging study. Diabetes Care. 2011;34(6):1329–1336. doi:10.2337/dc10-2377
4. Ceriello A, Monnier L, Owens D. Glycaemic variability in diabetes: clinical and therapeutic implications. Lancet Diabetes Endocrinol. 2019;7(3):221–230. doi:10.1016/S2213-8587(18)30136-0
5. Gorst C, Kwok CS, Aslam S, et al. Long-term glycemic variability and risk of adverse outcomes: a systematic review and meta-analysis. Diabetes Care. 2015;38(12):2354–2369. doi:10.2337/dc15-1188
6. Forbes A, Murrells T, Mulnier H, Sinclair AJ. Mean HbA 1c, HbA 1c variability, and mortality in people with diabetes aged 70 years and older: a retrospective cohort study. Lancet Diabetes Endocrinol. 2018;6(6):476–486. doi:10.1016/S2213-8587(18)30048-2
7. Li S, Nemeth I, Donnelly L, Hapca S, Zhou K, Pearson ER. Visit-to-visit HbA1c variability is associated with cardiovascular disease and microvascular complications in patients with newly diagnosed type 2 diabetes. Diabetes Care. 2020;43(2):426–432. doi:10.2337/dc19-0823
8. Yang CY, Su PF, Hung JY, Ou HT, Kuo S. Comparative predictive ability of visit-to-visit HbA1c variability measures for microvascular disease risk in type 2 diabetes. Cardiovasc Diabetol. 2020;19(1):1–10. doi:10.1186/s12933-020-01082-9
9. Lee S, Liu T, Zhou J, Zhang Q, Wong WT, Tse G. Predictions of diabetes complications and mortality using hba1c variability: a 10-year observational cohort study. Acta Diabetol. 2021;58(2):171–180. doi:10.1007/s00592-020-01605-6
10. Lim DYZ, Chia SY, Abdul Kadir H, Mohamed salim NN, Bee YM. Establishment of the SingHealth Diabetes Registry. Clin Epidemiol. 2021;13:215–223. doi:10.2147/CLEP.S300663
11. Lim DYZ, Wong TH, Feng M, Ong MEH, Ho AFW. Leveraging open data to reconstruct the Singapore Housing Index and other building-level markers of socioeconomic status for health services research. Int J Equity Health. 2021;20(1):218. doi:10.1186/s12939-021-01554-8
12. Chan CQH, Lee KH, Low LL. A systematic review of health status, health seeking behaviour and healthcare utilisation of low socioeconomic status populations in urban Singapore. Int J Equity Health. 2018;17(1):1–21. doi:10.1186/s12939-018-0751-y
13. StataCorp. Stata Statistical Software: Release 14. College Station, TX: StataCorp LP; 2015.
14. Ministry of Trade and Industry - Department of Statistics. Singapore Residents By Age Group, Ethnic Group and gender, end June, annual-data; 2020. Available from: https://data.gov.sg/dataset/resident-population-by-ethnicity-gender-and-age-group.
15. Perk J, De Backer G, Gohlke H, et al. European guidelines on cardiovascular disease prevention in clinical practice (version 2012). Eur Heart J. 2012;33(13):1635–1701. doi:10.1093/eurheartj/ehs092
16. Chia CW, Egan JM, Ferrucci L. Age-related changes in glucose metabolism, hyperglycemia, and cardiovascular risk. Circ Res. 2018;123(7):886–904. doi:10.1161/CIRCRESAHA.118.312806
17. Holman RR, Paul SK, Bethel MA, Matthews DR, Neil HAW. 10-year follow-up of intensive glucose control in type 2 diabetes. N Engl J Med. 2008;359(15):1577–1589. doi:10.1056/nejmoa0806470
18. Stratton IM, Adler AI, Neil HAW, et al. Association of glycaemia with macrovascular and microvascular complications of type 2 diabetes (UKPDS 35): prospective observational study. Br Med J. 2000;321(7258):405–412. doi:10.1136/bmj.321.7258.405
19. Ray KK, Seshasai SRK, Wijesuriya S, et al. Effect of intensive control of glucose on cardiovascular outcomes and death in patients with diabetes mellitus: a meta-analysis of randomised controlled trials. Lancet. 2009;373(9677):1765–1772. doi:10.1016/S0140-6736(09)60697-8
20. UK Prospective Diabetes Study (UKPDS) Group. Intensive blood-glucose control with sulphonylureas or insulin compared with conventional treatment and risk of complications in patients with type 2 diabetes (UKPDS 33). Lancet. 1998;352(9131):837–853. doi:10.1016/S0140-6736(98)07019-6
21. Abraira C. Cardiovascular events and correlates in the veterans affairs diabetes feasibility trial. Arch Intern Med. 1997;157(2):181. doi:10.1001/archinte.1997.00440230053007
22. Sciences HH, Miller ME, Byington RP, et al. Effects of intensive glucose lowering in type 2 diabetes. N Engl J Med. 2008;358(24):2545–2559. doi:10.1056/NEJMoa0802743
23. Heller SR. A summary of the ADVANCE Trial. Diabetes Care. 2009;32(Suppl 2):1–5. doi:10.2337/dc09-s339
24. Rawshani A, Rawshani A, Franzén S, et al. Risk factors, mortality, and cardiovascular outcomes in patients with type 2 diabetes. N Engl J Med. 2018;379(7):633–644. doi:10.1056/nejmoa1800256
25. Turner RC, Millns H, Neil HAW, et al. Risk factors for coronary artery disease in non-insulin dependent diabetes mellitus: United Kingdom prospective diabetes study (UKPDS: 23). Br Med J. 1998;316(7134):823–828. doi:10.1136/bmj.316.7134.823
26. Ceriello A, Lucisano G, Prattichizzo F, et al. HbA1c variability predicts cardiovascular complications in type 2 diabetes regardless of being at glycemic target. Cardiovasc Diabetol. 2022;21(1):1–9. doi:10.1186/s12933-022-01445-4
27. Raghavan S, Vassy JL, Ho YL, et al. Diabetes mellitus–related all-cause and cardiovascular mortality in a national cohort of adults. J Am Heart Assoc. 2019;8(4). doi:10.1161/JAHA.118.011295
28. Lind M, Imberg H, Coleman RL, Nerman O, Holman RR. Historical hba1c values may explain the type 2 diabetes legacy effect: ukpds 88. Diabetes Care. 2021;44(10):2231–2237. doi:10.2337/dc20-2439
29. Lau LH, Lew J, Borschmann K, Thijs V, Ekinci EI. Prevalence of diabetes and its effects on stroke outcomes: a meta-analysis and literature review. J Diabetes Investig. 2019;10(3):780–792. doi:10.1111/jdi.12932
30. Tsai CF, Anderson N, Thomas B, Sudlow CLM. Comparing risk factor profiles between intracerebral hemorrhage and ischemic stroke in Chinese and white populations: systematic review and meta-analysis. PLoS One. 2016;11(3):1–15. doi:10.1371/journal.pone.0151743
31. Rodrigues R, de Medeiros LA, Cunha LM, et al. Correlations of the glycemic variability with oxidative stress and erythrocytes membrane stability in patients with type 1 diabetes under intensive treatment. Diabetes Res Clin Pract. 2018;144:153–160. doi:10.1016/j.diabres.2018.01.031
32. Ohara M, Kohata Y, Nagaike H, et al. Association of glucose and blood pressure variability on oxidative stress in patients with type 2 diabetes mellitus and hypertension: a cross-sectional study. Diabetol Metab Syndr. 2019;11(1):1–10. doi:10.1186/s13098-019-0425-y
33. Tan JK, Salim NNM, Hsiang Lim G, Yi ChiaID S, Thumboo J, Mong Bee Y. Trends in diabetes-related complications in Singapore, 2013–2020: a registry-based study. Sasso FC, ed. PLoS One. 2022;17(10):e0275920. doi:10.1371/JOURNAL.PONE.0275920
 © 2023 The Author(s). This work is published and licensed by Dove Medical Press Limited. The
full terms of this license are available at https://www.dovepress.com/terms
and incorporate the Creative Commons Attribution
- Non Commercial (unported, 3.0) License.
By accessing the work you hereby accept the Terms. Non-commercial uses of the work are permitted
without any further permission from Dove Medical Press Limited, provided the work is properly
attributed. For permission for commercial use of this work, please see paragraphs 4.2 and 5 of our Terms.
© 2023 The Author(s). This work is published and licensed by Dove Medical Press Limited. The
full terms of this license are available at https://www.dovepress.com/terms
and incorporate the Creative Commons Attribution
- Non Commercial (unported, 3.0) License.
By accessing the work you hereby accept the Terms. Non-commercial uses of the work are permitted
without any further permission from Dove Medical Press Limited, provided the work is properly
attributed. For permission for commercial use of this work, please see paragraphs 4.2 and 5 of our Terms.
Recommended articles
Research Progress and Molecular Mechanisms of Endothelial Cells Inflammation in Vascular-Related Diseases
Xue J, Zhang Z, Sun Y, Jin D, Guo L, Li X, Zhao D, Feng X, Qi W, Zhu H
Journal of Inflammation Research 2023, 16:3593-3617
Published Date: 23 August 2023