Back to Journals » Diabetes, Metabolic Syndrome and Obesity » Volume 15
Association of Triglyceride-Glucose Index and Liver Function Parameters Among Healthy Obese Civil Servants: A Center-Based Study
Authors Pan X ![]() , Yue L, Ren L, Ban J, Chen S
, Yue L, Ren L, Ban J, Chen S
Received 7 October 2022
Accepted for publication 8 November 2022
Published 14 November 2022 Volume 2022:15 Pages 3519—3531
DOI https://doi.org/10.2147/DMSO.S392544
Checked for plagiarism Yes
Review by Single anonymous peer review
Peer reviewer comments 2
Editor who approved publication: Prof. Dr. Juei-Tang Cheng
Xiaoyu Pan,1,2 Lin Yue,3 Lin Ren,2 Jiangli Ban,2 Shuchun Chen1,2
1Department of Internal Medicine, Hebei Medical University, Shijiazhuang, Hebei, People’s Republic of China; 2Department of Endocrinology, Hebei General Hospital, Shijiazhuang, Hebei, People’s Republic of China; 3Department of Endocrinology, the Third Hospital of Shijiazhuang, Shijiazhuang, Hebei, People’s Republic of China
Correspondence: Shuchun Chen, Department of Internal Medicine, Hebei Medical University, 361 Zhongshan East Road, Shijiazhuang, Hebei, 050017, People’s Republic of China, Tel +86 31185988406, Email [email protected]
Purpose: To investigate the correlation between Triglyceride-glucose (TyG) index and liver function parameters in healthy obese civil servants in Shijiazhuang, China.
Materials and Methods: This was an outpatient-based cross-sectional study in which 6452 participants were recruited. A total of 784 participants were analyzed according to inclusion and exclusion criteria. A TyG index was calculated based on fasting glucose and triglycerides. All patients were divided into a high TyG index group and a low TyG index group, using the median TyG index as a cut-off. Finally, patients were further divided into two subgroups: males and females.
Results: While AST/ALT and direct bilirubin levels were lower in the high TyG index group compared to the low TyG index group, ALT, AST, total protein, and albumin levels were greater. Particularly in male participants, TyG index was inversely connected with AST/ALT and direct bilirubin levels and favorably correlated with ALT, AST, total protein, and albumin levels. These connections persisted in the multilinear regression study even after adjusting for confounding variables.
Conclusion: This study describes the correlation between TyG index and liver function parameters in obese populations without co-morbid diseases, providing a new idea for early interventional treatment in this group.
Keywords: TyG index, obesity, NAFLD, ALT, AST
Introduction
Obesity is a global health problem, and of the approximately 1.5 billion overweight people worldwide, about 200 million men and 300 million women are obese.1 One of the main causes of death worldwide is obesity and the diseases that it produces. Metabolic syndrome (MetS) and its associated comorbidities, such as type 2 diabetes mellitus (T2DM), nonalcoholic fatty liver disease (NAFLD), hypertension, hyperlipidemia, chronic renal disease, and cardiovascular disease (CVD), are brought on by obesity.2,3 Nearly a quarter of the world’s population now suffers with NAFLD, making it the most prevalent chronic liver disease. Obese people have a 25–30% greater prevalence of NAFLD than the overall population. NAFLD and obesity are well-known western illnesses. Changes in nutrition and lifestyle over the past three decades have paved the way for obesity and contributed to the rise of NAFLD in Asia. Despite having a lower BMI, Asians are more likely to have central fatty deposits, which suggests that the prevalence of NAFLD may be higher in this population. NAFLD, like other chronic liver illnesses, causes some individuals’ fibrosis to worsen, which then causes cirrhosis and accompanying complications.4 The majority of individuals can die from cardiovascular disease and metabolic syndrome since NAFLD and metabolic syndrome are closely related. In wealthy nations, obesity and NAFLD are widespread problems. There are many drugs on the pipeline that are reckoned as good candidates to cure NAFLD.5 The primary goal of efforts should be to prevent or lessen the impacts of obesity and NAFLD.
There is a significant correlation between the prevalence of obesity and NAFLD, and these two conditions reinforce one another. NAFLD may also have an impact on obesity through a number of mechanisms, such as liver dysfunction, hepatic insulin resistance (IR), and oxidative stress.6 Obesity promotes the development of NAFLD. Future hepatic steatosis and fibrosis progression is more apparent in those with higher IR. IR refers to the decrease in the efficiency of insulin to promote glucose uptake and utilization for various reasons, and the compensatory overproduction of insulin by the body to produce hyperinsulinemia, which predisposes to MetS and T2DM. Because it considers glucolipid metabolism, the triglyceride-glucose (TyG) index is currently thought to be a more accurate indicator for determining IR.7 Studies have shown that the TyG index is associated with NAFLD and therefore has the potential to predict this disease, and TyG has also recently been proposed to be associated with extrahepatic cancer.8,9 Additionally, since NAFLD’s early stages are typically asymptomatic, the prevalence and subsequent incidence of NAFLD linked to obesity can be seen as one of the worst health disasters in the coming ten years. The prognosis of patients depends greatly on early detection and prevention of NAFLD. Imaging tests can help with the diagnosis of NAFLD, however in the early stages of the illness, there are typically no visible imaging alterations. Transaminases and bilirubin are two liver function indices that have the potential to detect liver cell damage early and appear to be more useful for NAFLD early detection.10 It is unclear, though, how the TyG index and liver function metrics relate to an obese population. In order to better understand the relationship between TyG index and liver function parameters in the obese population, which is important for the early diagnosis of liver function impairment and the prevention of NAFLD in the obese population, this study included an obese population without comorbid diseases as the study population.
Materials and Methods
Study Population
This was an outpatient-based cross-sectional study. A total of 6452 adult participants were recruited from the Hebei Provincial Medical Examination Center from June 2022 to July 2022. Written informed consent was obtained from each subject. The study protocol was approved by the Ethics Committee of Hebei General Hospital in accordance with the principles of the Declaration of Helsinki (The number of ethics committee: No.202027). Inclusion criteria were obese people (BMI ≥ 28 kg/m2) aged ≥ 18 years and without coexisting diseases. Exclusion criteria: 1) non-obese population (BMI < 28 kg/m2) 2) hypertension, coronary artery disease or diabetes mellitus; 3) liver function impairment.; 4) pregnancy or lactation; 5) malignancy; 6) other diseases or medications that affect liver function; 7) lack of necessary data.
Data Collection
We collected demographic characteristics (age and sex), past medical history, anthropometric data (height, weight, waist and hip circumference), blood pressure, and personal habits (smoking and alcohol consumption). Blood parameters collected included fasting blood glucose (FBG), triglycerides (TG), total cholesterol (TC), high-density lipoprotein cholesterol (HDL-C), low-density lipoprotein cholesterol (LDL-C), total protein, albumin, globulin, alanine aminotransferase (ALT), aspartate aminotransferase (AST), total bilirubin, indirect bilirubin and direct bilirubin. All biochemical parameters were tested using venous blood samples following fasting for 8h. The same instrument was used for the measurement of all indicators.
Calculation of Parameters
The formula for calculating BMI is the ratio of weight (kg) to height2 (m2). The TyG index is calculated as Ln (fasting TG (mg/dl) × FBG (mg/dl)/2).
Statistical Analysis
All analyses were performed using GraphPad Prism 8.01 statistical software. Continuous variables were expressed as mean ± standard deviation and compared using independent samples t-test. Data that did not conform to a normal distribution were expressed as median (interquartile range: 25–75), and comparisons between groups were made using the Mann–Whitney U-test. Categorical variables were expressed as percentages and the chi-square test was used to compare differences between groups. Pearson’s correlation coefficient was used to assess the correlation between variables. Multiple linear regression was used to analyze independent influences. P<0.05 was considered statistically significant.
Results
Clinical Characteristics of All Participants
A total of 6452 participants were recruited, and 784 subjects underwent the next step of the study analysis based on inclusion and exclusion criteria. The screening flow chart of the study population can be seen in Figure 1. The 784 obese participants included 633 males and 151 females, with a mean age of 49.01 years and a mean BMI of 30.07 (kg/m2). The mean TyG index was 8.63. Detailed information on the clinical characteristics of the participants as well as liver function parameters are shown in Table 1.
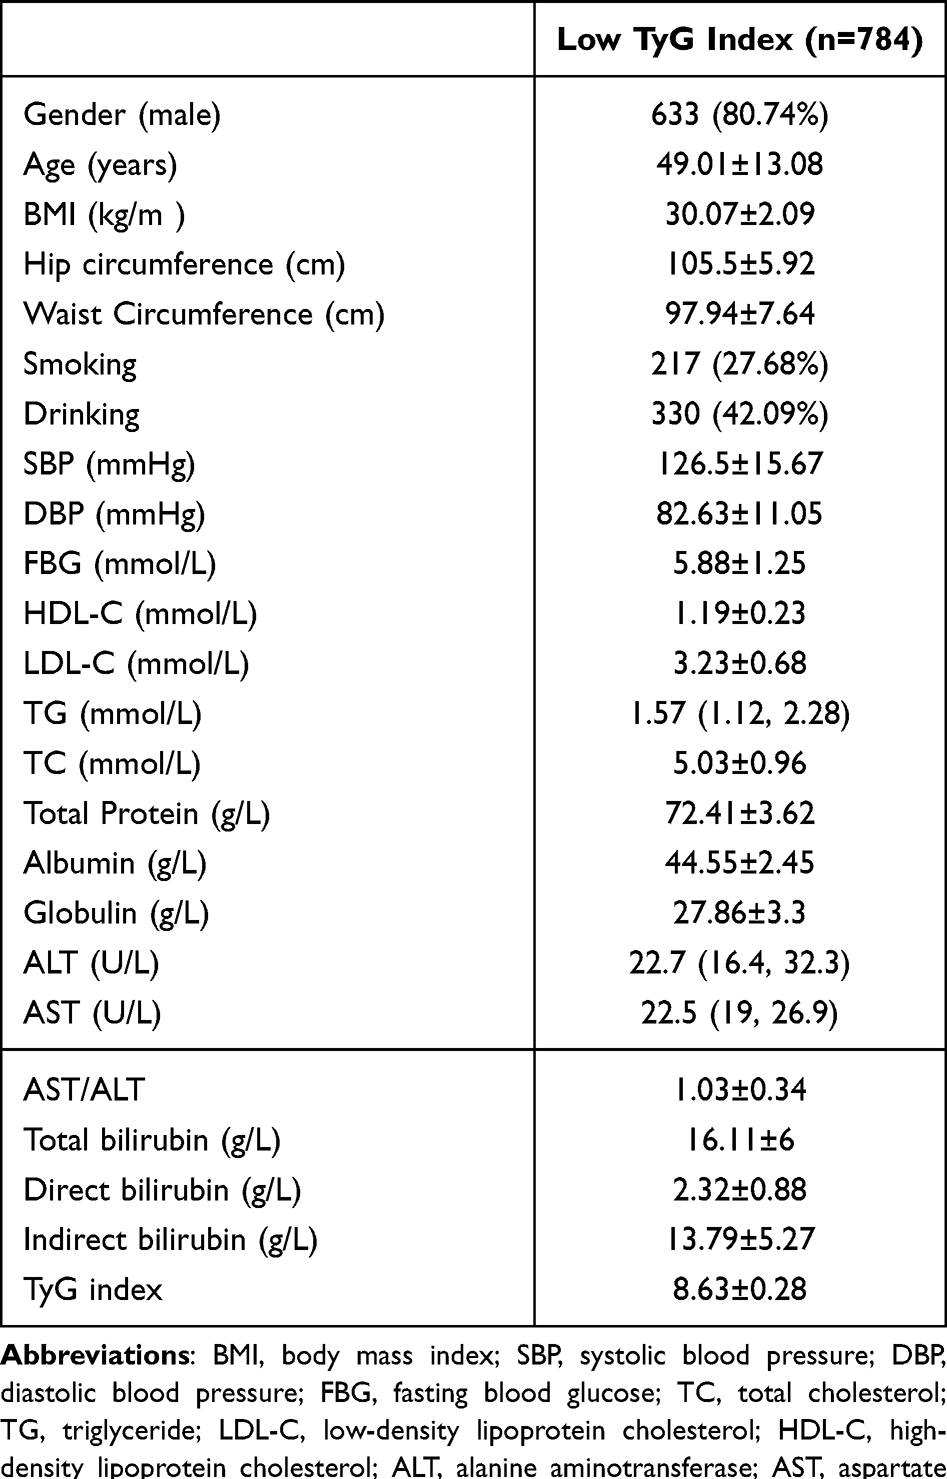 |
Table 1 Clinical Baseline Characteristics of All Included Populations |
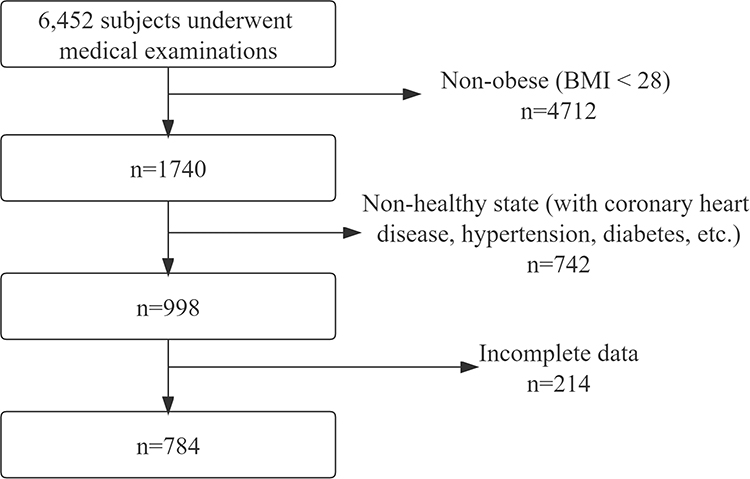 |
Figure 1 Flow chart of the included subjects. |
Comparison of Basic Parameters Between the Low TyG Index Group and High TyG Index Group
All participants were divided into a high TyG group and a low TyG group based on the median of the TyG index, with 387 participants in each group. The high TyG index group had higher levels of ALT, AST, direct bilirubin, total protein and albumin (P<0.001) (Figure 2A-E). However, AST/ALT was higher in the low TyG index group, suggesting that ALT was more elevated in the high TyG group than AST (P<0.001) (Figure 2F). Compared to the low TyG group, the high TyG group had higher FBG, LDL-C, TC, TG levels and waist circumference, while having lower HDL-C (P<0.001). Anthropometric and biochemical data in both the low TyG index group and the high TyG index group are presented in Table 2.
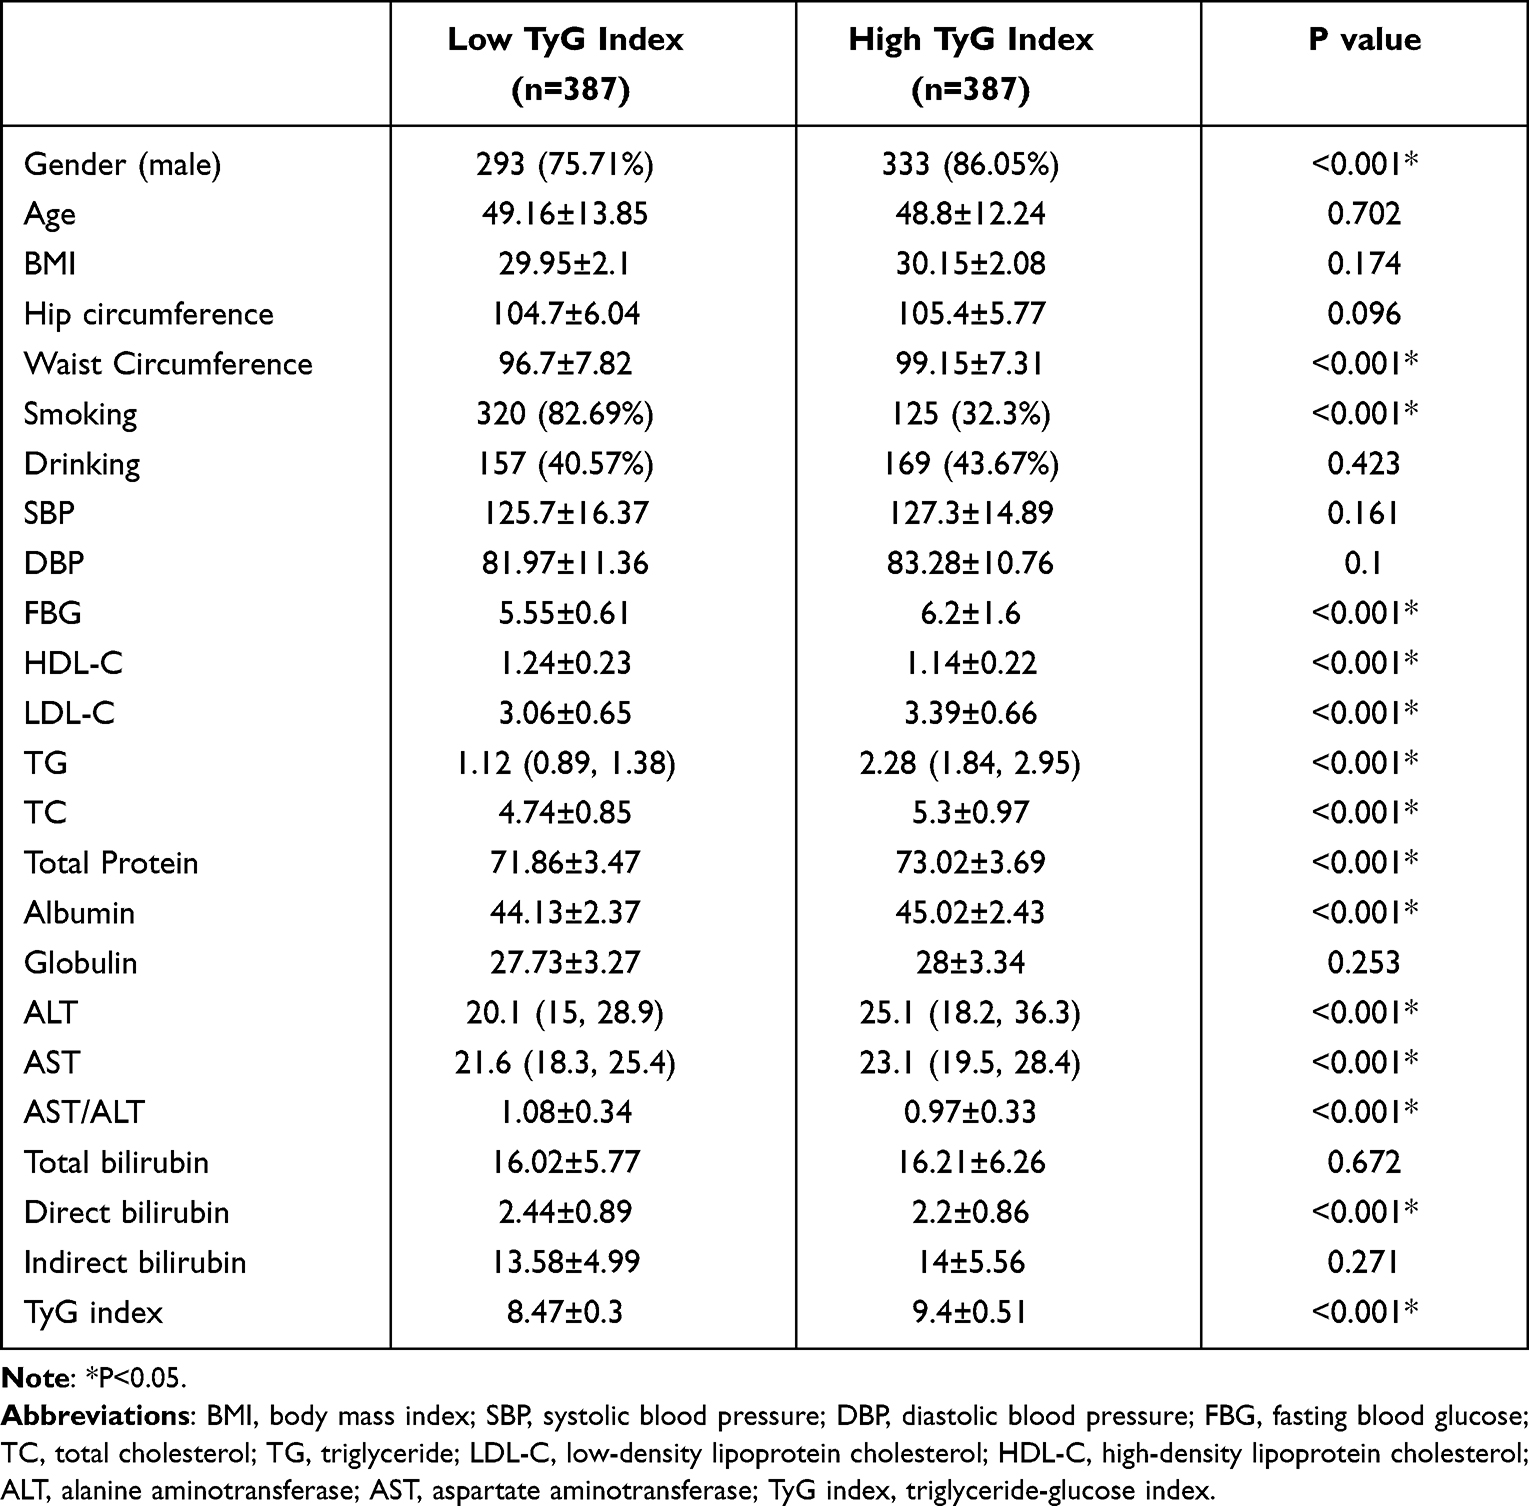 |
Table 2 Comparison of Indicators Between the Low-TyG and High-TyG Groups |
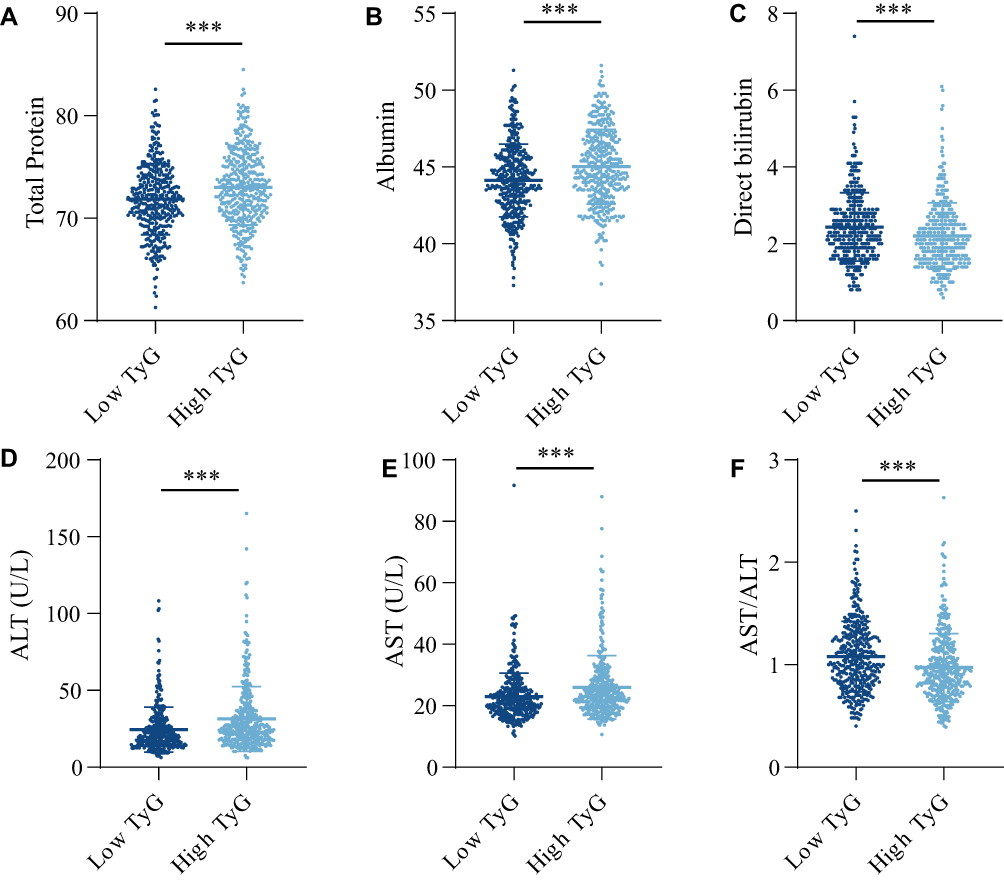 |
Figure 2 Comparison of liver function parameters between the low TyG index and high TyG index groups. (A) Total Protein. (B) Albumin. (C) Direct bilirubin. (D) Alanine aminotransferase (ALT). (E) Aspartate aminotransferase (AST). (F) AST/ALT. ***P<0.001. |
Comparison of Basic Parameters Between the Male Group and Female Group
The TyG index was higher in male participants compared to female participants (P<0.001). Albumin, globulin, ALT, AST, total bilirubin, direct bilirubin, indirect bilirubin and waist circumference were significantly higher in the male group than in the female group, while AST/ALT and HDL-C were higher in the female group (P<0.001). In addition, male participants had higher rates of smoking, alcohol consumption and SBP compared to female participants (P<0.001), while age, BMI, hip circumference and DBP did not differ significantly between the two groups (P>0.05). The comparative results of all basic information for the male and female groups are displayed in Table 3.
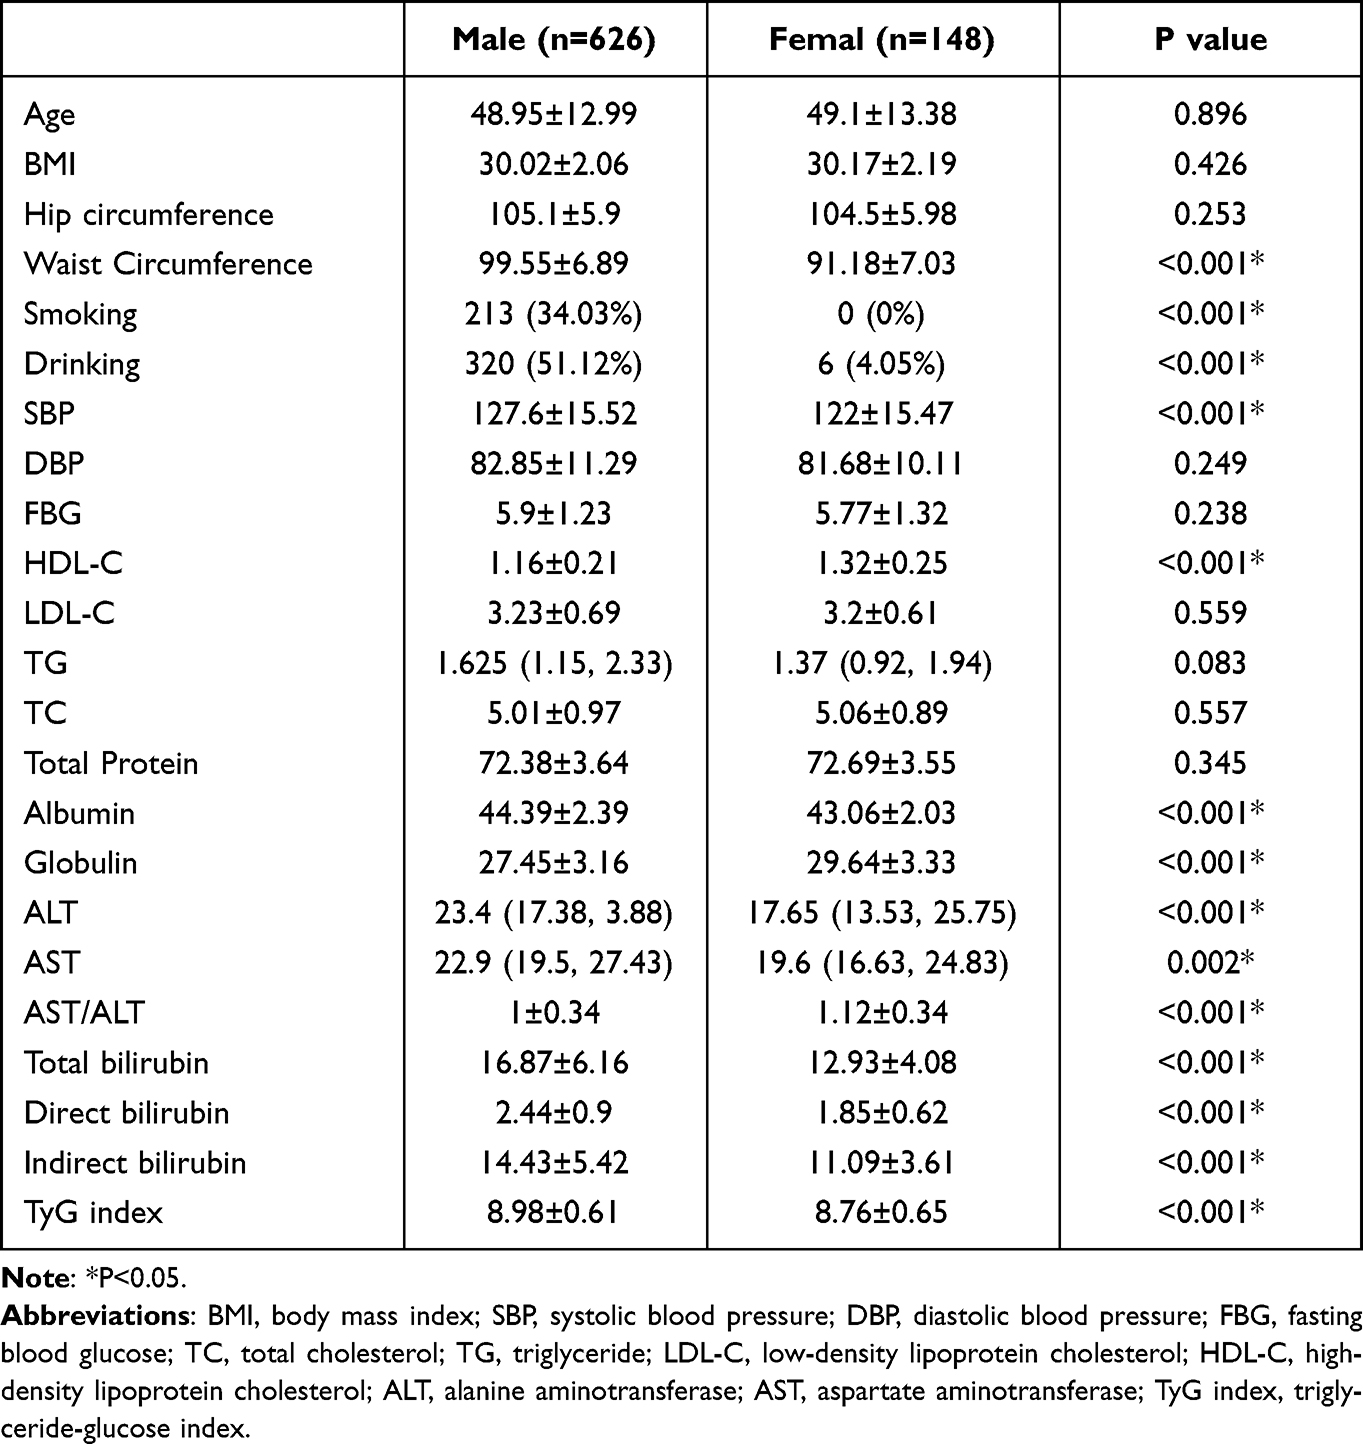 |
Table 3 Comparison of Indicators Between the Male and Female Groups |
Correlation of TyG Index with Liver Function Parameters in Obese Population
In all obese participants, TyG index was significantly positively correlated with total protein, albumin, ALT, and AST, and negatively correlated with AST/ALT, total bilirubin, and direct bilirubin (Figure 3 and Table 4).
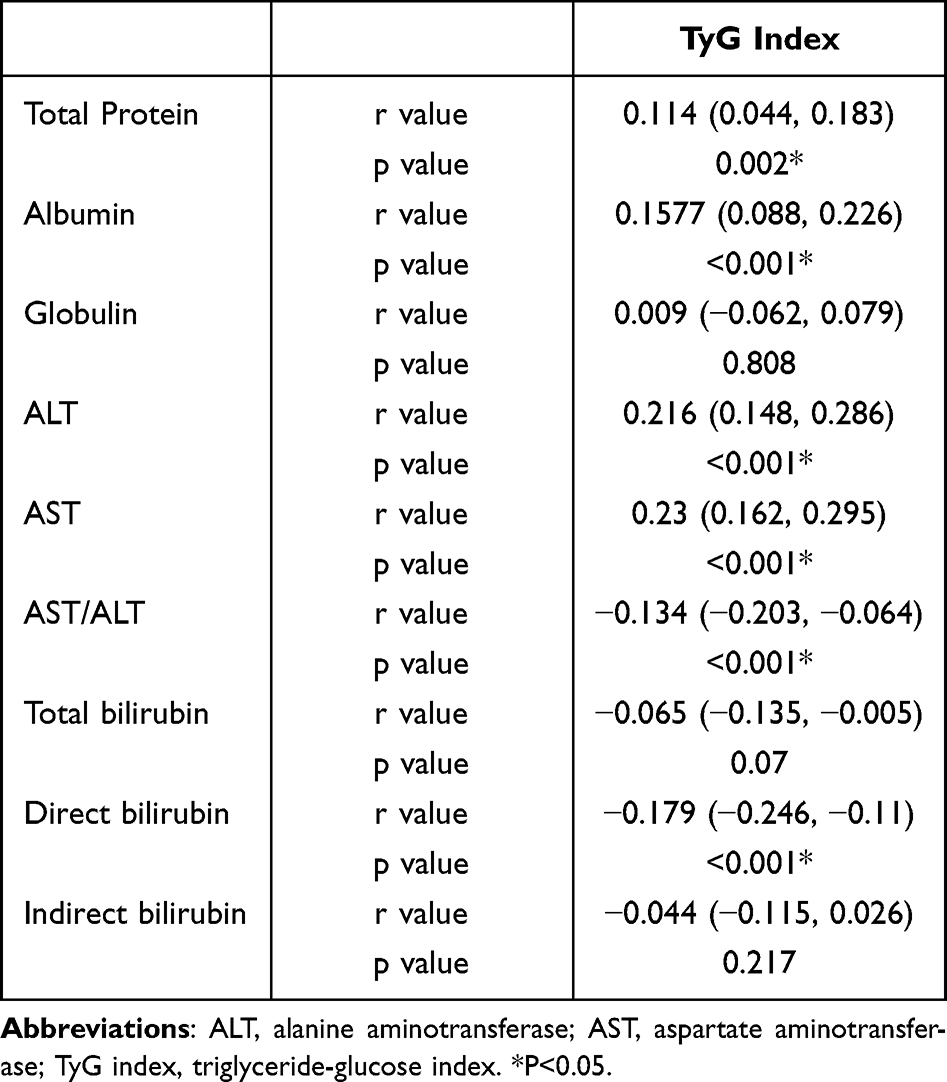 |
Table 4 Correlation Between TyG Index and Liver Function Parameters |
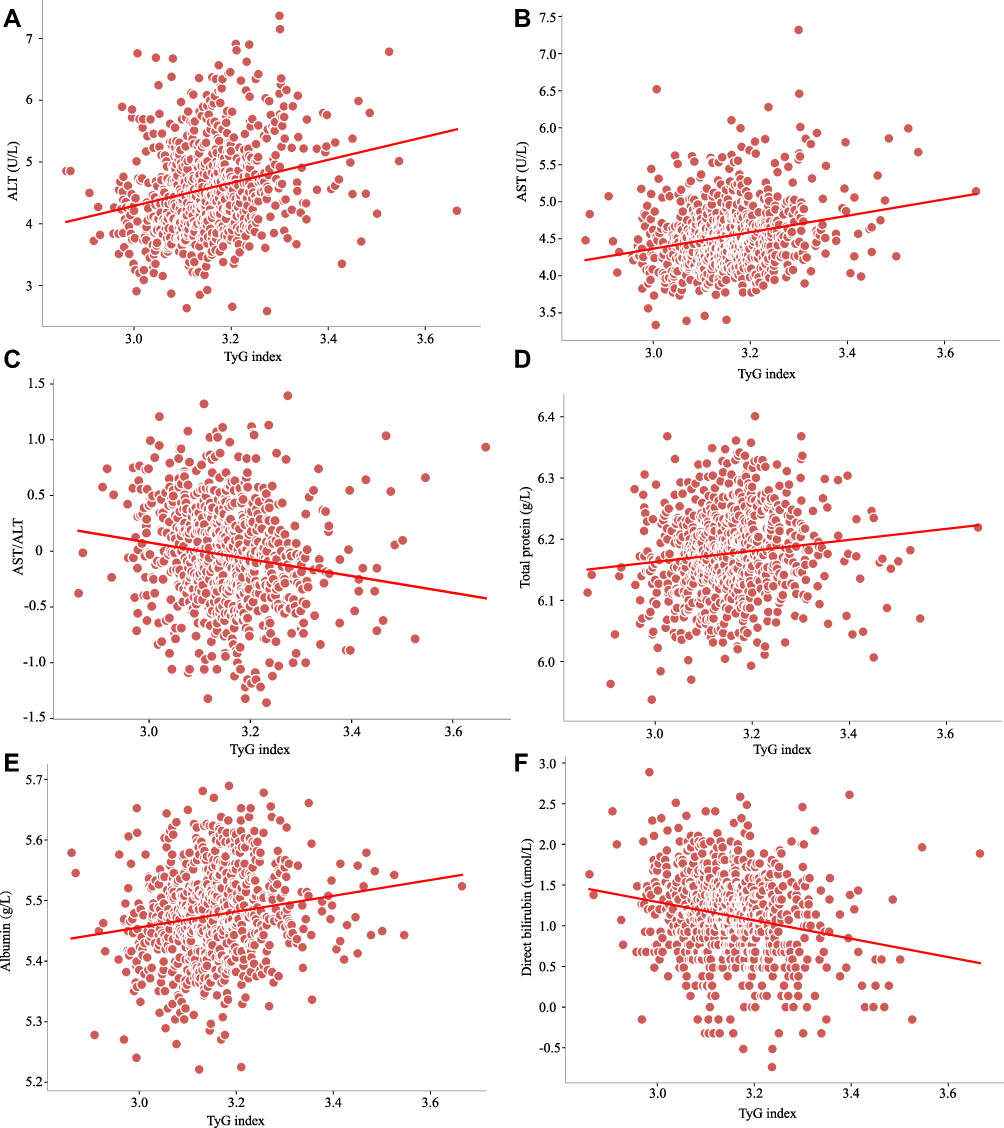 |
Figure 3 Correlation between TyG index and liver function parameters. (A) Alanine aminotransferase (ALT). (B) Aspartate aminotransferase (AST). (C) AST/ALT. (D) Total Protein. (E) Albumin. (F) Direct bilirubin. |
In male participants, TyG index was positively correlated with total protein, albumin, ALT, and AST, and negatively correlated with AST/ALT, total bilirubin, direct bilirubin, and indirect bilirubin. However, in female participants, TyG index was only positively correlated with albumin (Figure 4 and Table 5).
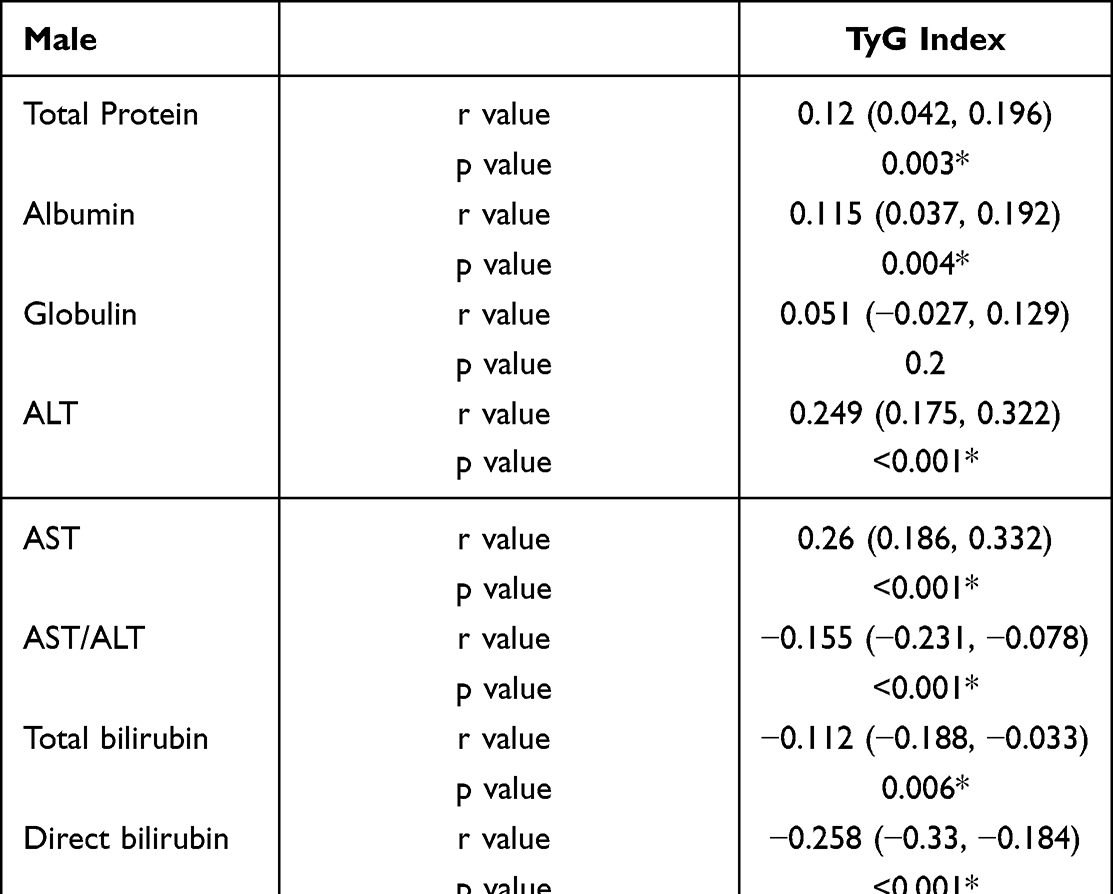 |
Table 5 Correlation Between TyG Index and Liver Function Parameters in Different Genders |
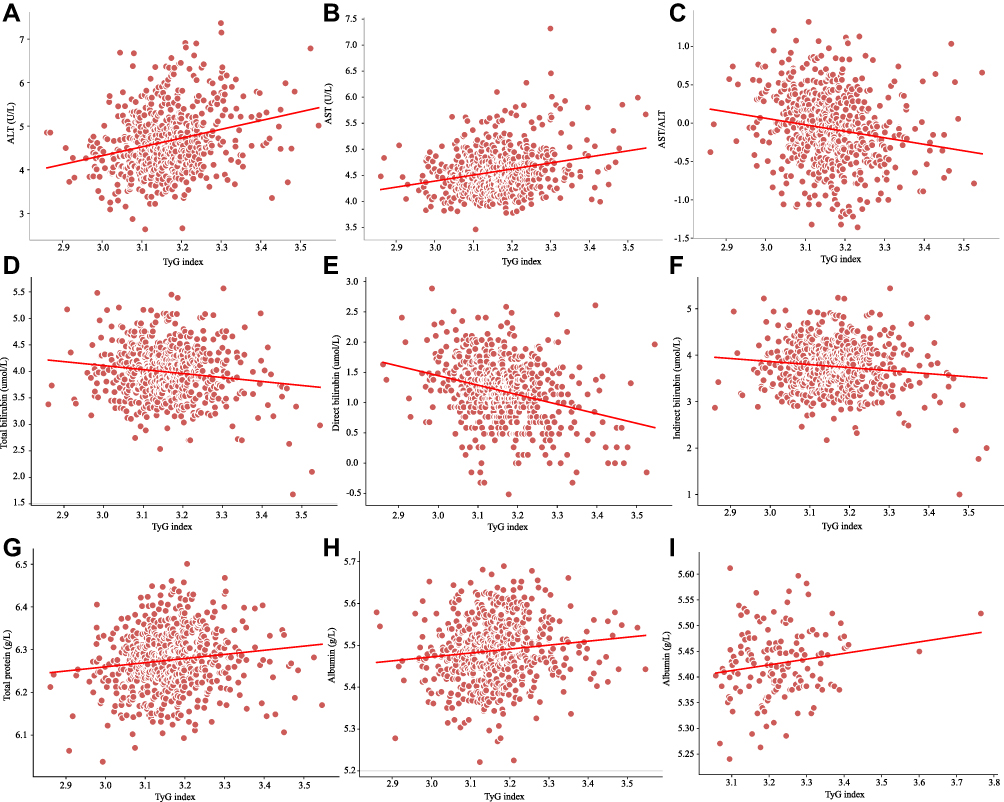 |
Figure 4 Correlation between TyG index and liver function parameters in different genders. (A) Alanine aminotransferase (ALT). (B) Aspartate aminotransferase (AST). (C) AST/ALT. (D) Total bilirubin. (E) Direct bilirubin. (F) Indirect bilirubin. (G) Total Protein. (H) Albumin. (I) Albumin. A-H indicates the correlation between TyG index and liver function parameters in males, while I indicates females. |
Multivariate Linear Correlation Analysis of TyG Index and Liver Function Parameters in Obese Population
In all participants, TyG index was positively correlated with total protein, albumin, ALT, and AST, while negatively correlated with AST/ALT, total bilirubin, and direct bilirubin in model 1 (unadjusted) and model 2 (adjusted for BMI, Hip circumference, Waist Circumference, SBP, and DBP) (Table 6).
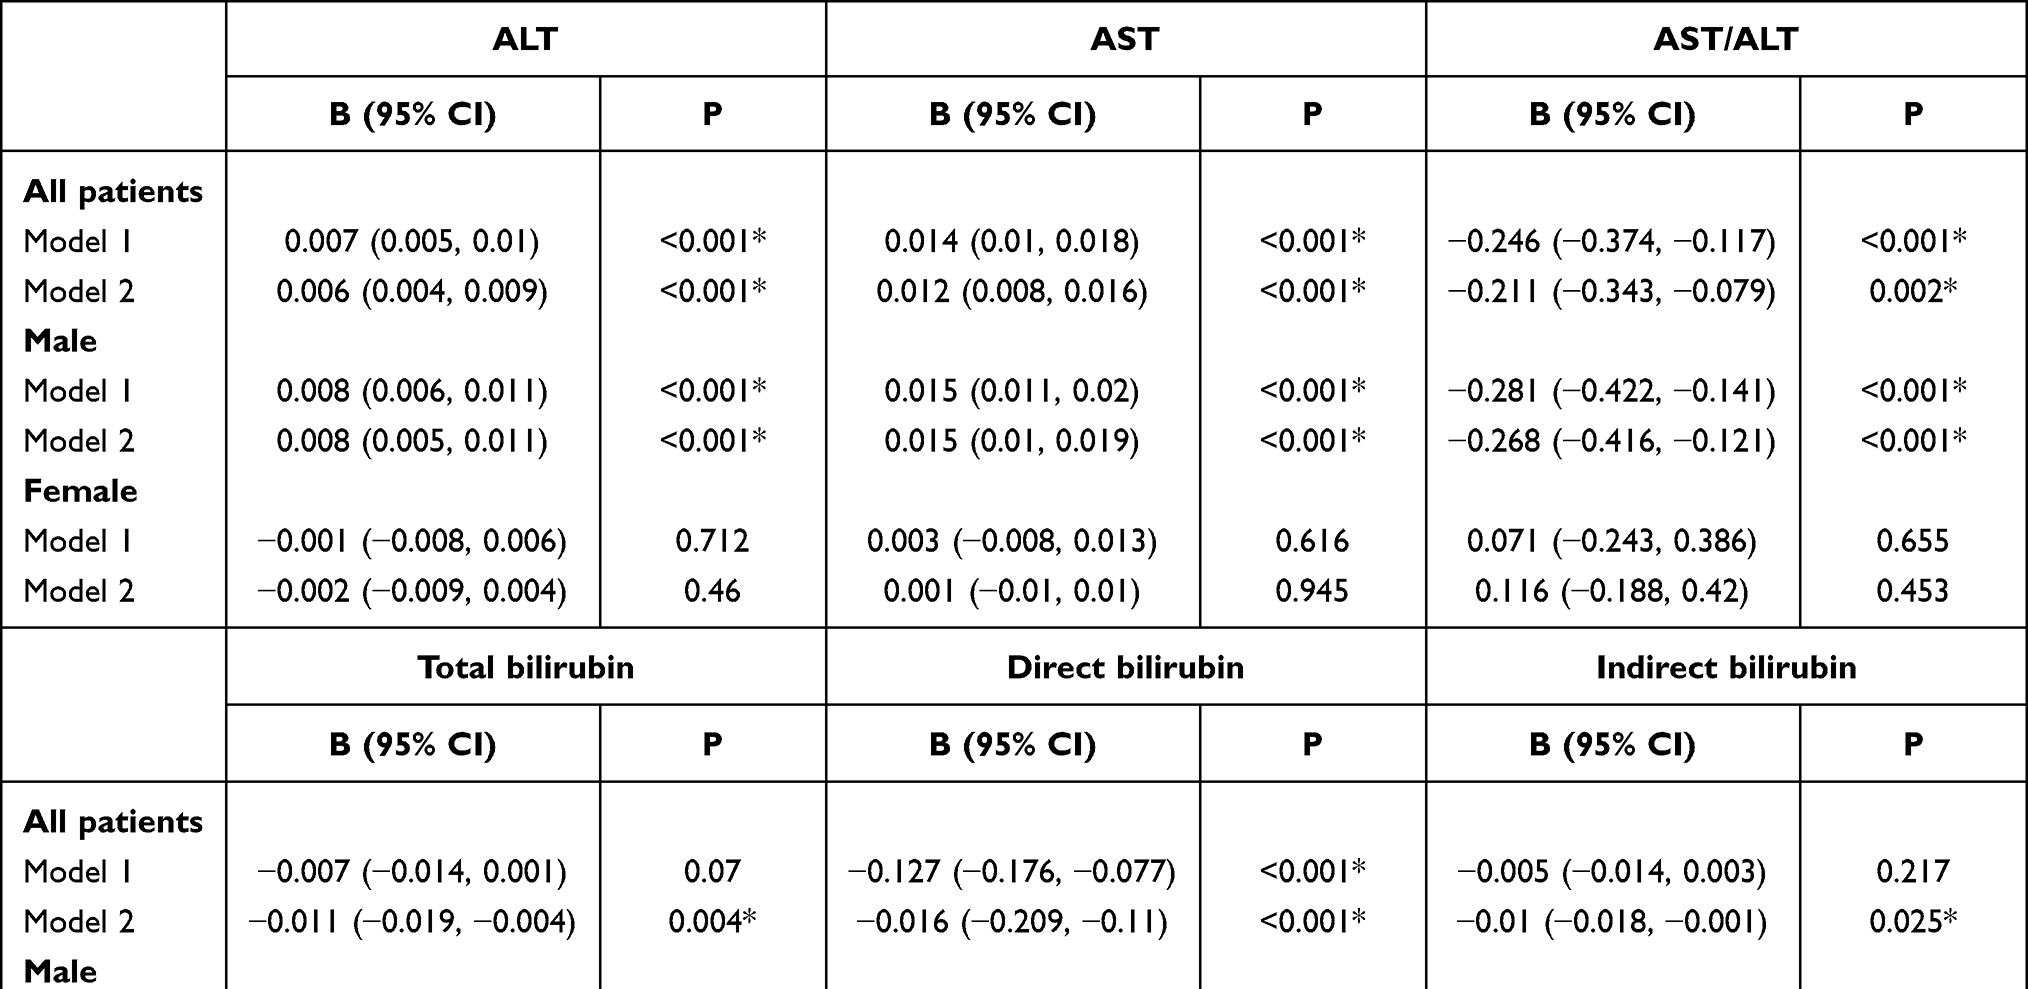 |
Table 6 Multivariate Linear Correlation Analysis of TyG Index and Liver Function Parameters in Obese Population |
In male participants, TyG index was positively correlated with total protein, albumin, ALT, and AST, and negatively correlated with AST/ALT, total bilirubin, direct bilirubin, and indirect bilirubin, regardless of adjustment models used or not used (Table 6). In female participants, there was no significant correlation between TyG index and albumin after adjustment for BMI, Hip circumference, Waist Circumference, SBP, and DBP (Table 6).
Discussion
A risk factor for NAFLD is obesity, and NAFLD also encourages the growth of obesity, where insulin resistance is a key element.11 TyG index, a measure of insulin resistance, and NAFLD had a favorable correlation.12 However, changes in liver enzymes and bilirubin levels can be an early predictor of hepatocyte function impairment, and thus may be an early sensitivity indicator for obese patients with NAFLD.13 Early on in the development of NAFLD, there are typically no clinical symptoms or even imaging changes. The relationship between TyG index and liver function indices in the obese population was investigated in this study, and we discovered various liver function parameters that varied between individuals with high and low TyG index.
ALT and AST are two of the most common indicators used to test liver function. ALT is mainly distributed in hepatocyte plasma, while AST is mainly distributed in hepatocyte plasma and mitochondria. Elevation of the former mainly reflects damage to the hepatocyte membrane, while elevation of the latter indicates gender damage to the level of organelles.14,15 Another popular measure of liver function is the ratio of AST to ALT, with levels below one denoting modest hepatocyte injury. In this study, it was discovered that AST and ALT levels were considerably greater in individuals with high TyG indices compared to those with low ones, which may indicate hepatocyte injury to some extent. The results of AST/ALT, on the other hand, were contrary, indicating a minor hepatocyte damage at the time and maybe the very early stages of NAFLD. The TyG index is an indicator of insulin resistance, and ALT and AST levels increase as the TyG index increases, suggesting that the TyG index may serve as a potential predictor and diagnostic indicator of early NAFLD.
In addition, this study indicated that male participants had higher levels of hepatocellular damage than female participants, which may be related to a higher TyG index in the male population. Male participants also had lower AST to ALT ratios and higher ALT and AST levels than female participants. Men may have a greater TyG index than women because of their larger waist circumference, higher rates of smoking, and higher rates of alcohol use. The higher TyG index also represents higher levels of insulin resistance.
The central nervous system has long been thought to be harmed by bilirubin, a hemoglobin breakdown product that includes direct and indirect bilirubin.16 An defective liver function is indicated by elevated bilirubin.17 Direct bilirubin stands out among them as a more precise gauge of hepatocyte activity, and an increase in it denotes hepatocellular injury. However, numerous studies have discovered an inverse relationship between moderately elevated serum bilirubin levels and some diseases, including obesity, diabetes, and coronary heart disease.18–20 The current study discovered a significant inverse link between reduced direct bilirubin levels and high TyG index, indicating that having a high TyG index may reduce the body’s antioxidant capacity and increase the risk of developing obesity and associated comorbidities. However, this study also discovered that men had greater bilirubin levels than women, which may be related to more severe hepatocellular damage brought on by the TyG index in men. Intriguingly, the TyG index and bilirubin levels in the male participants had a strong negative connection, indicating that the paradox may be brought on by the co-existence of diminished antioxidant capacity and hepatocyte injury.
The primary protein in plasma, albumin is primarily produced by hepatic parenchymal cells and serves as the clotting factor, substance binding, and colloid osmotic pressure regulator.21 Albumin contains a sulfhydryl group that can control how inflammatory cells signal, limiting the release of inflammatory chemicals and functioning inadvertently as an anti-inflammatory agent. This study discovered comparatively high albumin levels in persons with high TyG indices, which may be linked to increased synthesis as a result of higher TyG indices being associated with bigger waist circumference. However, whether increasing albumin boosts anti-inflammatory capacity in vivo is unknown and has to be confirmed by additional clinical and fundamental research. In addition, since this study is a cross-sectional study thus no causal relationship between TyG index and liver function parameters can be drawn, which needs to be clarified by further clinical observational trials.
This study has several limitations. First, it was a cross-sectional study and causality could not be determined. Secondly, this study did not measure fasting insulin levels and thus the Homeostasis model assessment index could not be calculated. This should be considered in future studies. Finally, a larger sample as well as a multicenter population study is needed to validate the findings of this study and make the results more reliable.
Conclusion
In this study, it was discovered that in the obese population, TyG index had a negative correlation with direct bilirubin and a positive correlation with ALT and AST. This implies that obesity, particularly in males, is an independent risk factor for liver damage and impaired antioxidant capacity. In the obese population, the elevated TyG index may be a possible predictor and early diagnostic sign of NAFLD.
Data Sharing Statement
Data supporting the results of this study are available upon reasonable request from the first author.
Ethical Approval
This study was performed in line with the principles of the Declaration of Helsinki. Approval was granted by the Ethics Committee of Hebei General Hospital (Date May 8, 2020/No. 202027).
Consent
Written informed consent was obtained from all participants.
Disclosure
The authors declare that they have no conflicts of interest in this work.
References
1. Finucane MM, Stevens GA, Cowan MJ, et al. National, regional, and global trends in body-mass index since 1980: systematic analysis of health examination surveys and epidemiological studies with 960 country-years and 9·1 million participants. Lancet. 2011;377(9765):557–567. doi:10.1016/S0140-6736(10)62269-6
2. Pan X, Chen S, Chen X, et al. UTP14A, DKC1, DDX10, PinX1, and ESF1 Modulate Cardiac Angiogenesis Leading to Obesity-Induced Cardiac Injury. J Diabetes Res. 2022;2022:2923291. doi:10.1155/2022/2923291
3. Nguyen PH, Tauseef S, Khuong LQ, et al. Underweight, overweight or obesity, diabetes, and hypertension in Bangladesh, 2004 to 2018. PLoS One. 2022;17(9):e0275151. doi:10.1371/journal.pone.0275151
4. Shen MC, Chiou SS, Chou SC, et al. Prevalence of non-Alcoholic Fatty Liver Disease and Associated Factors in Patients with Moderate or Severe Hemophilia: a Multicenter-Based Study. Clin Appl Thromb Hemost. 2022;28:10760296221128294. doi:10.1177/10760296221128294
5. Negi CK, Babica P, Bajard L, Bienertova-Vasku J, Tarantino G. Insights into the molecular targets and emerging pharmacotherapeutic interventions for nonalcoholic fatty liver disease. Metabolism. 2022;126:154925. doi:10.1016/j.metabol.2021.154925
6. Fan JG, Kim SU, Wong VW. New trends on obesity and NAFLD in Asia. J Hepatol. 2017;67(4):862–873. doi:10.1016/j.jhep.2017.06.003
7. Wei A, Liu J, Wang L, Zheng S, Cong H. Correlation of triglyceride-glucose index and dyslipidaemia with premature coronary heart diseases and multivessel disease: a cross-sectional study in Tianjin, China. BMJ Open. 2022;12(9):e065780. doi:10.1136/bmjopen-2022-065780
8. Sheng G, Lu S, Xie Q, Peng N, Kuang M, Zou Y. The usefulness of obesity and lipid-related indices to predict the presence of Non-alcoholic fatty liver disease. Lipids Health Dis. 2021;20(1):134. doi:10.1186/s12944-021-01561-2
9. Tarantino G, Crocetto F, Di Vito C, et al. Association of NAFLD and Insulin Resistance with Non Metastatic Bladder Cancer Patients: a Cross-Sectional Retrospective Study. J Clin Med. 2021;10(2):346. doi:10.3390/jcm10020346
10. Hadavi M, Najdegerami EH, Nikoo M, Nejati V. Protective effect of protein hydrolysates from Litopenaeus vannamei waste on oxidative status, glucose regulation, and autophagy genes in non-alcoholic fatty liver disease in Wistar rats. Iran J Basic Med Sci. 2022;25(8):954–963. doi:10.22038/IJBMS.2022.62167.13761
11. Jang JH, Lee JW, Cho MJ, et al. KLHL3 deficiency in mice ameliorates obesity, insulin resistance, and nonalcoholic fatty liver disease by regulating energy expenditure. Exp Mol Med. 2022;54(8):1250–1261. doi:10.1038/s12276-022-00833-w
12. Song S, Son DH, Baik SJ, Cho WJ, Lee YJ. Triglyceride Glucose-Waist Circumference (TyG-WC) Is a Reliable Marker to Predict Non-Alcoholic Fatty Liver Disease. Biomedicines. 2022;10(9):2251. doi:10.3390/biomedicines10092251
13. Vujkovic M, Ramdas S, Lorenz KM, et al. A multiancestry genome-wide association study of unexplained chronic ALT elevation as a proxy for nonalcoholic fatty liver disease with histological and radiological validation. Nat Genet. 2022;54(6):761–771. doi:10.1038/s41588-022-01078-z
14. Atilla A, Taşkın MH, Kazak Z, Aydın S, Kılıç SS. GP73 level in patients with chronic hepatitis B: relationship with liver biopsy, levels of ALT, AST and HBV DNA. Indian J Pathol Microbiol. 2022;65(1):55–58. doi:10.4103/IJPM.IJPM_1149_20
15. Li B, Xiao Q, Zhang J, et al. Exploring the active compounds and potential mechanism of the anti-nonalcoholic fatty liver disease activity of the fraction from Schisandra chinensis fruit extract fraction based on multi-technology integrated network pharmacology. J Ethnopharmacol. 2022;301:115769. doi:10.1016/j.jep.2022.115769
16. Duan H, Cheng Z, Yun HJ, et al. Serum Bilirubin Associated with Stroke Severity and Prognosis: preliminary Findings on Liver Function after Acute Ischemic Stroke. Neurol Res. 2022:1–8. doi:10.1080/01616412.2022.2119724
17. Dai L, Bin-Miao L, Xue-Mei O. Predictive value of neutrophil-to-lymphocyte ratio and bilirubin levels in the readmission of acute exacerbation of chronic obstructive pulmonary disease. Am J Med Sci. 2022;S0002(22):394. doi:10.1016/j.amjms.2022.05.026
18. Creeden JF, Gordon DM, Stec DE, Hinds TD. Bilirubin as a metabolic hormone: the physiological relevance of low levels. Am J Physiol Endocrinol Metab. 2021;320(2):E191–E207. doi:10.1152/ajpendo.00405.2020
19. Xu LJ, Song Y, Xu JJ, et al. Zhonghua Xin Xue Guan Bing Za Zhi. Zhonghua xin xue guan bing za zhi. 2018;46(5):352–358. doi:10.3760/cma.j.issn.0253-3758.2018.05.006
20. Kwon YJ, Lee HS, Lee JW. Direct bilirubin is associated with low-density lipoprotein subfractions and particle size in overweight and centrally obese women. Nutr Metab Cardiovasc Dis. 2018;28(10):1021–1028. doi:10.1016/j.numecd.2018.05.013
21. Xia Y, Qiu H, Wen Z, et al. Albumin level and progression of coronary artery lesions in Kawasaki disease: a retrospective cohort study. Front Pediatr. 2022;10:947059. doi:10.3389/fped.2022.947059
 © 2022 The Author(s). This work is published and licensed by Dove Medical Press Limited. The
full terms of this license are available at https://www.dovepress.com/terms
and incorporate the Creative Commons Attribution
- Non Commercial (unported, 3.0) License.
By accessing the work you hereby accept the Terms. Non-commercial uses of the work are permitted
without any further permission from Dove Medical Press Limited, provided the work is properly
attributed. For permission for commercial use of this work, please see paragraphs 4.2 and 5 of our Terms.
© 2022 The Author(s). This work is published and licensed by Dove Medical Press Limited. The
full terms of this license are available at https://www.dovepress.com/terms
and incorporate the Creative Commons Attribution
- Non Commercial (unported, 3.0) License.
By accessing the work you hereby accept the Terms. Non-commercial uses of the work are permitted
without any further permission from Dove Medical Press Limited, provided the work is properly
attributed. For permission for commercial use of this work, please see paragraphs 4.2 and 5 of our Terms.
Recommended articles
Metabolic and Hepatic Effects of Empagliflozin on Nonalcoholic Fatty Liver Mice
Niu S, Ren Q, Chen S, Pan X, Yue L, Chen X, Li Z, Zhen R
Diabetes, Metabolic Syndrome and Obesity 2023, 16:2549-2560
Published Date: 24 August 2023
Would Combination Be Better: Swimming Exercise and Intermittent Fasting Improve High-Fat Diet-Induced Nonalcoholic Fatty Liver Disease in Obese Rats via the miR-122-5p/SREBP-1c/CPT1A Pathway
Yang K, Liu C, Shao J, Guo L, Wang Q, Meng Z, Jin X, Chen X
Diabetes, Metabolic Syndrome and Obesity 2024, 17:1675-1686
Published Date: 12 April 2024
Diagnostic Accuracy of Non-Invasive Diagnostic Tests for Nonalcoholic Fatty Liver Disease: A Systematic Review and Network Meta-Analysis
Sun Y, Hu D, Yu M, Liang SB, Zheng Y, Wang X, Tong G
Clinical Epidemiology 2025, 17:53-71
Published Date: 28 January 2025