")
Back to Journals » Diabetes, Metabolic Syndrome and Obesity » Volume 16
Metabolic and Hepatic Effects of Empagliflozin on Nonalcoholic Fatty Liver Mice
Authors Niu S, Ren Q, Chen S, Pan X, Yue L, Chen X, Li Z, Zhen R
Received 9 June 2023
Accepted for publication 16 August 2023
Published 24 August 2023 Volume 2023:16 Pages 2549—2560
DOI https://doi.org/10.2147/DMSO.S422327
Checked for plagiarism Yes
Review by Single anonymous peer review
Peer reviewer comments 2
Editor who approved publication: Prof. Dr. Juei-Tang Cheng
Shu Niu,1,* Qingjuan Ren,1,* Shuchun Chen,2 Xiaoyu Pan,2,3 Lin Yue,4 Xing Chen,2 Zelin Li,2 Ruoxi Zhen3
1Department of Endocrinology, Shijiazhuang People’s Hospital, Shijiazhuang, Hebei, People’s Republic of China; 2Department of Endocrinology, Hebei General Hospital, Shijiazhuang, Hebei, People’s Republic of China; 3Department of Internal Medicine, Hebei Medical University, Shijiazhuang, Hebei, People’s Republic of China; 4Department of Endocrinology, The Third Hospital of Shijiazhuang, Shijiazhuang, Hebei, People’s Republic of China
*These authors contributed equally to this work
Correspondence: Shu Niu, Department of Endocrinology, Shijiazhuang People’s Hospital, Shijiazhuang, Hebei, People’s Republic of China, Email [email protected]
Purpose: Among chronic liver diseases, non-alcoholic fatty liver disease (NAFLD) is one of the commonest. Although empagliflozin has several therapeutic uses in treating cardiovascular and renal disorders, its impacts and mechanisms on NAFLD are poorly understood. This research aimed to examine the metabolic regulatory mechanism through which empagliflozin protects against NAFLD.
Methods: Equal grouping of twenty-seven male C57BL/6J mice into those fed a normal diet (NCD), those fed a high-fat diet (HFD), and those fed an HFD with empagliflozin (Empa) was approached. HE, oil red O staining, and Masson staining were utilized for evaluating the pathological damage to the liver and the mice’s liver and body weights. Lipids, blood glucose, and inflammation index were compared across the three groups. Liquid chromatography/mass spectrometry (LC-MS) has been employed for identifying liver metabolomics.
Results: The findings suggested that empagliflozin mitigated the inflammatory and oxidative stress response associated with the buildup of lipids caused by HFD. Differentially expressed metabolites (DEMs) were identified by metabonomics analysis as present in both the HFD/NCD and Empa/HFD groups. These DEMs were primarily found in lipids and organic acids like lysophosphatidylcholine (lysoPC), lecithin (PC), triglyceride (TG), palmitic acid, and L-isoleucine. Among the enriched pathways that were shown to be important were those involved in the metabolism of histidine, arachidonic acid, the control of lipolysis in adipocytes, and insulin resistance. There was a strong correlation between inflammation and oxidative stress in most of the metabolites. The inflammation and oxidative stress unbalance were ameliorated by empagliflozin.
Conclusion: NAFLD mice model showed considerable improvement in metabolic abnormalities and liver protection after treatment with empagliflozin. The process may include the overexpression of L-isoleucine and the downregulation of lysoPC, PC, TG, and palmitic acid to reduce liver harm caused by lipotoxicity.
Keywords: NAFLD, empagliflozin, metabolomics, differentially expressed metabolites, obesity
Corrigendum for this paper has been published.
Introduction
Obesity is a major public health problem because it raises the risk of death from cardiovascular disease, diabetes, and non-alcoholic fatty liver disease (NAFLD).1–3 NAFLD is a cause of chronic liver disease that is frequently overlooked despite its worldwide prevalence due to the buildup of hepatic fatty acids and fibrosis without excessive alcohol use.4 In addition to nonalcoholic steatohepatitis (NASH), nonalcoholic fatty liver (NAFL) is another significant subtype of NAFLD. The estimated prevalence of NAFLD ranges from 6–35% (median 20%) worldwide.5,6 Several different pathophysiologic mechanisms, such as inflammation, immunomodulation, increased IGF-1, JNK-1 activation, adipokines, apoptosis, oxidative stress, and alternations in the gut microbiota, contribute to NAFLD, NASH, and cirrhosis development.7 These processes are also believed to be crucial in the progression of NAFLD-related hepatocellular carcinoma.7 The association between NAFLD and hepatic fibrosis and liver and cardiovascular disease mortality is intriguing.8,9
In addition to improving cardiorenal and hepatic function,10–12 the sodium-glucose cotransporter 2 inhibitors (SGLT2i) extensively employed for treating type 2 diabetic mellitus (T2DM) can produce moderate weight reduction (2–3 kg). Multiple in vivo and in vitro investigations have shown that SGLT2i may be used as a treatment option for NAFLD.13–17 Like other SGLT2i, empagliflozin has been the subject of many randomized controlled studies.18–20 Despite this, there is a lack of research on the impacts and mechanisms of empagliflozin in obesity-related NAFLD. As a result, we created a model of obesity with NAFLD to examine its etiological factors.
Metabolomics is a technique that primarily yields information on the metabolic processes of tiny compounds. There has been extensive application of this systemic biological method in studies of NAFLD drug screening, drug impact assessment, and drug action mechanisms.21 Untargeted metabolomics shows promise as a tool for determining the concentration of light metabolites and intermediates in samples. However, there is little evidence that empagliflozin specifically targeted probable NAFLD metabolites. The purpose of this research was to investigate which metabolites and metabolic patterns that empagliflozin specifically target NAFLD.
Materials and Methods
Ethical Statement
All animal studies were conducted in accordance with the protocols established by the institution. The Treatment Committee and Animal Care at Hebei General Hospital in Shijiazhuang, China, has given its permission to all of the animal studies that will be conducted.
Animals and Experimental Design
Hebei Ivivo Biotechnology Co., Ltd. (Shijiazhuang, China) provided male 6-week old C57BL/6J mice, which were housed within a specific-pathogen-free (SPF)-media with a 12h day/night cycle, 60% relative humidity, and a temperature of (24 ± 2) °C. Mice were acclimated for a week before being randomly assigned to eat either a normal chow diet (NCD, n=9; consisting of 20%, 20%, and 4% of protein carbohydrates, and fats) or a high-fat diet (HFD group, n=18) throughout the remainder of the study. Mice were fed HFD for 12 weeks and then randomly assigned to either a HFD control group (n=9) or an empagliflozin one (Empa group; n=9) and treated with either normal saline or empagliflozin (Boehringer Ingelheim Pharmaceuticals) (10 mg/kg/d). Dosage recommendations for empagliflozin were established using results from previously conducted research.22–24 A similar phosphate-buffered saline (PBS) volume was administered to mice in the HFD and NCD groups. The mice were put to sleep with 40 mg/kg of pentobarbital sodium intraperitoneally and then slaughtered when they reached 24 weeks of age. To continue with the study, blood samples, and liver tissue were collected and frozen.
Intraperitoneal Glucose Tolerance Test
The German-obtained Roche glucose meter was utilized for monitoring blood sugar levels. Wuhan Ilerite Biotechnology Co., LTD (China) supplied the mouse insulin ELISA kits. After an overnight fast, the mice received glucose (2g/kg) through intraperitoneal injection. The mice blood was drawn at 0 and 15, 30 and 60, 90 and 120 minutes. Previous research25 used an intraperitoneal glucose tolerance test (IPGTT) to measure glucose tolerance within the body.
Biochemical Analysis
The serum was obtained by blood collection and centrifugation. Total cholesterol (TC), aspartate transaminase and alanine transaminases (AST and ALT), triglyceride (TG), low-density lipoprotein cholesterol (LDL-C), and high-density lipoprotein cholesterol (HDL-C) were all measured in the blood using specific test kits obtained from the Nanjing Jiancheng Bioengineering Institute in China.
Estimating Markers of Oxidative Stress and Inflammatory Cytokines
Oxidative stress markers, such as superoxide dismutase (SOD) and malondialdehyde (MDA), and inflammatory cytokines, such as tumor necrosis factor-α (TNF-α) and interleukin-1β (IL-1β), were measured via enzyme-linked immunosorbent assay (ELISA) kits. The IL-1β, IL-6, and TNF- α kits for mice were all bought from the Chinese company Hangzhou Lianke Biotechnology Co., LTD. Kits for measuring lipid peroxidation and superoxide dismutase activity in mice were received from the Nanjing Jiancheng Bioengineering Institute in China.
HE Staining
Before being embedded in paraffin and sectioned at 5 µm thickness, liver tissue was treated using a fixative (4% paraformaldehyde). The dissections then went through a process of dewaxing, rehydration, and staining. The microscope (Nikon ECLIPSE Ci-L, Tokyo, Japan) was employed for capturing the final pictures.
Oil Red O Staining
After the liver tissue was frozen, it was sectioned into 10-millimeter-thick slices. Oil red O staining was utilized to measure the accumulation of lipids in the liver. Image-pro plus 6.0 software (Media Cybermetrics, Rockville, MD, USA) was then employed for quantifying the lipid deposition area, and the proportion of lipid deposition area was then computed.
Masson Staining
Masson staining was used per manufacturer’s instructions to determine the severity of liver fibrosis. The CR2202127, G1006-100mL, Servicebio Masson staining kit could utilized for this investigation. Four mm slices were dehydrated in a graded ethanol series, stained with Wiegert’s hematin solution, and examined under the microscope. Lichun red acid fuchsin staining, phosphomolybdic acid differentiation, aniline blue staining, and a final wash in glacial acetic acid. This image was captured via a microscope.
Transmission Electron Microscopy (TEM)
Glutaraldehyde (2.5% at 4 °C) was employed for preserving liver tissue. Dehydrated in ethanol/propylene oxide, the tissue was implanted in epoxy resin after being fixed with 2% osmium tetroxide. Via an ultramicrotome (Leica UC7, Leica), the liver was sectioned at 70nm and uranyl acetate was approached for staining. Images were taken using a HT7700, Hitachi transmission electron microscope before section drying. The microscope was purchased in Tokyo, Japan. Using Image-proplus 6.0, autophagolysosomes and autophagosomes numbers were tallied.
Liver Metabolic Profiling
The liver sample was prepared by ultrasonic extraction in an ice bath and centrifugation. After transferring the extraction solution to a dry LC-MS vial, the water and methanol were redissolved in nitrogen. The material was kept in quiet for 2 hours at −20°C, after which the supernatant was centrifuged off. After filtering, the remaining liquid was collected as the supernatant and put through an LC-MS analysis. Progenesis QI v2.3 (Waters Corp., Milford, MA) was used to prepare the metabolomics data.
Metabolic Pathway and Data Analysis
Multivariate statistical analysis was carried out, including partial least squares discriminant analysis (PLS-DA), orthogonal partial least squares discriminant analysis (OPLS-DA), and principal component analysis (PCA), following the pre-processed data matrix first normalization. Statistical inference and univariate description were well-suited to univariate analysis. Student’s t-test and fold change (FC) analyses could be employed for comparing metabolites between the two groups. When OPLS-DA VIP was > 1, the student’s test p-value was < 0.05, or when the FC was > 1, differential metabolites screening criteria were statistically significant.
The enriched Kyoto Encyclopedia of Genes and Genomes (KEGG) pathway database was utilized for evaluating the different metabolites. To be deemed substantially associated, a route has to have an impact value larger than 0.05 and a P-value less than 0.05. A bubble map depicting the improved metabolic route was shown.
Statistical Analysis
The SPSS 23.0 statistical package was used to conduct the analysis and generate the resulting mean SD plots. One-way ANOVA was followed by the LSD test to determine statistical significance between groups. The P 0.05 threshold was employed for determining statistical significance. Graphpad Prism 8 was used for all data visualization.
Results
Blood Glucose and Obesity Caused by HFD Were Mitigated with Empagliflozin
C57BL/6J mice were given an HFD to create an in vivo model of NAFLD for the purpose of studying the effects of empagliflozin on NAFLD. Weight gain was more gradual in the HFD group than in the Empa group during the empagliflozin intervention (P0.001). As shown in Figure 1A, towards the conclusion of the 12th week of therapy, the HFD + Empa group’s body weight was comparable to that of the NCD group. Fasting blood glucose levels in the HFD group increased significantly (P<0.01), but insulin levels remained unchanged (P>0.05), in comparison to the NCD group. Empagliflozin remarkably diminished blood glucose and insulin levels, indicating that it could improve insulin resistance (P<0.01) (Figure 1B and C). Although the HFD group had higher fasting blood glucose levels, it did not meet the diagnostic criteria for diabetes. IPGTT results showed that empagliflozin significantly improved postprandial glucose and made it smoother (Figure 1D).
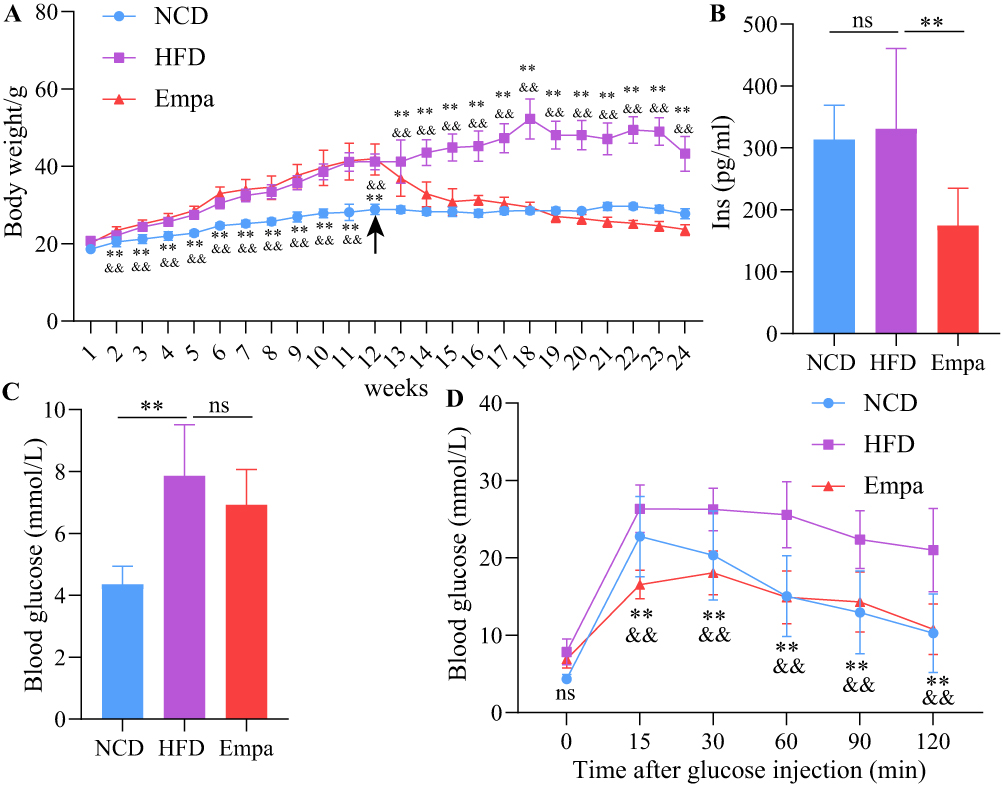 |
Figure 1 Empagliflozin ameliorated HFD-induced obesity and blood glucose. (A) Folding line graph of body weight change over time for each group of mice (n=9). The black arrow indicates the point in time when empagliflozin intervened. The ** on the first straight line indicates HFD vs NCD, P<0.01. **HFD vs NCD, p<0.01. &&HFD vs Empa, p<0.01. (B) Comparison of insulin levels in three groups of mice (n=8). (C) Comparison of fasting blood glucose levels in the three groups of mice (n=8). (D) IPTGG results. **HFD vs NCD, p<0.01. andand, HFD vs Empa, p<0.01. ns, P>0.05. Abbreviation: IPTGG, Intraperitoneal glucose tolerance test. |
The Effects of HFD on a Model of NAFLD Were Mitigated with Empagliflozin
To evaluate empagliflozin efficacy in the treatment of NAFLD, blood lipids and liver function were compared within different groups. The results suggested that lipid metabolism disorder in HFD mice as LDL-C, TC, and TG values with HFD were more remarkably elevated than within the NCD one (P<0.01). Moreover, empagliflozin remarkably lowered these parameters (P<0.01) (Figure 2A–C). However, HDL-C did not change significantly between the three groups (P>0.05) (Figure 2D). Furthermore, serum ALT and AST levels were lowered (P<0.05) after treatment with empagliflozin (Figure 2E and F), indicating that liver damage was ameliorated. The HFD group also had remarkably higher liver weight than the NCD one (P<0.01), however this difference was reversed following empagliflozin administration (P<0.01) (Figure 2G).
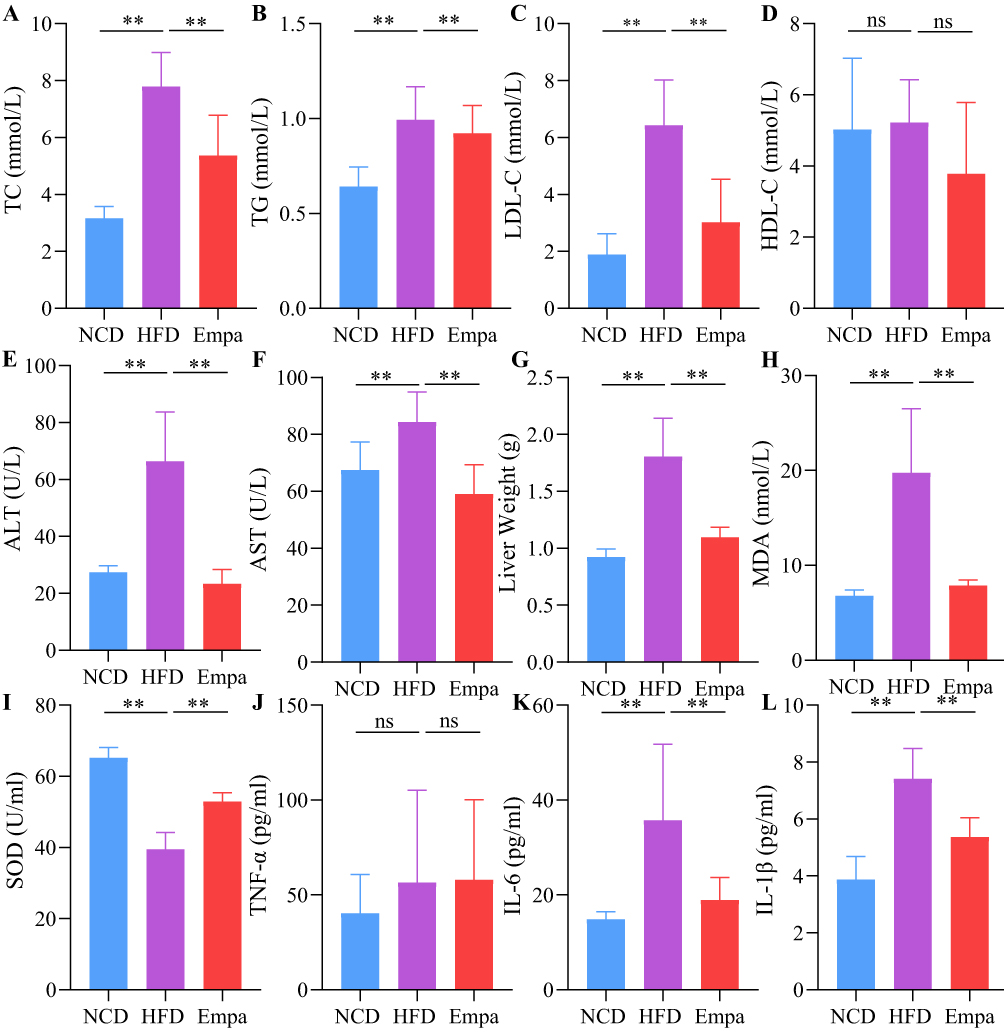 |
Figure 2 Empagliflozin alleviated lipid profile, liver damage, inflammation and oxidative stress. (A) TC. (B) TG. (C) LDL-C. (D) HDL-C. (E) ALT. (F) AST. (G) Liver weight of mice. N=8/group. (H) MDA. (I) SOD. (J) TNF-α. (K) IL-6. (L) IL-1β. N=4/group. ns, P>0.05. **P<0.01. Abbreviations: TC, total cholesterol; TG, triglyceride; LDL-C, low-density lipoprotein cholesterol; HDL-C, high-density lipoprotein cholesterol; ALT, alanine transaminase; AST, aspartate transaminase; SOD, superoxide dismutase; MDA, malondialdehyde; TNF-α, tumor necrosis factor-α; IL-6, interleukin-6; IL-1β, interleukin-1β. |
Empagliflozin Impacts on Inflammation and Oxidative Stress
We measured SOD and MDA serum levels to investigate whether empagliflozin could alleviate the oxidation-antioxidant imbalance in obese mice. As expected, HFD group mice showed excessive oxidative stress, that is SOD levels decreased and MDA values increased (P<0.01). Additionally, empagliflozin significantly increased SOD activities (P<0.01) and decreased MDA level (P<0.05), suggesting oxidation-antioxidant imbalance recovery (Figure 2H and I). We also measured levels of TNF-α, IL-6, and IL-1β in the blood. However, whereas TNF-α levels did not change substantially across groups, IL-6 and IL-1β expression levels were considerably higher in the HFD one (P<0.01), indicating the presence of an inflammatory response. Empagliflozin was shown to suppress the emergence of an inflammatory response as evidenced by a reduction in the expression levels of IL-6 and IL-1β after administration (P<0.01; Figure 2J–L).
Empagliflozin Impacts on Liver Histology Injuries
Under a microscope, those who had consumed the HFD had extensive diffuse hepatocyte steatosis, a high number of watery degeneration of liver cells, spherical vacuoles, cell swelling, and light staining. Masson stain showed similar results, with localized infiltration of lymphocytes but no apparent liver fibrosis in the HFD group. Statistically significant reductions were seen in the aforementioned indices with empagliflozin treatment (Figure 3A and B). The buildup of lipids that could be stained with oil red O was most evident in the HFD group. Figure 3C shows that after therapy with empagliflozin, the proportion of lipid droplet area decreased dramatically. However, the subtlety of the liver fibrosis and the subsequent changes in fibrosis following dosing were obscured by the relatively little modeling period.
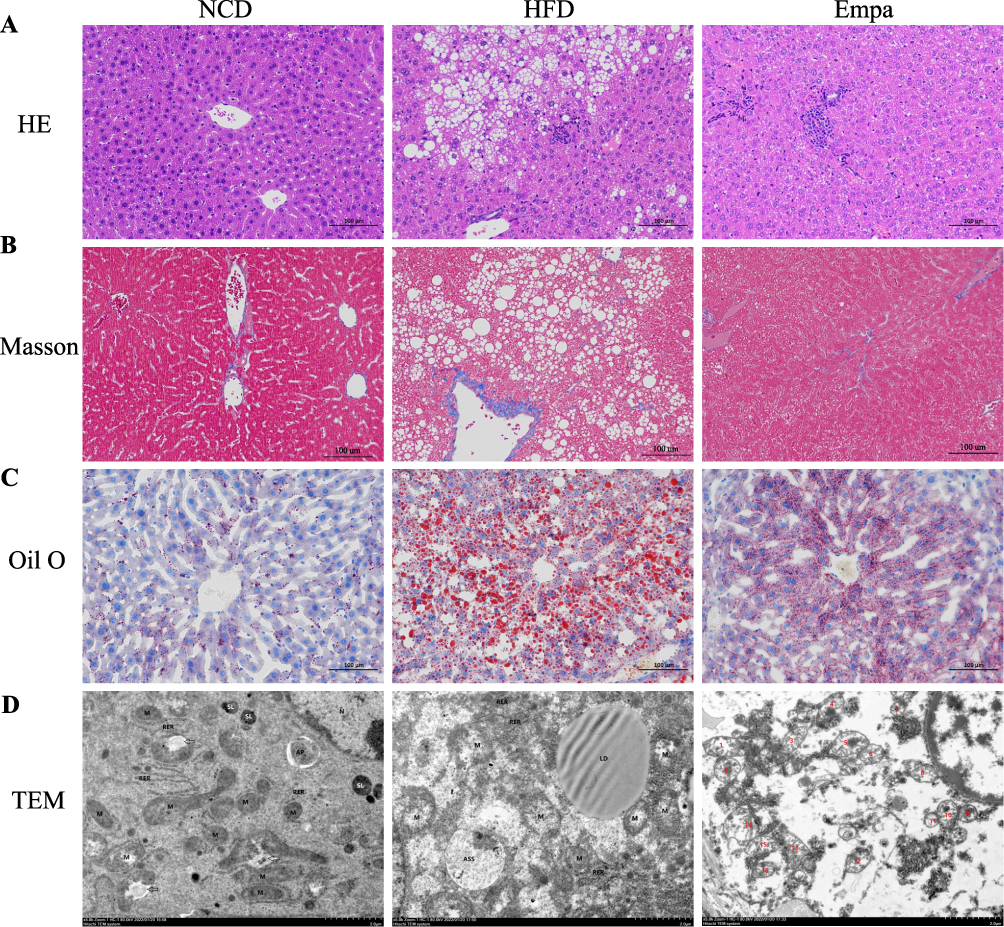 |
Figure 3 Effects of empagliflozin on liver histology injuries. (A) HE staining. (B) Masson staining. (C) Oil red staining. (D) TEM images showed the mitochondria, mitochondrial microautophagy structure and ribosomes. Abbreviation: TEM, Transmission electron microscopy. |
HFD group mitochondria swelled slightly, with the ridge fractured and shrank, and the intramembranous matrix partially disintegrated, as shown by transmission electron microscopy. As shown in Figure 3D, mitochondrial microautophagy was enhanced after empagliflozin intervention, with reduced swelling of the mitochondrial structure and a comparatively more ordered mitochondrial crest than the HFD group. Together, these findings show that empagliflozin has a protective impact on NAFLD, preventing its progression by doing things like decreasing hepatocyte steatosis and lipid deposition and easing mitochondrial damage.
Empagliflozin Impacts on Liver Metabonomics
Multivariate Analysis
We also conducted LC-MS on mouse liver tissue to see how empagliflozin impacted the liver’s metabolic profile. First, an apparent separation trend could be noted between the groups on the PCA score map (Figure 4A), suggesting that the system was stable and metabolically remarkable. The OPLS-DA score matrix clearly differentiated across subgroups. Also, the triangle representing Empa shifted to the point representing NCD, indicating that it considerably changed the metabolic state of the HFD group. Plots of the OPLS-DA scores (Figure 4B and C) revealed a remarkable split among the NCD and HFD groups, together with the HFD and Empa ones. These findings demonstrated the LC-MS technique reliability and consistency.
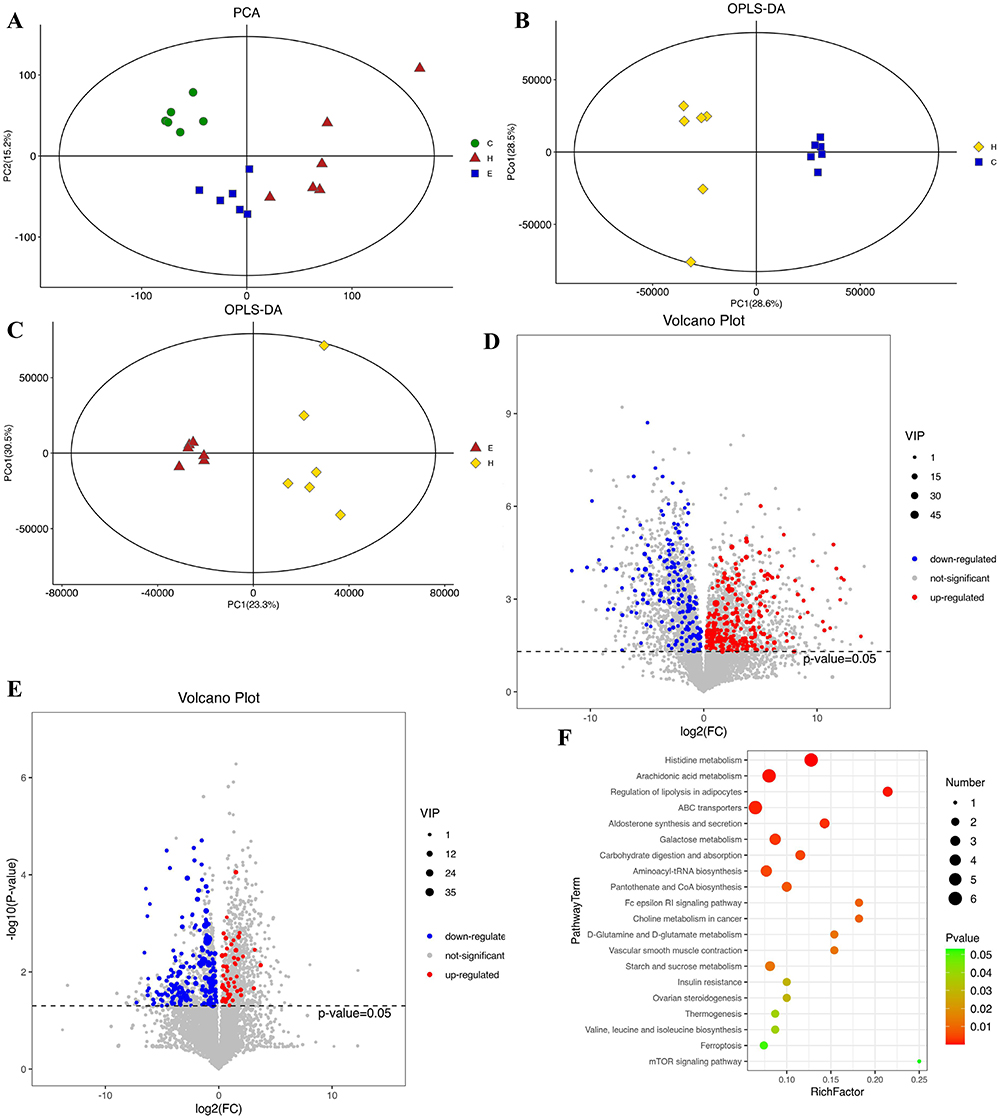 |
Figure 4 Effects of empagliflozin on liver metabonomics. (A) PCA score plot. (B) OPLS-DA score plot (HFD/NCD group). (C) OPLS-DA score plot (Empa/HFD group). (D) Volcano plot (HFD/NCD group). (E) Volcano plot (Empa/HFD group). (F) Top 20 KEGG enrichment pathway bubble maps. Abbreviations: PCA, Principal component analysis; OPLS-DA, Orthogonal partial least squares discriminant analysis; KEGG, Kyoto Encyclopedia of Genes and Genomes. |
Metabolites and Pathway Analysis
Metabonomic analysis revealed that the HFD/NCD group experienced 263 and 179 up- and down-regulated differentially expressed metabolites (DEMs), while the Empa/HFD group experienced 50 and 192 up- and down-regulated DEMs metabolites, respectively (Figure 4D and E). The HFD/NCD and Empa/HFD groups shared 19 relevant DEMs, most of which were embodied in lipids and organic acids. According to the VIP and P value, a total of 19 metabolites were isolated and characterized (Table 1). Empagliflozin had the opposite influence on these metabolites. Furthermore, eighteen metabolites were found to be elevated in the HFD group than the NCD one. A number of metabolites, including β-D-glucose, D-galactose, D-glutamine, D-urobilinogen, glutathione, glycerophosphocholine, and L-glutamine, are down-regulated in response to empagliflozin treatment. Mesobilirubinogen, Palmitic acid, Stachyose, TG(16:0/16:1(9Z)/18:1(9Z), 4,5-LTA4, Mexiletine, LysoPC(20:4(8Z,11Z,14Z,17Z), N-Ethyl trans-2-cis-6-nonadienamide, PC(15:0/0:0), LysoPC(16:0), and Monocrotaline are all examples of polyunsaturated fatty acids. However, after taking empagliflozin, the L-Isoleucine levels in the HFD group rose, whereas they had fallen in the NCD group. It was hypothesized that oxidative stress and inflammation-related metabolites were directly improved by empagliflozin.
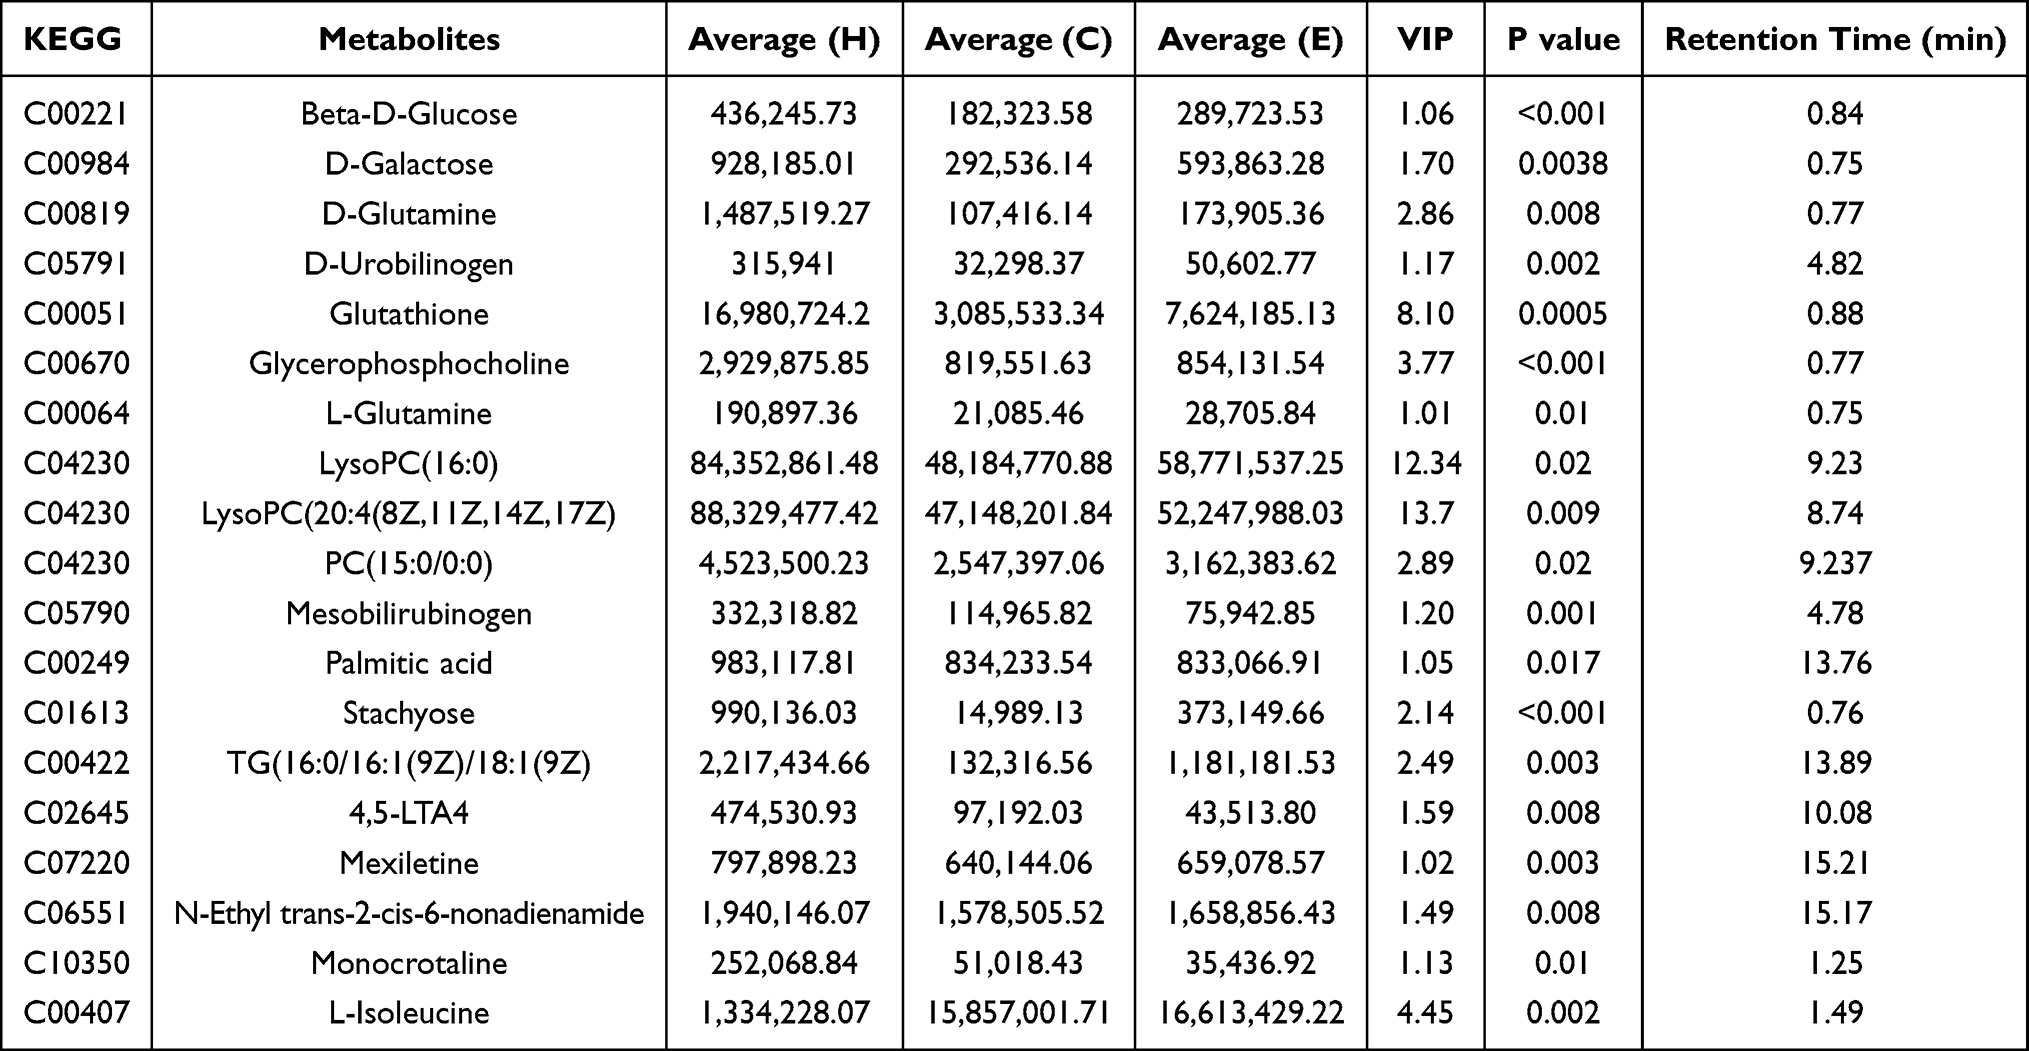 |
Table 1 Overlapping Differential Metabolites in the HFD/NCD and Empa/HFD Groups |
Finally, KEGG enrichment analysis showed that the related enrichment pathways of hepatic differential metabolites after empagliflozin administration included histidine and arachidonic acid metabolism, adipocyte lipolysis regulation, and galactose and insulin resistance-related metabolism (Figure 4F).
Discussion
NAFLD is a clinicopathological syndrome characterized by vacuolar steatosis of the liver. Although NAFLD has been a worldwide health problem, the definitive pathogenesis leading to hepatic lipid accumulation, inflammation and fibrosis is unknown. SGLT2 inhibitors have been approved as hypoglycemic agents for the treatment of type 2 diabetes, and previous studies have shown that empagliflozin may reduce body weight, improve insulin resistance and reduce liver injury in NAFLD.26 A previous clinical study in a population with type 2 diabetes showed that the combination of empagliflozin and metformin in the treatment of NAFLD improved hepatic steatosis, gammaglutaminase levels, body weight, and glycosylated hemoglobin after a 6-month follow-up compared with metformin alone. However, in obese populations without concomitant diabetes mellitus, it is not clear whether empagliflozin is an improvement in NAFLD, and in addition the molecular mechanisms are unclear.27 Recently metabolomic approaches have become a major tool to identify potential biomarkers and targets for pharmacological intervention, however the effects of empagliflozin on obesity-associated NAFLD mice and metabolomics-based mechanisms have not been well studied. In this study, we evaluated the effects of empagliflozin on high-fat diet-fed C57BL/6 mice model, which is prone to hepatic steatosis and replicates most of the metabolic features of human NAFLD. Therefore, this model can be used for the study of NAFLD and related metabolic syndromes.28
To some extent, elevated lipids and weight gain are typical of NAFLD and are often accompanied by elevated liver indices. ALT and AST are typical indicators of liver injury and in most cases reflect the state of hepatocyte damage. Our HFD-fed mice showed significant elevation of these liver enzymes, and this increased level was reduced after empagliflozin treatment. The first critical step in the development of NAFLD is the abnormal accumulation of lipids in the liver. Fatty liver is caused by abnormal lipid deposition and imbalance in the removal of toxic lipids, including TG, free fatty acids (FFA), lysophosphatidylcholine (lysoPC), ceramides and free cholesterol, leading to lipotoxicity and glucotoxicity.29 One study found that liver lipidomic analysis of Ces2a-ko mice fed HFD showed significantly elevated levels of lysoPC, which may be associated with abnormal lipid signaling due to reduced lysoPC hydrolytic activity, thus exacerbating the development and progression of NAFLD.30 Lecithin (PC) is a group of yellowish-brown oily substances found in animal and plant tissues and egg yolk and is a source of lipid messengers such as lysophosphatidylcholine, phosphatidic acid, triglycerides and arachidonic acid. Palmitic acid is a long-chain saturated fatty acid and palmitic acid levels are positively associated with the risk of developing NAFLD.31 To confirm the role of empagliflozin in the regulation of lipid metabolism, we performed liver tissue metabolomics assays. Consistent with the above study, metabolomic analysis of mouse liver in our study showed that lysophosphatidylcholine (lysoPC), lecithin (PC), TG, and palmitic acid were significantly upregulated in the HFD group, but the intervention of empagliflozin inversely regulated these lipids. L-Isoleucine, a beneficial branched-chain amino acid (BCAA), was previously reported to promote fatty acid β-oxidation and ketone body production.32 Fatty acid β-oxidation is considered to be the main mechanism of hepatic clearance of toxic lipids and is involved in the upregulation of peroxisomal and mitochondrial genes.33 The present study suggests that L-isoleucine was significantly downregulated in the HFD group (compared to the NCD group) but significantly upregulated after empagliflozin treatment (compared to the HFD group). There were also corresponding changes in liver histology, and the results of oil red O staining indicated that empagliflozin treatment attenuated the formation of lipid droplets in liver tissue. In conclusion, empagliflozin reduced lipid droplet formation and inhibited adipose tissue breakdown by downregulating lysoPC, PC, TG, and palmitic acid, accelerated toxic lipid clearance by upregulating L-Isoleucine, and attenuated lipotoxicity-induced liver injury by metabolite changes.
The second key step in the development of NAFLD is the occurrence of inflammation, oxidative stress, apoptosis and fibrosis in the liver and is caused by lipotoxicity.34 The present study showed that the expression of serum inflammation-related factors IL-6 and IL-1β was significantly increased in the HFD group, however, the levels of both IL-6 and IL-1β expression were significantly decreased after the administration of empagliflozin. Serum levels of SOD and MDA reflected oxidative-antioxidative stress imbalance. Empagliflozin restored the oxidative-antioxidative imbalance, significantly increased SOD activity, and decreased MDA levels. D-Galactose is a naturally occurring aldose, and there is increasing evidence that increased expression of D-Galactose exacerbates inflammatory responses, oxidative stress, and apoptosis.35 This is consistent with the results of the present study, in which D-Galactose was significantly upregulated in the HFD group, but the expression of D-Galactose was greatly decreased by empagliflozin treatment. 4,5-LTA4 is a precursor of leukotrienes, a classical class of pro-inflammatory lipid metabolism intermediates that trigger and amplify the inflammatory response.36 4,5-LTA4 was significantly upregulated in the HFD group, whereas the expression of leukotrienes was significantly decreased by empagliflozin treatment. 4,5-LTA4 was significantly upregulated in the HFD group, whereas 4,5-LTA4, the precursor of leukotrienes, was significantly downregulated after empagliflozin treatment. These results demonstrate the occurrence of inflammation and oxidative stress in the HFD group and that empagliflozin inhibits inflammation and oxidative stress.
Furthermore, mitochondrial dysfunction plays a central role in the pathophysiology of NAFLD because it affects hepatic lipid homeostasis and promotes lipid peroxidation, cytokine release and cell death.37 Therefore, we observed changes in mitochondrial structure. Transmission electron microscopy showed mild swelling of mitochondria, partial breakage and shrinkage of mitochondrial cristae, localized dissolution of intra-membrane matrix, and visible mitochondrial microautophagic structures and ribosomes in the HFD group. Empagliflozin improved the mitochondrial structure in NAFLD mice, resulting in swollen mitochondrial cristae and relatively more organized mitochondrial cristae. A limitation of this study is the lack of further confirmation from in vitro experiments, which should be further evaluated in future studies.
Conclusions
In conclusion, empagliflozin significantly reduced body weight, improved disorders of glucolipid metabolism, reduced hepatic lipid deposition and maintained oxidative-antioxidative stress balance in NAFLD model mice. Empagliflozin reduced lipid droplet formation and inhibited adipose tissue breakdown by down-regulating lysoPC, PC, TG and palmitic acid, and accelerated toxic lipid clearance by up-regulating L-isoleucine, thereby attenuating lipotoxicity-induced liver injury.
Data Sharing Statement
Data supporting the findings of this study are available from the corresponding authors.
Reasonable request.
Ethical Approval
The animal experimental procedures were approved by the Animal Ethics Committee of Hebei General Hospital.
Funding
This study was supported by the Hebei Provincial Medical Science Research Project (20230218). This funding source did not influence the study outcomes, and the authors were free to interpret the data in accordance with a strict scientific rationale.
Disclosure
Shu Niu and Qingjuan Ren contributed to the work equally and should be regarded as co-first authors. The authors declare that they have no known competing financial interests or personal relationships that could have appeared to influence the work reported in this paper.
References
1. Pan X, Yang L, Wang S, Liu Y, Yue L, Chen S. Semaglutide ameliorates obesity-induced cardiac inflammation and oxidative stress mediated via reduction of neutrophil Cxcl2, S100a8, and S100a9 expression. Mol Cell Biochem. 2023. doi:10.1007/s11010-023-04784-2
2. Andres-Hernando A, Lanaspa MA, Kuwabara M, et al. Obesity causes renal mitochondrial dysfunction and energy imbalance and accelerates chronic kidney disease in mice. Am J Physiol Renal Physiol. 2019;317(4):F941–F948. doi:10.1152/ajprenal.00203.2019
3. Pan X, Zhang X, Ban J, Yue L, Ren L, Chen S. Effects of high-fat diet on cardiovascular protein expression in mice based on proteomics. Diabetes Metab Syndr Obes. 2023;16:873–882. doi:10.2147/DMSO.S405327
4. Abenavoli L, Greco M, Milic N, et al. Effect of mediterranean diet and antioxidant formulation in non-alcoholic fatty liver disease: a Randomized Study. Nutrients. 2017;9(8):870. doi:10.3390/nu9080870
5. Powell EE, Wong VW, Rinella M. Non-alcoholic fatty liver disease. Lancet. 2021;397(10290):2212–2224. doi:10.1016/S0140-6736(20)32511-3
6. Djordjevic DB, Zdravkovic M, Nagorni A, Manolis A, Tsioufis C, Lovic D. A critical approach of guideline therapeutic recommendations for NAFLD. Curr Vasc Pharmacol. 2018;16(3):228–238. doi:10.2174/1570161115666170621080228
7. Vetrano E, Rinaldi L, Mormone A, et al. Non-alcoholic Fatty Liver Disease (NAFLD), type 2 diabetes, and non-viral hepatocarcinoma: pathophysiological mechanisms and new therapeutic strategies. Biomedicines. 2023;11(2):468. doi:10.3390/biomedicines11020468
8. Polyzos SA, Kang ES, Tsochatzis EA, et al. Commentary: nonalcoholic or metabolic dysfunction-associated fatty liver disease? The epidemic of the 21st century in search of the most appropriate name. Metabolism. 2020;113:154413. doi:10.1016/j.metabol.2020.154413
9. Pan X, Yue L, Ren L, Ban J, Chen S. Association of triglyceride-glucose index and liver function parameters among healthy obese civil servants: a Center-Based Study. Diabetes Metab Syndr Obes. 2022;15:3519–3531. doi:10.2147/DMSO.S392544
10. Zhang J, Van Spall HG, Li L, et al. Effects of glucagon-like peptide-1 receptor agonists and sodium-glucose cotransporter-2 inhibitors on cardiovascular and kidney outcomes in Asian versus White patients with type 2 diabetes mellitus. Diabetes Metab Syndr. 2023;17(7):102804. doi:10.1016/j.dsx.2023.102804
11. Bica IC, Stoica RA, Salmen T, et al. The effects of sodium-glucose cotransporter 2-inhibitors on steatosis and fibrosis in patients with non-alcoholic fatty liver disease or steatohepatitis and type 2 diabetes: a systematic review of randomized controlled trials. Medicina. 2023;59(6):1136. doi:10.3390/medicina59061136
12. Grubić Rotkvić P, Ćelap I, Bralić Lang V, et al. Impact of SGLT2 inhibitors on the mechanisms of myocardial dysfunction in type 2 diabetes: A prospective non-randomized observational study in patients with type 2 diabetes mellitus without overt heart disease. J Diabetes Complications. 2023;37(8):108541. doi:10.1016/j.jdiacomp.2023.108541
13. Gracen L, Muthukumara W, Aikebuse M, et al. Lower prevalence of elevated liver stiffness measurements in people with type 2 diabetes taking sodium-glucose co-transporter 2 inhibitors or glucagon-like peptide-1 receptor agonists. Ann Hepatol. 2023;28(6):101142. doi:10.1016/j.aohep.2023.101142
14. Shen Y, Cheng L, Xu M, et al. SGLT2 inhibitor empagliflozin downregulates miRNA-34a-5p and targets GREM2 to inactivate hepatic stellate cells and ameliorate non-alcoholic fatty liver disease-associated fibrosis. Metabolism. 2023;146:155657. doi:10.1016/j.metabol.2023.155657
15. Ogawa Y, Nakahara T, Ando Y, et al. Sodium-glucose cotransporter-2 inhibitors improve FibroScan-aspartate aminotransferase scores in patients with nonalcoholic fatty liver disease complicated by type 2 diabetes. Eur J Gastroenterol Hepatol. 2023;35(9):989–996. doi:10.1097/MEG.0000000000002588
16. Jasleen B, Vishal GK, Sameera M, et al. Sodium-Glucose Cotransporter 2 (SGLT2) inhibitors: benefits versus risk. Cureus. 2023;15(1):e33939. doi:10.7759/cureus.33939
17. Kim J, Han K, Kim B, et al. Sodium-glucose cotransporter 2 inhibitors for non-alcoholic fatty liver disease in patients with type 2 diabetes mellitus: a nationwide propensity-score matched cohort study. Diabetes Res Clin Pract. 2022;194:110187. doi:10.1016/j.diabres.2022.110187
18. Alshahrani AA, Qahtani SSA, Qahtani ASA, Mashhour SM, Alkhtani ZS, Alragea YM. Metabolic and renal outcomes of empagliflozin in patients with type 2 diabetes mellitus attending Armed Forces Hospital in Saudi Arabia: retrospective cohort study. Saudi Med J. 2023;44(7):674–678. doi:10.15537/smj.2023.44.7.20230094
19. Samkari MM, Bokhari NS, Alhajaji R, et al. Safety and tolerability of Empagliflozin use during the holy month of Ramadan by fasting patients with type 2 diabetes: a prospective cohort study. Saudi Pharm J. 2023;31(6):972–978. doi:10.1016/j.jsps.2023.04.022
20. Prochaska JH, Jünger C, Schulz A, et al. Effects of empagliflozin on left ventricular diastolic function in addition to usual care in individuals with type 2 diabetes mellitus-results from the randomized, double-blind, placebo-controlled EmDia trial. Clin Res Cardiol. 2023;112(7):911–922. doi:10.1007/s00392-023-02164-w
21. Wang L, Zhi Y, Ye Y, et al. Metabolomic analysis identifies the regulation of lipid metabolism pathway as potential mechanisms of Jiangzhi decoction against non-alcoholic fatty liver disease. J Pharm Pharmacol. 2023:rgad067. doi:10.1093/jpp/rgad067
22. Wang Z, Zhou J, Lu M, Liang Y, Jiang Z, Chen K. Therapy of empagliflozin plus metformin on T2DM mice shows no higher amelioration for glucose and lipid metabolism than empagliflozin monotherapy. Life Sci. 2019;232:116622. doi:10.1016/j.lfs.2019.116622
23. Makrecka-Kuka M, Korzh S, Videja M, et al. Empagliflozin protects cardiac mitochondrial fatty acid metabolism in a mouse model of diet-induced lipid overload. Cardiovasc Drugs Ther. 2020;34(6):791–797. doi:10.1007/s10557-020-06989-9
24. Chen X, Ma L, Zhao J, Pan X, Chen S. Effect of empagliflozin on cytoskeletal repair in the hippocampus of obese mice. Front Neurosci. 2022;16:1000839. doi:10.3389/fnins.2022.1000839
25. Pan X, Chen S, Chen X, et al. Effect of high-fat diet and empagliflozin on cardiac proteins in mice. Nutr Metab. 2022;19(1):69. doi:10.1186/s12986-022-00705-0
26. Kluger AY, Tecson KM, Lee AY, et al. Class effects of SGLT2 inhibitors on cardiorenal outcomes. Cardiovasc Diabetol. 2019;18(1):99. doi:10.1186/s12933-019-0903-4
27. Caturano A, Galiero R, Loffredo G, et al. Effects of a combination of empagliflozin plus metformin vs. metformin monotherapy on NAFLD progression in type 2 diabetes: the IMAGIN Pilot Study. Biomedicines. 2023;11(2):322. doi:10.3390/biomedicines11020322
28. Niu S, Chen S, Chen X, et al. Semaglutide ameliorates metabolism and hepatic outcomes in an NAFLD mouse model. Front Endocrinol. 2022;13:1046130. doi:10.3389/fendo.2022.1046130
29. Marra F, Svegliati-Baroni G. Lipotoxicity and the gut-liver axis in NASH pathogenesis. J Hepatol. 2018;68(2):280–295. doi:10.1016/j.jhep.2017.11.014
30. Chalhoub G, Jamnik A, Pajed L, et al. Carboxylesterase 2a deletion provokes hepatic steatosis and insulin resistance in mice involving impaired diacylglycerol and lysophosphatidylcholine catabolism. Mol Metab. 2023;72:101725. doi:10.1016/j.molmet.2023.101725
31. Jiang LP, Sun HZ. Long-chain saturated fatty acids and its interaction with insulin resistance and the risk of nonalcoholic fatty liver disease in type 2 diabetes in Chinese. Front Endocrinol. 2022;13:1051807. doi:10.3389/fendo.2022.1051807
32. Honda T, Ishigami M, Luo F, et al. Branched-chain amino acids alleviate hepatic steatosis and liver injury in choline-deficient high-fat diet induced NASH mice. Metabolism. 2017;69:177–187. doi:10.1016/j.metabol.2016.12.013
33. Perakakis N, Joshi A, Peradze N, et al. The selective peroxisome proliferator-activated receptor gamma modulator CHS-131 improves liver histopathology and metabolism in a mouse model of obesity and nonalcoholic steatohepatitis. Hepatol Commun. 2020;4(9):1302–1315. doi:10.1002/hep4.1558
34. Kumar DP, Santhekadur PK, Seneshaw M, Mirshahi F, Uram-Tuculescu C, Sanyal AJ. A regulatory role of apoptosis antagonizing transcription factor in the pathogenesis of nonalcoholic fatty liver disease and Hepatocellular Carcinoma. Hepatology. 2019;69(4):1520–1534. doi:10.1002/hep.30346
35. Bei Y, Wu X, Cretoiu D, et al. miR-21 suppression prevents cardiac alterations induced by d-galactose and doxorubicin. J Mol Cell Cardiol. 2018;115:130–141. doi:10.1016/j.yjmcc.2018.01.007
36. Di Gennaro A, Haeggström JZ. The leukotrienes: immune-modulating lipid mediators of disease. Adv Immunol. 2012;116:51–92. doi:10.1016/B978-0-12-394300-2.00002-8
37. Wang L, Liu X, Nie J, et al. ALCAT1 controls mitochondrial etiology of fatty liver diseases, linking defective mitophagy to steatosis. Hepatology. 2015;61(2):486–496. doi:10.1002/hep.27420
 © 2023 The Author(s). This work is published and licensed by Dove Medical Press Limited. The full terms of this license are available at https://www.dovepress.com/terms.php and incorporate the Creative Commons Attribution - Non Commercial (unported, v3.0) License.
By accessing the work you hereby accept the Terms. Non-commercial uses of the work are permitted without any further permission from Dove Medical Press Limited, provided the work is properly attributed. For permission for commercial use of this work, please see paragraphs 4.2 and 5 of our Terms.
© 2023 The Author(s). This work is published and licensed by Dove Medical Press Limited. The full terms of this license are available at https://www.dovepress.com/terms.php and incorporate the Creative Commons Attribution - Non Commercial (unported, v3.0) License.
By accessing the work you hereby accept the Terms. Non-commercial uses of the work are permitted without any further permission from Dove Medical Press Limited, provided the work is properly attributed. For permission for commercial use of this work, please see paragraphs 4.2 and 5 of our Terms.