")
Back to Journals » International Journal of Chronic Obstructive Pulmonary Disease » Volume 16
Association of Total Airway Count on Computed Tomography with Pulmonary Function Decline in Early-Stage COPD: A Population-Based Prospective Cohort Study
Authors Wu F , Jiang C, Zhou Y, Zheng Y, Tian H, Li H , Deng Z , Zhao N , Chen H, Ran P
Received 15 September 2021
Accepted for publication 6 December 2021
Published 18 December 2021 Volume 2021:16 Pages 3437—3448
DOI https://doi.org/10.2147/COPD.S339029
Checked for plagiarism Yes
Review by Single anonymous peer review
Peer reviewer comments 3
Editor who approved publication: Dr Richard Russell
Fan Wu,1,2,* Changbin Jiang,1,* Yumin Zhou,1,2,* Youlan Zheng,1,* Heshen Tian,1 Haiqing Li,1 Zhishan Deng,1 Ningning Zhao,1 Huai Chen,3 Pixin Ran1,2
1National Center for Respiratory Medicine, State Key Laboratory of Respiratory Disease, National Clinical Research Center for Respiratory Disease, Guangzhou Institute of Respiratory Health, The First Affiliated Hospital of Guangzhou Medical University, Guangzhou, People’s Republic of China; 2Guangzhou Laboratory, Bio-island, Guangzhou, People’s Republic of China; 3Department of Radiology, The First Affiliated Hospital of Guangzhou Medical University, Guangzhou, People’s Republic of China
*These authors contributed equally to this work
Correspondence: Pixin Ran
National Center for Respiratory Medicine, State Key Laboratory of Respiratory Disease, National Clinical Research Center for Respiratory Disease, Guangzhou Institute of Respiratory Health, The First Affiliated Hospital of Guangzhou Medical University, Guangzhou, People’s Republic of China
Tel +86 20 83205187
Fax +86 20-81340482
Email [email protected]
Background: It has been found that the degree of terminal bronchiole destruction is associated with the severity of COPD. However, total airway count (TAC) of CT-visible and its relationship with COPD lung function severity and pulmonary function decline remains controversial. The present study aimed to determine whether TAC is significantly reduced in early-stage COPD (GOLD stage I–II) compared with healthy control subjects and whether TAC is associated with annual decline in pulmonary function in Chinese patients with early-stage COPD.
Methods: A total of 176 participants were enrolled in this study, of which 139 participants had undergone at least two spirometry measurements within 7 years (average 5.5 [standard deviation 0.8] years) after baseline data acquisition. CT-visible TAC was measured by summing all airway segments using semi-automated software. Average lumen diameter, average inner area, emphysema index, air trapping, and inspiratory Pi10 were also measured. Multivariable linear analysis was performed to evaluate variables that were significantly related to pulmonary function parameters and to evaluate the correlation between TAC and annual decline in longitudinal pulmonary function.
Results: Compared with healthy control subjects, CT-visible TAC was significantly reduced by 51% in GOLD II and by 31% in GOLD I after adjustment. TAC had the greatest impact on pre-bronchodilator FEV1, pre-bronchodilator FVC, post-bronchodilator FEV1, and post-bronchodilator FEV1/FVC (both p< 0.001) among all CT indicators measured. TAC has the best correlation with inspiratory Pi10 (ρ=− 0.751, p< 0.001), an evaluation indicator of the degree of airway remodeling. TAC was independently associated with annual decline in pre-bronchodilator FEV1 (p=0.023), post-bronchodilator FEV1 (p=0.018), and post-bronchodilator FEV1/FVC (p< 0.001).
Conclusion: This finding suggests that CT-visible TAC may be an evaluation indicator of the degree of airway remodeling, and was diminished in greater COPD lung function severity, and independently associated with disease progression. Early-stage COPD patients have already occurred lung structural changes and early intervention may be needed to ameliorate the progression of disease.
Clinical Trial Registration: ChiCTR-OO-14004264.
Keywords: chronic obstructive pulmonary disease, COPD, computed tomography, total airway count, TAC
Introduction
Chronic obstructive pulmonary disease (COPD) is an umbrella term for various clinical entities due to exposure to toxic particles or gases, and characterized by airflow obstruction and small airway dysfunction.1 Micro-computed tomography (micro-CT) images have provided evidence that the peripheral bronchioles in COPD and the small conducting airway are extensively damaged and it has been found that the degree of terminal bronchiole destruction is associated with the severity of COPD.2,3 However, the measurement of small conducting airway and peripheral bronchioles required lung tissue in vitro by micro-CT, which is difficult to carry out clinically. Meantime, the large airways have been extensively investigated in vivo using high-resolution computed tomography (CT).4,5
With advanced image analysis software, the tracheal tree can be cut from the trachea into smaller airways with an airway diameter of about 1 mm at the resolution of the CT systems.6 Kirby et al found that total airway count (TAC) of CT-visible was related to the number of terminal bronchioles and was associated with longitudinal annual decline in pulmonary function.5,7 Compared with at-risk subjects and never smokers, TAC with early-stage COPD was significantly reduced.5 However, their study consisted of 17% of asthma patients and 19% of bronchiectasis patients. Previous studies have found that the number of airways in patients with asthma and bronchiectasis will also decrease, and asthma or bronchiectasis may affect the measurement of TAC.8,9 Another 10-year longitudinal study found that TAC has no significant association with lung function decline and mortality.10 CT-visible TAC and its relationship with pulmonary function decline remain controversial.5,10 Meantime, we previously found that Chinese COPD patients have a higher proportion of biomass exposure and occupational exposure, which is different from their study of COPD patients.11,12
In view of this evidence gap, we conducted the prospective, observational, population-based study to evaluate whether TAC of early-stage Chinese COPD patients is significantly reduced compared with healthy subjects and is associated with annual decline in longitudinal pulmonary function.
Materials and Methods
Study Population
The present prospective study is embedded within the National Key Technology Research and Development Program of the 12th National 5-Year Development Plan, which was a population-based, multicenter and randomized survey of COPD conducted in Guangdong, China.13 The key inclusion criteria included age 40 to 80 years old when participating in this study and completed inspiratory and expiratory CT, questionnaires interview, acceptable spirometry data. The key exclusion criteria included (1) acute exacerbation that occurred in 4 weeks before participating in the study. (2) other chronic respiratory diseases diagnosis by a physician, such as asthma, bronchiectasis, active pulmonary tuberculosis, lung cancer, pneumoconiosis, and interstitial lung disease. (3) the subject cannot communicate in words or agrees, and cannot complete the test-related auxiliary examination.
Initially, a total of 187 study subjects from the database were considered as eligible subjects included in our baseline assessment. Subjects with a post-bronchodilator forced expiratory volume in 1 second (FEV1)/forced vital capacity (FVC) <70% were defined as spirometry-defined COPD, and healthy control was defined as post-bronchodilator FEV1/FVC ≥70%.1 The CT analysis of 1 subject was unsuccessful, 10 subjects were excluded from GOLD III+, and finally 176 subjects were included in the baseline analysis. One hundred and thirty-nine (79%) participants were enrolled underwent at least two post-bronchodilator spirometry measurements within 7 years after baseline data acquisition. Figure 1 presents a flowchart of the study procedures. The Ethics Commission of the First Affiliated Hospital of Guangzhou Medical University approved this study (No. 2013–37). All participants obtained information about radiation exposure and provided written informed consent preceded this study. This present study was in line with the principles of the Declaration of Helsinki.
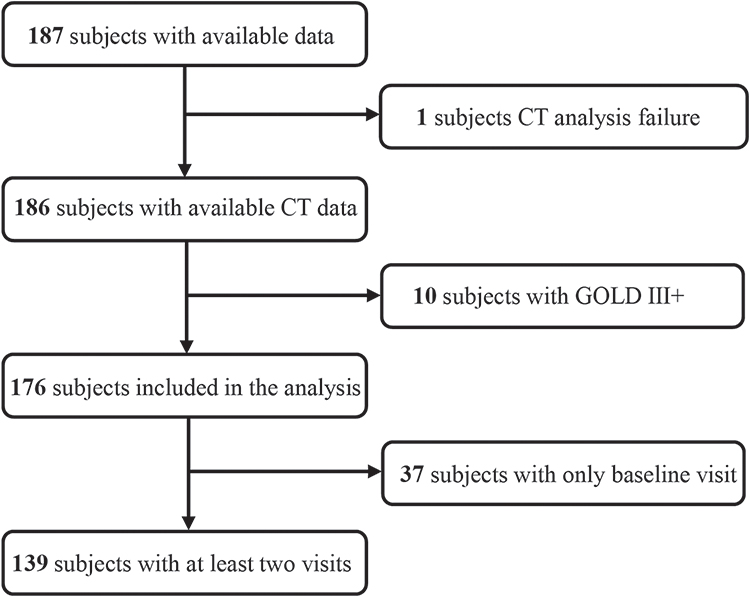 |
Figure 1 Study flow chart. Abbreviations: GOLD, Global Initiative for Chronic Obstructive Lung Disease; CT, computer tomography. |
Questionnaires
A questionnaire interview was performed by well-trained staff using the standardized questionnaire revised from previous COPD epidemiological survey in China, including general information, possible risk factors for COPD, such as smoking status, pack-years, biomass fuel exposure, and family history of respiratory diseases.14 We classified the subjects’ smoking status as never smoked, former smoking, and current smoking. Never smoked was defined as having smoked less than 100 cigarettes in the past.15 Current smoking was defined as being smoking at baseline. Former smoking was defined as smoked more than 100 cigarettes but had not smoked a product for at least 6 months at baseline. Biomass use was defined as cooking or heating using biomass (mainly wood, crop residues, charcoal, grass, and dung) for ≥1 year.11 We defined family history of respiratory diseases as having parents, siblings, and children with respiratory diseases (chronic bronchitis, emphysema, asthma, COPD, cor pulmonale, bronchiectasis, lung cancer, interstitial lung disease, obstructive sleep apnea hypopnea syndrome).
CT Scanning Equipment and Parameters
High resolution computer tomography (HRCT) was performed with each participant at inspiratory and expiratory using a multidetector-row CT scanner (Aquilion 16, Toshiba, Tokyo, Japan). The researchers trained the subjects to hold their breath at the end of deep inhalation and deep expiration, and to achieve the best condition before the scan. Scans were performed with tube voltage 120 kV and tube current 250 mAs at a rotation time 0.5 second. Images with slice thickness of 0.5 mm at 0.8mm increments were reconstructed using a Fc01 algorithm through 512×512. Two radiologists were blind to each subject’s pulmonary function and independently scored each scan. The average CT dose index is 6.44 mGy and the average dose length product is 228 mGycm.
CT Image Analysis
Quantitative assessment was performed with semi-automated Volumetric Information Display and Analysis (VIDA) 2.0 software (Apollo; VIDA Diagnostics, IA, USA).16 The software automatically segmented the lung image and marked the airway. In addition, the segmentation and making of the airway was visually verified and edited by a well-trained radiologist as required. If an airway fails to be identified, the well-trained radiologist will place a seed in the missing airway so the software can re-identify it. The radiologists analyzing the scans were blinded to any clinical details of the subjects. CT-visible TAC was measured by accumulating all airway segments in the airway tree. Average lumen diameter and average inner area were also measured. It was previously reported that the airway measurement generated by VIDA software is highly repeatable and reliable.5
Emphysema was quantified by measuring the emphysema index of each subject, which was defined as the percentage of low-attenuation area below −950 Hounsfield units (HU) on full-inspiration computed tomography (LAA−950), and inspiratory 15th percentile (Perc15), which was defined as the HU at which 15% of the voxels fall below at full inspiration.6 Air trapping was defined as the percentage of low-attenuation area below −856 HU on full-expiration computed tomography (LAA−856). Airway remodeling was quantified by inspiratory Pi10, which was expressed as the square root of the wall area of a theoretical airway with 10-mm lumen perimeter at full inspiratory.17
Spirometry
Well-trained technicians used the MasterScreen Pneumo PC spirometer (CareFusion, Yorba Linda, CA, USA) for spirometry, following the standards recommended by the European Respiratory Society and the American Thoracic Society.18,19 Each subject need to meet at least three acceptable measurement values and two repeatable measurement values before and after inhalation of bronchodilator (that is, the maximum value of FVC and FEV1 and the next maximum value are within 150 mL or 5%).18,19 The use of short-acting and long-acting bronchodilators is prohibited for 12 or 24 hours before spirometry testing. Spirometry after using the bronchodilator was performed 20 minutes after inhaling 400μg of salbutamol (Ventolin, GlaxoSmithKline) through a 500 mL spacer. The predicted FEV1 was based on the reference values of the European Coal and Steel Community 1993 and adjusted according to the conversion factors of the Chinese population (0.93 in female and 0.95 in men).20,21 The definition of COPD and its severity classification are based on the Global Initiative for Chronic Obstructive Lung Disease (GOLD) system categorizes airflow obstruction based on post-bronchodilator FEV1 (GOLD I: post-bronchodilator FEV1 ≥ 80% predicted; GOLD II: post-bronchodilator FEV1 ≥ 50% to < 80% predicted).22
Statistical Analysis
The Continuous variable with normal distribution is expressed as mean ± standard deviation (SD), and the continuous variable with non-normal distribution are expressed as median (interquartile range [IQR]). A one-way analysis of variance or Kruskal–Wallis test was used to compare the three groups for participant demographic, spirometry, and imaging measurements. Bonferroni correction was applied to adjust for multiple comparisons. Categorical data are expressed in number (percentage) and we compared the differences using chi-square tests or Fisher’s exact test as needed. An analysis of covariance (ANCOVA) adjusted by confounding factors (age, sex, body-mass index [BMI], smoking status, and pack-years) was used to compare the CT-visible TAC between the three groups. Multivariate linear regression analysis was used to determine CT measurements related to pulmonary function measurement adjusted by confounding factors (age, sex, BMI, smoking status, and pack-years). The relationship between CT measurements was evaluated using Pearson (r) or Spearman (ρ) correlation coefficient. The longitudinal analysis included pulmonary function data with a follow-up time of more than 2 years, and estimated pre- bronchodilator FEV1, FVC, FEV1/FVC and post-bronchodilator FEV1, FVC, FEV1/FVC decline/year. Multivariable linear regression analysis was used to determine the correlation between CT-visible TAC and annual decline in pulmonary function adjusted by confounding factors (age, sex, BMI, smoking status, and pack-years). Statistical analyses were performed using SPSS 24.0 software (IBM Corp., Armonk, NY, USA). A 2-sided p values less than 0.05 indicated statistically significance.
Results
Characteristics of the Subjects at Baseline
Table 1 shows the participant demographics and pulmonary function measurements of all 176 participants evaluated (n=41 healthy control, n=76 GOLD I, n=59 GOLD II). GOLD II subjects were significantly older than GOLD I and healthy control subjects (p<0.05). GOLD II and I subjects were more male, have a higher proportion of current smokers and higher pack-years smoking (p<0.05). There were no significant differences in BMI, family history of respiratory diseases, and bronchodilator response.
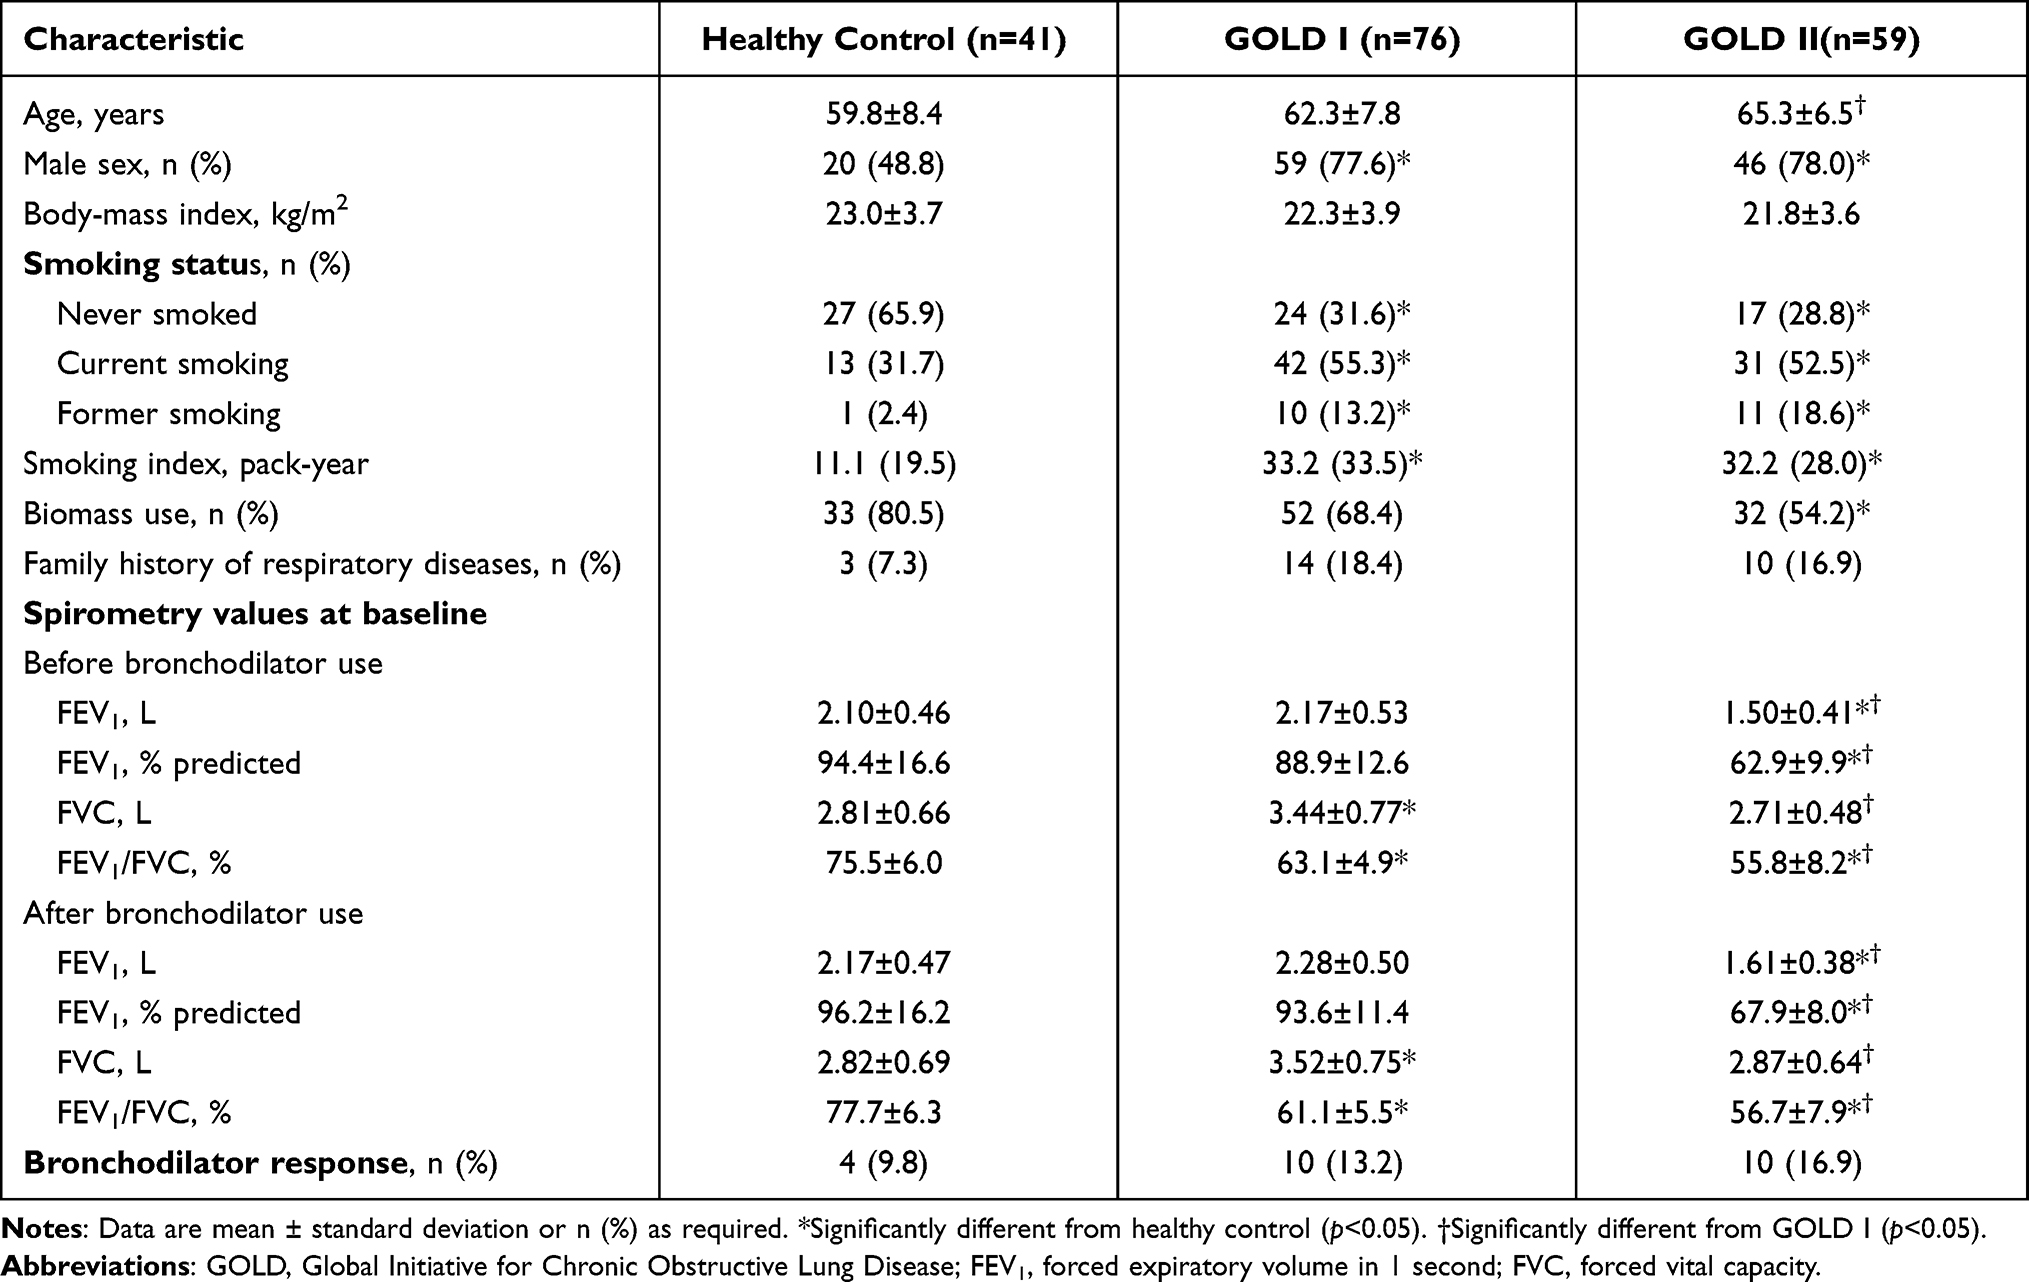 |
Table 1 Characteristics of the Subjects at Baseline |
Table 2 shows the CT indicators of all 176 participants evaluated. GOLD II subjects obviously had more severe LAA−950, LAA−856, and inspiratory Pi10 compared with healthy control (all p<0.05). GOLD I subjects had more severe LAA−950 compared with healthy control (p<0.05). The CT- visible TAC acquisition result graph is presented in Figure 2. In Figure 2, the 3D reconstructed CT airway trees show that with the higher of COPD severity, the smaller number of airway tree. CT-visible TAC in healthy control, GOLD I, GOLD II subjects was 240±132, 195±116, and 155±101, respectively. GOLD II subjects had significantly fewer CT-visible TAC than GOLD I and healthy control subjects (all p<0.05), and GOLD I subjects was significantly less than healthy control subjects (p<0.05) before adjustment.
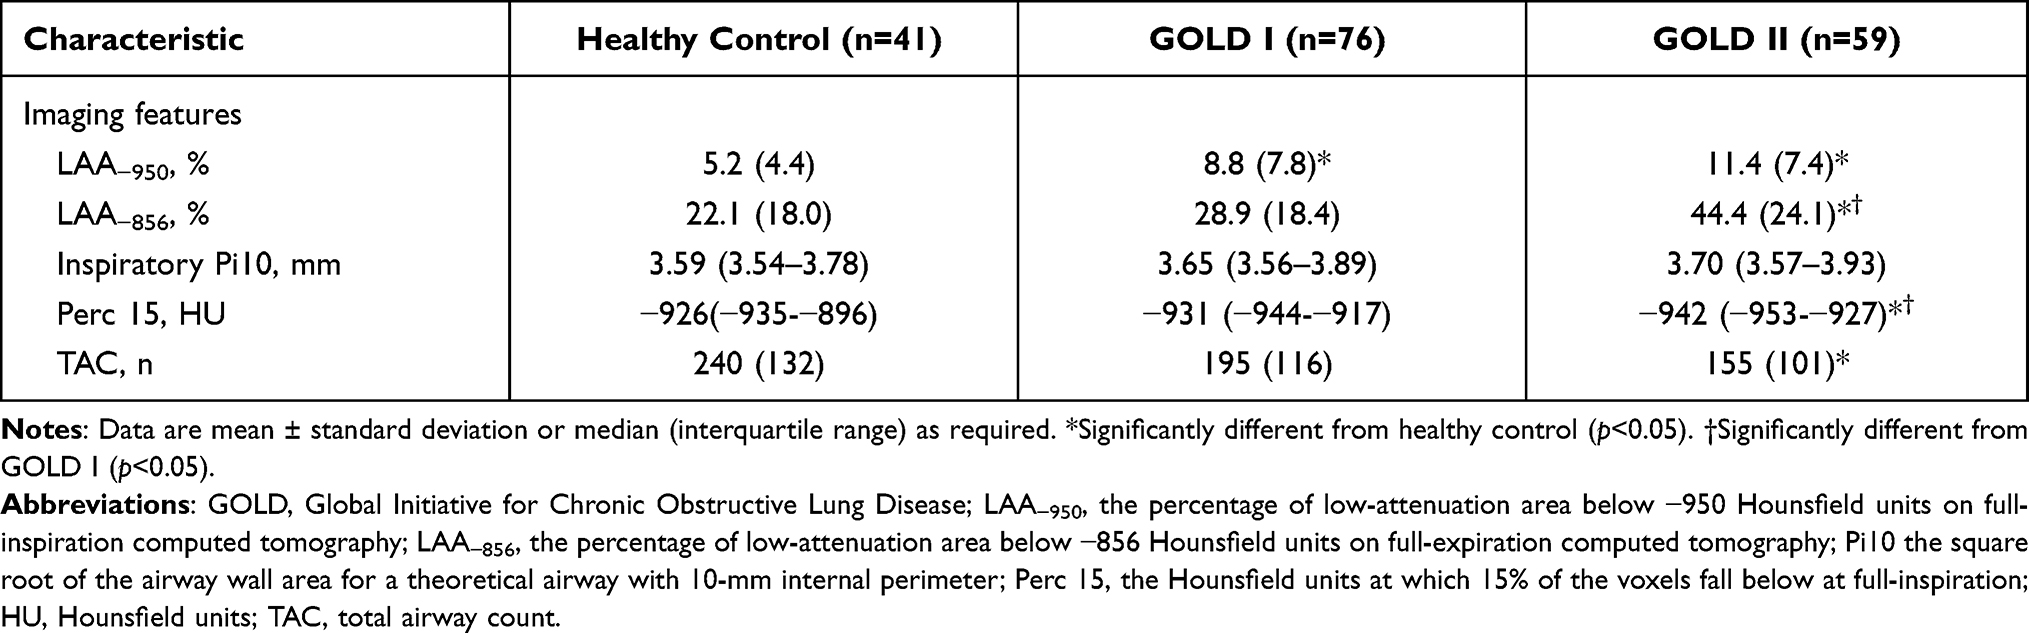 |
Table 2 Quantitative CT Parameters of the Subjects at Baseline |
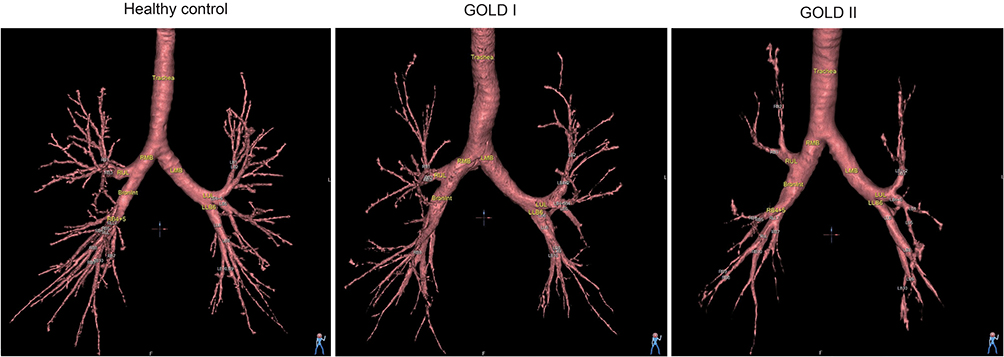 |
Figure 2 The reconstruction of the airway tree. |
TAC Reduction Was Associated with Increasing COPD Lung Function Classification
We counted the corresponding airway counts according to airway generation, average airway lumen diameter, and average airway lumen area. Figure 3 shows the distribution of CT airways according to generation, average lumen diameter, and average inner area. As the severity of COPD increases, the total airway counts gradually decrease. The airway counts of GOLD II subjects from generation 5 to generation 10 were all smaller than those of healthy controls (all p<0.05), and the airway counts of GOLD II subjects with generation 5, generation 9 and generation 10 are smaller than GOLD I subjects (all p<0.05). There was no significant difference in the number of average airways lumen diameter less than 2.00 mm and 2.00–2.50 mm between the three groups, but all other average airway lumen diameter of GOLD II COPD were significantly reduced compared with the healthy control group (p<0.05). In addition, there was no significant difference in the number of an average inner area smaller than 2.00 mm2 between the three groups, but all other average inner area of GOLD II COPD were significantly reduced compared with the healthy control group (p<0.05).
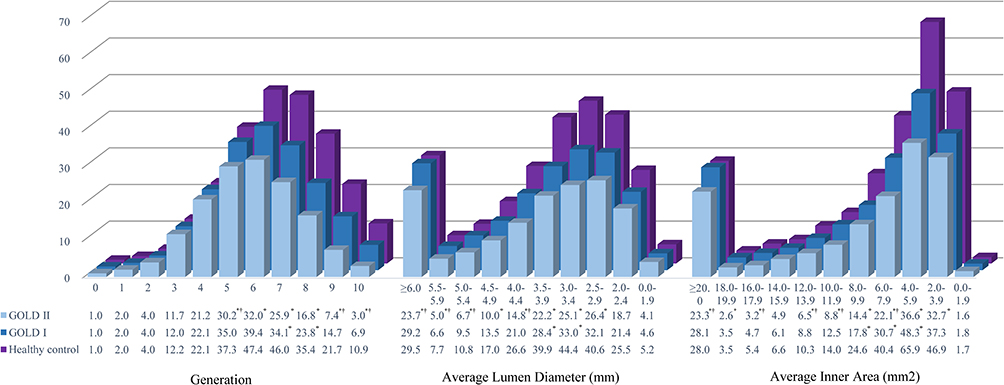 |
Figure 3 Computed tomography-visible total airway count by generation, average lumen diameter and average inner area. *Significantly different from healthy control (p<0.05). † Significantly different from GOLD I (p<0.05). |
CT-visible TAC was significantly lower in the GOLD I (173±17, p<0.001) and GOLD II (124±17, p<0.001) subgroups as compared to healthy control (251±20) when adjusting by age, sex, BMI, smoking status, and pack-years. Age and sex were significant covariate (p=0.013, p=0.027, respectively), whereas BMI and smoking status were not significant (p=0.335 and p=0.660, respectively). We performed additional ANCOVA in turn incorporating LAA−950 and LAA−856 as a covariate, LAA−950 were significant (p<0.001, p<0.001, respectively). However, the air trapping index (p=0.649) was not significant.
TAC Was Associated with Pulmonary Function
Table 3 shows the results of multivariable linear regression analysis for pulmonary function parameters. Among all imaging measures investigated, CT-visible TAC had the greatest influence on pre-bronchodilator FEV1 (β=0.402; p<0.001), pre-bronchodilator FVC (β=0.208; p=0.004), post-bronchodilator FEV1 (β=0.343; p<0.001), and post-bronchodilator FEV1/FVC (β=0.440; p<0.001). CT-visible TAC also had greatest influence for pre-bronchodilator FEV1%pred, post-bronchodilator FEV1%pred, and pre-bronchodilator FEV1/FVC (online supplementary Table E1).
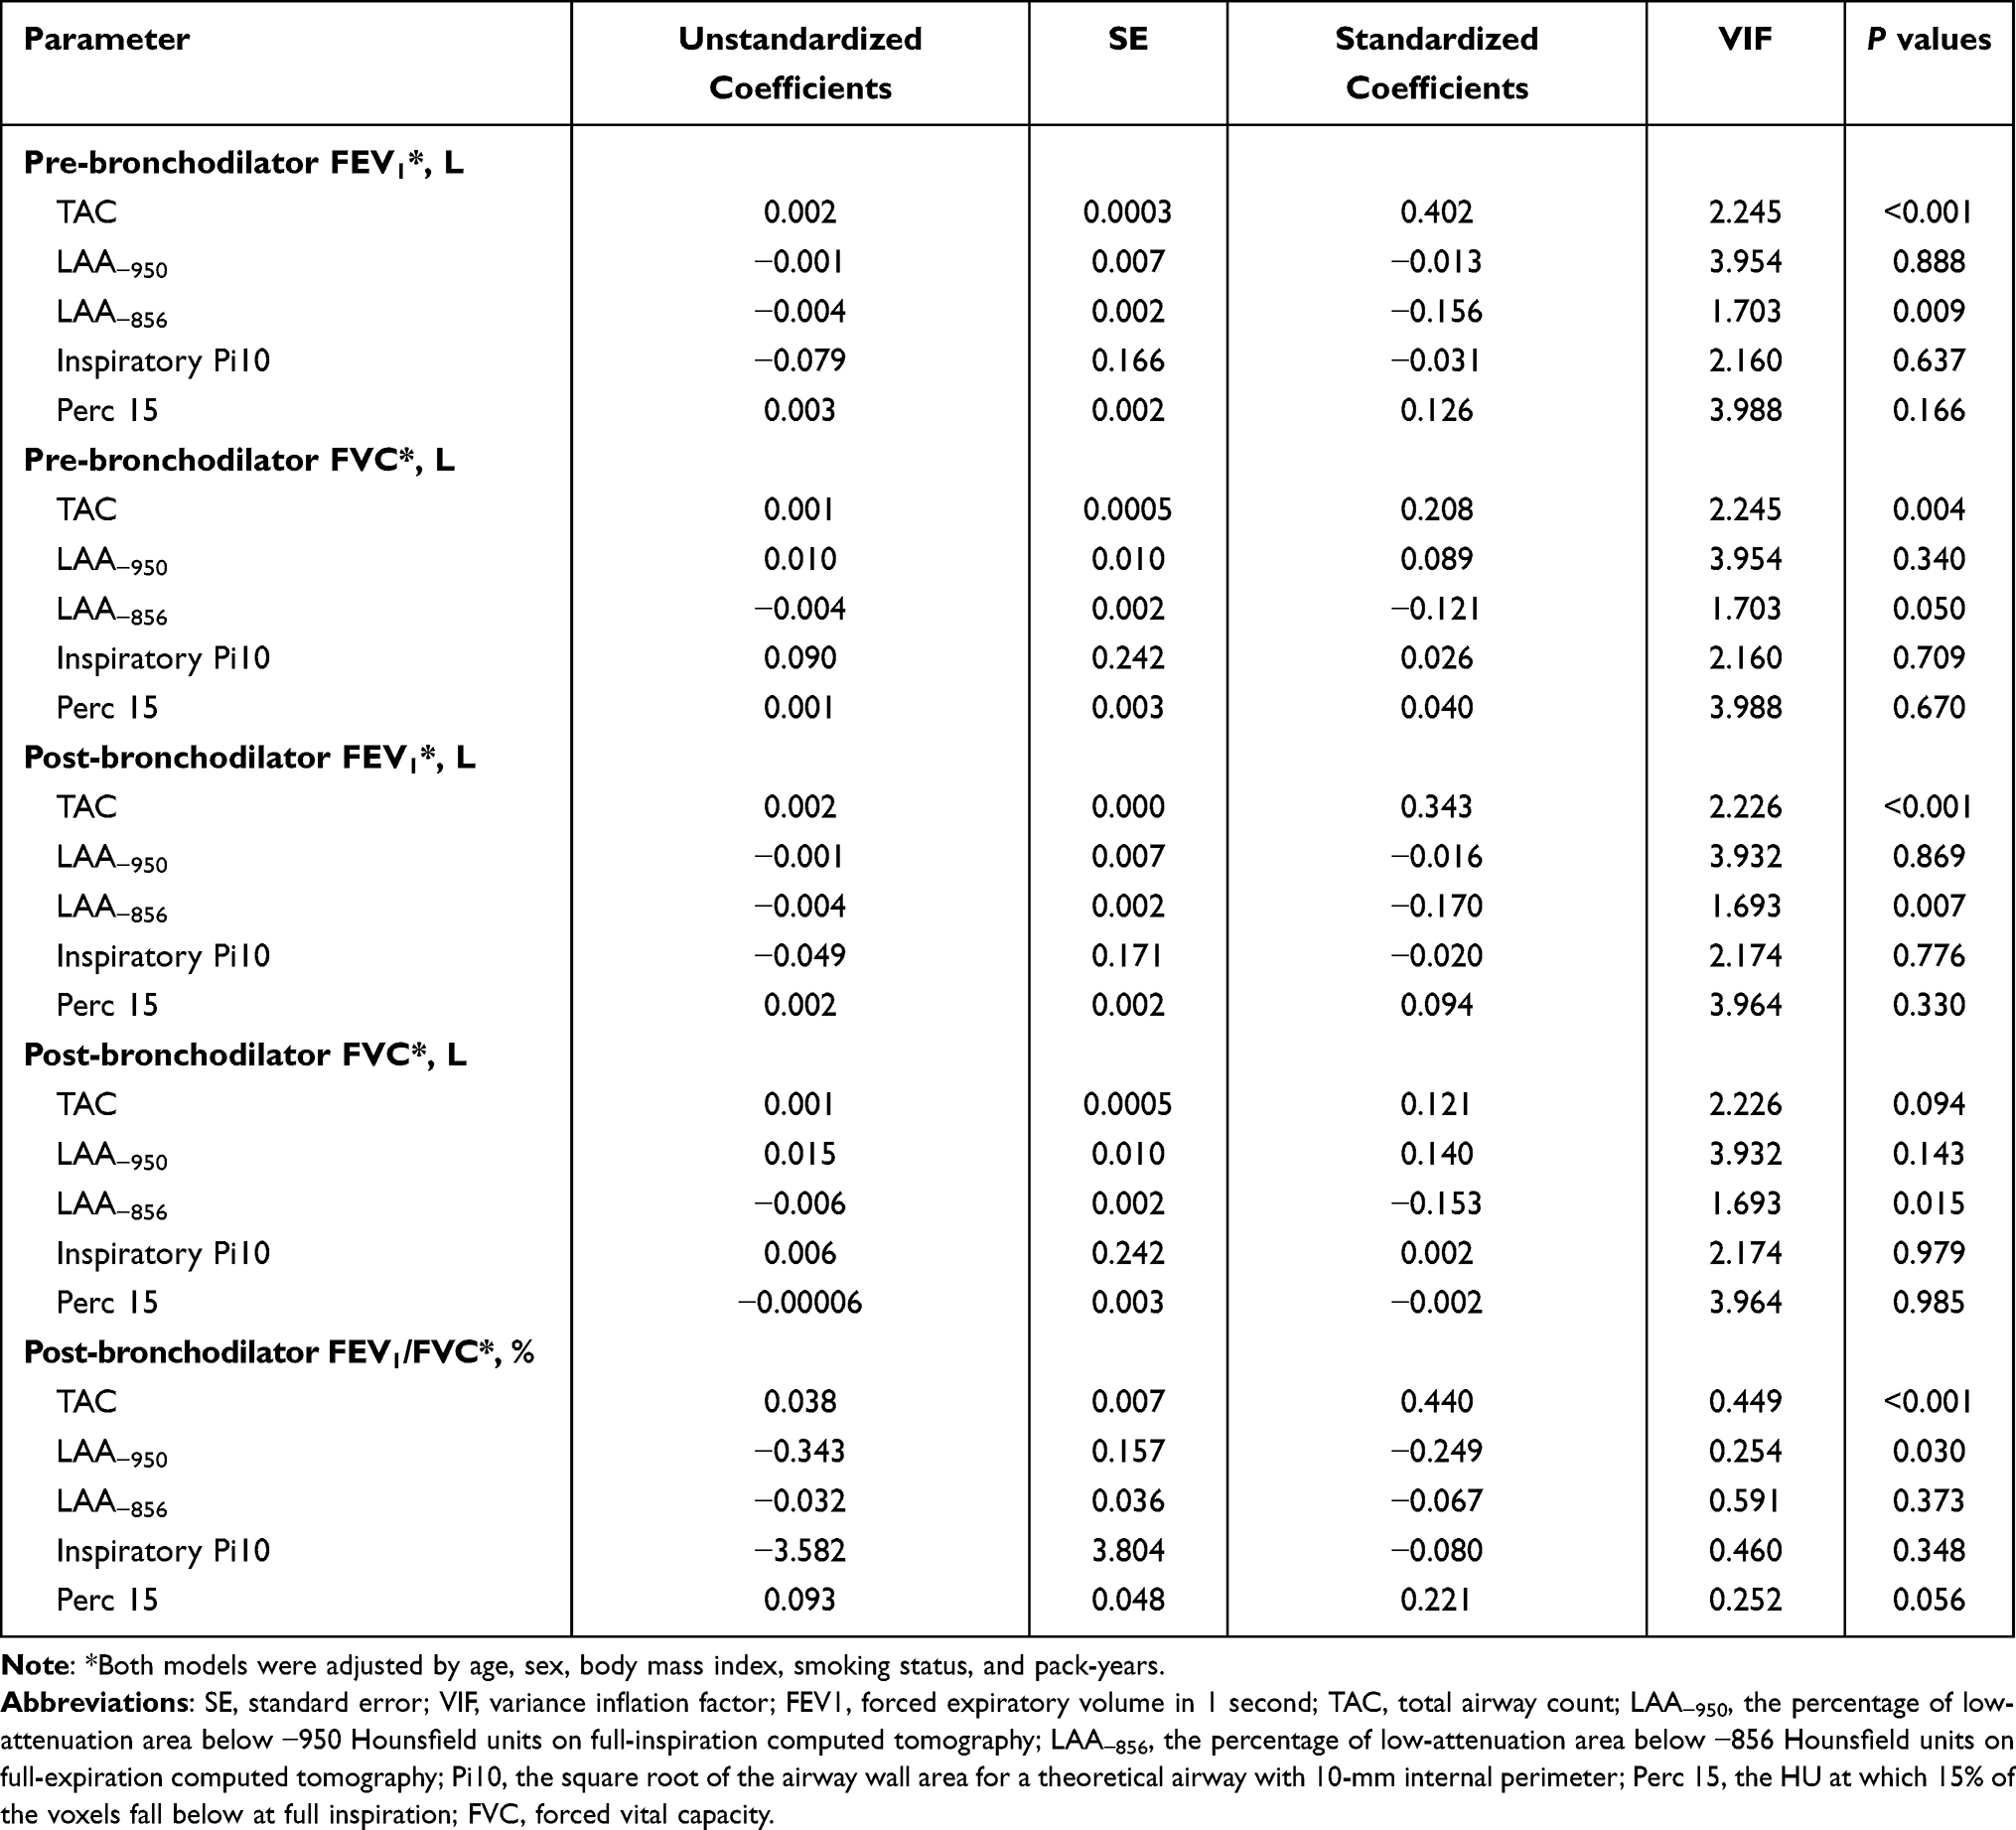 |
Table 3 Multivariable Linear Regression Analysis for Pulmonary Function Measurements with Imaging Measurements |
TAC May Be the Biomarker of Airway Remodeling
Figure 4 shows that CT-visible TAC was strongly related to inspiratory Pi10 (ρ=0.750; p<0.001). CT-visible TAC also moderately related to LAA−950 (ρ=0.365; p<0.001) and Perc 15 (ρ=−0.358; p<0.001). However, CT-visible TAC was not associated with LAA−856 (ρ=−0.026; p=0.730).
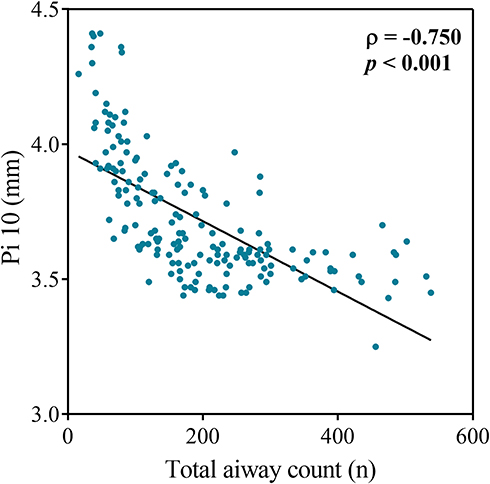 |
Figure 4 Relationship between total airway count (n) and inspiratory Pi10 (mm). CT-visible TAC was strongly related to inspiratory Pi10 (ρ=0.750; p<0.001). |
Relationships Between TAC and Longitudinal Pulmonary Function Decline
Table 4 shows multivariable linear regression analysis for annual decline of pre-bronchodilator FEV1, post-bronchodilator FEV1, pre-bronchodilator FVC, post-bronchodilator FVC, and post-bronchodilator FEV1/FVC in all participants after adjustment. 139 (79%) participants with a follow-up time of more than 2 years had undergone at least two spirometry measurements within 7 years (average 5.5 [SD 0.8] years) after baseline data acquisition. During an average follow-up of 5.5 years, CT-visible TAC was associated with annual decline in pre-bronchodilator FEV1 (β=−0.234; p=0.023), post-bronchodilator FEV1 (β=−0.28; p=0.018), and post-bronchodilator FEV1/FVC (β=−0.408; p<0.001) adjusted by cofounding factors. It’s worth noting that CT-visible TAC was not associated with annual decline in pre-bronchodilator FVC (β=−0.044; p=0.634), but was associated with annual decline in post-bronchodilator FVC (β=−0.186; p=0.048).
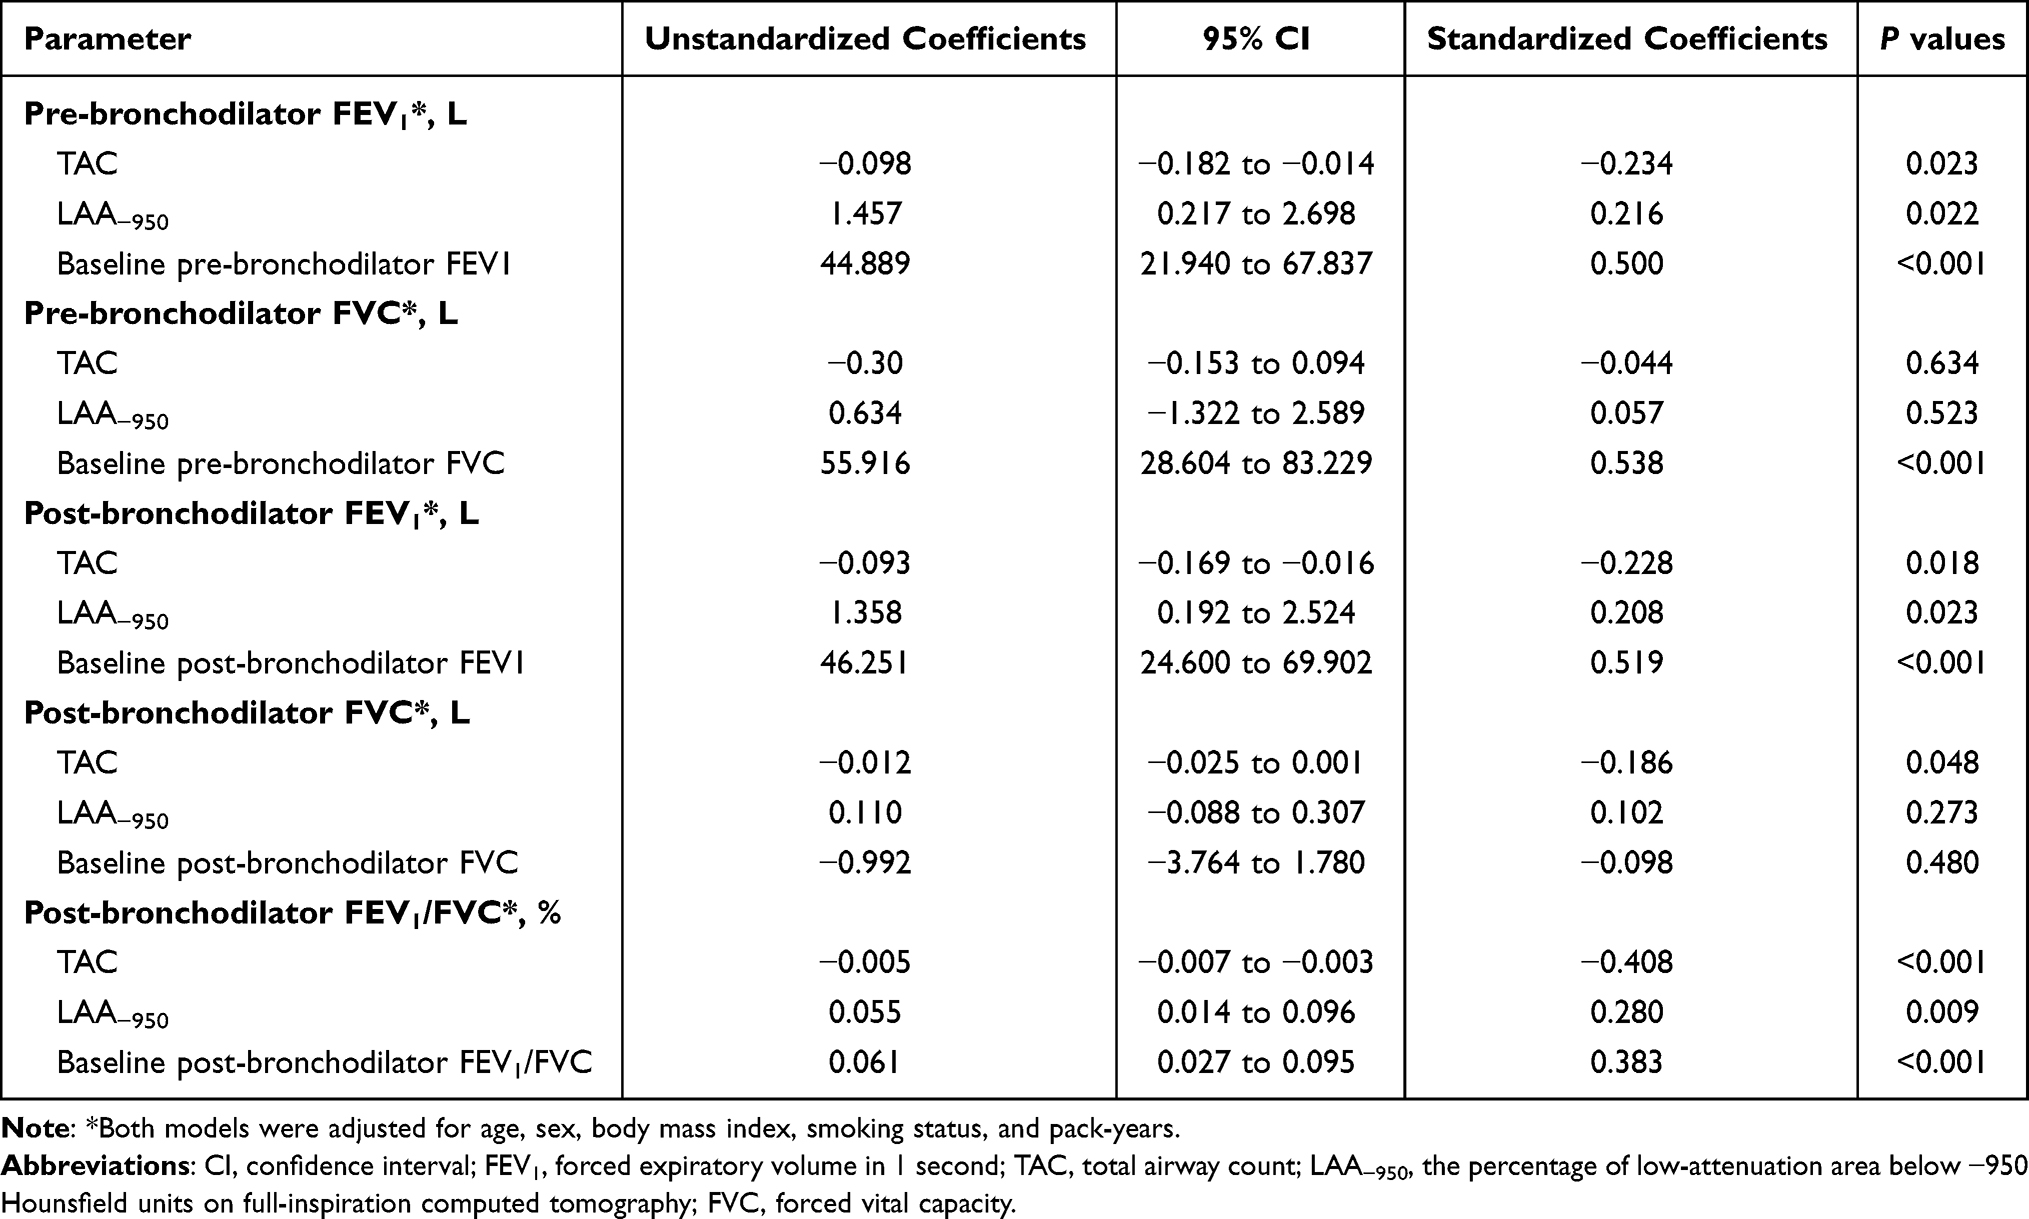 |
Table 4 Multivariable Linear Regression Analysis Exploring Factors Independently Associated with the Annual Decline in Pulmonary Function |
Discussion
Results of this study demonstrated that CT-visible TAC reduction was associated with the severity of COPD. It is likely to be an evaluation indicator of the degree of COPD airway remodeling, and a predictor for accelerated decline in pulmonary function.
A large number of previous studies have established that the major site of obstruction in COPD is the small airway (<2 mm in luminal diameter).3,23,24 Small airway dysfunction preceded emphysematous destruction in COPD.2,3 However, it is still not possible to directly assess small airway diseases based on current medical technology in clinical practice. Therefore, the method of indirect assessment of small airway dysfunction has become the first choice. Nakano et al found that the size of relatively large airways evaluated using CT reflect small airway dimensions measured using micro-CT.25 More recently, Kirby et al found that CT-visible TAC was significant associated with the number of terminal bronchioles and terminal bronchioles distortion/remodeling.7 These studies indicate that changes in the large airways can indirectly reflect the extent of small airway dysfunction. The decrease in the number of CT-visible TAC is likely to reflect the decrease in the terminal airway and small airway dysfunction.5,7 Therefore, it is not difficult to understand why CT-visible TAC has the greatest impact on pulmonary function measurements (pre-bronchodilator FEV1, pre-bronchodilator FVC, post-bronchodilator FEV1, post-bronchodilator FEV1/FVC) among CT biomarker, and CT-visible TAC was associated with annual pulmonary function decline.
Airway remodeling is an important feature in COPD. There are currently inspiratory Pi10, bronchial wall thickness, and the percentage of area of airway lumen to total area of airway (WA%) to evaluate the degree of airway remodeling.26,27 Inspiratory Pi10 has been developed that predicts the square root of the wall area for a hypothetical airway with an internal perimeter of 10 mm. Inspiratory Pi10 can comprehensively evaluate the bronchial wall thickness of the whole lung airway wall because the airway size is uniformly adjusted.25,28 Pervious study found that inspiratory Pi10 was significantly associated with FEV1 annual decline and airflow limitation incidence.29 However, inspiratory Pi10 requires more advanced airway image analysis software due to the unified airway size adjustment, which limits the further popularization of inspiratory Pi10. Previous studies found that bronchial wall thickness was associated with annual COPD exacerbation rate and WA% was correlated with airflow limitation and chronic bronchitis.28,30 However, measuring the airway requires manual measurement, which is very difficult to put these airway remodeling biomarkers into clinical use. It is clear that further research on the airway remodeling biomarker related to the long-term prognosis of COPD is needed.
CT-visible TAC can be calculated and obtained by semi-automatic quantitative software. It is convenient compared with the current indicators of airway remodeling (eg, bronchial wall thickness, and WA%). The difference of CT-visible TAC can be directly felt in the bronchial tree reconstructed by the software (Figure 1). At the same time, our findings that CT-visible TAC was related to COPD lung function severity and annual pulmonary function decline, and would enable respiratory physicians to better manage COPD patients over time.
Comparison with Existing Literature
A few previous studies have investigated airway count and the severity of COPD or asthma. Diaz et al found that the total CT imaging-based count of airways (sixth generation to eighth generation) is reduced in subjects with greater emphysema and is associated with dyspnea, exercise endurance, the degree of airflow obstruction.4 However, they calculated manually the airway count slice-by-slice and only counted the airway count from the sixth to the eighth generations of the right upper lobe (RB1) due to insufficient advanced analysis software. Kirby et al analyzed CanCOLD cohort study and found that CT-visible TAC was associated with disease classification and decreased pulmonary function. However, the CanCOLD cohort study contains 19% of patients with bronchiectasis and 17% of patients with asthma. Although statistical adjustments have been made, considering that the proportion of these individuals is not low, it may still affect the measurement of CT-visible TAC.8,9 In our research, we excluded subjects with tuberculosis, bronchiectasis, and asthma. Moreover, we used quantitative software to analyze thinner CT images (0.5mm) to measurement the airway count from the first to the tenth generation. We have obtained a more accurate measurement of CT-visible TAC. Our finding is in keeping with the present findings and expand current knowledge about CT-visible TAC in patients with COPD in Chinese COPD patients.
Kirby et al showed that thinner walls of parent branch were associated with undetectable daughter branch. However, our study founded a close association between increased Pi10 and decreased TAC. This may be because biofuel exposure causes more airway remodeling compared to smoking exposure.12
Strengths and Limitation of the Study
The strengths of this study include a population-based cohort study that conducted long-term follow-up of unselected individuals, and provided information on characteristics and outcomes related to COPD. Meanwhile, the included healthy control subjects and early-stage COPD patients are not all smokers, but also 39% of never smokers, and this study detailed statistics on biofuel exposure, family history of respiratory diseases, and other risk factors. The proportion of never smoker is close to that in previous studies on COPD in China.11 The subjects included in this study are representative individuals.
Our study had several potential limitations that deserve mention. A major limitation is that only early-stage COPD (GOLD I–II) patients, and not severe to very severe COPD (GOLD III–IV). So, it is unable to present the CT-visible TAC level of the spectrum of disease. Further research is needed to observe the results in GOLD III–IV subjects in the future. Another potential limitation is that this study did not have clinical data on acute exacerbations of COPD. Thus, we were unable to evaluate the association between CT-visible TAC and acute exacerbations. However, previous study has shown that COPD acute exacerbations are less common in early-stage COPD, and most studies on early-stage used pulmonary function as the primary outcome.5,31 Lastly, this study is likely to have a potential loss to follow up bias. However, this study has a follow-up rate of 79% (139/176) which is higher in similar prospective studies, and is unlikely to show significant loss to follow up bias.
Conclusions
In conclusions, these data of this prospective study provide evidence that the quantitative measures of CT-visible TAC are associated with pulmonary function of COPD patients and annual decline in pulmonary function, an important clinical outcome in public health. CT-visible TAC may be an evaluation indicator of the degree of airway remodeling. These findings indicate that early-stage COPD patients have already occurred lung structural changes and early intervention may be needed to ameliorate the progression of disease.
Abbreviations
COPD, chronic obstructive pulmonary disease; micro-CT, micro-computed tomography; CT, computer tomography; TAC, total airway count; FEV1, forced expiratory volume in 1 second; FVC, forced vital capacity; HRCT, High resolution computer tomography; VIDA, Volumetric Information Display and Analysis; HU, Hounsfield units; LAA−950, low-attenuation area of the lung with attenuation values below −950 Hounsfield units on full-inspiration computed tomography; Perc15, the HU at which 15% of the voxels fall below at full inspiration; LAA−856, low-attenuation area of the lung with attenuation values below −856 Hounsfield units on full-expiration computed tomography; Pi10, the square root of the airway wall area for a theoretical airway with 10-mm internal perimeter; GOLD, Global Initiative for Chronic Obstructive Lung Disease; SD, standard deviation; IQR, interquartile range; ANCOVA, analysis of covariance; BMI, body mass index; CI, confidence interval; SE, standard error.
Data Sharing Statement
With the permission of the corresponding authors, we can provide participant data without names and identifiers. The corresponding authors have the right to decide whether to share the data based on the research objectives and plan provided. Data will be immediately available after publication. No end date. Please contact correspondence author for data requests.
Ethics Approval and Informed Consent
This study was approved by the Ethics Committee of the First Affiliated Hospital of Guangzhou Medical University (No. 2013-37), and all of the participants received information regarding radiation exposure and all provided written informed consent in advance of their participation in the study.
Acknowledgment
We thank Lianping County People’s Hospital and Wengyuan County People’s Hospital for providing us with the research follow-up site. We also thank all subjects and their families who agreed to donate their data for analysis. We thank Bijia Lin, Peiyu Huang, Shaodan Wei, Xiaopeng Lin (State Key Laboratory of Respiratory Disease, National Clinical Research Center for Respiratory Disease, Guangzhou Institute of Respiratory Health, The First Affiliated Hospital of Guangzhou Medical University, Nanshan Medicine Innovation Institute of Guangdong Province), for their efforts in collecting the information and verification.
Author Contributions
All authors made a significant contribution to the work reported, whether that is in the conception, study design, execution, acquisition of data, analysis and interpretation, or in all these areas; took part in drafting, revising or critically reviewing the article; gave final approval of the version to be published; have agreed on the journal to which the article has been submitted; and agree to be accountable for all aspects of the work.
Funding
This study was supported by the National Key Research and Development Program (2016YFC1304101, 2012BAI05B01), the Local Innovative and Research Teams Project of Guangdong Pearl River Talents Program (2017BT01S155), the National Natural Science Foundation of China (81970045 and 82000045), the Science and Technology Program of Guangzhou (202102080045) and Zhongnanshan Medical Foundation of Guangdong Province (ZNSA-202003, ZNSA-202012, and ZNSA-2020013).
Disclosure
The authors have no conflicts of interest to declare.
References
1. GOLD. Global strategy for the diagnosis, management, and prevention of chronic obstructive pulmonary disease; 2021. Available from: https://goldcopd.org/.
2. Koo H-K, Vasilescu DM, Booth S, et al. Small airways disease in mild and moderate chronic obstructive pulmonary disease: a cross-sectional study. Lancet Respir Med. 2018;6(8):591–602. doi:10.1016/S2213-2600(18)30196-6
3. McDonough JE, Yuan R, Suzuki M, et al. Small-airway obstruction and emphysema in chronic obstructive pulmonary disease. N Engl J Med. 2011;365(17):1567–1575. doi:10.1056/NEJMoa1106955
4. Diaz AA, Valim C, Yamashiro T, et al. Airway count and emphysema assessed by chest CT imaging predicts clinical outcome in smokers. Chest. 2010;138(4):880–887. doi:10.1378/chest.10-0542
5. Kirby M, Tanabe N, Tan WC, et al. Total airway count on computed tomography and the risk of chronic obstructive pulmonary disease progression. findings from a population-based study. Am J Respir Crit Care Med. 2018;197(1):56–65. doi:10.1164/rccm.201704-0692OC
6. Sieren JP, Newell JD
7. Kirby M, Tanabe N, Vasilescu DM, et al. Computed tomography total airway count is associated with the number of micro-computed tomography terminal bronchioles. Am J Respir Crit Care Med. 2020;201(5):613–615. doi:10.1164/rccm.201910-1948LE
8. Eddy RL, Svenningsen S, Kirby M, et al. Is computed tomography airway count related to asthma severity and airway structure and function? Am J Respir Crit Care Med. 2020;201(8):923–933. doi:10.1164/rccm.201908-1552OC
9. Everaerts S, McDonough JE, Verleden SE, et al. Airway morphometry in COPD with bronchiectasis: a view on all airway generations. Eur Respir J. 2019;54(5):1802166. doi:10.1183/13993003.02166-2018
10. Tanabe N, Sato S, Tanimura K, et al. Associations of CT evaluations of antigravity muscles, emphysema and airway disease with longitudinal outcomes in patients with COPD. Thorax. 2021;76(3):295–297. doi:10.1136/thoraxjnl-2020-215085
11. Zhou Y, Wang C, Yao W, et al. COPD in Chinese nonsmokers. Eur Respir J. 2009;33(3):509–518. doi:10.1183/09031936.00084408
12. Zhao D, Zhou Y, Jiang C, et al. Small airway disease: a different phenotype of early stage COPD associated with biomass smoke exposure. Respirology. 2018;23(2):198–205. doi:10.1111/resp.13176
13. Liu S, Zhou Y, Liu S, et al. Clinical impact of the lower limit of normal of FEV(1)/FVC on detecting chronic obstructive pulmonary disease: a follow-up study based on cross-sectional data. Respir Med. 2018;139:27–33. doi:10.1016/j.rmed.2018.04.011
14. Zhong N, Wang C, Yao W, et al. Prevalence of chronic obstructive pulmonary disease in China: a large, population-based survey. Am J Respir Crit Care Med. 2007;176(8):753–760. doi:10.1164/rccm.200612-1749OC
15. Gu D, Wu X, Reynolds K, et al. Cigarette smoking and exposure to environmental tobacco smoke in China: the international collaborative study of cardiovascular disease in Asia. Am J Public Health. 2004;94(11):1972–1976. doi:10.2105/ajph.94.11.1972
16. Zhang X, Xia T, Lai Z, et al. Uncontrolled asthma phenotypes defined from parameters using quantitative CT analysis. Eur Radiol. 2019;29(6):2848–2858. doi:10.1007/s00330-018-5913-1
17. Charbonnier JP, Pompe E, Moore C, et al. Airway wall thickening on CT: relation to smoking status and severity of COPD. Respir Med. 2019;146:36–41. doi:10.1016/j.rmed.2018.11.014
18. Society AT. Standardization of Spirometry, 1994 Update. American Thoracic Society. Am J Respir Crit Care Med. 1995;152(3):1107–1136. doi:10.1164/ajrccm.152.3.7663792.
19. Pellegrino R, Viegi G, Brusasco V, et al. Interpretative strategies for lung function tests. Eur Respir J. 2005;26(5):948–968. doi:10.1183/09031936.05.00035205
20. Quanjer PH, Tammeling GJ, Cotes JE, et al. Lung volumes and forced ventilatory flows. Report Working Party Standardization of Lung Function Tests, European Community for Steel and Coal. Official Statement of the European Respiratory Society. Eur Respir J Suppl. 1993;16:5–40.
21. Zheng J, Zhong N. Normative values of pulmonary function testing in Chinese adults. Chin Med J (Engl). 2002;115(1):50–54.
22. Vogelmeier CF, Criner GJ, Martinez FJ, et al. Global strategy for the diagnosis, management, and prevention of chronic obstructive lung disease 2017 report. GOLD executive summary. Am J Respir Crit Care Med. 2017;195(5):557–582. doi:10.1164/rccm.201701-0218PP
23. Hogg JC, Macklem PT, Thurlbeck WM. Site and nature of airway obstruction in chronic obstructive lung disease. N Engl J Med. 1968;278(25):1355–1360. doi:10.1056/NEJM196806202782501
24. Yanai M, Sekizawa K, Ohrui T, et al. Site of airway obstruction in pulmonary disease: direct measurement of intrabronchial pressure. J Appl Physiol (1985). 1992;72(3):1016–1023. doi:10.1152/jappl.1992.72.3.1016
25. Nakano Y, Wong JC, de Jong PA, et al. The prediction of small airway dimensions using computed tomography. Am J Respir Crit Care Med. 2005;171(2):142–146. doi:10.1164/rccm.200407-874OC
26. Ostridge K, Wilkinson TM. Present and future utility of computed tomography scanning in the assessment and management of COPD. Eur Respir J. 2016;48(1):216–228. doi:10.1183/13993003.00041-2016
27. Bhatt SP, Washko GR, Hoffman EA, et al. Imaging advances in chronic obstructive pulmonary disease. insights from the genetic epidemiology of Chronic Obstructive Pulmonary Disease (COPDGene) study. Am J Respir Crit Care Med. 2019;199(3):286–301. doi:10.1164/rccm.201807-1351SO
28. Grydeland TB, Dirksen A, Coxson HO, et al. Quantitative computed tomography measures of emphysema and airway wall thickness are related to respiratory symptoms. Am J Respir Crit Care Med. 2010;181(4):353–359. doi:10.1164/rccm.200907-1008OC
29. Mohamed Hoesein FA, de Jong PA, Lammers JW, et al. Airway wall thickness associated with forced expiratory volume in 1 second decline and development of airflow limitation. Eur Respir J. 2015;45(3):644–651. doi:10.1183/09031936.00020714
30. Kim V, Davey A, Comellas AP, et al. Clinical and computed tomographic predictors of chronic bronchitis in COPD: a cross sectional analysis of the COPDGene study. Respir Res. 2014;15(1):52. doi:10.1186/1465-9921-15-52
31. Bhatt SP, Soler X, Wang X, et al. Association between Functional Small Airway Disease and FEV1 decline in chronic obstructive pulmonary disease. Am J Respir Crit Care Med. 2016;194(2):178–184. doi:10.1164/rccm.201511-2219OC
 © 2021 The Author(s). This work is published and licensed by Dove Medical Press Limited. The full terms of this license are available at https://www.dovepress.com/terms.php and incorporate the Creative Commons Attribution - Non Commercial (unported, v3.0) License.
By accessing the work you hereby accept the Terms. Non-commercial uses of the work are permitted without any further permission from Dove Medical Press Limited, provided the work is properly attributed. For permission for commercial use of this work, please see paragraphs 4.2 and 5 of our Terms.
© 2021 The Author(s). This work is published and licensed by Dove Medical Press Limited. The full terms of this license are available at https://www.dovepress.com/terms.php and incorporate the Creative Commons Attribution - Non Commercial (unported, v3.0) License.
By accessing the work you hereby accept the Terms. Non-commercial uses of the work are permitted without any further permission from Dove Medical Press Limited, provided the work is properly attributed. For permission for commercial use of this work, please see paragraphs 4.2 and 5 of our Terms.