Back to Journals » Diabetes, Metabolic Syndrome and Obesity » Volume 16
Association of Serum Leptin and Adiponectin Concentrations with Type 2 Diabetes Biomarkers and Complications Among Saudi Women
Authors Mohammed Saeed W ![]() , Nasser Binjawhar D
, Nasser Binjawhar D
Received 19 January 2023
Accepted for publication 10 June 2023
Published 13 July 2023 Volume 2023:16 Pages 2129—2140
DOI https://doi.org/10.2147/DMSO.S405476
Checked for plagiarism Yes
Review by Single anonymous peer review
Peer reviewer comments 2
Editor who approved publication: Dr Konstantinos Tziomalos
Walaa Mohammed Saeed,1 Dalal Nasser Binjawhar2
1Department of Medical Laboratory Technology, Faculty of Applied Medical Science, Taibah University, Tayba, Medina, 42353, Saudi Arabia; 2Department of Chemistry, College of Science, Princess Nourah bint Abdulrahman University, Riyadh, 11671, Saudia Arabia
Correspondence: Dalal Nasser Binjawhar, Email [email protected]
Objective: Hyperglycemia and insulin resistance (IR) put obese women with Type 2 diabetes mellitus (T2DM) at risk for cardiovascular disease (CVD).
Methods: 150 T2DM women aged 30– 45 were studied cross-sectionally at Madinah Hospital lab to find T2DM risk factors and their association with adiponectin/leptin levels.
Results: Women with T2DM showed greater fasting blood glucose (FBG), hemoglobin A1c (HbA1c), triglycerides (TG), body mass index (BMI), waist circumference (WC), insulin resistance (IR), high-sensitivity C-reactive protein (hs-CRP), and CVD risk (high atherogenic index of plasma (AIP) and leptin), but decreased high-density lipoprotein (HDL-cholesterol) and poor insulin sensitivity with low adiponectin. Obese women with T2DM had increased leptin and reduced adiponectin. Leptin levels were significantly related to IR, BMI, and AIP (B= 3.97, P= 0.02) but not WC. Leptin levels were negatively correlated with insulin sensitivity (IS) and HDL-c (P< 0.05). In linear regression analysis, adiponectin levels had a significant association with IS and HDL-c (P= 0.03, P= 0.04) but an inverse relationship with IR, BMI, WC (B=− 2.91, P= 0.04), and AIP (P< 0.05).
Conclusion: Increased leptin levels are related to high IR, AIP, and BMI among T2DM female patients. Similarly, adiponectin levels decrease IS and HDL-c. Therefore, obese T2DM women with high leptin and low adiponectin levels should be periodically checked to avoid or decrease consequences like CVD.
Keywords: adiponectin, cardiovascular disease, insulin resistance, leptin, obesity, type 2 diabetes
Introduction
Type 2 diabetes mellitus (T2DM) accounts for 90% of all diabetes cases and can be characterized by hyperglycemia, insulin resistance (IR), and insufficiency. It is reported that diabetes mellitus (DM) has a substantial economic impact; the indirect national financial burden is anticipated to be over 0.87 billion USD, and patients with diabetes have about ten times greater healthcare expenses than those without diabetes (3686$ vs 380$).1–3 Diabetes affects 31.6% of Saudi Arabia’s (KSA) population, among which 27.6% are women.4 Reportedly, cardiovascular disease (CVD) is a prevalent consequence of DM, and it continues to be the major cause of mortality and disability among DM patients. According to a Saudi Scientific Diabetes Society research, > 50% of DM patients die from cardiovascular reasons. The number of DM patients with higher cardiovascular risk is predicted to provide a significant challenge to the healthcare systems of KSA, and the proportion of DM survivors of cardiovascular events is rising globally.5 According to World Health Organization 2021 reports, 33.7% of Saudis are obese, and 68.2% are overweight, demonstrating that preventive measures are missing or inefficient.5,6
Obese people are at risk for diabetes, CVD, stroke, cancer, and obstructive sleep apnea. Better knowledge of DM, CVD, and obesity pathogeneses linkages is needed to create innovative techniques for lowering patient health problems and discovering new diagnostic biomarkers. Leptin is a 16-kDa protein hormone that regulates appetite and energy balance. Leptin has a key function in the pathogenesis of obesity and IR.7 Experimental investigations show that serum leptin regulates brain glucose. Some studies found a high connection between diabetes biomarkers and leptin levels,8 while others found none.7 Adiponectin, another adipokine, protects against IR/diabetes and atherosclerosis. Reduced adiponectin levels may contribute to T2DM, obesity, and CVD. Adiponectin regulates insulin sensitivity, glucose, lipid metabolism, and cardiovascular homeostasis.9 Leptin and adiponectin are hormones secreted from adipose tissue; leptin promotes metabolism and lowers hunger, while adiponectin mediates insulin-sensitizing action. Abnormal levels of leptin are linked to obesity and IR. Greater adipose tissue (body fat) mass and IR raise leptin levels, whereas higher body fat mass and insulin sensitivity reduce adiponectin levels.
As Saudi females have a greater incidence of T2DM, obesity, and CVD, leptin and adiponectin levels with T2DM biomarkers and comorbidities were evaluated with the expectation that leptin, adiponectin, and T2DM consequences, including CVD, would be linked to obese status.
Methodology
Cross-sectional research was done between 2021 −2022 on 150 women with T2DM aged between 30–45. In contrast, T2DM was defined by hemoglobin A1c (HbA1c) 6.5% (48 mmol/mol), fasting blood glucose (FBG) ≥126mg/dL, self-reported use of insulin or oral hypoglycemic medicines, or physician diagnosis.6 The study at Madinah hospital laboratories identified biological and behavioral risk factors for T2DM and adiponectin/leptin as described.
Biological Factors
- Anti-hypertriglyceridemic, anti-hyperlipidemic, and anti-hypertensive medication (each) usage was identified as “yes” for use or “no” for nonuse.
- Fasting insulin, low-density lipoprotein cholesterol (LDL-c), high-density lipoprotein cholesterol (HDL-c), total cholesterol (TC), triglyceride (TG), FBG, HbA1c, and high sensitive-C-reactive protein (hs-CRP), were measured from blood samples using standard laboratory techniques.
- In diabetic patient serum, leptin and adiponectin hormones were determined via quantitative Enzyme-Linked Immunosorbent Assay (ELISA) based chemiluminescent assay (CUSABIO Technology LLC, Houston, USA). The performed processes were constructed according to the manufacturer’s instructions, and the mean absorbances of the standards and samples were determined in triplicate. Leptin and adiponectin levels reference range according to the kit’s manufacturer are 0.5–15.5 ng/mL and 5–30 μg/mL, respectively.
- Using fasting values, IR was measured using the homeostasis model assessment-estimated insulin resistance (HOMA-IR index) = [glucose (mmol/L) * insulin (U/mL)/22.5]. The contributors were categorized according to the tertiles of HOMA-IR into low, middle, and high-level groups. The lower tertile was defined as HOMA-IR <1.8; the middle was HOMA-IR > 1.9, and the upper was HOMA-IR > 2.9.10 Insulin sensitivity was measured using the Quantitative Insulin Sensitivity Check (QUICKI) Index, which is 0.45 in healthy people and 0.30 in people with diabetes11 while IR is below 0.39.
- The AIP (log10 {TG/HDL-c}) was calculated as an atherogenic dyslipidemia index. The AIP is categorized as low risk for CVD (< 0.1), medium risk (0.1–0.24), and high risk (>0.24).12
Behavioral Factor
- Smoking status was identified as previous, current, and never smokers.
- Physical activity was evaluated with a four-domain physical activity assessment instrument: (1) active living, (2) work, (3) home/garden, and (4) sport/exercise indexes. These scores vary from 1 to 5, with higher scores indicating a higher level of physical activity. The sum of these four domain scores was utilized to calculate a total score with a maximum value of 20.13
- Body mass index (BMI), weight, and height were determined twice using an electronic scale (Beurer GmbH Type PS 07, China). The contributors were categorized according to the tertiles of the BMI, such as underweight (<18.5Kg/m2), normal (18.5–25.0Kg/m2), overweight (25.0–29.9Kg/m2), or obese (>30.0Kg/m2).6
- Waist circumference (WC) was measured to the nearest centimeter at the belly button. Women with a WC ≥ 88 cm were considered abdominally obese, while women with WC < 88 cm were considered abdominally non-obese.6
Statistical Analysis
GraphPad Prism 7 was used for statistics (GraphPad Software, CA, USA). Continuous data were reported as mean SD (Mean ± Standard deviation) and categorical data as numbers (%). One-way ANOVA was used to compare research categories. Pearson’s correlation was used to compare leptin, adiponectin, glucose, HbA1c, insulin, hs-CRP, lipid profile, BMI, and AIP. Multiple linear regression was utilized to investigate serum leptin and adiponectin’s impact on T2DM indicators, obesity markers, and CVD risk variables. Serum leptin and adiponectin levels were used as the independent variable, and several dependent variables. Multiple linear regression was run twice on serum leptin and serum adiponectin levels in diabetic women to generate unstandardized coefficients (B) with 95% confidence intervals. All differences were signified at P≤0.05 or P≤0.001.
Results
General Characteristics of Participants with T2DM
Women with T2DM average age was 55.5 years, while 36.7%, 30%, and 46.7% were prescribed anti-hypertriglyceridemic, anti-hyperlipidemic, and anti-hypertensive medications, respectively, and were less physically active. These participants also had higher FBG, HbA1c, triglycerides, BMI, WC, HOMA-IR, hs-CRP and were at higher risk of CVD (high AIP) and high leptin levels but lower HDL-c and low insulin sensitivity with low adiponectin level (Table 1).
 |
Table 1 Characteristics of Women with T2DM |
Participants’ Characteristics According to HOMA-IR Index and BMI Categories
Table 2 shows the participants’ biological and anthropometric data. Participants were separated into three groups according to the HOMA-IR tertile range, ie, lower tertile HOMA-IR <1.8 (20(13.3%)), HOMA-IR index ≥1.9 (60(40%)) is middle tertile. Upper tertile: HOMA-IR ≥2.9 (70(46.7%)). Clinical and anthropometric data were evaluated using a one-way ANOVA. FBG, HDL-c, TG, BMI, WC, hs-CRP, leptin, adiponectin, and IS differed amongst the HOMA-IR groups. High HOMA-IR T2DM women had increased leptin and reduced adiponectin. High HOMA-IR candidates had high BMI and WC. The high HOMA-IR group with high CVD risk, evaluated by AIP, had higher TG and hs-CRP values but lower HDL-c and IS.
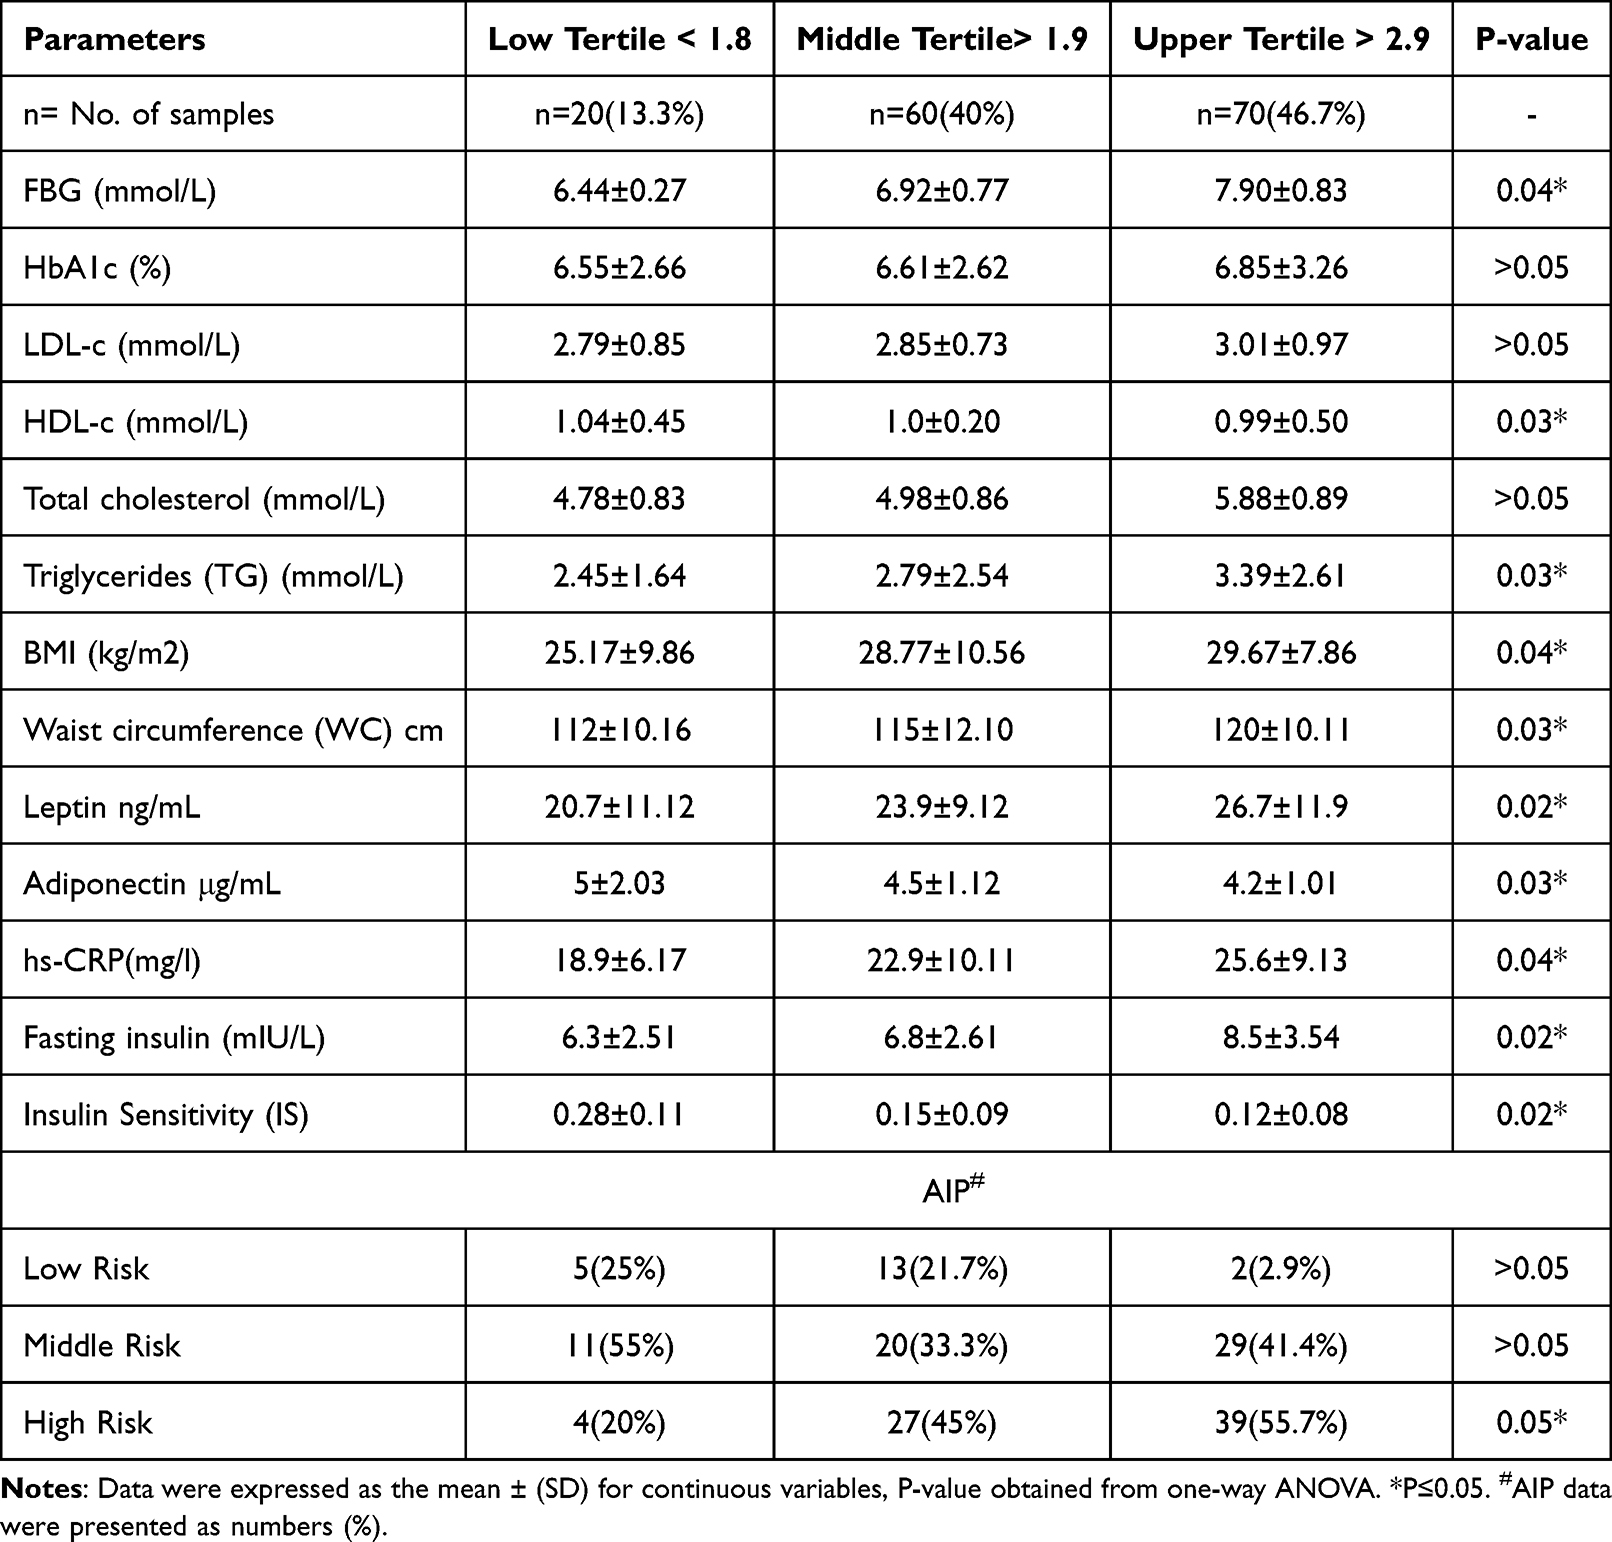 |
Table 2 Characteristics of Participants According to the Insulin Resistance (HOMA-IR) Index |
Table 3 summarizes the characteristics of 150 diabetic people according to BMI tertiles such as 15.3% is normal (18.5–25.0Kg/m2), 41.3% is overweight (25.0–29.9Kg/m2), and 43.4% is obese (>30.0Kg/m2). However, the BMI of the three groups differed significantly. FBG differed between normal (6.41), overweight (6.90), and obese (7.93) BMI participants. Three tertiles also significantly differ in HDL-c, TG, and WC (P<0.05). The obese tertile had a higher average leptin level (28.7, P=0.02) than the other two tertiles, although adiponectin was lower (3.6, P=0.03). IR and hs-CRP are increased in obese people (3.1, 26.6, respectively). However, IS is lower in obese tertile than in the two categories. 55.4% of obese people had a greater AIP risk of CVD.
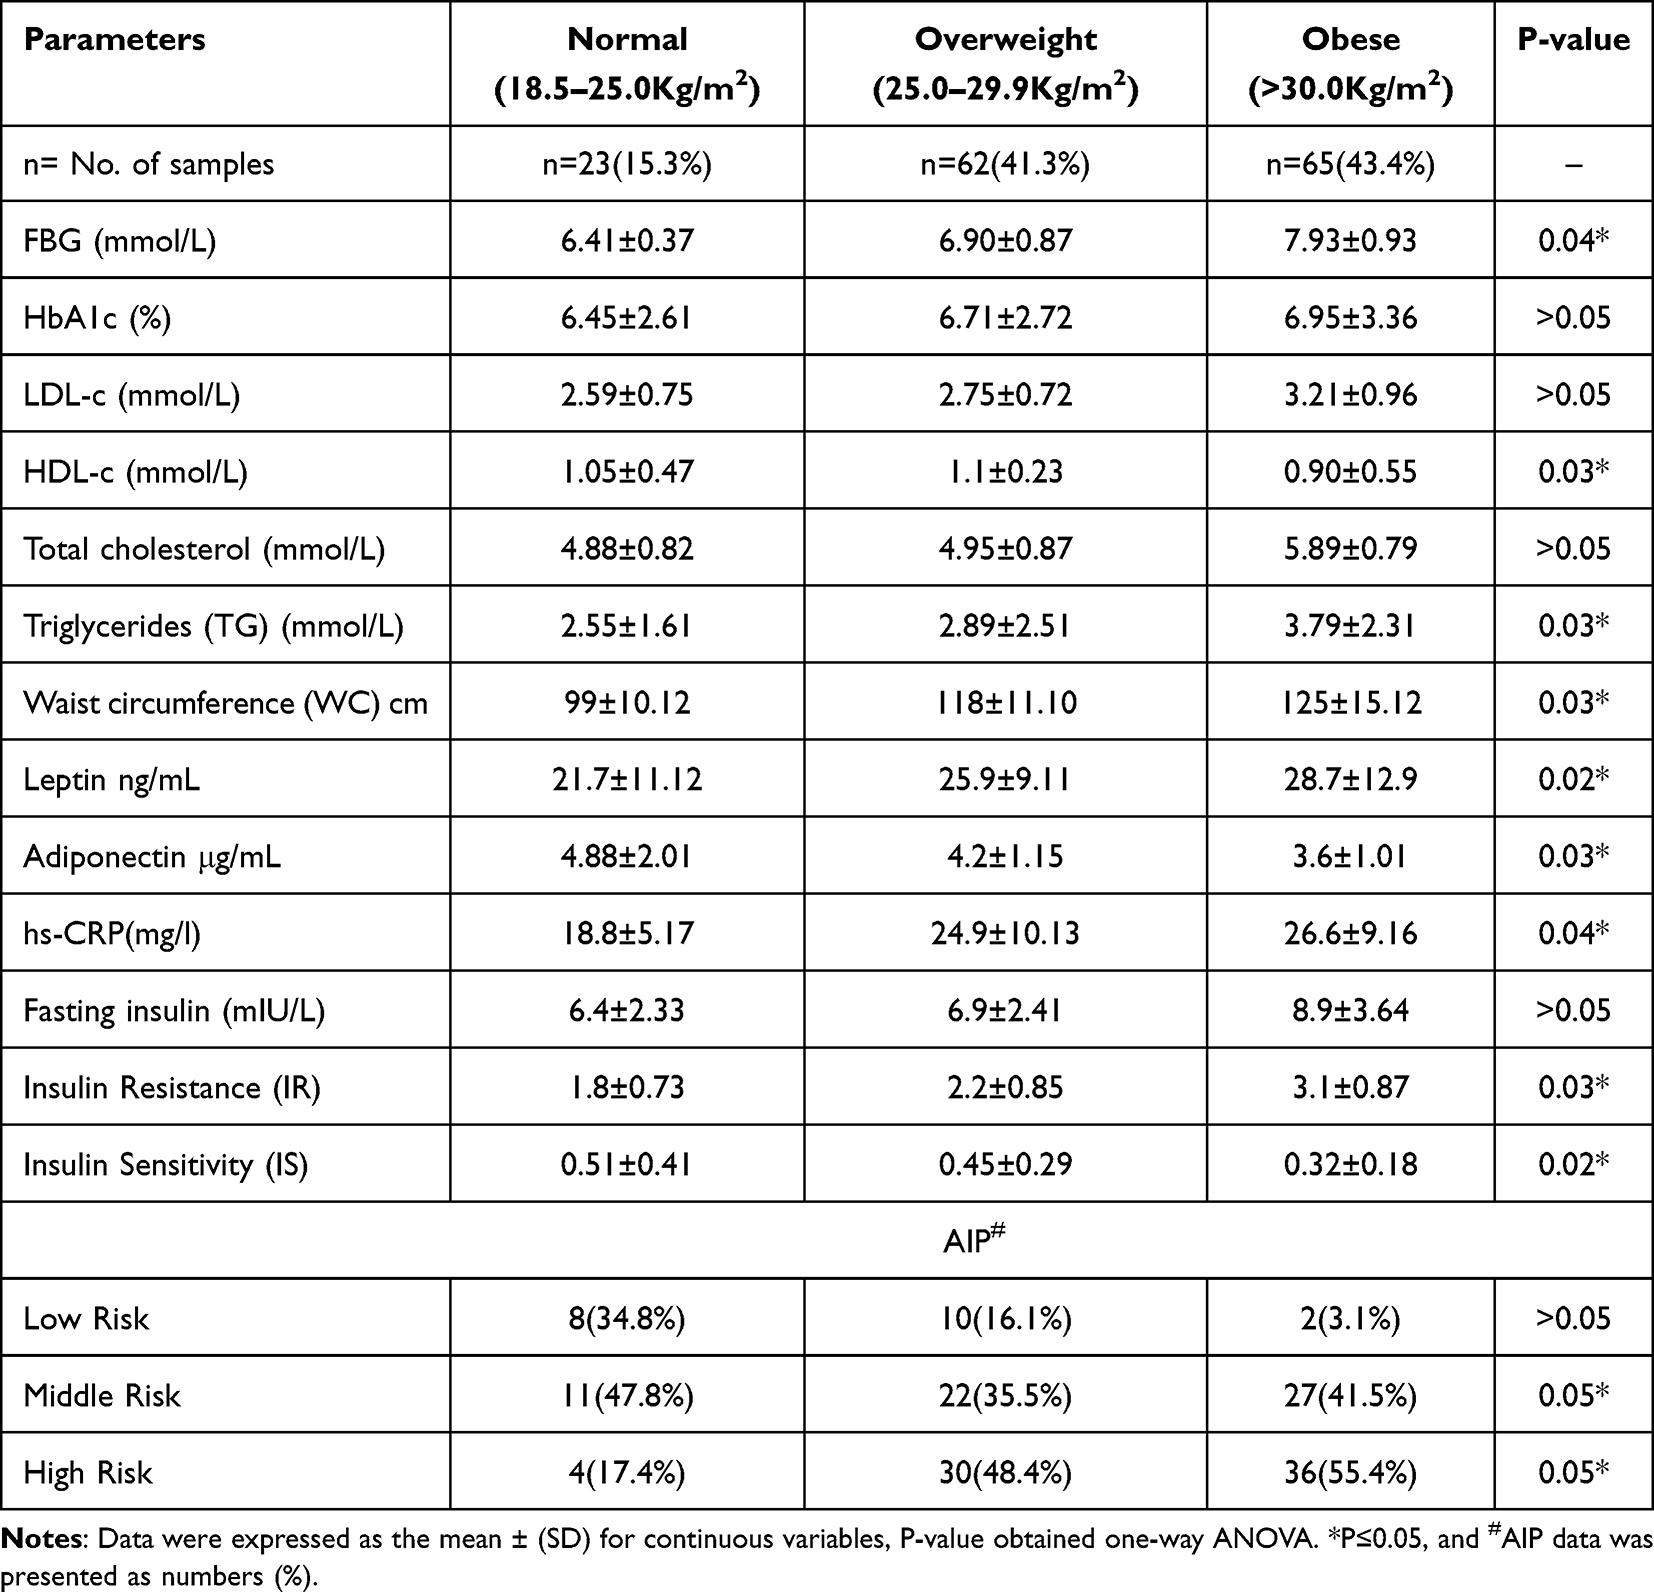 |
Table 3 Characteristics of Participants According to BMI Categories |
The Correlation Between Leptin, Adiponectin, and Other Biomarkers in High HOMA-IR Index Tertile and High BMI (Obese Tertile)
Table 4 shows leptin, adiponectin, and biological factor relationships. Leptin is linked strongly with HOMA-IR (P = 0.001). Leptin is associated favorably with FBG, TG, WC, hs-CRP, BMI, and AIP. An inverse correlation was found between leptin and IS, HDL-c levels, with statistical significance (P= 0.05 and 0.02, respectively). Adiponectin is linked adversely with HOMA-IR (P = 0.002). In addition, adiponectin is linked adversely with FBG, TG, WC, hs-CRP, BMI, and AIP. Adiponectin, IS, and HDL-c levels correlated positively (P= 0.04 and 0.02, respectively).
 |
Table 4 Pearson’s Correlation Coefficients Between Leptin, Adiponectin, and Another Factor |
Multiple Linear Regression Analysis to Determine the Effects of Serum Leptin Level and Serum Adiponectin Level on T2DM Markers, Obesity Markers, and the Risk Factors for CVD in High HOMA-IR Index Tertile and High BMI (Obese Tertile)
Table 5A Model 1 focused on people with diabetes and employed leptin as an independent variable. The model summary showed that R2=0.655 explained 65.5% of the variation in IR, IS, BMI, HDL-c, and AIP levels from leptin. The coefficient table showed a significant connection between leptin levels and IR (B=5.98, P= 0.002), BMI (B= 3.89, P= 0.001), and AIP (B=3.97, P= 0.02), but not WC (P> 005). However, leptin levels correlated negatively with IS (B=−6.38, P=0.01) and HDL-c (B=−2.85, P=0.02). Table 5B showed a significant relationship between adiponectin levels and IS and HDL-c (B= 3.33, P= 0.03, B= 4.83, P= 0.04, respectively) when adiponectin was used as an independent variable in linear analysis (Model 2). However, the results of linear regression demonstrated a significant inverse relationship between adiponectin levels and IR (B=−3.76, P= 0.02), BMI (B=−5.95, P= 0.03), WC (B=−2.91, P= 0.04) and AIP (B=−2.38, P= 0.04) with R2 =0.643. Additionally, the result from linear regression proved a negative and inverse relationship between leptin and adiponectin levels in T2DM patients (Table 5).
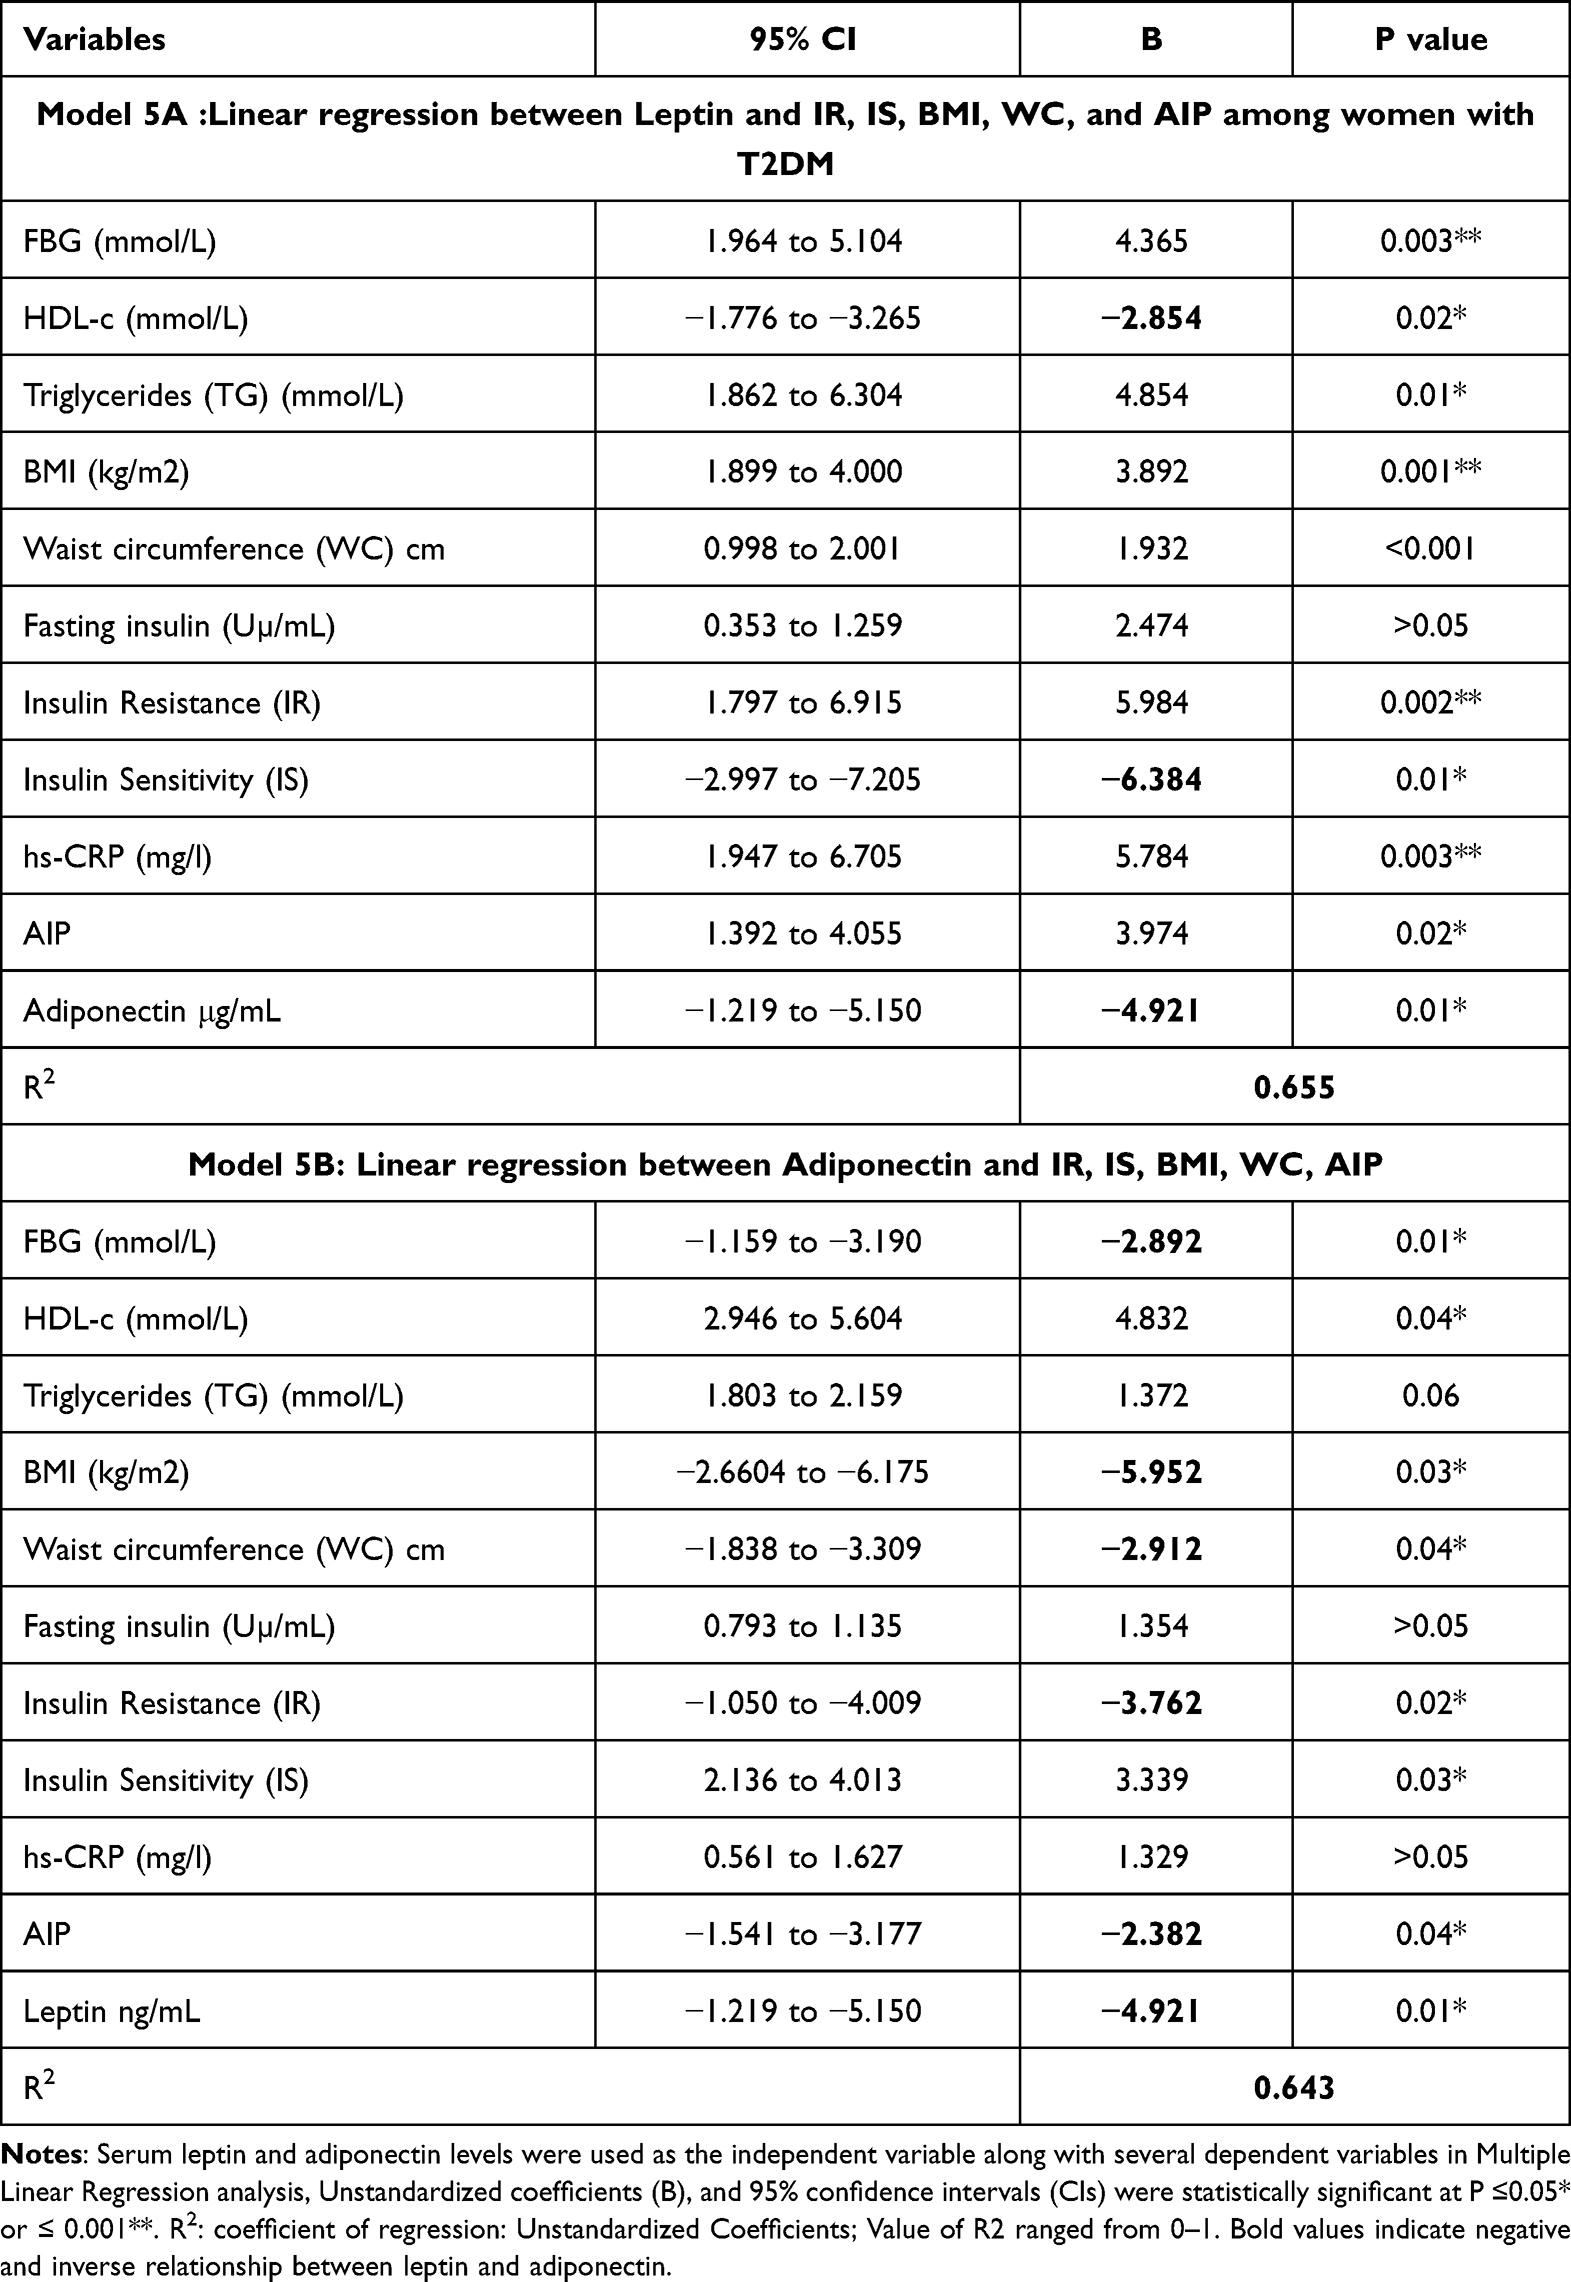 |
Table 5 Multiple Linear Regression Analysis to Determine the Effects of Serum Leptin Level (Model 1) and Serum Adiponectin Level (Model 2) on T2DM Markers, Obesity Markers, and the Risk Factors for CVD |
Discussion
IR is a key factor in the pathogenesis of obesity and T2DM, and several studies have shown a link between IR and adipose tissue indicators, including leptin and adiponectin.14–16 Therefore, this research aims to examine how leptin and adiponectin levels affect IR, IS, BMI, WC, and AIP in Saudi women with T2DM. This is the first research on Saudi females that studied leptin and adiponectin levels in T2DM, including obesity and CVD risk factors.
Relationship Between Leptin and Diabetes, Obesity, and the Risk of CVD
Table 1 shows that leptin and AIP index increased FBG, HbA1C, lipid levels, BMI, and hs-CRP. While the HOMA-IR index also increases similar indicators, Table 2. These results parallel the IR study, which is favorably linked with metabolic indicators.14–16 Our study demonstrated that increasing leptin levels were substantially related to IR and other risk factors, such as triglycerides, FBG, and BMI, but inversely associated with HDL-c, a protective factor against IR.16 It was discovered that leptin levels might predict IR. The linear regression analysis showed a statistically significant connection between leptin levels and IR in women with T2DM and impaired insulin sensitivity. Some studies show leptin plays a key role in the pathophysiology of IR.17,18 Serum leptin rises with obesity, according to Guarino et al,17 as it’s linked to BMI and adiposity in women. However, our data showed that serum leptin concentrations in women increase with BMI and IR. BMI is the most important factor related to elevated blood leptin levels in women, according to many investigations.19 These investigations found a favorable connection between serum leptin and triacylglycerol in women with a high BMI. This supports our findings. Leptin was linked with IR and BMI in diabetic women, although relationships depended on BMI. In another investigation, women’s body mass, body fat mass, and blood leptin levels were also strongly correlated.20 In women, subcutaneous abdominal adipocytes secrete three times more leptin than intra-abdominal fat. Subcutaneous adipocytes are the principal source of serum leptin,20 which partly explains our participants’ elevated leptin level due to their high WC and BMI.
Also, several researches have proven leptin’s cardiovascular effects.21,22 However, leptin’s role in promoting CVD is still controversial. Many researchers support its role as a factor that stimulates inflammation, oxidative stress, atherogenesis, and thrombosis, consequently stimulating endothelial dysfunction, arterial stiffness, and atherosclerotic plaque development.23 Raised leptin levels are linked to IR and T2DM.24 In T2DM, high leptin levels increase CVD risk.25 In T2DM patients with high leptin levels, obesity, hypertension, Metabolic syndrome MetS, and endothelial dysfunction are more prevalent.26,27 The research found a favorable and direct association between high leptin and high AIP, a valuable indication for diagnosing CVD risk. Leptin levels increase the risk of CVD in T2DM women with high IR and obesity. In obesity, excessive fat buildup causes an increase in free fatty acids in adipose tissue, which raises triglyceride levels. Adipose tissue produces leptin, which regulates energy balance and weight. Leptin reduces lipid, fatty acid, and acetyl CoA carboxylase production, causing lipid buildup. HDL-c struggles to restrict triglyceride and cholesterol formation in the arteries, making atherosclerosis difficult to prevent.
The research found an association link between leptin and triglycerides in T2DM women with high IR but a negative relationship with HDL-c. Leptin increases triglycerides and reduces HDL-c, making it an independent risk factor for CVD. T2DM women exhibited high hs-CRP levels, which are linked with increased leptin. Higher hs-CRP is linked to a high global cardiovascular risk without baseline CVD. hs-CRP is useful in CVD risk assessment and promotes vascular inflammation, vessel damage, and clinical CVD events. It may also predict the long-term risk for myocardial infarction and fast cardiac mortality in healthy persons.28 The study results indicated that leptin might be an independent risk factor for IR and CVD risk variables, such as raising triglyceride and hs-CRP levels and reducing HDL-c levels in T2DM and obese women.
Relationship Between Adiponectin and Diabetes, Obesity, and the Risk of CVD
Table 1 shows that metabolic indicators increased, whereas adiponectin and HDL-c decreased. As HOMA-IR and BMI elevated, adiponectin levels fell (Table 2 and (Table 3). Several clinical studies revealed that elevated adiponectin is a negative predictor of IR and T2DM in BMI-adjusted subjects,29,30 and a low plasma adiponectin level may increase T2DM risk.31 In agreement with these previous studies, the results showed a substantial negative association between adiponectin decrease and IR but a favorable link with IS. The linear regression analysis showed a significant negative correlation between adiponectin levels and high IR and BMI levels in females with T2DM. In obese people, visceral body fat may affect health owing to aberrant adipokine production. Adiponectin is essential for energy metabolism; its levels drop in obesity and increase following weight reduction.32,33 Adiponectin is negatively related to BMI, glucose, insulin, triglyceride, IR, and visceral fat.32 From lean to overweight to obese, adipose tissue enlarges. This changes leptin and adiponectin levels. Hypoadiponectinemia, inversely linked with fat mass, may connect obesity to CVD. Several human investigations have linked hypoadiponectinemia to cardiovascular problems.32,33 Consistent with the mentioned studies, our findings showed that obese women with T2DM and low adiponectin and HDL-c were at elevated risk of CVD. Low adiponectin levels are highly connected with obesity-related cardiovascular illnesses, including ischemic heart disease and peripheral artery disease. Therefore, reduced adiponectin may cause IR, T2DM, and CVD.
Relationship Between Leptin and Adiponectin
Leptin and adiponectin strongly associate with T2DM3,34 and obesity, according to Liao et al and Lee et al.35,36 The research found that IR individuals had lower adiponectin levels, and leptin increases with obesity in diabetic patients, although adiponectin decreases.37 Wang et al found that adiponectin lowered blood leptin and IR.38 These results align with multiple linear regression that showed a negative and inverse connection between leptin and adiponectin in T2DM women with high IR and BMI (obese female).
Conclusion
This study presented better knowledge of the relationship between leptin, adiponectin, and the major factors involved in the complications of T2DM, such as CVD and obesity in Saudi females first time (Figure 1). In summary, the study revealed that IR, BMI, hs-CRP, TG, and AIP were the main factors associated positively with the raising in leptin levels in Saudi female diabetic patients, while HDL-c and IS were the major factors correlated positively with a reduction in adiponectin levels. In addition, the decrease in adiponectin levels is associated with a reduction in IS and HDL-c levels. Therefore, individuals with high leptin and low adiponectin levels should be monitored in T2DM obese females, and sufficient healthcare should be offered to prevent or reduce T2DM complications such as CVD. Moreover, there are certain limitations to our investigation when it comes to sampling size and gender; therefore, future research must compare the sexes on a large-scale basis.
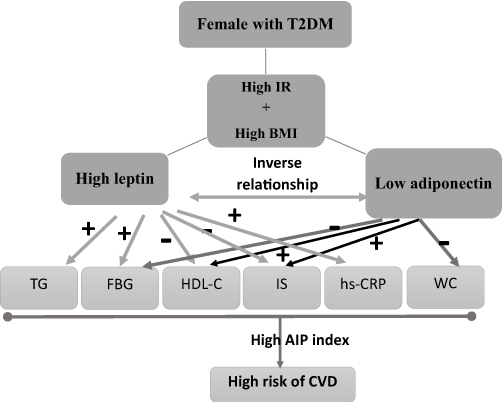 |
Figure 1 Schematic chart representation of the influences of high leptin and low adiponectin levels on major factors involved in the complications of T2DM, such as CVD in Saudi females with high insulin resistance (IR) and high body mass index (BMI), triglycerides (TG), fasting blood glucose (FBG), high-density lipoprotein-cholesterol (HDL-C), insulin sensitivity (IS), C-reactive protein (hs-CRP), and waist circumstance (WC). (+) represented positive relation whereas (-) represented negative. |
Research Summary
- IR, BMI, hs-CRP, TG, and AIP were the main factors associated positively with the raising in leptin levels in Saudi female diabetic patients, while HDL-c and IS were the major factors correlated positively with a reduction in adiponectin levels.
- Individuals with high leptin and low adiponectin levels should be monitored in T2DM obese females, and sufficient healthcare should be offered to prevent or reduce T2DM complications such as CVD.
Abbreviations
IR, Insulin Resistance; DM, Diabetes Mellitus; (HOMA-IR Index), Homeostasis Model Assessment-Estimated Insulin Resistance; AIP, Atherogenic Index of Plasma; BMI, Body Mass Index; CVD, Cardiovascular Disease; ELISA, Enzyme-Linked Immunosorbent Assay; FBG, Fasting Blood Glucose; Hba1c, Hemoglobin A1c; HDL-C, High-Density Lipoprotein; Hs-CRP, High-Sensitivity C-Reactive Protein; IS, Insulin Sensitivity; LDL-C, Low-Density Lipoprotein Cholesterol; QUICKI, Quantitative Insulin Sensitivity Check Index; T2DM, Type 2 Diabetes Mellitus; TC, Total Cholesterol; TG, Triglycerides; WC, Waist Circumference.
Data Sharing Statement
The dataset produced for this study is accessible on request to the corresponding author.
Ethics Approval Statement
Ethical authorization to carry out the study was obtained from the Ethical Committee at the College of Applied Medical Sciences, Taibah University, Madinah, and the Institutional Review Board, General Directorate of Health Affairs in Madinah (IRB 022-22).
Patient Consent Statement
All participants were priorly informed about the research and written informed consent were obtained by following the Helsinki guidelines and was accepted by the Ethical Committee at the College of Applied Medical Sciences, Taibah University.
Acknowledgments
The authors thank Princess Nourah bint Abdulrahman University Researchers Supporting Project number (PNURSP2023R155), Princess Nourah bint Abdulrahman University, Riyadh, Saudi Arabia. The authors would also be grateful to Miss Johayna Aboalkayer (Taibah University, Medical Applied Science College’s technician), the lab technician who supported and helped us in the current study.
Funding
The author affirms that this research obtained a specific grant from Princess Nourah bint Abdulrahman University Researchers Supporting Project number (PNURSP2023R155), Princess Nourah bint Abdulrahman University, Riyadh, Saudi Arabia.
Disclosure
The authors report no conflicts of interest in this work.
References
1. Alhowaish AK. Economic costs of diabetes in Saudi Arabia. J Family Community Med. 2013;20(1):1. doi:10.4103/2230-8229.108174
2. IDF. The international diabetes federation Available from: https://idf.org/our-network/regions-members/middle-east-and-north-africa/members/46-saudi-arabia.html.
3. Saati S, Dehghan P, Azizi-Soleiman F, Mobasseri M. The effect of bitter almond (Amygdalus communis L. var. Amara) gum as a functional food on metabolic profile, inflammatory markers, and mental health in type 2 diabetes women: a blinded randomized controlled trial protocol. Trials. 2023;24(1):1–10. doi:10.1186/s13063-023-07085-7
4. Abou-Gamel M, Abdul-Nassir M, Rajeh A, et al. The prevalence of diabetes mellitus among working personnel in the faculty of science, Taibah University, Almadinah Almunawwarah, KSA. J Taibah Univ Med Sci. 2014;9(1):85–88. doi:10.1016/j.jtumed.2013.07.007
5. Alqarni SSM. A review of prevalence of obesity in Saudi Arabia. J Obes Eat Disord. 2016;2(2):1–6.
6. WHO. Noncommunicable diseases. Available from: https://www.who.int/news-room/fact-sheets/detail/noncommunicable-diseases.
7. Scheja L, Heeren J. The endocrine function of adipose tissues in health and cardiometabolic disease. Nat Rev Endocrinol. 2019;15(9):507–524. doi:10.1038/s41574-019-0230-6
8. Mohammadzadeh G, Zarghami N. Serum leptin level is reduced in non-obese subjects with type 2 diabetes. Int j Endocrinol Metab. 2013;11(1):3. doi:10.5812/ijem.6535
9. Zhang L, Li -M-M, Corcoran M, Zhang S, Cooper GJ. Essential roles of insulin, AMPK signaling and lysyl and prolyl hydroxylases in the biosynthesis and multimerization of adiponectin. Mol Cell Endocrinol. 2015;399:164–177. doi:10.1016/j.mce.2014.09.014
10. Tang Q, Li X, Song P, Xu L. Optimal cut-off values for the homeostasis model assessment of insulin resistance (HOMA-IR) and pre-diabetes screening: developments in research and prospects for the future. Drug Discov Ther. 2015;9(6):380–385. doi:10.5582/ddt.2015.01207
11. Ho -C-C, Tseng C-Y, Chen H-W, et al. Coenzyme Q10 status, glucose parameters, and antioxidative capacity in college athletes. J Int Soc Sports Nutr. 2020;17(1):5. doi:10.1186/s12970-020-0334-3
12. Wekesa C, Asiki G, Kasamba I, et al. Atherogenic risk assessment among persons living in rural Uganda. J Trop Med. 2016;2016:1–8. doi:10.1155/2016/7073894
13. Davis SK, Gebreab SY, Xu R, et al. Association of adiponectin with type 2 diabetes and hypertension in African American men and women: the Jackson Heart Study. BMC Cardiovasc Disord. 2015;15(1):1–10. doi:10.1186/s12872-015-0005-5
14. Agarwal T, Lyngdoh T, Dudbridge F, et al. Causal relationships between lipid and glycemic levels in an Indian population: a bidirectional Mendelian randomization approach. PLoS One. 2020;15(1):e0228269. doi:10.1371/journal.pone.0228269
15. de Abreu VG, Martins C, de Oliveira PAC, Francischetti EA. High-molecular weight adiponectin/HOMA-IR ratio as a biomarker of metabolic syndrome in urban multiethnic Brazilian subjects. PLoS One. 2017;12(7):e0180947. doi:10.1371/journal.pone.0180947
16. Keska A, Lutoslawska G, Czajkowska A, Tkaczyk J, Mazurek K. Variability in HOMA-IR, lipoprotein profile and selected hormones in young active men. Sci World J. 2013;2013:1–6. doi:10.1155/2013/412764
17. Guarino D, Nannipieri M, Iervasi G, Taddei S, Bruno RM. The role of the autonomic nervous system in the pathophysiology of obesity. Front Physiol. 2017;8:665. doi:10.3389/fphys.2017.00665
18. Russo B, Menduni M, Borboni P, Picconi F, Frontoni S. Autonomic nervous system in obesity and insulin-resistance—The complex interplay between leptin and central nervous system. Int J Mol Sci. 2021;22(10):5187. doi:10.3390/ijms22105187
19. Konstantinidou SK, Argyrakopoulou G, Tentolouris N, Karalis V, Kokkinos A. Interplay between baroreflex sensitivity, obesity and related cardiometabolic risk factors. Exp Ther Med. 2022;23(1):1–13. doi:10.3892/etm.2021.10923
20. Paiva ES, Andretta A, Batista ED, et al. Serum levels of leptin and adiponectin and clinical parameters in women with fibromyalgia and overweight/obesity. Arch Endocrinol Metab. 2017;61:249–256. doi:10.1590/2359-3997000000248
21. Karayannis G, Giamouzis G, Tziolas N, et al. Association between epicardial fat thickness and weight homeostasis hormones in patients with noncachectic heart failure. Angiology. 2013;64(3):173–180. doi:10.1177/0003319712447978
22. Koleva DI, Orbetzova MM, Nikolova JG, Deneva TI. Pathophysiological role of adiponectin, leptin and asymmetric dimethylarginine in the process of atherosclerosis. Folia Med (Plovdiv). 2016;58(4):234. doi:10.1515/folmed-2016-0039
23. Pérez-Pérez A, Vilariño-García T, Fernández-Riejos P, Martín-González J, Segura-Egea JJ, Sánchez-Margalet V. Role of leptin as a link between metabolism and the immune system. Cytokine Growth Factor Rev. 2017;35:71–84. doi:10.1016/j.cytogfr.2017.03.001
24. Andrade-Oliveira V, Câmara NO, Moraes-Vieira PM. Adipokines as drug targets in diabetes and underlying disturbances. J Diabetes Res. 2015;2015:1–11. doi:10.1155/2015/681612
25. Kurajoh M, Koyama H, Kadoya M, et al. Plasma leptin level is associated with cardiac autonomic dysfunction in patients with type 2 diabetes: HSCAA study. Cardiovasc Diabetol. 2015;14(1):1–8. doi:10.1186/s12933-015-0280-6
26. Liu X, Li X, Li C, Gong C, Liu S, Shi Y. Study on regulation of adipokines on body fat distribution and its correlation with metabolic syndrome in type 2 diabetes mellitus. Minerva Endocrinol. 2017;44(3):259–263. doi:10.23736/S0391-1977.17.02773-0
27. Morioka T, Emoto M, Yamazaki Y, et al. Leptin is associated with vascular endothelial function in overweight patients with type 2 diabetes. Cardiovasc Diabetol. 2014;13(1):1–9. doi:10.1186/1475-2840-13-10
28. Tang Y, Fung E, Xu A, Lan HY. C‐reactive protein and ageing. Clin Exp Pharmacol Physiol. 2017;44:9–14. doi:10.1111/1440-1681.12758
29. DeBoer MD, Gurka MJ, Morrison JA, Woo JG. Inter-relationships between the severity of metabolic syndrome, insulin and adiponectin and their relationship to future type 2 diabetes and cardiovascular disease. Int J Obes. 2016;40(9):1353–1359. doi:10.1038/ijo.2016.81
30. Kanhai D, Kranendonk M, Uiterwaal C, Van Der Graaf Y, Kappelle L, Visseren F. Adiponectin and incident coronary heart disease and stroke. A systematic review and meta‐analysis of prospective studies. Obesity Rev. 2013;14(7):555–567. doi:10.1111/obr.12027
31. Al-Hamodi Z, Al-Habori M, Al-Meeri A, Saif-Ali R. Association of adipokines, leptin/adiponectin ratio and C-reactive protein with obesity and type 2 diabetes mellitus. Diabetol Metab Syndr. 2014;6(1):1–8. doi:10.1186/1758-5996-6-99
32. De Rosa A, Monaco ML, Capasso M, et al. Adiponectin oligomers as potential indicators of adipose tissue improvement in obese subjects. Eur J Endocrinol. 2013;169(1):37–43. doi:10.1530/EJE-12-1039
33. Meyer LK, Ciaraldi TP, Henry RR, Wittgrove AC, Phillips SA. Adipose tissue depot and cell size dependency of adiponectin synthesis and secretion in human obesity. Adipocyte. 2013;2(4):217–226. doi:10.4161/adip.24953
34. Wander PL, Christophi CA, Araneta MRG, et al. Adiposity, related biomarkers, and type 2 diabetes after gestational diabetes: the Diabetes Prevention Program. Obesity. 2022;30(1):221–228. doi:10.1002/oby.23291
35. Liao P-J, Ting M-K, Wu I-W, Chen S-W, Yang N-I, Hsu K-H. Higher Leptin-to-Adiponectin Ratio Strengthens the Association Between Body Measurements and Occurrence of Type 2 Diabetes Mellitus. Front Public Health. 2021;9:1006. doi:10.3389/fpubh.2021.678681
36. Lee KW, Shin D. Prospective associations of serum adiponectin, leptin, and leptin-adiponectin ratio with incidence of metabolic syndrome: the Korean Genome and Epidemiology Study. Int J Environ Res Public Health. 2020;17(9):3287. doi:10.3390/ijerph17093287
37. Liu W, Zhou X, Li Y, et al. Serum leptin, resistin, and adiponectin levels in obese and non-obese patients with newly diagnosed type 2 diabetes mellitus: a population-based study. Medicine. 2020;99(6):e19052. doi:10.1097/MD.0000000000019052
38. Wang L-K, Wang H, Wu X-L, Shi L, Yang R-M, Wang Y-C. Relationships among resistin, adiponectin, and leptin and microvascular complications in patients with type 2 diabetes mellitus. J Int Med Res. 2020;48(4):0300060519870407. doi:10.1177/0300060519870407
 © 2023 The Author(s). This work is published and licensed by Dove Medical Press Limited. The
full terms of this license are available at https://www.dovepress.com/terms
and incorporate the Creative Commons Attribution
- Non Commercial (unported, 3.0) License.
By accessing the work you hereby accept the Terms. Non-commercial uses of the work are permitted
without any further permission from Dove Medical Press Limited, provided the work is properly
attributed. For permission for commercial use of this work, please see paragraphs 4.2 and 5 of our Terms.
© 2023 The Author(s). This work is published and licensed by Dove Medical Press Limited. The
full terms of this license are available at https://www.dovepress.com/terms
and incorporate the Creative Commons Attribution
- Non Commercial (unported, 3.0) License.
By accessing the work you hereby accept the Terms. Non-commercial uses of the work are permitted
without any further permission from Dove Medical Press Limited, provided the work is properly
attributed. For permission for commercial use of this work, please see paragraphs 4.2 and 5 of our Terms.
Recommended articles
Relationship Between Four Non-Insulin-Based Indexes of Insulin Resistance and Serum Uric Acid in Patients with Type 2 Diabetes: A Cross-Sectional Study
Han R, Zhang Y, Jiang X
Diabetes, Metabolic Syndrome and Obesity 2022, 15:1461-1471
Published Date: 9 May 2022
Type 2 Diabetes Mellitus in a 7 Year Old Girl
Haris B, Stafrace S, Hussain K
International Medical Case Reports Journal 2022, 15:245-250
Published Date: 12 May 2022
Baseline Serum BCAAs are Related to the Improvement in Insulin Resistance in Obese People After a Weight Loss Intervention
Zhang C, Wang S, Wu Y, Guo Y, Wang X
Diabetes, Metabolic Syndrome and Obesity 2023, 16:179-186
Published Date: 19 January 2023
GLP-1RA Liraglutide and Semaglutide Improves Obesity-Induced Muscle Atrophy via SIRT1 Pathway
Xiang J, Qin L, Zhong J, Xia N, Liang Y
Diabetes, Metabolic Syndrome and Obesity 2023, 16:2433-2446
Published Date: 15 August 2023
The New Challenge of Obesity - Obesity-Associated Nephropathy
Hao M, Lv Y, Liu S, Guo W
Diabetes, Metabolic Syndrome and Obesity 2024, 17:1957-1971
Published Date: 6 May 2024