")
Back to Journals » Diabetes, Metabolic Syndrome and Obesity » Volume 16
Association of Met420del Variant of Metformin Transporter Gene SLC22A1 with Metformin Treatment Response in Ethiopian Patients with Type 2 Diabetes
Authors Degaga A, Sirgu S, Huri HZ, Sim MS, Kebede T , Tegene B , Loganadan NK , Engidawork E , Shibeshi W
Received 19 June 2023
Accepted for publication 12 August 2023
Published 23 August 2023 Volume 2023:16 Pages 2523—2535
DOI https://doi.org/10.2147/DMSO.S426632
Checked for plagiarism Yes
Review by Single anonymous peer review
Peer reviewer comments 2
Editor who approved publication: Dr Konstantinos Tziomalos
Abraham Degaga,1,2 Sisay Sirgu,3 Hasniza Zaman Huri,2 Maw Shin Sim,4 Tedla Kebede,5 Birhanemeskel Tegene,6 Navin Kumar Loganadan,7 Ephrem Engidawork,1 Workineh Shibeshi1
1Department of Pharmacology and Clinical Pharmacy, School of Pharmacy, College of Health Sciences, Addis Ababa University, Addis Ababa, Ethiopia; 2Department of Clinical Pharmacy & Pharmacy Practice, Faculty of Pharmacy, University of Malaya, Kuala Lumpur, Malaysia; 3Department of Internal Medicine, Diabetes and Endocrinology Unit, Saint Paul Hospital Millennium Medical College, Addis Ababa, Ethiopia; 4Department of Pharmaceutical Life Sciences, Faculty of Pharmacy, University of Malaya, Kuala Lumpur, Malaysia; 5Department of Internal Medicine, Diabetes and Endocrinology Unit, Addis Ababa University, Addis Ababa, Ethiopia; 6Department of Microbiology, Saint Paul Hospital Millennium Medical College, Addis Ababa, Ethiopia; 7Department of Pharmacy, Putrajaya Hospital, Precinct 7, Putrajaya, 62250, Malaysia
Correspondence: Workineh Shibeshi, Department of Pharmacology and Clinical Pharmacy, School of Pharmacy, College of Health Sciences, Addis Ababa University, P.O.Box 9086, Addis Ababa, Ethiopia, Tel +251 927361143, Email [email protected]
Objective: This study aimed to evaluate whether the M420del variants of SLC22A1 (rs72552763) is associated with metformin treatment response in Ethiopian patients with type 2 diabetes mellitus (T2DM).
Patients and Methods: A prospective observational cohort study was conducted on 86 patients with T2DM who had been receiving metformin monotherapy for < 1 year. Patients showing ≥ 0.5% reduction in HbA1c levels from baseline within 3 months and remained low for at least another 3 months were defined as responders while those patients with < 0.5% reduction in HbA1c levels and/or those whom started a new class of glucose-lowering drug(s) because of unsatisfactory reduction were defined as non-responders. In addition, good glycemic control was observed when HbA1c ≤ 7.0%, and the above values were regarded as poor. Genotyping of rs72552763 SNP was performed using TaqMan® Drug Metabolism Enzyme Genotyping Assay and its association with metformin response and glycemic control were assessed by measuring the change in HbA1c and fasting blood glucose levels using Chi-square, logistic regression and Mann–Whitney U-test. Statistical significance was set at p < 0.05.
Results: The minor allele frequency of the rs72552763 SNP of SLC22A1 was 9.3%. Metformin response was significantly higher in deletion_GAT (del_G) genotypes as compared to the wild-type GAT_GAT (G_G) genotypes. Furthermore, a significantly lower median treatment HbA1 level was found in del_G genotypes as compared to G_G genotypes. However, the association of rs72552763 with metformin response was not replicated at the allele level. In contrast, the minor del_allele was significantly associated with good glycemic control compared to the G_allele, though not replicated at del_G genotypes level.
Conclusion: This study demonstrated that metformin response was significantly higher in study participants with a heterozygous carrier of M420del variants of SLC22A1 as compared to the wild-type G_G genotypes after 3 months of treatment.
Keywords: T2DM, glycemic response, metformin, SLC22A1 gene, Met420del, Ethiopia
Introduction
Type 2 diabetes mellitus (T2DM), which accounts for ~90% of the total diabetic population, is a significant cause of adult morbidity and mortality.1,2 Optimal glycemic control prevents the development and progression of both macrovascular and microvascular complications of T2DM.3 Studies indicate that approximately 50% of patients with T2DM fail to reach the recommended treatment goals despite a wide range of therapeutic options.4 Indeed, reports emanating from Ethiopian studies have shown that approximately two-thirds to three-quarters of patients with diabetes have inadequate and poor glycemic control.5,6
Because of its efficacy, safety, and protective effects on the cardiovascular system,7 metformin is considered the first-choice oral antihyperglycemic drug for monotherapy in individuals with newly diagnosed T2DM in almost all international guidelines.8,9 However, in clinical practice, the interindividual variation in the response to metformin is very high among T2DM patients.10–12 Some of these variations can be explained by differences in dosage and adherence.13 However, others do not,14,15 suggesting that variations in metformin pharmacogenetics could be a factor.16 Furthermore, given that metformin virtually exists only in its cationic form at physiological pH, transporter polymorphism has become the focus of current metformin pharmacogenetic research.17
As such, metformin is largely distributed in several tissues by membrane transporters such as organic cation transporters (OCT1, OCT2, and OCT3).18 Furthermore, the most studied transporter regarding the impact of genetic variation on metformin action has been OCT1 as it mediates the hepatic distribution of metformin and its flux from enterocytes to the portal circulation.19,20 Moreover, the human SLC22A1 gene encoding OCT1 is highly polymorphic, and numerous polymorphisms have been described in ethnically diverse populations, leading to differences in transporter function.21,22 Furthermore, reduced function variant of SLC22A1, methionine deletion at codon 420 (Met420del) (rs72552763), was selected in this study as it is the most studied variant of SLC22A1 gene for its influence on metformin pharmacokinetics and treatment response though there were inconsistent reports based an extensive survey of recent literature. In addition, the Met420 deletion variant of SLC22A1 gene is quite common in African descent23 and across Sub-Saharan Africa.24
Thus, as OCT1 reported to play an important role in metformin pharmacokinetics and shows polymorphism in ethnically diverse populations, we hypothesized that the reduced function Met420del genetic variant of SLC22A1 might be associated with metformin treatment response in Ethiopian patients with T2DM. Therefore, our study aimed to determine the contribution of this variant to metformin treatment response in Ethiopian patients with T2DM, as few or no studies have addressed the influence of pharmacogenetics on metformin response in Ethiopian patients despite an alarming rate of increment in the number of patients living with diabetes.25
Materials and Method
Study Setting and Design
The participants in this study were recruited from a tertiary referral hospital, St. Paul’s Hospital Millennium Medical College (SPHMMC), Addis Ababa, Ethiopia. The hospital has an outpatient diabetes clinic providing service three days per week. On an average, 70–80 people received care during the service day. On a given service day, new cases were diagnosed, and those diagnosed elsewhere and referred to the hospital were enrolled for follow-up care. Individuals with uncomplicated diabetes were appointed every three months. The diabetes clinic is staffed by two endocrinologists, five residents, and four nurses working full time.
A prospective observational cohort study was conducted on 86 genetically unrelated individuals recently diagnosed with T2DM, who were attending chronic care between March 2021 and March 2022 at the outpatient diabetes clinic of the hospital.
Participant Selection
Patients with recently diagnosed (within 1 year) T2DM, aged 18–65 years and on metformin monotherapy were included. Patients with chronic liver disease, chronic kidney disease, pregnancy, malignancies, active smokers and patients not adherent to medication and diet were excluded from the study.
All patients were diagnosed according to the WHO criteria,26 and information about medical history, comorbidities, renal and liver function tests, biochemical parameters including HbA1c, fasting blood glucose (FBG), triglyceride (TG) and HDL) and medication use were obtained from medical charts while socio-demographic data, life style (level of exercise, adherence to diet and smoking habit) and medication adherence were obtained from questionnaire interview.
Determination of Sample Size and Sampling
The sample size was estimated by comparing the two proportion formula,27 to see whether the rs72552763 polymorphism of SLC22A1 gene exists between the metformin responder and non-responder groups, considering the following assumptions: p1 = 0.35,10 95% CI, and 5% margin of error and a power of 80%. Therefore, the calculated sample size was set at 40 for each group. Adding 10% oversampling to account for potential dropouts, the final sample size was 88 (44 each from responders and non-responders). A purposive sampling technique was used to recruit study participants.
Data Collection
Biochemical measurements of the study participants were prospectively collected from their medical charts at diagnosis and/or first contact at the diabetes clinic (M1), at 3 months (M2), and at 6 months (M3), and the participants were categorized into two clinical categories (Responders and Non-responders to Metformin). Classification was performed based on a cut-off value (0.5% reduction in HbA1c levels), as suggested elsewhere.28,29 Accordingly, responders were patients showing ≥0.5% reduction in HbA1c levels from baseline within 3 months of metformin therapy and remained low for at least another 3 months, while non-responders were patients with <0.5% reduction in HbA1c levels from baseline within 3 months and/or those for whom either newer class of glucose-lowering drug(s) was added or replaced because of unsatisfactory reduction.
Patients should have baseline and follow-up biochemical measurements for inclusion in efficacy analysis. Baseline biochemical measurements were defined as values obtained prior to the start of metformin treatment or within one month after the start of treatment. Follow-up biochemical measurements were obtained at least 3 months after the baseline test values were obtained. If follow-up biochemical measurements were unavailable, the patient was referred to the clinic for the measurement.
The weight of each participant was measured to the nearest 0.1 kg using a digital scale, and height to the nearest 0.1 cm using a mounted stadiometer, with participants wearing minimal clothing. For patients whose weight was already available in the clinical records, the weight at the start of metformin was used as the baseline for body mass index (BMI) estimation.
Blood assays for glycated hemoglobin (HbA1c), fasting blood glucose (FBG), and lipid panel (triglyceride (TG) and HDL) were conducted at St. Paul’s Hospital Laboratory, Addis Ababa, Ethiopia, in accordance with standard protocols.
Operational Definitions
Glycemic control level: Good glycemic control when HbA1c ≤7.0% and above the indicated value was considered poor.30
Metformin Dose: A daily dose of metformin was defined as the average dose administered during the first 3 months of metformin treatment.
Obesity: Individuals with a body mass index (BMI) of ≥30 kg/m2.31
Physical activity: Individuals who performed at least 150 min per week (3 days) of moderate-intensity exercise were regarded as active or inactive.32
Adherence to diet: Individuals who adjust their lifestyle (diet) as recommended for more than 3 days in the last seven consecutive days.33
Diabetic dyslipidemia was defined as triglyceride levels of ≥150 mg/dL and/or HDL levels of <40 mg/dL and <50 mg/dL in men and women, respectively.34
Medication adherence was assessed using a four-item Self-reported measure adherence scale and individuals who reported “YES’ for any one of the four questions were excluded and those who responded “NO” for all the four questions were included.35 Furthermore, individuals who were not adherent to diet were excluded from the study.
DNA Isolation
Venous blood (3 mL) was collected in vials containing EDTA for DNA extraction and stored at −80 °C until extraction. DNA was extracted from whole blood using a Blood Genomic DNA Extraction Mini Kit (ALPHAGEN Biotech Ltd., Taiwan) according to the manufacturer’s instructions. Briefly, 200 μL of whole blood was incubated at 60°C with proteinase K and 200 μL BG Buffer for 15 min by vortexing the sample every 5 min. Ethanol (200 μL, 99.5%) was added, transferred to a BG mini-column, centrifuged, and the mini-column placed in a new collection tube. The column was washed once with 200 μL GW Buffer and then with 750 μL Wash Buffer. After drying, the DNA was eluted in 100 μL of preheated Elution Buffer by centrifugation of the BG mini-column at full speed. DNA was quantified using a NanoDrop 2000/2000c UV/VIS Spectrophotometer (ThermoScientific™). To assess the purity of DNA, the absorbance at 260 nm (A260) was divided by the absorbance at 280 nm (A280). An A260/A280 ratio of 1.7–2.0 was considered good-quality DNA devoid of proteins. Extracted DNA samples were stored at −20 °C until genotyping.
Genotyping
Genotyping was conducted for rs72552763 SNP at the Pharmacogenomics & Precision Medicine Laboratory of the Faculty of Pharmacy, University of Malaya, Kuala Lumpur, Malaysia. Genotyping of the deletion polymorphism on SLC22A1 (rs72552763) was performed using the TaqMan® Drug Metabolism Enzyme Genotyping Assay (Assay ID: C__34211613_10) from Applied Biosystems (Carlsbad, CA, USA) and ChamQ Geno-SNP Probe Master Mix (Vazyme Biotechnology, Singapore). The genotyping procedure was carried out through quantitative real-time PCR (qRT-PCR), following the manufacturer’s protocol.36 Briefly, 10 ng of genomic DNA was added to the reconstituted 2X TaqMan® Master Mix, 20X Assay Working Stock and Nuclease-free water to achieve a final reaction volume of 20 µL. The qRT-PCR was conducted using the StepOnePlus™ Real-Time PCR System, employing the standard ramp speed in the following PCR thermal condition of 45 cycles: 10 seconds for denaturation at 95 °C and 90 seconds for DNA extension and terminal signal detection at 60 °C. The allelic discrimination plots were analyzed to determine the genotypes and alleles of the polymorphism for each of the study subjects.
Statistical Analysis
Statistical analyses were performed using IBM Statistical Package for Social Sciences (SPSS) Version 26 for Windows (IBM Corp., Armonk, NY, USA). Categorical variables were reported as percentages. Kolmogorov–Smirnov and Shapiro–Wilk tests were performed to determine the normality of continuous variables, and all data were found to be not normally distributed. Continuous variables were presented as median and interquartile range (IQR) and mean ± standard deviation (SD). For continuous dependent variables, associations were assessed using the Independent-Samples Mann–Whitney U-test.
Univariate binary logistic regression model analysis was performed for categorical dependent variables, and independent variables (p < 0.2) were included in the multivariate logistic regression model analysis. Univariate logistic regression model analysis results were expressed as crude odds ratios (COR) and multivariate logistic regression model analysis as adjusted odds ratios (AOR) at 95% confidence intervals. The Hosmer–Lemeshow goodness-of-fit test was used to assess the model fit (Hosmer–Lemeshow statistic ≥ 0.05). Backward elimination (likelihood ratio) was used as the variable-selection method. Furthermore, the associations between the alleles of rs72552763 SNP and metformin response and glycemic control were assessed using the chi-square test and 95% confidence intervals. Statistical significance was set at p < 0.05. The minor allele frequency (MAF) was calculated using Excel, and the Hardy–Weinberg equilibrium (HWE) test was performed using Gene-Calc software.37
To identify differences between genotypes with changes in biochemical measurements during follow-up, an absolute change value was generated (the absolute change is the difference between the biochemical values obtained at M2 and the values obtained at M1). Absolute reduction in HbA1c as indicator of metformin treatment response was obtained by subtracting M1 from M2, as M3 measurement was confounded by the use of new class of glucose lowering medication(s) in non-response group. Therefore, all the significant differences observed in this study between the absolute change in biochemical values and rs72552763 SNP were evaluated at 3 months of follow-up. The association between rs72552763 SNP and the number of patients reaching a treatment goal for their HbAlc <7.0% was also assessed.
Results
General Characteristics of the Study Cohort
In our study 127 participants were identified to be eligible for metformin response study cohort from the SPMMCH medical record throughout the study period: However, 41 participants were excluded due to different reasons (11 participants due to comorbidities that affect metformin plasma concentration (mainly thyroid disorders), 14 participants due to non-adherence to medication and/or non-adherence to diet, 2 participants because of smoking habit, 9 participants because of medications that interact with metformin (antidepressants, steroids, ARVs and anti-cancer agents) and 3 participants did not consent for blood withdrawal for the genotyping purpose). However, two study participants were lost to follow-up in the responder group, and data from 86 study participants were used in the final analysis.
Among the study participants 36.05% (n = 31) were male, 63.95% (n = 55) were female, and 81.4% (n = 70) were aged between 29 and 55 years. The majority of the study participants (58.1%) were obese (BMI > 30 kg/m2), 72.1% (n = 62) had diabetic dyslipidemia, and 24.4% (n = 22) were inactive. The Independent-Samples Mann–Whitney U-Test showed no significant difference in the median values of baseline HbA1c, FBG, TG, HDL, BMI, metformin daily doses, and age at diagnosis between the metformin responders and non-responders. The median daily dose of metformin was 1000 mg in both the metformin responder and non-responder groups. Furthermore, there were no significant differences in sex or level of physical activity between metformin responders and non-responders in univariate logistic regression analysis (Table 1).
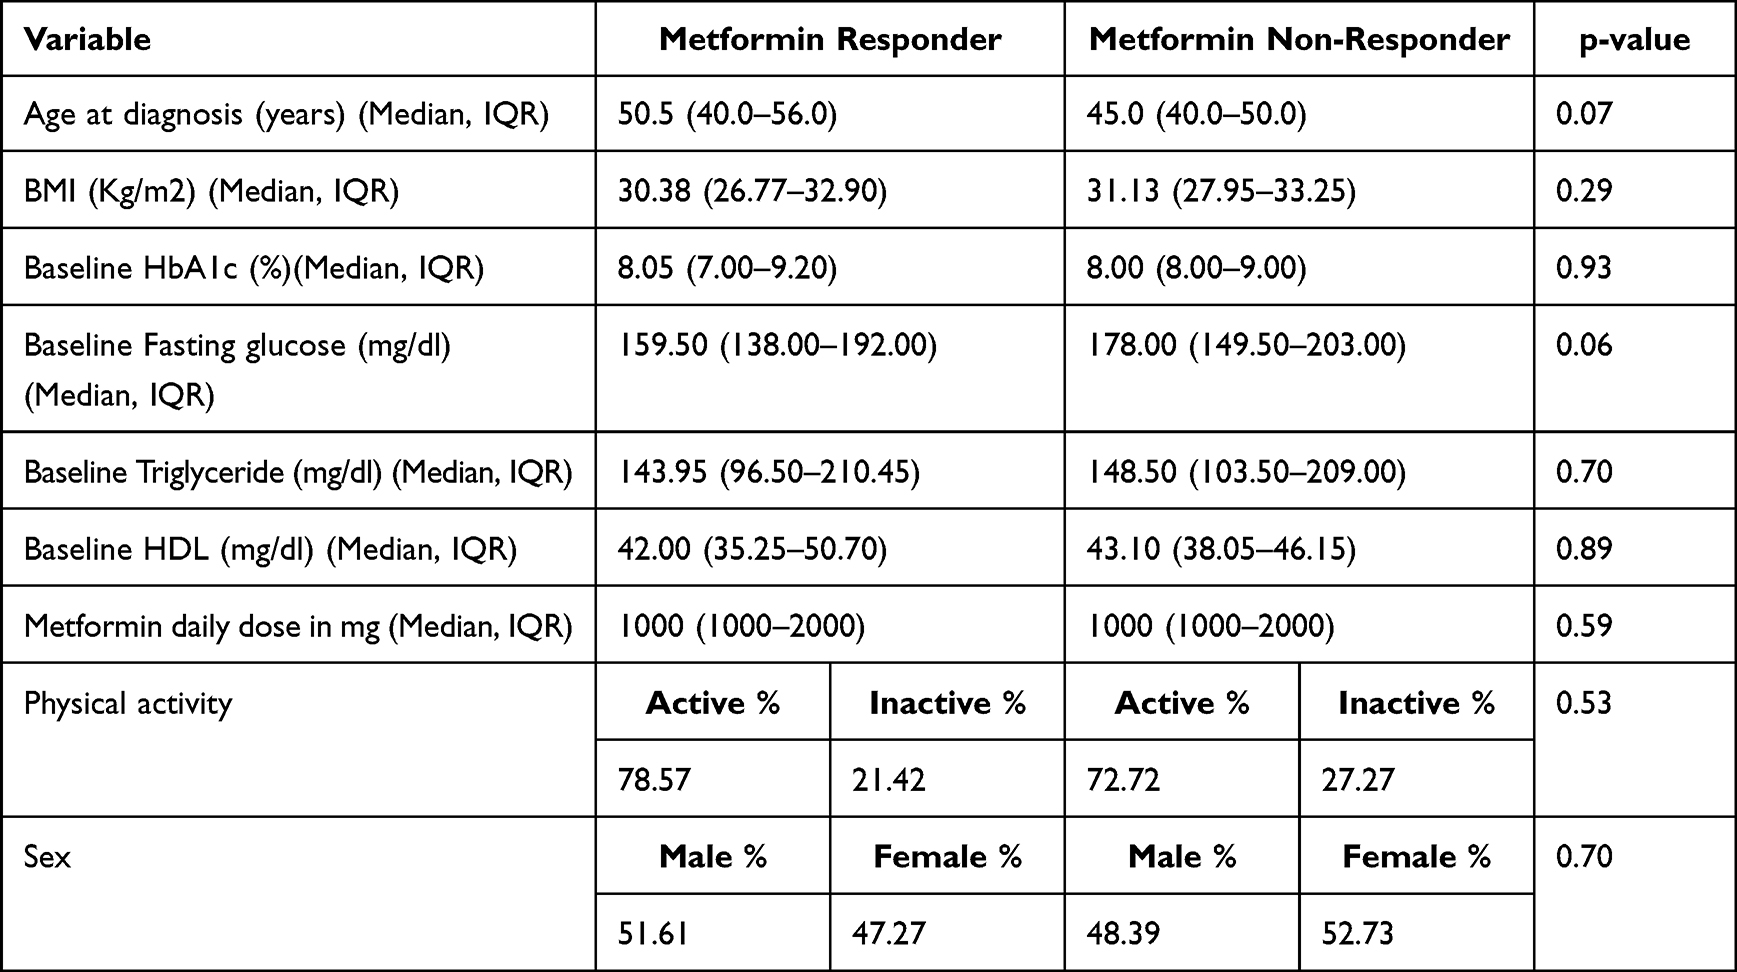 |
Table 1 Baseline and Treatment Characteristics of the Study Participants (n = 86) |
Genotype Frequency
The SNP of interest in this study, a 3-base pair (GAT) deletion mutation (rs72552763) of SLC22A1 gene, was in line with the principles of the Hardy-Weinberg equilibrium (p = 0.984). The MAF of the deletion (del) allele was 9.3%, whereas that of the wild-type GAT (G) allele was 90.7%. Only one patient was homozygous for the rs72552763 del allele (Table 2).
 |
Table 2 Genotype and Allele Frequency Distribution of rs72552763 SNP Across the Study Participants (n = 86) |
Association Studies
Genotypes/Alleles and Metformin Response
The metformin response cohort comprised 48.8% (n = 42) of the metformin responders and 51.2% (n = 44) of the metformin non-responders. In multivariate logistic regression analysis adjusted for age, baseline FBG and BMI, metformin response was significantly higher in del_G genotypes than in the wild-type G_G genotypes (AOR = 3.675 and 95% CI (1.005–13.436), p = 0.049) (Table 3).
 |
Table 3 Logistic Regression Analysis for Predictor of Metformin Response Among the Study Participants (n = 85) |
The independent Samples Mann–Whitney U-test was performed to examine the possible associations between rs72552763 and absolute reductions in HbA1c and FBG levels after three months of metformin treatment, which did not produce significant associations among the two genotypes (Figure 1). In contrast, a significantly lower median treatment HbA1c level was found in the del_G genotype (7.0%) than in the wild-type G_G genotype (8.0%) (p = 0.015) (Figure 2).
 |
Figure 1 Independent Samples Mann–Whitney U-test between genotypes of Met420del variant of SLC22A1gene (rs72552763) and absolute reductions in HbA1C (A) and in FBG (B) following three months of metformin treatment. |
 |
Figure 2 Independent Samples Mann–Whitney U-test between genotypes of Met420del variant of SLC22A1gene (rs72552763) and median HbA1c (A) and FBG (B) levels following three months of metformin treatment. |
A chi-square test was performed to determine the possible association between the alleles of rs72552763 and metformin response, and no significant differences were observed among del_alleles and G_alleles between the responder and non-responder groups (OR = 1.746, 95% CI, 0.664–4.592, p = 0.251).
Genotypes/Alleles and Glycemic Control
In our study 59.3% of the study participants had poor glycemic control (HbA1c >7.0%). In the univariate logistic regression analysis, higher baseline FBG (COR = 0.982, 95% CI (0.970–0.994), p < 0.05) and higher baseline HbA1c (COR = 0.5, 95% CI (0.331–0.756), p < 0.05) levels were significantly associated with a decrease in glycemic control. However, in the multivariate logistic regression model, only BMI (AOR = 0.847; 95% CI (0.740–0.970), p = 0.016) and baseline HbA1c level (AOR = 0.478, 95% CI (0.305–0.751), p = 0.001) were significantly associated with a decrease in glycemic control (Table 4).
 |
Table 4 Logistic Regression Analysis for Predictor of Glycemic Control Among the Study Participants (n = 85) |
In the univariate logistic regression analysis, glycemic control after 3 months of metformin treatment was nearly significantly higher in the del_G genotypes than in the wild-type G_G genotypes (COR = 3.312; 95% CI (1.001–10.961), p = 0.05) (Table 4).
Chi-square test analysis of glycemic control with the alleles of rs72552763 showed that the minor del_allele was significantly associated with good glycemic control compared with the wild-type G allele (OR = 3.206, 95% CI (1.165–8.823), p = 0.016).
Discussion
In patients receiving metformin as an initial treatment for T2DM, previous studies reported that only less than two-thirds achieve acceptable glycemic control or a target HbA1c of <7.0%.38,39 In our study, we also found that about 59.3% of the study participants had poor glycemic control (HbA1c level >7.0%), which is in line with previous studies that reported approximately two-third of the Ethiopian T2DM patients had poor glycemic control.6 The percentage of T2DM patients with HbA1c ≤7.0% in our study (40.7%) is also similar with two different cross-sectional studies in sub-Saharan Africa, from Kenyatta National Hospital, Kenya (36.9%)40 and National Hospital of Abuja, Nigeria (37.9%).41
In this study, we determined the response of metformin in 86 T2DM patients and assessed its association with rs72552763 polymorphism. The MAF for rs72552763 was 9.3% and this is the first study to report the MAF of the rs72552763 polymorphism in the Ethiopian population. It appears that the observed MAF of Met420del in our study is different from both Caucasians (18.5%) as well as from the previously reported population of South Africa (4%)42 and African Americans (5%).23 This difference in MAF is in line with a previous study that reported populations of sub-Saharan Africa are the most genetically diverse in the world compared with people of non-African ancestry.43 Further, allele frequency differences for genes that encode for drug transport proteins are reported to be greater among African than European or Asian populations.44 The fact that our finding of relatively higher MAF for rs72552763 compared to other Africans shows its potential pharmacologic relevance in the Ethiopian population. However, only one patient in our study was homozygous for rs72552763; thus, statistical analysis in comparing genotypes was pooled between patients homozygous for the wild-type allele and those heterozygous for the allele.
Contrary to the bulk of the evidence in the literature, our study found that carriers of the reduced function Met420del variant of SLC22A1 had a greater likelihood of treatment success from metformin monotherapy. Indeed, T2DM patients with the del_G genotype had more than three times better chance of responding to metformin compared to the wild-type G_G genotype (AOR = 3.675 and 95% CI (1.005–13.436), p = 0.049). However, because it is barely significant, the result have to be considered with caution and require a replication study with a larger sample size. Furthermore, a significantly lower median treatment HbA1 level was found in del_G genotypes as compared to the wild-type G_G genotypes (p = 0.015).
In addition to the metformin response, we examined the association of Met420del genetic variant of SLC22A1 gene with the attainment of glycemic control. Metformin response and glycemic control outcomes provide complementary, but not redundant, information. The metformin response outcome, which was measured by an absolute reduction in HbA1c level, allowed the assessment of whether the Met420del genetic variant of SLC22A1 gene might influence any metabolic pathways of metformin. On the other hand, the assessment in the attainment of HbA1c level ≤ 7.0% help us to know whether patients had achieved the optimal level of glycemic control to reduce the risk of diabetes complications.45 In our study, we also found a nearly significant higher rate of good glycemic control with del_G genotypes as compared to the wild-type G_G genotypes after three months of metformin therapy (p = 0.05).
In our study, although we found a significant association of del_G genotype with metformin response, there was no significant difference between del_allele and G_allele between responder and non-responder groups (OR = 1.746, 95% CI, 0.664–4.592, p = 0.251). Normally the lack of association at the allele level is not surprising as the bulk of the evidence including the meta-analysis of multiple smaller studies showed a lack of effects of reduced function variants of SLC22A1 including 420del on various measurements of metformin response, supports this finding.17 However, the finding appears inconsistent with the finding of this study as the del_G genotypes has shown a significantly better response as compared to the wild-type G_G genotypes. However, as different reports on this variants have shown inconsistent result across different ethnic populations, we assume the association of met420del polymorphisms on metformin response in the genotype level might be novel finding in our population while the absence of association at the allele level might be related to the limitation in the definition of non- response in our study which is based on HbA1c reduction over 3 months which could be influenced by short-term life style changes and most importantly due to the smaller sample size. In our study, a single individual who was homozygous for the deletion allele was among the non-responder group (Table 2). Thus, given the very small allelic frequency of the deletion allele as compared to the wild type GAT allele, a false-negative result (type II error) might result in associating the allele with metformin treatment response. Our assumption could be further supported by our finding that deletion allele is significantly associated with good glycemic control (COR = 3.206, 95% CI (1.165–8.823), p = 0.016). Indeed, patients carrying the deletion allele had a more than three-fold better chance of good glycemic control than patients not carrying the allele after 3 months of metformin monotherapy. Furthermore, it is of note that glycemic control measured as (HbA1c < 7%) is by far the more valid marker of glycemic response as it shows a long-term cumulative clinical outcome as compared to the surrogate marker of metformin response used in this study, an absolute reduction in HbA1c measurement, that shows only HbA1c change over 3 month period.
In contrast, the statistically significant association between the median treatment HbA1c and rs72552763 SNP was not replicated with the median treatment FBG levels. This might be again in line with the bulk of the evidence that reported no association between metformin treatment response and reduced function variants of SlC22A117 or might be because of contemporary evidence showing that FBG is neither a better correlate nor accurately predicts HbA1c values when compared to postprandial glucose (PPG).46 Furthermore, we did not observe a significant association between the genotypes of rs72552763 SNP and absolute reductions in HbA1c and FBG levels. The lack of association between the absolute reduction in HbA1c and the del_G genotypes in our study might be due to the smaller sample size, as the median treatment HbA1c was found to be significantly lower in the del_G genotypes as compared to the wild-type G_G genotypes.
Our study also observed no significant intergroup difference in BMI between metformin responder and non-responder groups, which is consistent with studies conducted elsewhere.47–51 This data might suggest that physician’s disinclination to prescribing metformin for normal-weight T2DM patients is unfounded.
Conflicting reports have appeared in the literature regarding the association between reduced functional variants of SLC22A1 including met420del and metformin response, although the majority of the findings report no association.17 The variants have been reported to be associated with good responses in Danish (rs72552763)52 and Chinese (rs628031) studies.53 In contrast, rs72552763 did not affect HbA1c reduction in Latvian54 and Danish population.55 Moreover, Shu et al56 Mahrooz et al57 and Becker et al58 reported that OCT1 alleles, including rs72552763, have little or no effect on the oral glucose tolerance test, FBG reduction, and HbA1c, respectively, following metformin treatment. However, the Genetics of Diabetes Audit and Research in Tayside Scotland (GoDART) study reported that the R61C genotype, but not rs72552763, was associated with better metformin outcomes.59
The reason for such discordant findings might be related to differences in sample size, duration of the study, data analysis, variant considered, and definition of response. The variation in the association between the reduced-function variant and metformin response in different ethnic cohorts may indicate that the role of SLC22A1 polymorphisms in modulating responsiveness to metformin treatment in T2DM is highly dependent on the genetic background of the patient. It appears that the bulk of evidence concentrates on the finding that the reduced function allele of SLC22A1 is associated with reduced cellular metformin uptake but no association with metformin treatment response.17 Contrary to this widely believed notion, we found a significantly higher metformin response and glycemic control in participants carrying the minor deletion allele in our study population. Although the finding of this study appears to be against the majority of the reports in the literatures, we assume that the association of met420del polymorphisms on metformin treatment response might be novel finding in our population as previous studies reported inconsistent result on this variant across different ethnic populations.56,60,61 However, as we found a barely significant result, it needs to be replicated in a more powered study. Our finding also seems in contrast to the generally accepted glucose lowering effect of metformin which is primarily attributed to its action on the liver.62–64 However, this effect might be related to the recently recognized mechanism of action of metformin, which is focused on the gastrointestinal tract, as reduced function of OCT1 causes the accumulation of metformin in the gut.65,66 Putative gut-based mechanisms of metformin include direct and indirect enhanced secretion of glucagon-like peptide-1 (GLP-1) from intestinal L-cells via various mechanisms.67,68 We believe that these conflicting reports need to be resolved by conducting further research using improved methods. Moreover, since most studies investigating the effects of SLC22A1 polymorphisms in the context of therapeutic responses to metformin for T2DM have focused on European, Asian, and Caucasian populations,69 an increasing number of studies need to be conducted with improved methods in African populations, an important region for studying human genetic diversity.43
The major limitations of this study were its relatively short duration and small sample size. However, long-term data have shown that the glucose-lowering effect of metformin stabilizes after 3–4 months of treatment.50 Therefore, the findings of this study require validation in larger cohort studies by assessing multiple additional variants of SLC22A1 gene reported to affect the response to metformin.
Conclusion
To the best of our knowledge, this is the first study to investigate the allele frequency distribution of the Met420del variant of SLC22A1 in the Ethiopian T2DM population. In this study, it was demonstrated that metformin response was significantly higher in study participants with a heterozygous carrier of the M420del variants of SLC22A1 as compared to the wild-type G_G genotypes after 3 months of treatment. Furthermore, it was also demonstrated that the minor del_allele was significantly associated with good glycemic control as compared to the wild-type G_allele. This information may contribute to the timely identification of metformin treatment responders to non-responders before the start of pharmacological therapy, if the results are replicated in a study with a larger sample size.
Data Sharing Statement
The datasets used and/or analyzed during the current study are available from the corresponding author upon reasonable request.
Ethics Approval and Informed Consent
The study was conducted in accordance with the Declaration of Helsinki and approved by the Institutional Review Board (IRB) of the College of Health Science, Addis Ababa University (protocol number:118/20/SoP). The IRB of St. Paul’s Hospital, Millennium Medical College, granted permission to conduct this study (RN: DM23/576). Ethical approval for the project and shipment permit of blood samples to the University of Malaya were granted by the National Research Ethics Review Committee, Ministry of Education (MOE), Ethiopia (RN:02/246/572/22). All participants received information about the procedure and purpose of the study in their local language (Amharic) and provided written informed consent. All collected data were anonymized and held confidential.
Acknowledgments
We acknowledge Haramaya University, Addis Ababa University (RN: PV 475613/11), CDT-Africa (RN: CDT/2028/22), and the European and Developing Countries Clinical Trials Partnership (EDCTP, Grant No: 2016-1778) for their financial support for AD in terms of the stipend and/or procurement of research supplies. We would like to thank the University of Malaya, Faculty of Pharmacy, Kuala Lumpur, for granting access to AD to its laboratory and generously providing all materials and reagents needed to conduct DNA extraction and PCR analysis. We also thank Dr Girmay Medhin and Dr Adem Yesuf Dawed for their assistance with the data handling.
Author Contributions
All authors made a significant contribution to the work reported, whether in conception, design, execution, acquisition of data, analysis, and interpretation, or in all these areas; took part in drafting, revising, or critically reviewing the article; gave final approval to the version to be published; agreed on the journal to which the article has been submitted; and agreed to be accountable for all aspects of the work.
Disclosure
The authors report no conflicts of interest in this work.
References
1. Emerging Risk Factors Collaboration. Diabetes mellitus, fasting blood glucose concentration, and risk of vascular disease: a collaborative meta-analysis of 102 prospective studies. Lancet Lond Engl. 2010;375(9733):2215–2222. doi:10.1016/S0140-6736(10)60484-9
2. Saeedi P, Petersohn I, Salpea P, et al. Global and regional diabetes prevalence estimates for 2019 and projections for 2030 and 2045: results from the International Diabetes Federation Diabetes Atlas, 9th edition. Diabetes Res Clin Pract. 2019;157:107843. doi:10.1016/j.diabres.2019.107843
3. Thomas MC. Glycemic exposure, glycemic control, and metabolic karma in diabetic complications. Adv Chronic Kidney Dis. 2014;21(3):311–317. doi:10.1053/j.ackd.2014.03.004
4. Stark Casagrande S, Fradkin JE, Saydah SH, Rust KF, Cowie CC. The prevalence of meeting A1C, blood pressure, and LDL goals among people with diabetes, 1988–2010. Diabetes Care. 2013;36(8):2271–2279. doi:10.2337/dc12-2258
5. Abera RG, Demesse ES, Boko WD. Evaluation of glycemic control and related factors among outpatients with type 2 diabetes at Tikur Anbessa Specialized Hospital, Addis Ababa, Ethiopia: a cross-sectional study. BMC Endocr Disord. 2022;22(1):54. doi:10.1186/s12902-022-00974-z
6. Abdissa D, Hirpa D. Poor glycemic control and its associated factors among diabetes patients attending public hospitals in West Shewa Zone, Oromia, Ethiopia: an Institutional based cross-sectional study. Metab Open. 2022;13:100154. doi:10.1016/j.metop.2021.100154
7. Scarpello JHB, Howlett HCS. Metformin therapy and clinical uses. Diab Vasc Dis Res. 2008;5(3):157–167. doi:10.3132/dvdr.2008.027
8. Inzucchi SE, Bergenstal RM, Buse JB, et al. Management of hyperglycemia in type 2 diabetes: a patient-centered approach: position statement of the American Diabetes Association (ADA) and the European Association for the Study of Diabetes (EASD). Diabetes Care. 2012;35(6):1364–1379. doi:10.2337/dc12-0413
9. Jia W, Weng J, Zhu D, et al. Standards of medical care for type 2 diabetes in China 2019. Diabetes Metab Res Rev. 2019;35(6):e3158. doi:10.1002/dmrr.3158
10. Cook MN, Girman CJ, Stein PP, Alexander CM. Initial monotherapy with either metformin or sulphonylureas often fails to achieve or maintain current glycaemic goals in patients with Type 2 diabetes in UK primary care. Diabet Med J Br Diabet Assoc. 2007;24(4):350–358. doi:10.1111/j.1464-5491.2007.02078.x
11. Florez JC. Does metformin work for everyone? A genome-wide association study for metformin response. Curr Diab Rep. 2011;11(6):467–469. doi:10.1007/s11892-011-0220-0
12. van Leeuwen N, Swen JJ, Guchelaar HJ, ’t Hart LM. The role of pharmacogenetics in drug disposition and response of oral glucose-lowering drugs. Clin Pharmacokinet. 2013;52(10):833–854. doi:10.1007/s40262-013-0076-3
13. Donnelly LA, Doney ASF, Hattersley AT, Morris AD, Pearson ER. The effect of obesity on glycaemic response to metformin or sulphonylureas in Type 2 diabetes. Diabet Med J Br Diabet Assoc. 2006;23(2):128–133. doi:10.1111/j.1464-5491.2005.01755.x
14. Song R. Mechanism of metformin: a tale of two sites. Diabetes Care. 2016;39(2):187–189. doi:10.2337/dci15-0013
15. Rena G, Hardie DG, Pearson ER. The mechanisms of action of metformin. Diabetologia. 2017;60(9):1577–1585. doi:10.1007/s00125-017-4342-z
16. Brunetti A, Chiefari E, Foti DP. Pharmacogenetics in type 2 diabetes: still a conundrum in clinical practice. Expert Rev Endocrinol Metab. 2017;12(3):155–158. doi:10.1080/17446651.2017.1316192
17. Dujic T, Zhou K, Yee SW, et al. Variants in pharmacokinetic transporters and glycemic response to metformin: a metgen meta-analysis. Clin Pharmacol Ther. 2017;101(6):763–772. doi:10.1002/cpt.567
18. Gong L, Goswami S, Giacomini KM, Altman RB, Klein TE. Metformin pathways: pharmacokinetics and pharmacodynamics. Pharmacogenet Genomics. 2012;22(11):820–827. doi:10.1097/FPC.0b013e3283559b22
19. Jensen JB, Sundelin EI, Jakobsen S, et al. [11C]-labeled metformin distribution in the liver and small intestine using dynamic positron emission tomography in mice demonstrates tissue-specific transporter dependency. Diabetes. 2016;65(6):1724–1730. doi:10.2337/db16-0032
20. Sundelin E, Gormsen LC, Jensen JB, et al. Genetic polymorphisms in organic cation transporter 1 attenuates hepatic metformin exposure in humans. Clin Pharmacol Ther. 2017;102(5). doi:10.1002/cpt.701
21. Hiroshi T, Eriko S, Kenji O, Shun H, Ichiro I. Polymorphism in human organic cation transporters and metformin action. Pharmacogenomics. 2008;9(4). doi:10.2217/14622416.9.4.415
22. Min-Koo C, Im-Sook S. Organic cation transporters and their pharmacokinetic and pharmacodynamic consequences. Drug Metab Pharmacokinet. 2008;23(4). doi:10.2133/dmpk.23.243
23. Goswami S, Gong L, Giacomini K, Altman RB, Klein TE. PharmGKB summary: very important pharmacogene information for SLC22A1. Pharmacogenet Genomics. 2014;24(6):324–328. doi:10.1097/FPC.0000000000000048
24. Zhou Y, Lauschke VM. Population pharmacogenomics: an update on ethnogeographic differences and opportunities for precision public health. Hum Genet. 2022;141(6):1113–1136. doi:10.1007/s00439-021-02385-x
25. Gebreyes YF, Goshu DY, Geletew TK, et al. Prevalence of high blood pressure, hyperglycemia, dyslipidemia, metabolic syndrome and their determinants in Ethiopia: evidences from the National NCDs STEPS survey, 2015. PLoS One. 2018;13(5):e0194819. doi:10.1371/journal.pone.0194819
26. Bennett PH. Impact of the new WHO classification and diagnostic criteria. Diabetes Obes Metab. 1999;1(Suppl 2):S1–6. doi:10.1046/j.1463-1326.1999.0010s2001.x
27. Wang H, Chow SC. Sample size calculation for comparing proportions. In: Wiley Encyclopedia of Clinical Trials. John Wiley & Sons, Ltd; 2007.
28. Shikata E, Yamamoto R, Takane H, et al. Human organic cation transporter (OCT1 and OCT2) gene polymorphisms and therapeutic effects of metformin. J Hum Genet. 2007;52(2):117–122. doi:10.1007/s10038-006-0087-0
29. Park JE, Jeong GH, Lee IK, et al. A pharmacometabolomic approach to predict response to metformin in early-phase type 2 diabetes mellitus patients. Mol Basel Switz. 2018;23(7):1579. doi:10.3390/molecules23071579
30. American Diabetes Association. 6. Glycemic targets: standards of medical care in diabetes-2018. Diabetes Care. 2018;41(Suppl 1):S55–S64. doi:10.2337/dc18-S006
31. Hales CM, Fryar CD, Carroll MD, Freedman DS, Ogden CL. Trends in obesity and severe obesity prevalence in us youth and adults by sex and age, 2007–2008 to 2015–2016. JAMA. 2018;319(16):1723–1725. doi:10.1001/jama.2018.3060
32. Colberg SR, Sigal RJ, Fernhall B, et al. Exercise and type 2 diabetes. Diabetes Care. 2010;33(12):e147–e167. doi:10.2337/dc10-9990
33. Seid MA, Akalu Y, Gela YY, et al. Microvascular complications and its predictors among type 2 diabetes mellitus patients at Dessie town hospitals, Ethiopia. Diabetol Metab Syndr. 2021;13:86. doi:10.1186/s13098-021-00704-w
34. American Diabetes Association. Standards of medical care in diabetes—2022 abridged for primary care providers. Clin Diabetes. 2022;40(1):10–38. doi:10.2337/cd22-as01
35. Lim MT, Ab Rahman N, Teh XR, et al. Optimal cut-off points for adherence measure among patients with type 2 diabetes in primary care clinics: a retrospective analysis. Ther Adv Chronic Dis. 2021;12:2040622321990264. doi:10.1177/2040622321990264
36. SNP genotyping analysis using TaqMan assays - ET. Available from: https://www.thermofisher.com/ng/en/home/life-science/pcr/real-time-pcr/real-time-pcr-assays/snp-genotyping-taqman-assays.html.
37. Bińkowski J, Miks S. Gene-Calc [computer software]; 2018. Available from: https://gene-calc.pl/contact.
38. Hermann LS, Scherstén B, Bitzén PO, Kjellström T, Lindgärde F, Melander A. Therapeutic comparison of metformin and sulfonylurea, alone and in various combinations. A double-blind controlled study. Diabetes Care. 1994;17(10). doi:10.2337/diacare.17.10.1100
39. Se K, Sm H, Ma H, et al. Glycemic durability of rosiglitazone, metformin, or glyburide monotherapy. N Engl J Med. 2006;355(23). doi:10.1056/NEJMoa066224
40. Waari G, Mutai J, Gikunju J. Medication adherence and factors associated with poor adherence among type 2 diabetes mellitus patients on follow-up at Kenyatta National Hospital, Kenya. Pan Afr Med J. 2018;29:82. doi:10.11604/pamj.2018.29.82.12639
41. Odume BB, Ofoegbu OS, Aniwada EC, Okechukwu EF. The influence of family characteristics on glycaemic control among adult patients with type 2 diabetes mellitus attending the general outpatient clinic, National Hospital, Abuja, Nigeria. South Afr Fam Pract. 2015;57(6):347–352. doi:10.1080/20786190.2015.1090688
42. Du Plessis M, Pearce B, Jacobs C, Hoosain N, Benjeddou M. Genetic polymorphisms of the organic cation transporter 1 gene (SLC22A1) within the Cape Admixed population of South Africa. Mol Biol Rep. 2015;42(3):665–672. doi:10.1007/s11033-014-3813-2
43. Campbell MC, Tishkoff SA. African genetic diversity: implications for human demographic history, modern human origins, and complex disease mapping. Annu Rev Genomics Hum Genet. 2008;9(1):403–433. doi:10.1146/annurev.genom.9.081307.164258
44. Ramos E, Doumatey A, Elkahloun AG, et al. Pharmacogenomics, ancestry and clinical decision making for global populations. Pharmacogenomics J. 2014;14(3):217–222. doi:10.1038/tpj.2013.24
45. Ceriello A. The glucose triad and its role in comprehensive glycaemic control: current status, future management. Int J Clin Pract. 2010;64(12):1705–1711. doi:10.1111/j.1742-1241.2010.02517.x
46. Ketema EB, Kibret KT. Correlation of fasting and postprandial plasma glucose with HbA1c in assessing glycemic control; systematic review and meta-analysis. Arch Public Health Arch Belg Sante Publique. 2015;73:43. doi:10.1186/s13690-015-0088-6
47. Ong CR, Molyneaux LM, Constantino MI, Twigg SM, Yue DK. Long-term efficacy of metformin therapy in nonobese individuals with type 2 diabetes. Diabetes Care. 2006;29(11):2361–2364. doi:10.2337/dc06-0827
48. Lund SS, Tarnow L, Stehouwer CDA, et al. Targeting hyperglycaemia with either metformin or repaglinide in non-obese patients with type 2 diabetes: results from a randomized crossover trial. Diabetes Obes Metab. 2007;9(3):394–407. doi:10.1111/j.1463-1326.2007.00713.x
49. Garber A, Marre M, Blonde L, et al. Influence of initial hyperglycaemia, weight and age on the blood glucose lowering efficacy and incidence of hypoglycaemic symptoms with a single-tablet metformin-glibenclamide therapy (Glucovance) in type 2 diabetes. Diabetes Obes Metab. 2003;5(3):171–179. doi:10.1046/j.1463-1326.2003.00259.x
50. Ito H, Ishida H, Takeuchi Y, et al. Long-term effect of metformin on blood glucose control in non-obese patients with type 2 diabetes mellitus. Nutr Metab. 2010;7(1):83. doi:10.1186/1743-7075-7-83
51. Ji L, Li H, Guo X, Li Y, Hu R, Zhu Z. Impact of baseline BMI on glycemic control and weight change with metformin monotherapy in Chinese type 2 diabetes patients: phase IV open-label trial. PLoS One. 2013;8(2):e57222. doi:10.1371/journal.pone.0057222
52. Christensen MMH, Brasch-Andersen C, Green H, et al. The pharmacogenetics of metformin and its impact on plasma metformin steady-state levels and glycosylated hemoglobin A1c. Pharmacogenet Genomics. 2011;21(12):837–850. doi:10.1097/FPC.0b013e32834c0010
53. Zhou Y, Ye W, Wang Y, et al. Genetic variants of OCT1 influence glycemic response to metformin in Han Chinese patients with type-2 diabetes mellitus in Shanghai. Int J Clin Exp Pathol. 2015;8(8):9533–9542.
54. Tarasova L, Kalnina I, Geldnere K, et al. Association of genetic variation in the organic cation transporters OCT1, OCT2 and multidrug and toxin extrusion 1 transporter protein genes with the gastrointestinal side effects and lower BMI in metformin-treated type 2 diabetes patients. Pharmacogenet Genomics. 2012;22(9):659–666. doi:10.1097/FPC.0b013e3283561666
55. Christensen MMH, Højlund K, Hother-Nielsen O, et al. Steady-state pharmacokinetics of metformin is independent of the OCT1 genotype in healthy volunteers. Eur J Clin Pharmacol. 2015;71(6):691–697. doi:10.1007/s00228-015-1853-8
56. Shu Y, Sheardown SA, Brown C, et al. Effect of genetic variation in the organic cation transporter 1 (OCT1) on metformin action. J Clin Invest. 2007;117(5):1422–1431. doi:10.1172/JCI30558
57. Mahrooz A, Parsanasab H, Hashemi-Soteh MB, et al. The role of clinical response to metformin in patients newly diagnosed with type 2 diabetes: a monotherapy study. Clin Exp Med. 2015;15(2):159–165. doi:10.1007/s10238-014-0283-8
58. Becker ML, Visser LE, van Schaik RHN, Hofman A, Uitterlinden AG, Stricker BHC. Genetic variation in the organic cation transporter 1 is associated with metformin response in patients with diabetes mellitus. Pharmacogenomics J. 2009;9(4):242–247. doi:10.1038/tpj.2009.15
59. Zhou K, Donnelly LA, Kimber CH, et al. Reduced-function SLC22A1 polymorphisms encoding organic cation transporter 1 and glycemic response to metformin: a GoDARTS study. Diabetes. 2009;58(6):1434–1439. doi:10.2337/db08-0896
60. Florez JC. The pharmacogenetics of metformin. Diabetologia. 2017;60(9):1648–1655. doi:10.1007/s00125-017-4335-y
61. Sakata T, Anzai N, Shin HJ, et al. Novel single nucleotide polymorphisms of organic cation transporter 1 (SLC22A1) affecting transport functions. Biochem Biophys Res Commun. 2004;313(3):789–793. doi:10.1016/j.bbrc.2003.11.175
62. Foretz M, Viollet B. Regulation of hepatic metabolism by AMPK. J Hepatol. 2011;54(4):827–829. doi:10.1016/j.jhep.2010.09.014
63. Krishan S, Richardson DR, Sahni S. Adenosine monophosphate-activated kinase and its key role in catabolism: structure, regulation, biological activity, and pharmacological activation. Mol Pharmacol. 2015;87(3):363–377. doi:10.1124/mol.114.095810
64. Zhou T, Xu X, Du M, Zhao T, Wang J. A preclinical overview of metformin for the treatment of type 2 diabetes. Biomed Pharmacother. 2018;106:1227–1235. doi:10.1016/j.biopha.2018.07.085
65. Schwartz S, Fonseca V, Berner B, Cramer M, Chiang YK, Lewin A. Efficacy, tolerability, and safety of a novel once-daily extended-release metformin in patients with type 2 diabetes. Diabetes Care. 2006;29(4):759–764. doi:10.2337/diacare.29.04.06.dc05-1967
66. DeFronzo RA, Buse JB, Kim T, et al. Once-daily delayed-release metformin lowers plasma glucose and enhances fasting and postprandial GLP-1 and PYY: results from two randomised trials. Diabetologia. 2016;59(8). doi:10.1007/s00125-016-3992-6
67. Napolitano A, Miller S, Nicholls AW, et al. Novel gut-based pharmacology of metformin in patients with type 2 diabetes mellitus. PLoS One. 2014;9(7):e100778. doi:10.1371/journal.pone.0100778
68. McCreight LJ, Bailey CJ, Pearson ER. Metformin and the gastrointestinal tract. Diabetologia. 2016;59(3):426–435. doi:10.1007/s00125-015-3844-9
69. Song IS, Shin HJ, Shim EJ, et al. Genetic variants of the organic cation transporter 2 influence the disposition of metformin. Clin Pharmacol Ther. 2008;84(5):559–562. doi:10.1038/clpt.2008.61
 © 2023 The Author(s). This work is published and licensed by Dove Medical Press Limited. The full terms of this license are available at https://www.dovepress.com/terms.php and incorporate the Creative Commons Attribution - Non Commercial (unported, v3.0) License.
By accessing the work you hereby accept the Terms. Non-commercial uses of the work are permitted without any further permission from Dove Medical Press Limited, provided the work is properly attributed. For permission for commercial use of this work, please see paragraphs 4.2 and 5 of our Terms.
© 2023 The Author(s). This work is published and licensed by Dove Medical Press Limited. The full terms of this license are available at https://www.dovepress.com/terms.php and incorporate the Creative Commons Attribution - Non Commercial (unported, v3.0) License.
By accessing the work you hereby accept the Terms. Non-commercial uses of the work are permitted without any further permission from Dove Medical Press Limited, provided the work is properly attributed. For permission for commercial use of this work, please see paragraphs 4.2 and 5 of our Terms.