")
Back to Journals » Risk Management and Healthcare Policy » Volume 16
Association of Dietary Acid Load with Nonalcoholic Fatty Liver Disease and Advanced Liver Fibrosis in US Adults: Evidence from NHANES 1999–2018
Received 27 August 2023
Accepted for publication 10 December 2023
Published 20 December 2023 Volume 2023:16 Pages 2819—2832
DOI https://doi.org/10.2147/RMHP.S437425
Checked for plagiarism Yes
Review by Single anonymous peer review
Peer reviewer comments 2
Editor who approved publication: Dr Gulsum Kubra Kaya
Jin Cheng,1,2 Wei Wang2
1Department of Medicine, Wuhan University of Science and Technology, Wuhan, 430000, People’s Republic of China; 2Department of Gastroenterology, Xiangyang Central Hospital, Affiliated Hospital of Hubei University of Arts and Science, Xiangyang, Hubei, 441021, People’s Republic of China
Correspondence: Wei Wang, Department of Gastroenterology, Xiangyang Central Hospital, Affiliated Hospital of Hubei University of Arts and Science, No. 136, Jingzhou Street, Xiangyang, Hubei, 441021, People’s Republic of China, Tel +8613972088242, Email [email protected]
Background: Evidence for an association between dietary acid load (DAL) and non-alcoholic fatty liver disease (NAFLD) is scarce and controversial. We aimed to address whether an association exists between DAL and NAFLD/advanced liver fibrosis (AHF) among US adults in a nationally representative study.
Methods: This was a cross-sectional study. We included adult participants from the National Health and Nutrition Examination Survey 1999– 2018. Potential renal acid load (PRAL) and estimated net endogenous acid production (NEAP) was calculated from the literature and NAFLD/AHF was diagnosed by noninvasive markers. We comprehensively explored these relationships using multivariate adjusted regression models, restricted cubic spline, stratification analysis, and sensitivity analysis.
Results: We enrolled a total of 18,855 participants. All DAL metrics were positively and nonlinearly associated with NAFLD (all p-values < 0.0001), whereas NEAPF and NEAPR may be associated with AHF. In the stratified analysis, we found that the correlation between DAL and NAFLD exists in all ages and genders, but the effect of DAL seems to be more obvious in middle-aged, elderly and women. Similarly, we found that the effect of DAL on AHF was more significant in 45– 60-year-olds and women. Sensitivity analyses revealed stability of all results.
Conclusion: DAL including PRAL and NEAP were positively associated with NAFLD in a large nationally representative cross-sectional study. NEAPF and NEAPR may be associated with increased odds of AHF. Adjustment for diet-dependent DAL requires age- and sex-specific strategies. Future prospective studies are needed to validate our findings.
Keywords: nonalcoholic fatty liver disease, NHANES, liver fibrosis, dietary acid load, nutrient
Introduction
Nonalcoholic fatty liver disease (NAFLD) is defined as lipid buildup of more than 5% in hepatocytes in the absence of other contributing factors to liver injury, with a disease spectrum ranging from simple steatosis to nonalcoholic steatohepatitis characterized by associated inflammation and fibrosis, and a fraction of patients may progress to cirrhosis and hepatocellular carcinoma.1 NAFLD is now the most common chronic liver disease worldwide (~1 in 3 adults have NAFLD), and its prevalence and incidence have dramatically risen over the past few decades and have emerged as the leading cause of liver transplantation.2,3 In addition, NAFLD is a multisystem disease that is closely linked not only to metabolic diseases such as obesity and diabetes, but also to the development of other clinical entities such as cardiovascular disease (CVD), chronic kidney disease, and depression.4 Despite the substantial public health burden associated with NAFLD, there are still no FDA-approved drug therapies for the treatment of NAFLD.
Lifestyle interventions, including a well-balanced diet, remain the cornerstone of NAFLD management and prevention. Certain dietary components have been shown to have the ability to promote an acidic environment in the body (“acidic foods”, eg, meat and meat products, cheese, and soft drinks), while others may promote a non-acidic environment in the body (“alkaline foods”, such as fruits, vegetables, and whole grains).5 Acid-base balance is essential for the body to maintain metabolic homeostasis, while a chronically acidic environment (low-grade metabolic acidosis) has been shown to be associated with the development of a variety of diseases such as CVD, diabetes, and cancer.6–8 The ability of this diet to induce an acidic environment in the body is called dietary acid load (DAL) and can be assessed by a variety of formulas based on nutrient intake and / or body measurements, such as PRAL and NEAP.9,10
Therefore, DAL has been hypothesized to have a potential association with NAFLD. There are currently only four observational studies that have explored this relationship; however, the findings are inconsistent and have been conducted mainly in Asian and some European cohorts.11–14 We therefore addressed this disputed relationship in a nationally representative population-based cross-sectional study, the National Health and Nutrition Examination Survey (NHANES), and elucidated whether the association may exist among US adults. Our findings may provide new insights into the management of NAFLD among US adults by adjusting DAL according to dietary components and answer the question of whether there is variability in the effects of DAL on NAFLD across countries or ethnicities.
Materials and Methods
Study Design and Population
NHANES is the major project of the National Center for Health Statistics (NCHS), of which NCHS is part of the Centers for Disease Control and Prevention and is tasked with providing the country with vital and health statistics. The principal purpose of NHANES is to assess the health and nutritional status of children and adults across the US which includes interviews (includes demographic, socioeconomic, dietary, and health-related questions), physical examinations (consists of medical, dental, and physiological data), and laboratory test data. NHANES was designed as a serial (2-year cycle from 1999 onwards), multistage, complex, probability-sampling cross-sectional study representative of noninstitutional populations across the US. The NHANES was reviewed and approved by the NCHS Research Ethics Review Board, and informed consent was obtained from all participants. NHANES is publicly accessible, and more information is available online.15
We first included 101,316 participants and excluded those younger than 18 years (n=42,112), pregnant (n=1670), and with cancer (n=5140). Second, we excluded patients with missing FLI diagnostic indicators (n=7855), missing DAL indicators (n=6143), excessive alcohol consumption (n=6980), and patients with chronic hepatitis (n=615). Finally, we excluded the population with missing covariates (n=11,946). Thus, we ultimately included 18,855 eligible participants in the study. (Figure 1)
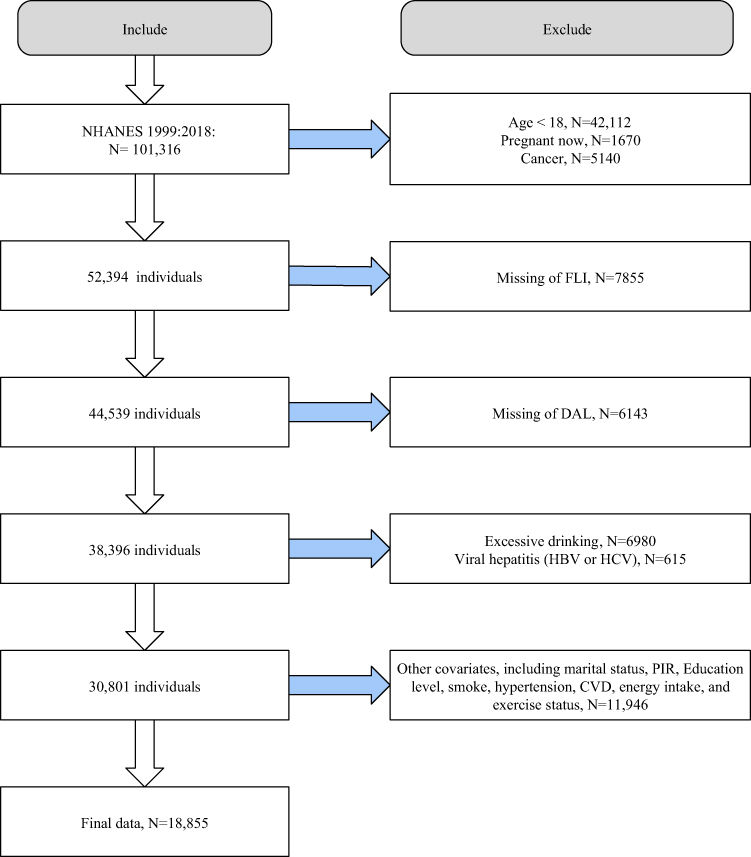 |
Figure 1 Flow chart of study population selection. Abbreviations: PIR, family income to poverty; FLI, Fatty Liver Index; DAL, dietary acid load; CVD, cardiovascular disease; NHANES, the National Health and Nutrition Examination Survey. |
Definition of DAL
We use four well-established formulas as proxies for DAL based on a recent study.16 First, we used the PRAL formula proposed by Remer et al which is based on daily intake of total protein and multiple minerals:  9 Subsequently, Frassetto et al10 proposed a simplified formula for calculating DAL, ie,
  . Another NEAP formula is
  from Remer et al17 where OAest is the anthropometrically estimated organic acid secretion, which is obtained from the body surface area× 41/1.73 (the body surface area was calculated by the formula of Dubois et al18). Finally,
  , where
  .19
.19
Covariates
We selected several important potential covariates based on previous research, including age, gender (male or female), ethnicity (Mexican American, non-Hispanic black, non-Hispanic white, other Hispanic, or other races), education (<high school, high school, or >high school), marital status (single or not), family income to poverty (PIR), smoking (classified as no, former, or now, based on questionnaire responses), physical activity (metabolic equivalent [MET] for level of physical activity according to the questionnaire), total daily energy intake (kcal/day), diabetes (no or yes, the diagnosis is based on one of the following: if the doctor says that a person has diabetes, has a HbA1c > 6.5%, a fasting blood glucose > 7.0 mmol/l, a random blood glucose ≥ 11.1 mmol/l, a 2-hour OGTT blood glucose ≥ 11.1 mmol/l, or is taking related medication), hypertension (no or yes, hypertension is present if a doctor says a person has high blood pressure, is taking anti-hypertensive medication, or has a blood pressure ≥ 130/85 mmHg), and CVD (self-reported).
Definition of NAFLD and AHF
We used a widely validated noninvasive score with good diagnostic accuracy, the Fatty Liver Index (FLI), as a surrogate for NAFLD. FLI was calculated based on serum triglycerides (TG), body mass index (BMI), waist circumference (WC), and serum gamma-glutamyl transpeptidase (GGT). The following formula is calculated for FLI:  .20 FLI ≥60 was considered to have presumptive NAFLD. This is the relationship between DAL and AHF in NAFLD. AHF was defined as NAFLD fibrosis score (NFS) > 0.676 or fibrosis 4 index (FIB-4) > 2.67 or aspartate aminotransferase (AST)/platelet ratio index (APRI) > 1 in the presence of NAFLD.21 The formulas for these indicators are as follows:
  22
22  23
23  .24 For the 1999–2000 NHANES cycle, AST = 40 U/L was adopted as ULN, and in subsequent years, 33 U/L was used as ULN.25
Statistical Analysis
All analyses were performed using EmpowerStats software and R version 4.1.3. Due to the complex design of NHANES, we properly weighted our data analysis according mediatto NHANES reporting guidelines for the survey. Continuous variables (expressed as mean and standard error [SE]) and percentages of categorical variables were used to characterize the study population. In baseline analysis, the Student’s t-test for continuous variables or chi-square test for categorical variables was applied. In the multivariate adjusted regression analysis, we constructed three models. Model 1 was a crude model that did not adjust for any covariates; model 2 was a partially adjusted model that adjusted for age, sex, race, marital status, PIR, and education; and model 3 was a fully adjusted model that further adjusted for smoking, total energy intake, physical activity, diabetes, hypertension, and CVD in addition to model 2. We then performed multiple restricted cubic spline (RCS) analysis to explore potential nonlinear relationships. The curve fitting term is defined by the RCS function from the rms package, and the degrees of freedom (or knots) are determined according to the magnitude of the P for nonlinear value.
In addition, we performed stratification and sensitivity analyses to verify the consistency and stability of the findings across subgroups. We first performed tertile and quintile divisions when DAL was used as a categorical variable to validate the stability of the results. Second, we used another widely validated alternative noninvasive diagnostic index for NAFLD, the USFLI,26 to perform sensitivity analyses to demonstrate the consistency and reliability of the results.
Results
Baseline Characteristics
We included 18,855 participants (49.56% male, overall mean age 46.1 years). We found that all values of DAL (denoted as median and interquartile range, with error bars denoting maximum and minimum values) tended to increase slowly or remain relatively stable in the included general population as the NHANES survey cycle advanced. (Figure 2) There were 8362 putative individuals with NAFLD, with a prevalence of 44.3%, and 801 participants in the AHF population, with a prevalence of 9.6% among NAFLD subjects. We first grouped the overall population based on the presence or absence of NAFLD. Compared to the population without NAFLD, individuals with NAFLD were older, had lower PIR and education levels, higher MET, and total energy intake, were more likely to be males, non-single, non-Hispanic White, and smokers, and had higher prevalence of diabetes, hypertension, and CVD. In terms of dietary intake, people with NAFLD have higher protein, fat, phosphorus, and sodium intake and lower fiber and magnesium intake. Notably, all four DAL measures (continuous) were higher in patients with NAFLD (all p < 0.0001). (Table 1) The AHF population was significantly different from the non-AHF population in age, PIR, total energy intake, education, smoking, diabetes, hypertension, and CVD. As for dietary intake, interestingly, protein, fat, calcium, phosphorus, magnesium, and potassium intake were all lower. Among the 4 DAL metrics, only NEAPR (p=0.001) differed between groups. (Supplementary Table 1)
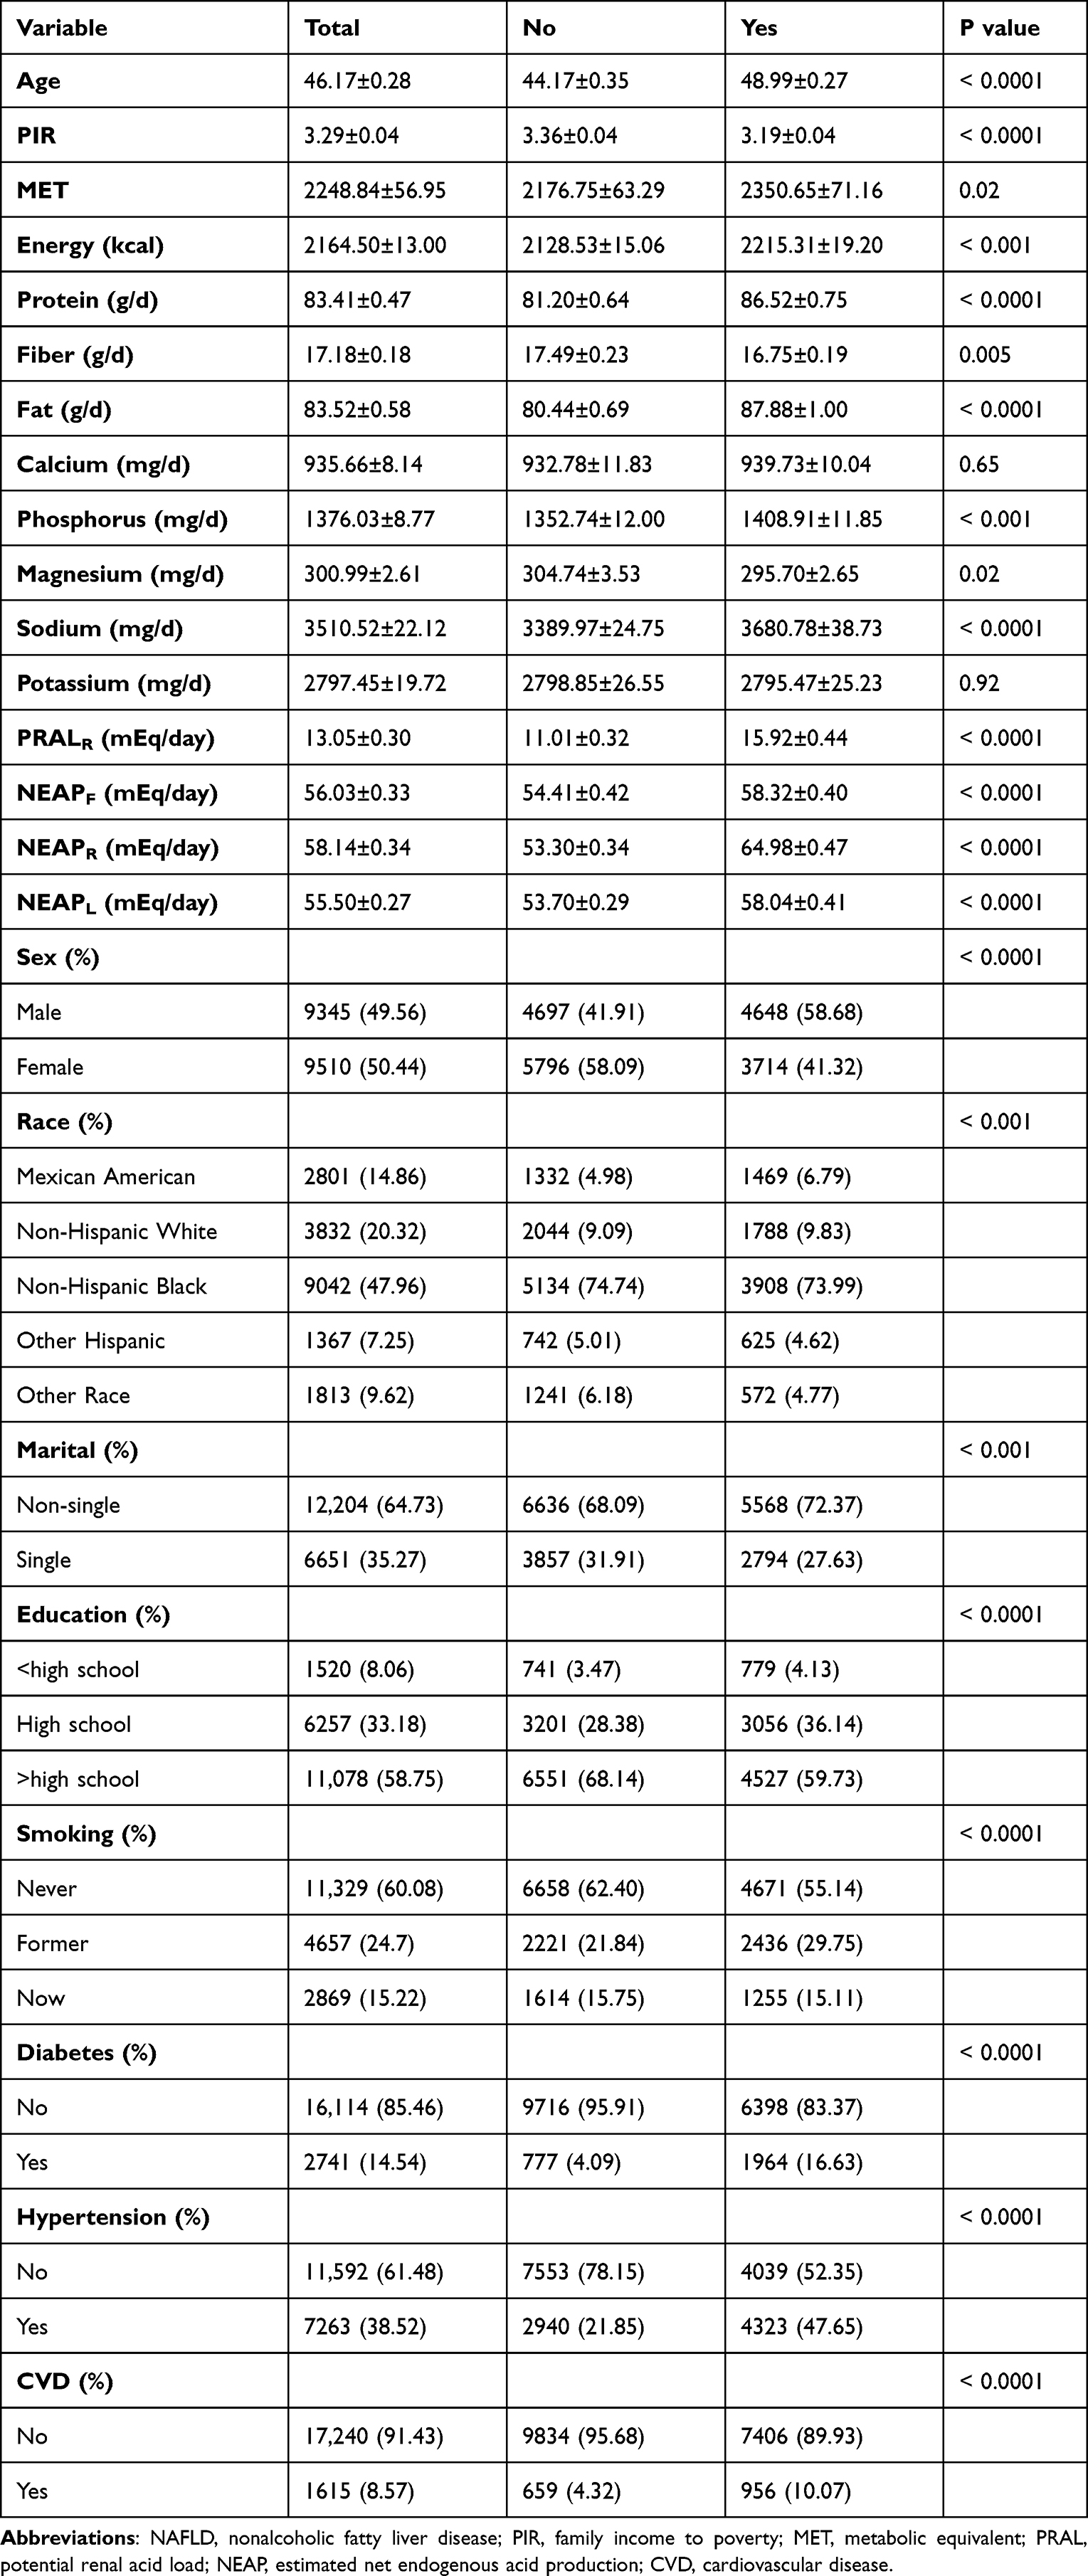 |
Table 1 Baseline Characteristics According to Presence or Absence of NAFLD |
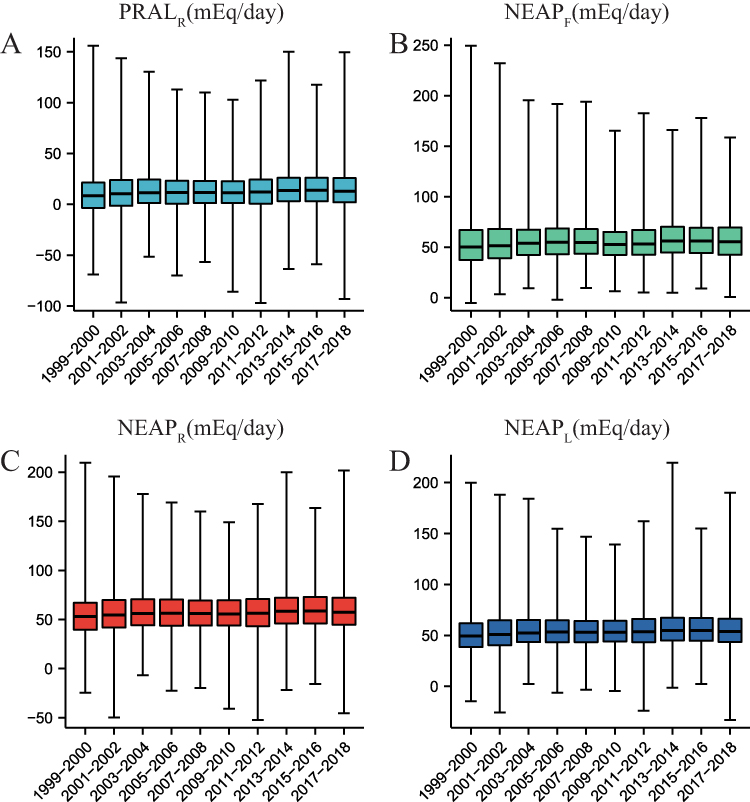 |
Figure 2 Trends in the values of the DAL indicator over the time of the survey cycle. (A) Trends in the values of the DAL indicator over the time of the survey cycle for PRALR. (B) Trends in the values of the DAL indicator over the time of the survey cycle for NEAPF. (C) Trends in the values of the DAL indicator over the time of the survey cycle for NEAPR. (D) Trends in the values of the DAL indicator over the time of the survey cycle for NEAPL. Abbreviation: DAL, dietary acid load. |
Multivariate Adjusted Regression Analysis
We then constructed three survey-weighted multivariate adjusted logistic regression models to explore thoroughly the independent association of DAL with NAFLD/AHF. We constructed three models: model 1 is a crude model that did not adjust for any covariates; model 2 is a partially adjusted model; and model 3 is a fully adjusted model that adjusted for all covariates. In all models, all four DAL indicators were significantly associated with NAFLD (p-values for treated as continuous variables and p-trends were all <0.0001). In the fully adjusted model, all DAL indicators were independently and positively associated with NAFLD (both regarded as continuous and categorical variables). Specifically, PRALR, NEAPF, NEAPR, and NEAPL, in the highest quartile (Q4) increased the odds of NAFLD by 81%, 73%, 374%, and 61%, respectively, compared to the reference population (Q1) (all p < 0.0001), When used as a categorical variable, higher DAL had a lower prevalence of NAFLD than the reference population (all p for trend <0.0001). (Table 2)
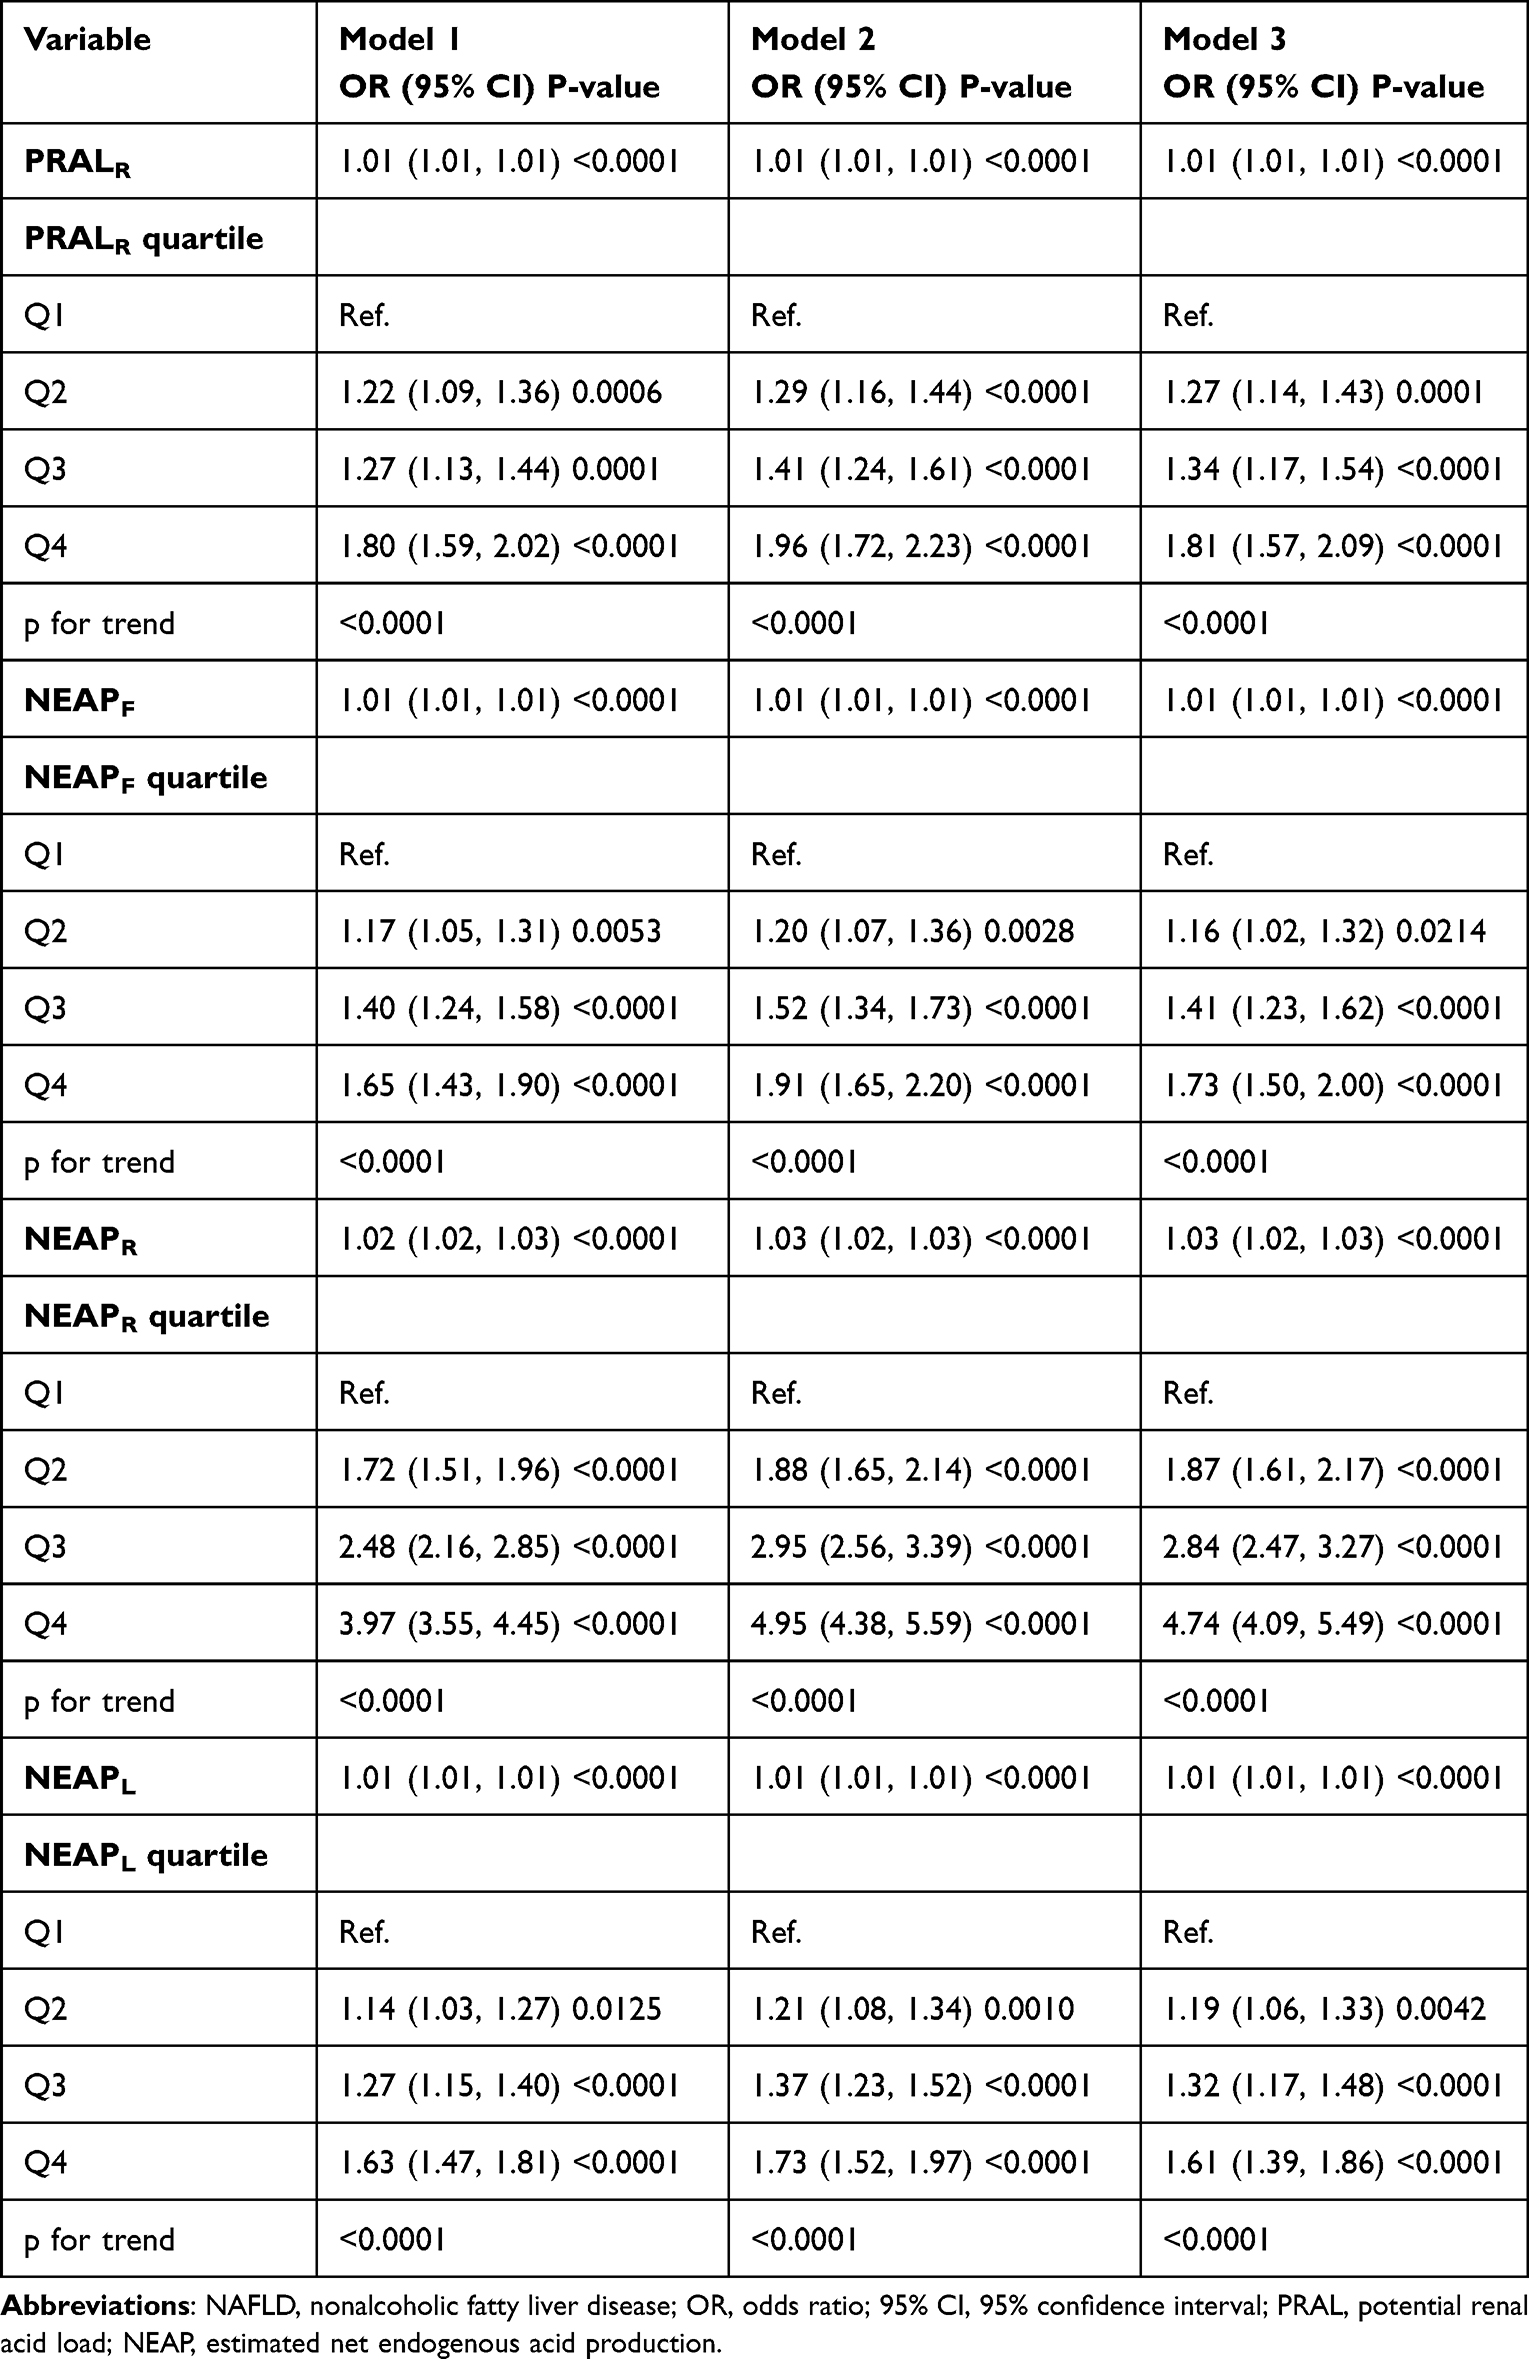 |
Table 2 Multivariate Adjusted Regression Models for All DAL and NAFLD |
Further, we explored the independent association of all DALs with AHF. We found that only NEAPF and NEAPR were significantly associated with AHF in the fully adjusted model. When considered as continuous variables, both NEAPF and NEAPR were independently associated with AHF (NEAPF, odds ratio [OR] 1.01, 95% confidence interval [CI] (1.00, 1.02), p=0.0319; NEAPR, OR 1.02, 95% CI (1.01, 1.03), p<0.0001). In Q4 compared to Q1, NEAPF and NEAPR increased the odds of AHF by 51% and 231%. (Supplementary Table 2)
Nonlinear Relationship Exploration
We went on to understand whether there was a nonlinear relationship between these relationships by constructing RCS models. We observed significant nonlinear relationships (all p nonlinearity < 0.0001) in all the DAL and NAFLD relationships, with inflection points of 11.8373, 53.996, 56.4236, and 53.161 for PRALR, NEAPF, NEAPR, and NEAPL, respectively. (Figure 3A–D) Further piecewise logistic regression analysis on both sides of the inflection point showed that on both sides DAL was independently associated with NAFLD, but the effect was slightly higher on the left side of the inflection point compared to the right side. (Supplementary Table 3)
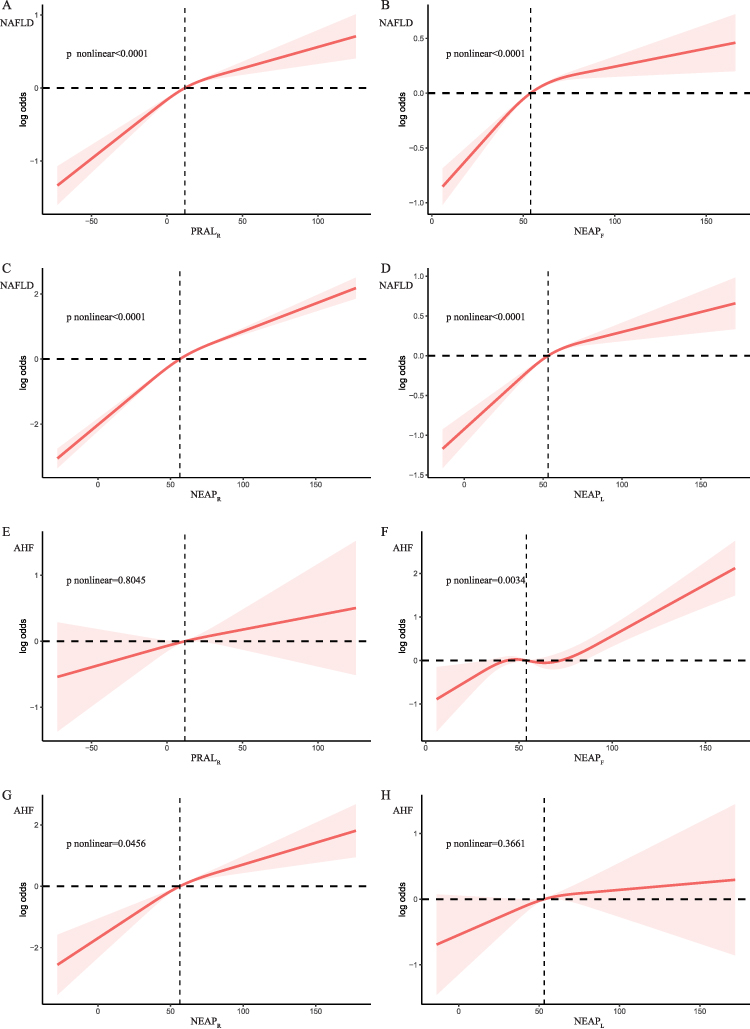 |
Figure 3 Restricted cubic spline models of DAL with NAFLD/AHF. (A) Restricted cubic spline models of DAL with NAFLD for PRALR. (B) Restricted cubic spline models of DAL with NAFLD for NEAPF. (C) Restricted cubic spline models of DAL with NAFLD for NEAPR. (D) Restricted cubic spline models of DAL with NAFLD for NEAPL. (E) Restricted cubic spline models of DAL with AHF for PRALR. (F) Restricted cubic spline models of DAL with AHF for NEAPF. (G) Restricted cubic spline models of DAL with AHF for NEAPR. (H) Restricted cubic spline models of DAL with AHF for NEAPL. Abbreviations: DAL, dietary acid load; NAFLD, nonalcoholic fatty liver disease; AHF, advanced liver fibrosis. |
We also explored the potential nonlinear relationship between DAL and AHF. Similarly, only NEAPF and NEAPR had significant nonlinear relationships with AHF (p-nonlinearity and inflection points of 0.0034, 53.9965 and 0.0456, 56.4236 for NEAPF and NEAPR, respectively). (Figure 3E–H) Piecewise logistic regressions on both sides of the inflection point suggest that NEAPF loses its link to the AHF on the right side of the inflection point, while NEAPR similarly has a slightly more significant effect on the left side of the inflection point. (Supplementary Table 4)
Stratified Analysis
To verify whether the relationship between DAL and NAFLD/AHF remained stable across age and gender subgroups, we performed stratified analyses. Regarding the associations between DAL and NAFLD, we found that these effects were significant across all age groups, with a slightly larger effect in females than in males. (Figure 4A) As for the associations between DAL and AHF, we identified that all these relationships were significant in the 45~60 years population. Intriguingly, we observed all the effects of DAL with AHF to be present in women. (Figure 4B)
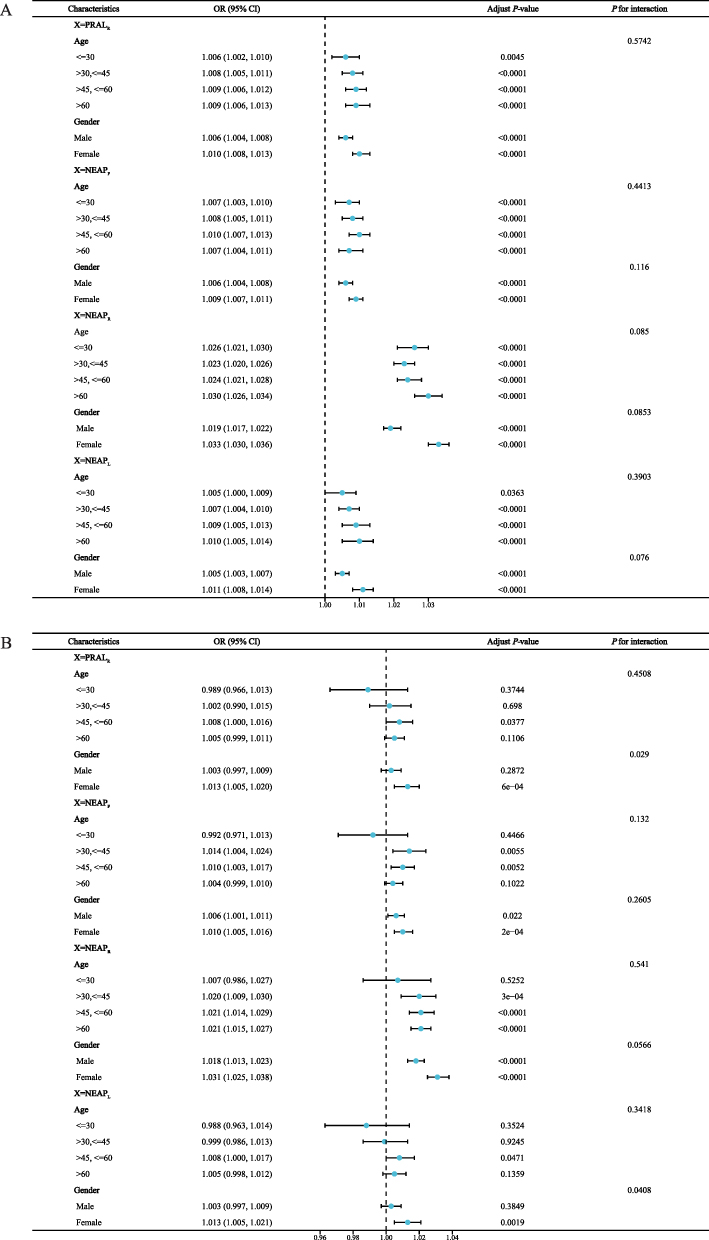 |
Figure 4 Forest plot for stratified analysis. (A) Forest plot for stratified analysis of the relationship between DAL and NAFLD. (B) Forest plot for stratified analysis of the relationship between DAL and AHF. Abbreviations: OR, odds ratio; 95% CI, 95% confidence interval; PRAL, potential renal acid load; NEAP, estimated net endogenous acid production. |
Sensitivity Analysis
To confirm the robustness and consistency of our results, we performed sensitivity analyses. First, we obtained similar results (in the association of DAL with NAFLD) when we categorized DAL as a categorical variable in tertiles or quintiles. Similarly, overall consistent results were found for the relationship with AHF when DAL was used as a tertile and quintile variable. (Supplementary Tables 5–8)
We proceeded to perform a sensitivity analysis using another commonly used marker for diagnosing NAFLD, USFLI. Consistently, all DAL indices were significantly associated with USFLI-diagnosed NAFLD, indicating the stability of our findings. (Supplementary Table 9)
Discussion
In a nationally representative population-based cross-sectional study, we found that all DALs, which are dietary indicators of the ability to promote an acidic environment in the body, were independently and positively associated with NAFLD; however, only NEAPF and NEAPR were potentially associated with the development of AHF in patients with NAFLD. To our knowledge, this is the first time that the association of DAL with NAFLD/AHF has been illustrated using 20 years of data from a large epidemiologic study. Furthermore, we found that DAL was nonlinearly correlated with NAFLD/AHF. Finally, we found that these effects were age-specific (especially for AHF) and were all present in women (even though not significant in the overall population).
DAL is an assessment of the ability of dietary components to promote an acidic environment in the body, and increased DAL can lead to chronic metabolic acidosis (as reflected by urine pH) by disrupting the body’s acid-base balance.9 Mechanistically, increased DAL may lead to disturbances in acid-base balance by increasing non-carbonic acids (eg, sulfuric acid from meats and fish) and lacking supplementation with base salts from organic acids (eg, citrate and bicarbonate from vegetables and fruits).10 Chronic metabolic acidosis reflected by DAL has been documented to be closely involved in the development of a range of diseases, including CVD, hypertension, diabetes, chronic kidney disease, bone-related disorders, and cancers.6,8,27–29 The prevalence of NAFLD parallels the growth in the prevalence of obesity and type 2 diabetes and has reached epidemic proportions. Therefore, as a common metabolic disorder, it is not inconceivable to speculate that chronic metabolic acidosis and DAL may also be associated with the onset and progression of NAFLD. Indeed, four previous observational studies have initially explored this relationship, including a prospective study in European adolescents,11 a cross-sectional study in Chinese adults,12 a cross-sectional study in European adults,13 and a case-control study in an Iranian population.14 A more direct indicator of metabolic acidosis, low urinary pH, has also been shown to be associated with the development of NAFLD in previous observational studies.29,30 However, inconsistent findings in the relationship between DAL and NAFLD among previous studies and the lack of other geographic/national studies hindered the derivation of associations. To fully elucidate this relationship, we therefore explored the association of the 4 DALs with NAFLD/AHF among US adults using the largest known population-based study across 20 years.
We first included 18,855 eligible participants and found that all DALs increased slowly or remained stable over time, possibly suggesting that the proportion consumed on an acidic diet increased or remained roughly constant over time. We found the prevalence of suspected NAFLD to be 44.3%, which is higher than other studies. This may be due to differences in the included populations and differences in diagnostic markers. Unlike previous studies, we found that all DALs were significantly associated with NAFLD at baseline. Krupp et al found in a European prospective cohort that PRAL in adolescence was independently and positively associated with surrogate markers of NAFLD in adulthood, including FLI.11 Similarly, this effect was only present in adult females, consistent with our observation that the effect in NAFLD was more pronounced in females (and all DALs in AHF had an effect in females, but not all males). These gender-related effects are still unclear but may be due to differences in hormone levels in women (eg, it is proposed that higher growth hormone (GH) resistance in females may lead to greater susceptibility to nutritional stress).11 However, the other three studies did not find a significant PRAL-NAFLD association after adjusting for all confounders, and this discrepancy may be due to differences in the inclusion populations, sample sizes, study periods, NAFLD diagnostic indicators, and food intake assessments. In particular, among the three studies, a case-control study only found that Q3 compared to Q1 in quintiles of PRAL had a reduced risk of NAFLD (OR 0.46), while there was no significance in other subsections.14 This opposite association can be explained by the radically different PRAL ranges of the populations. The mean PRAL value of 13.05 (mEq/day) in our study is significantly higher compared to −1.90 (mEq/day) in the study of Emamat et al.14 The distinct PRAL values may reflect the vastly different daily dietary components in Iran and the US. Consistently, however, the Q1 range for PRAL in our study was (−97.1, −0.9), which is similarly close to the neutral range as the Q3 for the lowest NAFLD risk (−3.04, 0.53) of Emamat et al.14 This agreement seemed to suggest that near-neutral PRAL values may have the greatest protective effect, however, whether this assertion is valid still needs to be further justified in prospective studies. The large sample size, long study period, multiethnicity, national representativeness, and standardized food intake assessment questionnaire of our study minimized potential bias and therefore may have better reliability and representativeness. As for NEAP, only one study similarly showed a possible association of NEAPF with NAFLD,12 whereas our study also showed that other NEAP metrics including NEAPR and NEAPL were also associated with NAFLD. In addition, NEAPR was more significantly associated with increased risk of NAFLD compared to other DALs, which may be attributed to that the calculation of NEAPR requires the inclusion of body surface area (derived from height and weight), which is more strongly associated with NAFLD diagnosed by FLI (which is significantly associated with BMI).
It remains unclear as to the mechanism through which DAL affects the development of NAFLD, but metabolic acidosis and DAL has been shown to elicit insulin resistance (IR).31,32 IR is an important component in the pathogenesis of NAFLD, which underlies disorders of glucolipid metabolism.33 Low-grade metabolic acidosis has also been shown to result in resistance to the GH-insulin growth factor-1 axis.34 Mechanistically, GH resistance has also been shown to be closely associated with the development of NAFLD and liver fibrosis, which may be related to influencing systemic metabolism, immune status and modulating hepatic stellate cell activation and hepatocyte damage.35
We also suggested that NEAPF and NEAPR are more likely to be associated with AHF in patients with NAFLD compared to other DALs. Only one previous study has shown that neither PRAL nor NEAPF is associated with AHF.12 NEAPF also showed only a relatively marginal correlation with AHF in our study (p continuous = 0.0319, p for trend = 0.0425), and differences in the included populations and AHF diagnosis may have contributed to the discrepancy in results. Future prospective studies are needed to clarify this relationship.
We demonstrated through RCS modeling that all DAL metrics were nonlinearly associated with NAFLD, specifically having a slightly higher effect to the left of the inflection point. This may suggest that the promotion of NAFLD is relatively more pronounced when DAL is lower. Similarly, a previous cross-sectional study in a European cohort demonstrated that PRAL and NEAPF had significant nonlinear correlations with NAFLD.13 For AHF, both NEAPF and NEAPR also have nonlinear relationships, while NEAPF only has a significant association with AHF on the left side of the inflection point. This observation still defies a literature-based explanation and needs to be further explored in the future.
We found that all DAL associations with NAFLD were significant across age and gender, demonstrating the stability of our findings. However, although we found no association of PRALR and NEAPL with AHF, the association of these two DALs with AHF was noted in the 45~60 years age group and only in female subgroups. This again demonstrated age- and sex-specific susceptibility to nutritional/metabolic stress. This distinctive association also highlights the need for special consideration of age- and gender-specific effects and development of personalized management guidelines in clinical practice, including in the association of DAL with AHF. Finally, through multiple sensitivity analyses, we found that overall consistent associations were maintained both for performing tertile/quintile divisions for DAL and for NAFLD diagnosed by USFLI, demonstrating the stability of our findings.
Our study has notable strengths. First, this is the first time that the association of four DALs with NAFLD/AHF has been examined in a large cross-sectional study representing adults across the US, and stable associations were demonstrated by multiple rigorous statistical analyses. Second, our study has the largest sample size and includes a multiethnic cohort for increased representativeness compared with previous studies. Our study may enlighten clinicians/dietitians on the prevention and mitigation of NAFLD/AHF by intervening in DAL (ie, by increasing alkaline foods such as fruits, vegetables, and whole grains, and decreasing acidic foods such as meat products, cheese, and soft drinks). Our study has limitations. First, this was a cross-sectional study, and residual confounders may still be present and do not allow for true causality. Second, we used noninvasive markers to diagnose NAFLD/AHF, which may lack complete accuracy. However, we increased reliability by combining multiple markers/sensitivity analyses for mutual reinforcement. Future prospective studies using more accurate diagnostic tools are needed to further validate our findings.
Conclusions
DAL was positively and nonlinearly associated with NAFLD, and NEAPF and NEAPR may be associated with the development of AHF. These correlations were age- and sex-specific and were particularly significant in women. These results may shed light on the prevention of NAFLD/AHF by modifying diet-dependent DAL, and further validation by prospective studies is needed in the future.
Data Sharing Statement
This study analyzed publicly available datasets.15
Ethics Statement
The studies involving human participants were reviewed and approved by the Research Ethics Review Board of the NCHS. All patients or participants have provided written informed consent to participate in accordance with the Declaration of Helsinki.
Acknowledgments
We thank all the participants in the NHANES for providing data for this study.
Funding
No funding for this research.
Disclosure
The authors declare no conflict of interest in this study.
References
1. Powell EE, Wong VW, Rinella M. Non-alcoholic fatty liver disease. Lancet. 2021;397(10290):2212–2224. doi:10.1016/s0140-6736(20)32511-3
2. Pais R, Barritt AST, Calmus Y, et al. NAFLD and liver transplantation: current burden and expected challenges. J Hepatol. 2016;65(6):1245–1257. doi:10.1016/j.jhep.2016.07.033
3. Riazi K, Azhari H, Charette JH, et al. The prevalence and incidence of NAFLD worldwide: a systematic review and meta-analysis. Lancet Gastroenterol Hepatol. 2022;7(9):851–861. doi:10.1016/s2468-1253(22)00165-0
4. Byrne CD, Targher G. NAFLD: a multisystem disease. J Hepatol. 2015;62(1 Suppl):S47–S64. doi:10.1016/j.jhep.2014.12.012
5. Adeva MM, Souto G. Diet-induced metabolic acidosis. Clin Nutr. 2011;30(4):416–421. doi:10.1016/j.clnu.2011.03.008
6. Ostrowska J, Janiszewska J, Szostak-Węgierek D. Dietary acid load and cardiometabolic risk factors-a narrative review. Nutrients. 2020;12(11):3419. doi:10.3390/nu12113419
7. Bahrami A, Khalesi S, Ghafouri-Taleghani F, et al. Dietary acid load and the risk of cancer: a systematic review and dose-response meta-analysis of observational studies. Eur J Cancer Prev. 2022;31(6):577–584. doi:10.1097/cej.0000000000000748
8. Sahın N, Gunsen U. Dietary acid load and cardiovascular diseases. Crit Rev Food Sci Nutr. 2023;63(28):9033–9038. doi:10.1080/10408398.2022.2066063
9. Remer T, Manz F. Potential renal acid load of foods and its influence on urine pH. J Am Diet Assoc. 1995;95(7):791–797. doi:10.1016/s0002-8223(95)00219-7
10. Frassetto LA, Todd KM, Morris RC, Sebastian A. Estimation of net endogenous noncarbonic acid production in humans from diet potassium and protein contents. Am J Clin Nutr. 1998;68(3):576–583. doi:10.1093/ajcn/68.3.576
11. Krupp D, Johner SA, Kalhoff H, Buyken AE, Remer T. Long-term dietary potential renal acid load during adolescence is prospectively associated with indices of nonalcoholic fatty liver disease in young women. J Nutr. 2012;142(2):313–319. doi:10.3945/jn.111.150540
12. Chan R, Wong VW, Chu WC, et al. Higher estimated net endogenous Acid production may be associated with increased prevalence of nonalcoholic Fatty liver disease in Chinese adults in Hong Kong. PLoS One. 2015;10(4):e0122406. doi:10.1371/journal.pone.0122406
13. Alferink LJM, Kiefte-de Jong JC, Erler NS, et al. Diet-dependent acid load-the missing link between an animal protein-rich diet and nonalcoholic fatty liver disease? J Clin Endocrinol Metab. 2019;104(12):6325–6337. doi:10.1210/jc.2018-02792
14. Emamat H, Farhadnejad H, Poustchi H, Teymoori F, Bahrami A, Hekmatdoost A. The association between dietary acid load and odds of non-alcoholic fatty liver disease: a case-control study. Nutr Health. 2022;2601060221088383. doi:10.1177/02601060221088383
15. Simon APK, Johnson C. NHANES - National Health and Nutrition Examination Survey homepage. Centers for Disease Control and Prevention; 2023. Available from: https://www.cdc.gov/nchs/nhanes/.
16. Storz MA, Ronco AL. Dietary acid load decreases with age and is associated with sagittal abdominal diameter: a nationally representative quantification study in US adults. Aging Clin Exp Res. 2023;35(10):2191–2200. doi:10.1007/s40520-023-02508-6
17. Remer T, Manz F. Estimation of the renal net acid excretion by adults consuming diets containing variable amounts of protein. Am J Clin Nutr. 1994;59(6):1356–1361. doi:10.1093/ajcn/59.6.1356
18. Du Bois D, Du Bois EF. A formula to estimate the approximate surface area if height and weight be known. 1916. Nutrition. 1989;5(5):303–311; discussion 312–303.
19. Parmenter BH, Dymock M, Banerjee T, Sebastian A, Slater GJ, Frassetto LA. Performance of predictive equations and biochemical measures quantifying net endogenous acid production and the potential renal acid load. Kidney Int Rep. 2020;5(10):1738–1745. doi:10.1016/j.ekir.2020.07.026
20. Bedogni G, Bellentani S, Miglioli L, et al. The Fatty Liver Index: a simple and accurate predictor of hepatic steatosis in the general population. BMC Gastroenterol. 2006;6(1):33. doi:10.1186/1471-230x-6-33
21. Cheah MC, McCullough AJ, Goh GB. Current modalities of fibrosis assessment in non-alcoholic fatty liver disease. J Clin Transl Hepatol. 2017;5(3):261–271. doi:10.14218/jcth.2017.00009
22. Angulo P, Hui JM, Marchesini G, et al. The NAFLD fibrosis score: a noninvasive system that identifies liver fibrosis in patients with NAFLD. Hepatology. 2007;45(4):846–854. doi:10.1002/hep.21496
23. Vallet-Pichard A, Mallet V, Nalpas B, et al. FIB-4: an inexpensive and accurate marker of fibrosis in HCV infection. comparison with liver biopsy and fibrotest. Hepatology. 2007;46(1):32–36. doi:10.1002/hep.21669
24. Wai CT, Greenson JK, Fontana RJ, et al. A simple noninvasive index can predict both significant fibrosis and cirrhosis in patients with chronic hepatitis C. Hepatology. 2003;38(2):518–526. doi:10.1053/jhep.2003.50346
25. Udompap P, Mannalithara A, Heo NY, Kim D, Kim WR. Increasing prevalence of cirrhosis among U.S. adults aware or unaware of their chronic hepatitis C virus infection. J Hepatol. 2016;64(5):1027–1032. doi:10.1016/j.jhep.2016.01.009
26. Ruhl CE, Everhart JE. Fatty liver indices in the multiethnic United States National Health and Nutrition Examination Survey. Aliment Pharmacol Ther. 2015;41(1):65–76. doi:10.1111/apt.13012
27. Remer T, Krupp D, Shi L. Dietary protein’s and dietary acid load’s influence on bone health. Crit Rev Food Sci Nutr. 2014;54(9):1140–1150. doi:10.1080/10408398.2011.627519
28. Jayedi A, Shab-Bidar S. Dietary acid load and risk of type 2 diabetes: a systematic review and dose-response meta-analysis of prospective observational studies. Clin Nutr ESPEN. 2018;23:10–18. doi:10.1016/j.clnesp.2017.12.005
29. Okamura T, Hashimoto Y, Hamaguchi M, Obora A, Kojima T, Fukui M. Low urine pH is a risk for non-alcoholic fatty liver disease: a population-based longitudinal study. Clin Res Hepatol Gastroenterol. 2018;42(6):570–576. doi:10.1016/j.clinre.2018.06.005
30. Miyake T, Yoshida S, Yamamoto S, et al. Low Urine pH is associated with non-alcoholic fatty liver disease: a community-based cross-sectional study. Intern Med. 2018;57(19):2799–2805. doi:10.2169/internalmedicine.0167-17
31. Souto G, Donapetry C, Calviño J, Adeva MM. Metabolic acidosis-induced insulin resistance and cardiovascular risk. Metab Syndr Relat Disord. 2011;9(4):247–253. doi:10.1089/met.2010.0108
32. Williams RS, Kozan P, Samocha-Bonet D. The role of dietary acid load and mild metabolic acidosis in insulin resistance in humans. Biochimie. 2016;124:171–177. doi:10.1016/j.biochi.2015.09.012
33. Marušić M, Paić M, Knobloch M, Liberati Pršo AM. NAFLD, insulin resistance, and diabetes mellitus type 2. Can J Gastroenterol Hepatol. 2021;2021:6613827. doi:10.1155/2021/6613827
34. Green J, Maor G. Effect of metabolic acidosis on the growth hormone/IGF-I endocrine axis in skeletal growth centers. Kidney Int. 2000;57(6):2258–2267. doi:10.1046/j.1523-1755.2000.00086.x
35. Dichtel LE, Cordoba-Chacon J, Kineman RD. Growth hormone and insulin-like growth factor 1 regulation of nonalcoholic fatty liver disease. J Clin Endocrinol Metab. 2022;107(7):1812–1824. doi:10.1210/clinem/dgac088
 © 2023 The Author(s). This work is published and licensed by Dove Medical Press Limited. The full terms of this license are available at https://www.dovepress.com/terms.php and incorporate the Creative Commons Attribution - Non Commercial (unported, v3.0) License.
By accessing the work you hereby accept the Terms. Non-commercial uses of the work are permitted without any further permission from Dove Medical Press Limited, provided the work is properly attributed. For permission for commercial use of this work, please see paragraphs 4.2 and 5 of our Terms.
© 2023 The Author(s). This work is published and licensed by Dove Medical Press Limited. The full terms of this license are available at https://www.dovepress.com/terms.php and incorporate the Creative Commons Attribution - Non Commercial (unported, v3.0) License.
By accessing the work you hereby accept the Terms. Non-commercial uses of the work are permitted without any further permission from Dove Medical Press Limited, provided the work is properly attributed. For permission for commercial use of this work, please see paragraphs 4.2 and 5 of our Terms.