Back to Journals » Diabetes, Metabolic Syndrome and Obesity » Volume 15
Association of Cytotoxic T-Lymphocyte Antigen-4 Gene Polymorphism with Type 1 Diabetes Mellitus: In silico Analysis of Biological Features of CTLA-4 Protein on Ethiopian Population
Authors Ebrahim E ![]() , Teklu T
, Teklu T ![]() , Tajebe F, Wondmagegn T
, Tajebe F, Wondmagegn T ![]() , Akelew Y, Fiseha M
, Akelew Y, Fiseha M ![]()
Received 3 July 2022
Accepted for publication 29 August 2022
Published 5 September 2022 Volume 2022:15 Pages 2733—2751
DOI https://doi.org/10.2147/DMSO.S375023
Checked for plagiarism Yes
Review by Single anonymous peer review
Peer reviewer comments 3
Editor who approved publication: Dr Konstantinos Tziomalos
Endris Ebrahim,1 Takele Teklu,2 Fitsumbrhan Tajebe,2 Tadelo Wondmagegn,2 Yibeltal Akelew,3 Mesfin Fiseha4
1Immunology and Molecular Biology, Medical Laboratory Sciences, College of Medicine and Health Sciences, Wollo University, Dessie, Ethiopia; 2Department of Immunology and Molecular Biology, School of Biomedical and Laboratory Sciences, College of Medicine and Health Sciences, University of Gondar, Gondar, Ethiopia; 3Immunology and Molecular Biology, Medical Laboratory Sciences, College of Health Sciences, Debre Markos University, Debre Markos, Ethiopia; 4Hematology and Immunohematology, Medical Laboratory Sciences, College of Medicine and Health Sciences, Wollo University, Dessie, Ethiopia
Correspondence: Endris Ebrahim, Email [email protected]
Background: T1DM is a chronic organ-specific T-cell-mediated autoimmune disease characterized by the selective destruction of β-cells in the islets of Langerhans, resulting in insulin deficiency and hyperglycemia. Genes for cytotoxic T lymphocyte-associated antigen 4 have been hypothesized as possible contender genes for T1DM vulnerability. However, it has not been studied in the Ethiopian population yet.
Objective: The aim of the study was to investigate CTLA-4 exon 1 was linked to A49G polymorphism with T1DM and its biological features of CTLA-4 among T1DM patients, in Ethiopia.
Methods: A case–control study was done from December 2019 to March 2020 on 210 study participants (105 T1DM patients and 105 healthy controls). Polymerase Chain Reaction amplification with forward and reverse primers was followed by restriction fragment length polymorphism and gel electrophoresis to determine gene polymorphism. Bioinformatics data of SNP was retrieved from National Centers for Biotechnology Information databases. The chi-square test and logistic regression were used. Statistical significance was defined as a P-value of less than 0.05.
Results: The CTLA-4 (+A49G) gene polymorphism was observed on 56 (26.7%) study participants, 39 (18.57%) of T1DM patients, and 17 (0.08%) were controls. In T1DM and controls, the frequency of the A allele was 73.3% and 89.5%, while the G allele was 26.7% and 10.5%, respectively. The G allele was found to be associated with T1DM (OR=3.1; 95% CI, 1.82 − 5.32; P=0.001). Statistical analysis revealed an association between the likelihood of T1DM and GG genotype of the CTLA-4 (+A49G) gene polymorphism (OR=3.11; 95% CI, 1.37– 10.90; P=0.01). Further in silico analyzed the SNP to assess its biological features.
Conclusion: The study showed as CTLA-4 (+A49G) gene polymorphism is linked with T1DM in the Ethiopian population.
Keywords: CTLA-4, T1DM, SNP, immunology, Ethiopia
Introduction
Diabetes mellitus (DM) is a widespread chronic disease1 presented by high blood sugar, lipid, and protein metabolism imbalances exacerbated by defects in insulin secretion, actions, which either can lower blood glucose.2–4 Diabetes is classified into two types: type 1 and type 2. Type 1 diabetes mellitus (TIDM) is a chronic autoimmune disease that causes insulin deficiency and high blood sugar by selectively destroying islets of Langerhans cells.5,6 Type 2 Diabetes Mellitus (T2DM) is caused by both decreased insulin secretion and resistance to its action, which is frequently caused by obese relative insufficiency.7–10 Diabetes mellitus is a group of diseases with a complicated etiology involving the interaction of environmental exposures and an individual’s genetic make-up.11 There is a substantial gap in understanding the burden on a national and international level due to the accuracy and sufficiency of data for monitoring DM patients, especially in developing countries.12
The human genome contains 99.9% identical DNA sequences, with the remaining 0.1% containing unique variations caused by random mutations among them; the most common type of mutation, SNP, is a single base change in the alleles.13
To date, just two genomic regions have been identified that account for 40–50% of genetic susceptibility TIDM,14 the first is Insulin-Dependent Diabetes Mellitus 1 (IDDM1), which corresponds to the Human Leukocyte Antigen (HLA) class II DQ-DR region on chromosome 6p21, and the second is Insulin-Dependent Diabetes Mellitus 2 (IDDM2), which corresponds to the Human Leukocyte Antigen (HLA) class II DQ-DR region on chromosome 11p15,6 the variable number of tandem repeats (VNTR) 5′end of upstream of the insulin gene contribute to the type 1 diabetes susceptibility locus known as the insulin-dependent diabetes mellitus 2 gene (IDDM2) (INS) of the Insulin gene.15,16 The CTLA4 gene, also known as IDDM12 and found on chromosome 2q33, is thought to be a good candidate gene for T1DM susceptibility. It encodes T-cell costimulatory receptors involved in the control of T-cell proliferation and mediates apoptosis of T-cells.6 At CTLA-4/B7-1/2 binding an inhibitory immune signal is activated and then transmits to T-cells, a major role in T1DM.17 However, in CTLA-4 gene polymorphism, the substitution of the 49th base adenine (A) with guanine (G) results in alanine (Ala) at the 17th codon in the signal peptide instead of the wild-type threonine (Thr), resulting in inefficient CTLA-4 glycosylation and reduced cell surface expression18 that disrupting the balance of CD28 and CTLA4 interactions with B7-1/2 would result in T1DM by preventing apoptosis or downregulating activated self-reaction T-lymphocyte.19–21 Various researchers have studied the CTLA-4 +A49G polymorphism in humans, with little to no potential agreement on association with T1DM in some study’s results11,18 and contradictory in others studies’ findings.22,23 According to the World Health Organization (WHO), diabetes mellitus was the ninth leading cause of death in 2019, accounting for an estimated 1.5 million deaths. Type 1 diabetes affects 9 million people worldwide, with the majority living in high-income countries. Its cause and prevention methods are unknown.24 Diabetes mellitus was found to have a 6.34% overall prevalence, with 40 (81.6%) of total cases of diabetes previously undiagnosed.25 According to the International Diabetes Federation (IDF), Ethiopia is one of 48 countries in the IDF’s reported African countries. Diabetes affects approximately 537 million people worldwide, with 24 million in Africa; by 2045, the estimate will be around 55 million. c, with approximately 80% of those affected living in low-middle income countries.26 Ethiopia has a 14.8% diabetes burden, even though three-quarters of the population is undiagnosed,27,28 T1DM Gondar and Jimma findings showed that T1DM in childhood (3.3% diagnosed under 15 years) followed by a rapid increase in the mid-teens up to the age of 30.29 Similarly, at Debre Birhan Referral Hospital, the overall prevalence of DM was 0.34%, and 15.4% of study participants were diagnosed with T1DM.30 According to other study conducted in Ethiopia, 59.6% of diabetic patients incurred catastrophic diabetic care expenditure at a 40% non-food threshold level, whereas 20% of diabetic patients were impoverished by diabetic care spending at the $1.90/day poverty line.31
There is currently no way to identify genetic factors early to diagnose and prevent T1DM, and lifelong insulin injections are the only available treatment.32 As a result, gene detection is not currently applicable in the early diagnosis, management, or prevention of T1DM. Understanding CTLA-4 gene polymorphism is therefore critical for scientists, health professionals, and members of the general public to consider how to maximize the benefits and minimize the drawbacks of predictive genetic testing for diabetes. This study’s goal was to investigate CTLA-4 (+A49G) gene polymorphism allele frequencies and the association of these variants with T1DM patients in Ethiopian populations, and it has made a significant contribution to the collaborative network of clinical centers and diabetes and immunology experts, and new intervention strategies are currently being planned. It is also hoped that genetic testing will identify individuals at high risk for T1DM before the disease manifests itself, allowing for the safe implementation of primary prevention strategies. Such predictive genetic testing would almost certainly be provided to affected families before being made available to the general public.
Materials and Methods
Study Design, Area, and Period
A case–control study was conducted at the University of Gondar Comprehensive Specialized Referral Hospital Chronic Illness clinic in northwest Ethiopia from December 2019 to March 2020. Hospital is located in Central Gondar, Amhara National Regional State, and 750 km far from Addis Ababa (the capital city of Ethiopia) to the northwest part of the country. Gondar is located at an elevation of 2133 meters above sea level. According to the 2007 Ethiopian census report, the population of Gondar town is 323,900.33 The hospital serves over 5 million people in the Central Gondar zone as well as those in the neighboring zones. There are approximately 8000 diabetic patients, 400–800 of whom have type 1 diabetes.
Populations
Source Population, Study Population, Inclusion and Exclusion Criteria
In the current study, a total of 210 study participants, 105 clinically and laboratory-confirmed TIDM patients and 105 healthy controls were recruited. Controls were recruited from health workers, students, mothers from anti-natal care, and blood donors who volunteered and availed at the time of the study period were included. The study excluded patients with a clinical history of autoimmune disease or other types of diabetes. In another way, fasting blood glucose levels above 7 mmol/l (126 mg/dl) or random blood glucose levels above 11.1 mmol/l (200 mg/dl)34 were ruled out for controls.
Sample Size Determination and Sampling Technique
The sample size for the study was calculated using EPI-tools statistical software, assuming an odds ratio of 1.85 from an Egyptian population study,63 40% exposure among controls, 95% confidence interval, and 5% margin of error, and a case to control the ratio of 1:1. The study participants were selected systematically using a registration book as a sample frame at every k interval from the daily follow-up list of T1DM patients that come in a day to the chronic illness DM clinic. The k value was calculated as k = N/n, 150/105 = 1.4≈2. The study participants were selected as one of the two by the lottery method until the calculated sample was obtained.
Data Collection, Laboratory Methods, Data Analysis, and Quality Control
A structured questionnaire was used to instruct study participants and their families or guardians on the important variables of the study (for children). To ensure the data’s reliability, the questionnaire was translated into Amharic and then back into English. Before beginning data collection, the feasibility of the questionnaires was tested by selecting 5% of those who were eligible. Trained data collectors gathered the information.
Sample Collection and Laboratory Procedures
For this study, 5 milliliters (mL) blood sample was collected with EDTA-coated test tube from study participants for laboratory tests and Molecular laboratory (Figure 1). The sample was transported with an icebox to the Molecular laboratory and stored at −80°C until genomic analysis was done. Both T1DM patients and healthy controls measured their fast blood glucose levels using MINDRAY BS200E (China). Controls with fasting blood glucose levels of more than 7 mmol/l (126 mg/dl) were also excluded. Participants in each study were also tested for hepatitis B and C viruses.
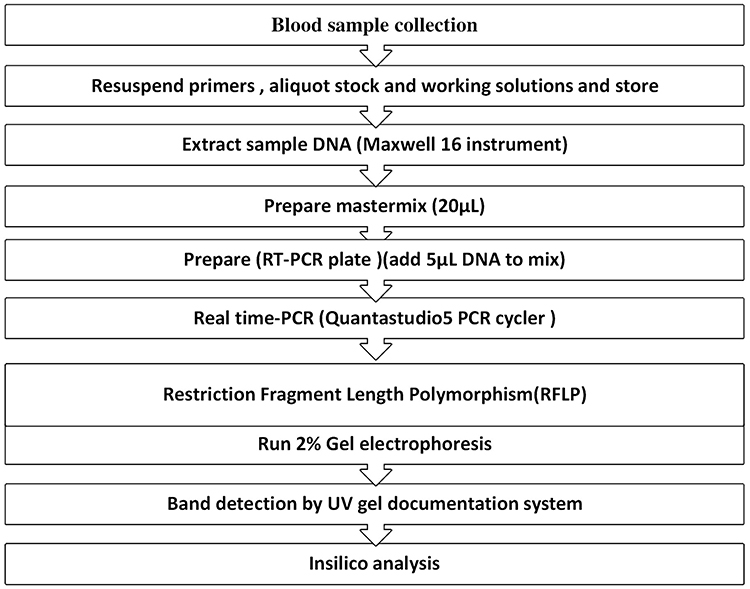 |
Figure 1 General workflow for DNA extraction and real-time PCR CTLA-4 gene amplification and gel electrophoresis. |
Isolation of Deoxyribonucleic Acid (DNA) from Whole Blood
The Maxwell® 16 complete nucleic acid purification kit was used to extract DNA from EDTA whole venous blood per the manufacturer’s instructions (Promega, WI, USA).64 During DNA extraction, we also used nuclease-free water as a negative control. quantum Fluorometer QuantiFluor® provided a fast, easy, and sensitive method for determining dsDNA concentration with a fluorescent double-stranded DNA (ds DNA) binding dye that enables sensitive and specific quantitation of small amounts of (dsDNA) in solution. We measured 1µL Maxwell® 16in -extracted DNA samples and diluted them with 199 µL of dsDNA binding dye, and dsDNA concentrations greater than 5ng/l were subjected to PCR amplification (the DNA concentration in our case was 24–126 ng/l). In addition, we run DNA extract on a 2% agarose gel to confirm the genomic DNA of study participants (both T1DM and controls) and look for bands.
Genotyping of Gene Polymorphism
Genotyping of the CTLA-4 gene was done by using amplification PCR using Quanta studio-5 RT-PCR (Applied Biosystem, USA) using specific (forward primer: 5’ GCT CTA CTT CCT GAA GAC CT 3’, reverse primer: 5ʹAGT CTC ACT CAC CTT TGC AG 3’)30 and restriction fragment length polymorphism (RFLP). A 25 µL polymerase chain reaction (PCR) reaction mix was prepared with 5 µL sample DNA containing 100ng of a template and 20 µL of PCR reagent master mix (reaction mixture dNTPs, buffer (100 mM Tris, pH 9.0; 500 mM KCl; 15 mM MgCl2; 0.1% gelatine), 200 μM dNTP, 10 pmol of each primer and 1.0-unit Taq DNA polymerase) on a real-time PCR on the Quanstudio5 system (Applied Biosystem) according to manufacturer protocols. The PCR amplicon was run on 2% agarose gel before it was digested by restriction enzyme and observed an unfragmented band on the gel electrophoresis. The PCR products were also digested by restriction enzyme (BbVI, R0173S, New England Bio Labs) and subjected to 2% agarose gel electrophoresis along with 100bp-3000 bp DNA ladder as references and nuclease-free water as negative control were loaded on the well.
Retrieving SNPs Bioinformatics Information (in silico Analysis)
SNP data (SNP ID, accession number, protein, position, and residue change) was obtained from the databases of the National Centres for Biotechnology Information (dbNCBI). The primary sequence of the CTLA-4 gene-encoded protein was obtained from the database (dbNCBI) (https://www.ncbi.org) (accession number: P16410 gene id 1493 SNP ID, rs231775). Bioinformatics prediction tools use amino acid substitution (AAS) prediction methods for sequence and structural information (Figure 2).
 |
Figure 2 Workflow for in silico analysis. |
Quality Control
The training was given to data collectors on how to collect, process samples, and report results to ensure the data’s quality. The authors were constantly monitored and collaborated with data collectors. The purity of nucleic acid is determined by the DNA concentration detector machine Quantus™ Fluorometer. The quantum Fluorometer (Cat. # E6150) in conjunction with the QuantiFluor® dsDNA System (Cat. # E2670) provides a quick, simple, and sensitive method for determining DNA concentration.65 Because absorbance measurements are performed on a spectrophotometer, nucleic acid samples must be purified before measurement using a Nano DropTM Spectrophotometer. The absorbance ratio at 260 nm and 280 nm was used to determine the purity of DNA and RNA. A ratio of 1.8 is considered “pure” for DNA, while a ratio of 2.0 is considered “pure” for RNA. If the ratio is noticeably lower in either case, this could be due to the presence of protein, phenol, or other contaminants that absorb strongly at or near 280 nm.35
The quality of the test results was strictly maintained by adhering to laboratory standard operating procedures beginning with the pre-analytic phase of blood collection and ending with the post-analytical phase of the result. The manufacturer’s instructions for reagents, equipment, and instrument maintenance were strictly followed. For the prediction of SAS on the effect of protein structure and function, publicly reliable bioinformatic tools with higher sensitivity and specificity were used.
Data Analysis and Interpretation
Data was entered into Kobo collect v1.25.1, then transferred to SPSS v26 (SPSS, Inc., Chicago, Illinois, USA), where it was summarized, tabulated, and analyzed. Tables and figures were used to present the findings. Chi-square, Student’s t-test, and logistic regression were used to assess the association. The chi-square2 test was used to examine differences in genotype and allele frequency distributions. To assess the strength of the association between CTLA-4 gene polymorphism and T1DM, odds ratios (OR) and 95% confidence intervals (CIs) were calculated. The Hardy Weinberg Equilibrium equation was used to calculate the allele frequency and genotype using an online software gene calculator.
Bioinformatics Data Analysis (in silico Analysis)
Identifying Damaging SNP of CTLA-4
We had been using different bioinformatics tools to predict the functional effects of SNPs from the dbSNP database. SIFT-Sorting Intolerant from Tolerant (http://sift.jcvi.org/www/SIFT seq submit2.html) was used,36 PROVEAN-Protein Variation Effect Analyzer (http://provean.jcvi.org/index.php),37 PolyPhen-2-Polymorphism Phenotyping v2 (http://genetics.bwh.harvard.edu/pph2/),38 PhD-SNP -Predictor of human Deleterious Single Nucleotide Polymorphisms (http://snps.biofold.org/phd-snp/phd-snp.html)39 and SNPs&GO (http://snps.biofold.org/snps-and-go/snps-and-go.html).40 The SNP predicted damaging and high-risk ns SNP was further investigated.
Analysis of CTLA-4 Protein Interaction Networks
The protein interaction network of CTLA-4 protein was visualized using Cytoscape (v3.8.2), which predicted that CTLA-4 protein is functionally associated with other ligand proteins.41
Identification of Structural and Functional Properties of TLA-4 Protein
Mut-Pred v1.2, a web-based application tool that effectively screens amino acid substitutions and predicts disease molecular cause, was used to screen CTLA-4 in humans for disease-related or neutral amino acid substitutions.42 It is based on the acquisition or loss of various structural and functional properties, the loss of a phosphorylation site, or the acquisition of helical propensity.
Protein sequence FASTA format: one letter represented amino acid sequences>sp|P16410|CTLA4_HUMAN Cytotoxic T-lymphocyte protein 4 OS=Homo sapiens OX=9606GN=CTLA4PE=1SV=3 MACLGFQRHKAQLNLATRTWPCTLLFFLLFIPVFCKAMHVAQPAVVLASSRGIASFVCEYASPGKATEVRVTVLRQADSQVTEVCAATYMMGNELTFLDDSICTGTSSGNQVNLTIQGLRAMDTGLYICKVELMYPPPYYLGIGNGTQIYVIDPEPCPDSDFLLWILAAVSSGLFFYSFLLTAVSLSKMLKKRSPLTTGVYVKMPPTEPECEKQFQPYFIPIN) of CTLA-4 and its substitutions of amino acids T17A has been submitted. The output contains a p-value, where p 0.05 and p 0.01 were considered confident and very confident hypotheses, respectively. MutPred2 produces a pathogenicity score, a number ranging from 0 to 1, and a list of molecular mechanisms. A pathogenicity score of 1 indicates that the variant is likely pathogenic, whereas a score of 0 indicates that the variant is likely benign or neutral.43
Consequences of Functional Analysis of SNP on CTLA-4 Protein
Via the use of 3D models of mutant proteins, the effects of CTLA-4 SNP on the CTLA-4 protein were determined using the following Gene Ontology (GO) methods. The effects of the SNP in the CTLA-4 gene were assessed using:
SIFT: SIFT is a bioinformatics tool that predicts the detrimental effect of the single nucleotide substitution adenine by guanine on protein function using the maintenance degree of amino acid residues in sequence alignments derived from closely related sequences as the main assumption. The SIFT server assigns a score from 0 to 1 to each residue, with scores ranging from damaging (0.00–0.05), potentially damaging (0.05–0.10), borderline (0.10–0.20), or tolerant (0.20–1.00).36
Multivariate Analysis of Protein Polymorphism (MAPP): MAPP tool is a sequence-based SNP prediction tool that considers the physicochemical variation present in a column of a multiple sequence alignment (MSA) of homologous protein. A larger deviation indicates that the AAS is more likely to be damaged to protein function. (http://mendel.stanford.edu/SidowLab/downloads/MAPP/index.html) was used to predict AAS on MAPP.38
Predictor of human deleterious SNP (PhD-SNP): The tool used to predict whether an ns-SNP causing a single-point protein mutation is a benign or harmful polymorphism.39
SNPs & GO: Predicts disease-associated mutations from a protein sequence while also incorporating functional annotation of the protein (http://snps.biofold.org/snps-and-go/snps-and-go.html).40
Protein Variation Effect Analyzer (PROVEAN) and Protein Annotation Through Evolutionary Relationship (PANTHER): (http://provean.jcvi.org/index.php) is a tool that predicts the possible effect of an AAS on the protein function. PROVEAN, the variants are predicted as damaging when the final score is below a threshold value of −2.5 and neutral when it is above the −2.5 value.37
Sequence and Structure-Based Prediction Tools
Polymorphism Phenotyping v2 (PolyPhen-2) (http://genetics.bwh.harvard.edu/pph2) we used a Using a comparative method, a bioinformatics server predicts the ns-SNP that affects AAS on the structure and function of a protein. Prediction outcomes are classified as probably harmful, possibly harmful, or benign based on a score ranging from 0 to 1. “Score” represents the likelihood that the substitution will be harmful; “sensitivity” and “specificity” represent prediction confidence. A vertical black marker inside a color gradient bar, where green is benign and red is damaging, also indicates the predicted damaging effect. PolyPhen-2ʹs influence is 0–0.5 benign, 1.00–1.24 borderline, 1.25–1.49 potentially harmful, 1.5–1.75 potentially harmful, ≥ 2 Probably harmful.38
Screening for non-acceptable polymorphisms (SNAP2): The functional effects of nsSNP on CTLA-4 protein were predicted using SNAP2. The SNAP2 distinguishes between effect and neutral variants/nsSNPs by analyzing a variety of sequence and variant features.44 Analysis of the prediction score (which ranges from 100 strong neutral predictions to +100 strong effect prediction) suggests that it is somewhat correlated with the severity of the effect (https://rostlab.org/services/snap/).45
Stability Analysis of Mutant Type and Wild Type CTLA-4 Protein
I-Mutant 3.0 was used to predict changes in protein stability caused by single-site aa changes in the protein structure or sequence. It predicts the reliability index (RI) of the results, which ranges from 0 to 10, with 10 being the most reliable. The CTLA-4 protein sequence (fasta form, one-letter amino acid representation) was submitted to predict the effects of the harmful nsSNP on the protein. All submissions were subjected to a temperature of 25 degrees Celsius and a pH of 7.0. The I-Mutant result was created as follows: DDG 0 indicates decreased stability, DDG > 0 indicates increased stability, and DDG = 0 indicates neutral. 3.0 I-Mutant (http://gpcr2.biocomp.unibo.it/cgi/predictors/I-Mutant3.0/I-Mutant3.0.cgi).42
The 3D Protein Modeling of Mutant Type and Wild Type CTLA-4
Two homology modeling tools were used to generate 3D models for wildtype CTLA-4 protein and CTLA-4 mutated with high-risk nsSNP. Phyre246 and I-TASSER.47 Phyre2 and I-TASSER: build 3D models, predict ligand-binding sites, and analyze the effect of amino acid variants on a user’s protein sequence using advanced remote homology detection methods. The server is accessible at (http://www.sbg. bio.ic.ac.Uk/phyre2).46 UCSF-Chimera 1.11, a comprehensive program for interactive visualization and analysis of molecular structures and related data, was used to examine the resulting structures.48
TM-align (template modeling) was also used to compare the structures of wild-type CTLA-4 proteins to those of CTLA-4 mutant proteins. This algorithm computes the template modeling score (TM-score), root mean square deviation (RMSD), and superposition of CTLA-4 protein structures. The TM-score ranges between 0 and 1, with 1 indicating a perfect match between two structures. Higher RMSD values indicate greater variation between wild-type and mutant CTLA-4 structures. I-Mutant Suite3 was used to determine the effect of this SNP on protein stabilization. The CTLA-4 mutant amino acid and protein were three-dimensionally modeled using the Project HOPE software tool (which is a suite of web-based tools for predicting and analyzing protein structure, function, and mutations).49
Examining the Evolutionary Conservation of the CTLA-4 Protein
We used a genetic algorithm to determine the evolutionary conservation of amino acids in a protein sequence ConSurf50 (https://consurf.tau.ac.il) which performs its function by analyzing the phylogenetic relationships between homologous sequences. For further research, we considered the CTLA-4 nsSNP that was discovered to be conserved.
Molecular Docking Protein–Protein Interaction
We performed molecular docking using the PyRx virtual screening tool (https://pyrx.sourceforge.io/) to determine how damaging point mutations affect CTLA-4 binding affinity.51 We also created a suitable target protein from the protein data bank’s crystal structure complex of CTLA-4 with B7.1/ B7.2 (PDB). The docking procedure used peptide sequences from mutated CTLA-4 protein containing ns-SNP as ligands.
Ethical Considerations
The ethical review committee of the School of Biomedical and Laboratory Sciences, College of Medicine and Health Sciences, University of Gondar provided approval with reference number SBLS2125/11. Each study participant provided written consent. Each Participant’s parent or guardian also provided consent. Positive patients were treated by the Hospital’s treatment guidelines. All study methods were complied in accordance with the declaration of with the Declaration of Helsinki.
Results
Socio-Demographic Profiles of Study Participants
In current study, to assess the frequency of CTLA-4 (+A49G) gene polymorphism and its association with T1DM, 105 clinically and laboratory-confirmed T1DM patients (62 male and 43 female) ages ranging from 14 to 50 years (mean age 27.63±8.6 years) and 105 healthy controls (male 37 and female 68) age range from 16 to 56 years (mean age 27.96±7.5 years) were recruited (Table 1).
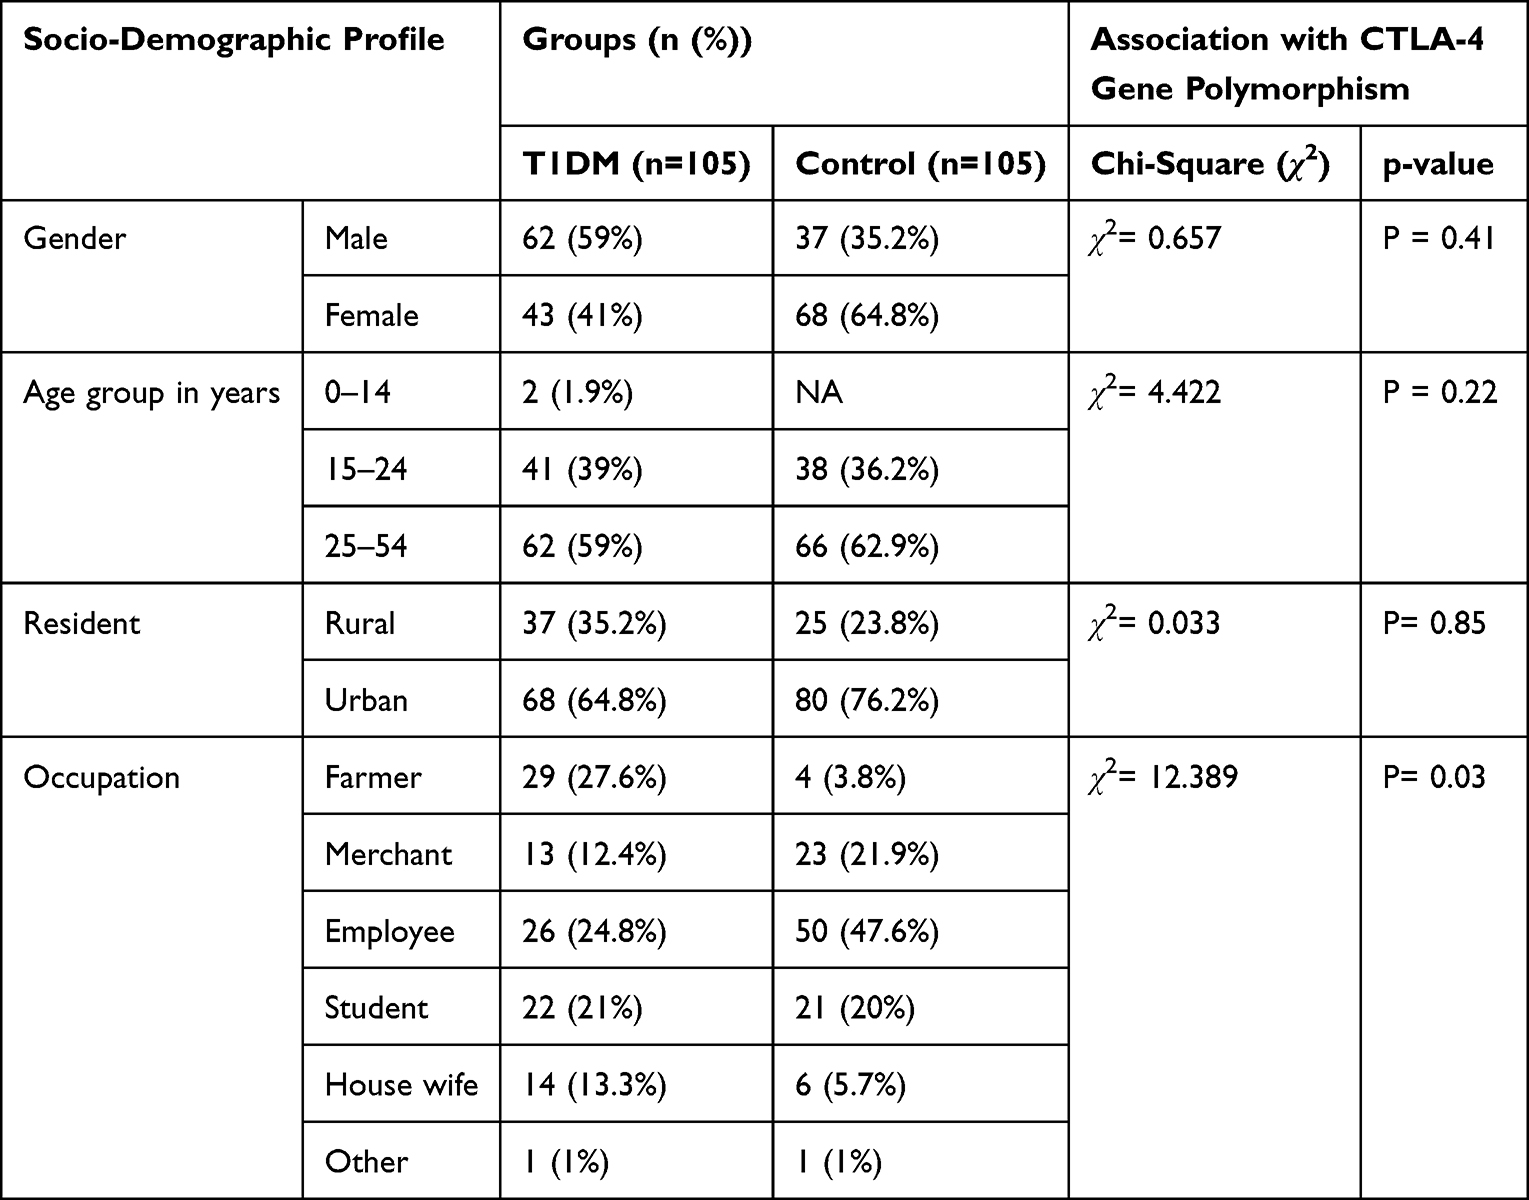 |
Table 1 Socio-Demographic Profiles of Study Participants |
Distribution of CTLA-4 Gene Polymorphism Among Study Participants
The CTLA-4 (+A49G) gene polymorphism was observed on 56 (26.7%) study participants of which 39 (37.14%) were T1DM patients and 17 (16.2%) controls. The CTLA-4 (+A49G) gene polymorphism was found distributed among 24 males and 15 females of T1DM patients and 5 males and 12 females of controls. The association between CTLA-4 (+A49G) gene polymorphism and T1DM was statistically significant (P=0.001). Regarding gender of the study group there was no difference in CTLA-4 (+A49G) gene polymorphism distribution both on T1DM patients (P=0.41, OR=0.78 95% CI,0.42–1.4) and controls (P=0.58 OR=1.37 95% CI,0.44–4.2) (Table 2).
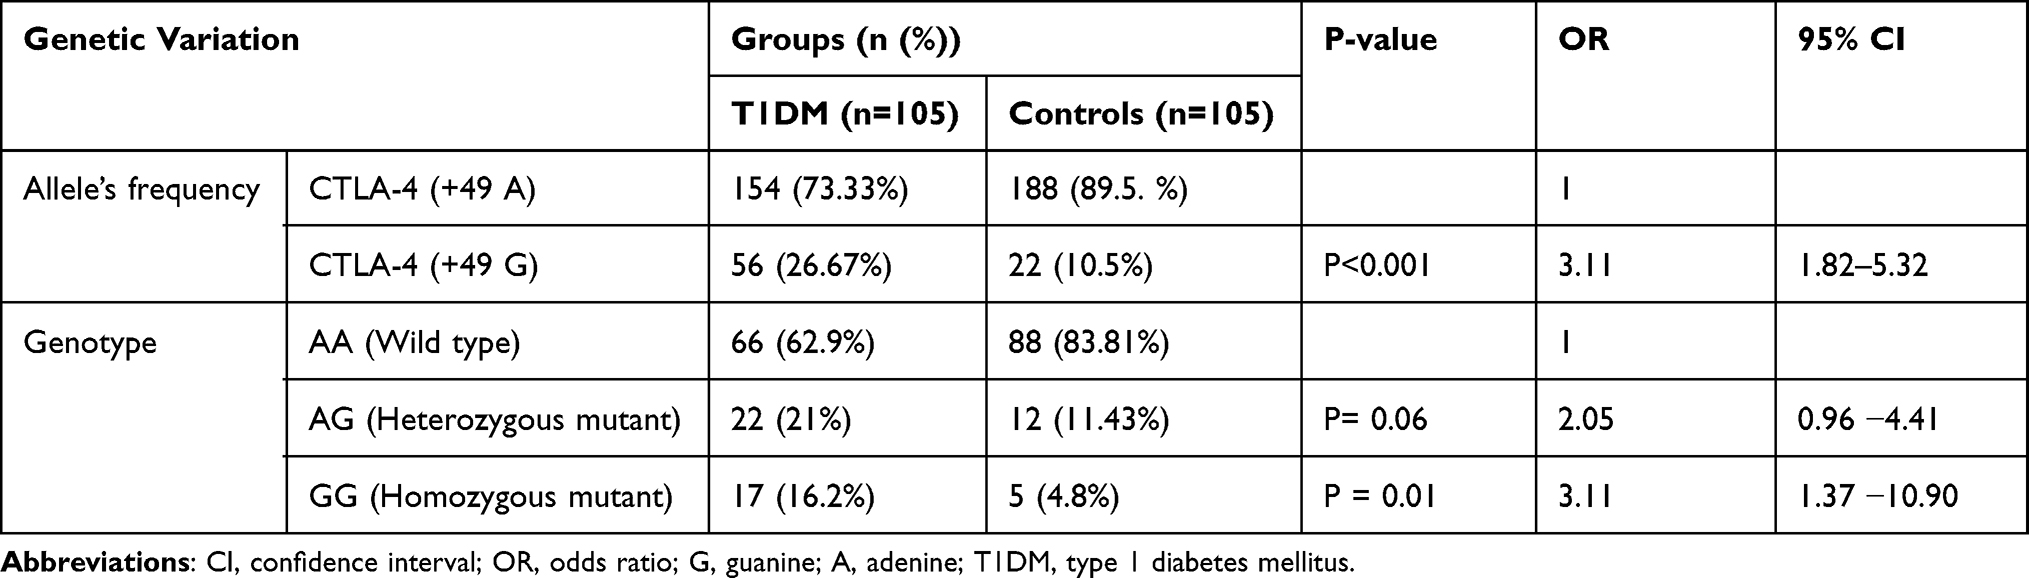 |
Table 2 Allelic Frequency and Genotype Distribution of CTLA-4 (+A49G) Polymorphism in T1DM Patients and Controls |
Allelic Frequency and Genotype of CTLA-4 (+A49G) Polymorphism Distribution Among Study Participants
The distribution of CTLA-4 (+49 A) allele was 154 (132 alleles from 66 AA variants and 22 from AG variants) in T1DM patients and 188 (176 alleles from 88 AA variants and 12 from AG variants) in controls. On the other hand, CTLA-4 (+49 G) allele was observed on 56 (22 alleles from 22 AG variants and 34 from 17 GG variants) in T1DM patients and 22 (12 alleles from 12 AG variants and 10 from 5 GG variants) in controls. The frequency of the A allele was 73.3% and 89.5%, while the G allele was 26.7% and 10.5% in T1DM and controls, respectively. A alleles frequency was higher in the control over T1DM (OR=0.32; 95% CI, 0.19–0.55; P=0.001) while G allele higher in T1DM than controls (OR=3.1; 95% CI, 1.82−5.32; P=0.001). There was a significant association between G allele and T1DM (OR=3.1; 95% CI, 1.82 −5.32; P=0.001) (Table 2).
Distribution of CTLA-4 (+49) AA homozygous (wild), AG heterozygous, GG homozygous genotype was observed, 66 (62.9%), 22 (21%),17 (16.2%), among T1DM patients and 88 (83.8%), 12 (11.43%),5 (4.8%) controls, respectively. This result revealed that homozygous AA genotype was predominantly observed among the controls group than T1DM. We have found a significant difference in homozygous GG genotype distribution in T1DM and the control group (OR=3.11; 95% CI,1.37–10.90; P=0.01). Among 23 T1DM patients who were in the age range of 15–24 years, 12 have heterozygous AG mutant gene and 11 have GG homozygous mutant gene; however, the distribution has no significant difference in another age group (P=0.7, OR=0.48, 95% CI,0.14 −1.59) (Figure 3).
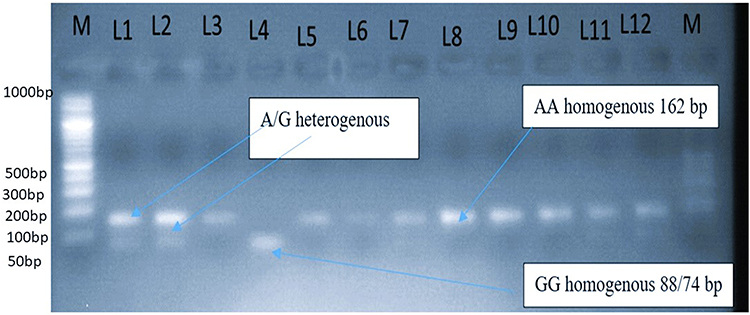 |
Figure 3 Distribution of CTLA-4 (+A49G) gene polymorphism among diabetes group and controls. Geno typing of CTLA-4 (+A49G) gene polymorphism by BbVI, RFLP. From the left M: marker or ladder DNA fragmented from 100 bp to 3000 bp. Lanes 3,5,6,7,8,9,10 and 11 are band A at162 bp or uncut. Lanes 1, 2 and 12heterozygeous (AG) genotype lane 4: homozygous GG genotype. Fragments of band G at 88 and 74bp appeared as one band due to the very closeness of the band on gel electrophoresis. |
Distribution of CTLA-4 (+A49G) Gene Polymorphism with Clinical Data, Age at the Onset of Disease, Diet, and Physical Measurement with T1DM Patients and Control
Eight (14.3%) individuals having CTLA-4 gene polymorphism both T1DM patients and controls, have a habit of drinking 1–5 bottles (3 bottles on average) of alcohol per day (P=0.6), eating fruit (P=0.72), and eating vegetables (P=0.34) among two groups were seen and found to be statistically non-significant. The result showed a statistically significant difference in blood glucose level (mean) (P=0.001), height (mean) (P=0.001), and BMI (mean) (P=0.02) between T1DM patients and controls (Table 3).
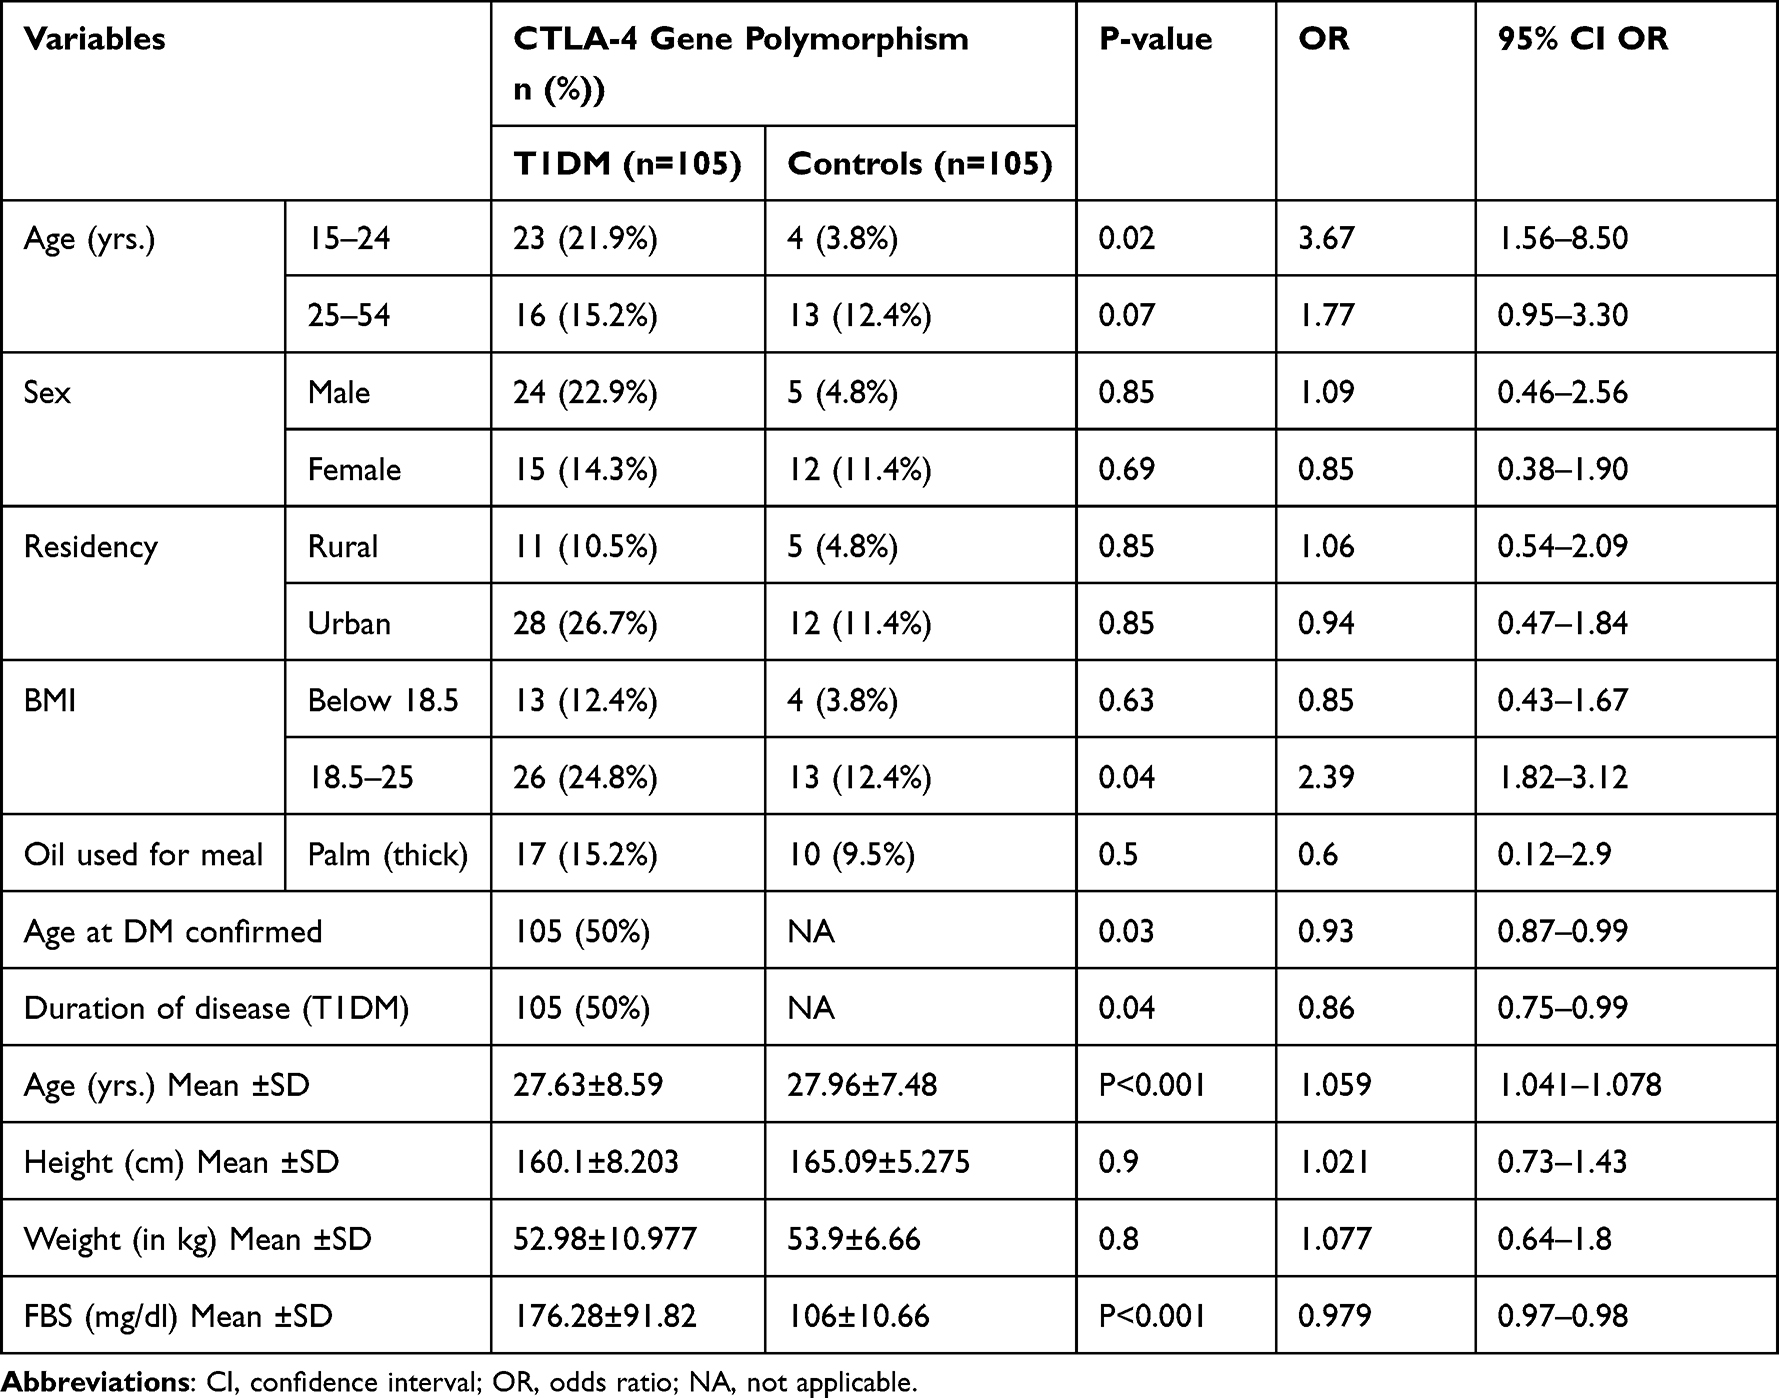 |
Table 3 Distribution of CTLA-4 (+A49G) Gene Polymorphism with Clinical Data, Diet Habit, and Physical Measurement of Study Participants |
Results Obtained from NCBI Retrieved Data on SNP of CTLA-4
We used bioinformatics tools to predict the functional effects of SNPs from the dbSNP database (Table 4).
 |
Table 4 Gene, SNP, GO, Protein, and Important Information of CTLA-4 |
Prediction of the Effect of CTLA-4 SNP on CTLA-4 Protein Structure
The CTLA-4 protein has a length of 223 aa sequence and is located at the location of 17 threonines with alanine, according to the results of gene ontology analysis (Figure 4). The SNP was determined to be harmful by the SIFT software tool and was uploaded to the PROVEAN, SNPs & GO, and PANTHER software tools. The SNP was tested using SIFT, PROVEAN, SNPs & GO, and PANTHER, and the results showed that it has no effect on its function. SNP was predicted to be potentially harmful, possibly harmful, and must be corrected using the SIFT, PolyphenV2, and SNAP2 software tools. We subjected the SNPA2 MAPP and Polyphen-2 results to further analysis of the effect of this SNP on protein stability. SNP was found to be associated with T1DM diseases (Tables 5 and 6).
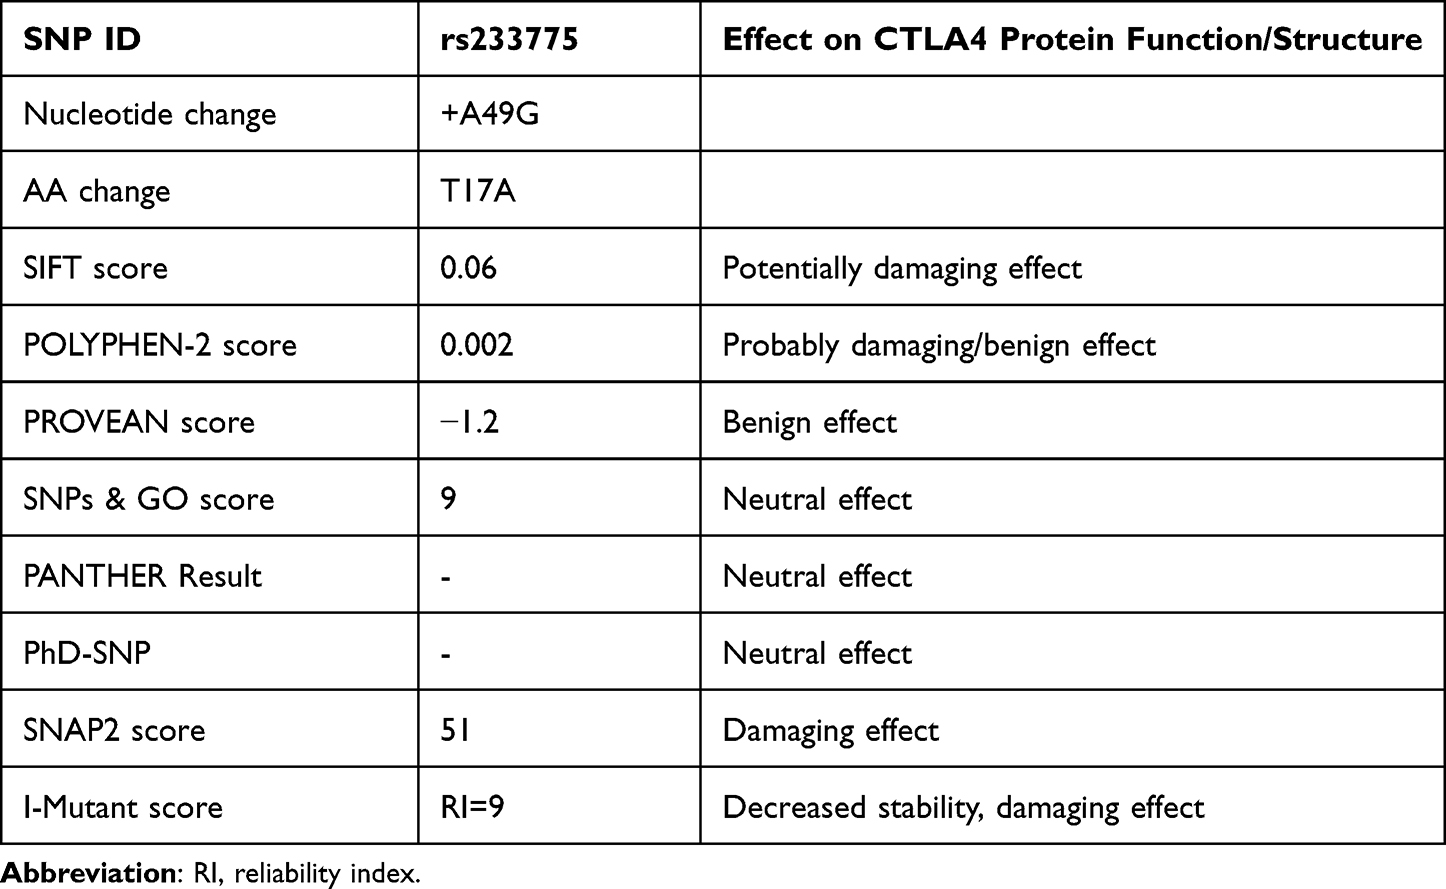 |
Table 5 Results of SIFT, POLYPHEN-2, PROVEAN, SNPs & GO, PANTHER, and I-MUTANT Tools |
 |
Table 6 Analysis of Predicted CTLA-4 SNP by PredictSNP and Effect on Its Function |
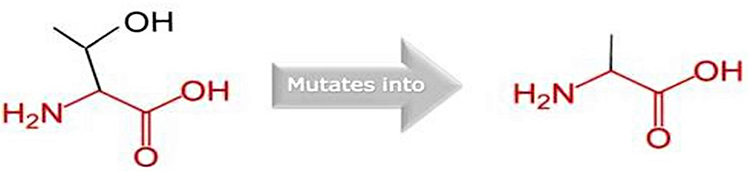 |
Figure 4 The figure shows the schematic structures of the original wild (left) and the mutant (right) amino acid. The backbone, which is the same for each amino acid, is colored red. The side chain, unique for each amino acid, is colored black. |
Stability Modification Prediction of CTLA-4 Protein
We used the I-Mutant version 3.0 tool, which introduced point mutations in the CTLA-4 protein, to predict changes in CTLA-4 stability in terms of RI and free energy change values (DDG) (Figure 4). The I-Mutant version 3.0 software tool also revealed that this SNP has a negative effect on the stability of CTLA-4 mutated protein (Table 7).
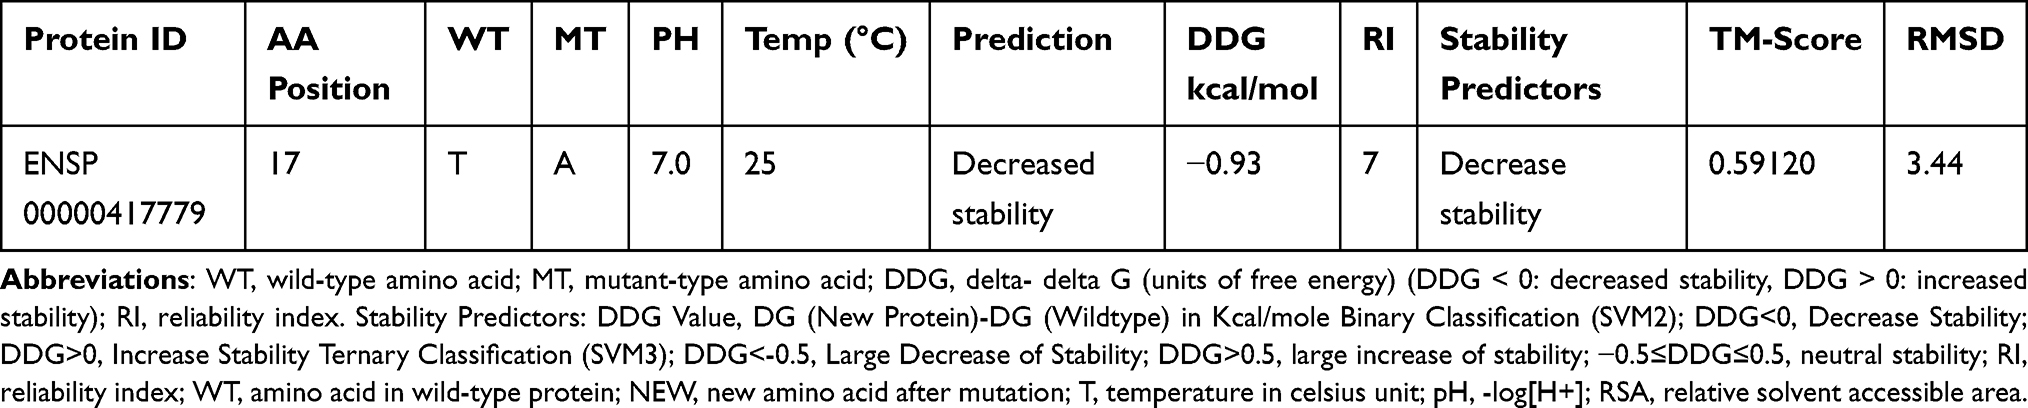 |
Table 7 Predicted Results of CTLA-4 Protein Stability by I-Mutant 3 |
Modeling of Amino Acid Substitutions Caused by CTLA-4 SNP Comparative Modeling of Wild Type CTLA-4 Protein and Its Mutants
Table 5 also includes 3-D models of CTLA-4 protein generated based on the presence of CTLA-4 SNP. Additional information obtained from the Project HOPE software on the structure, domain, and conservation of damaging SNP. The Phyre2 homology modeling tool and I-TASSER were used to create 3-D models of the wild-type CTLA-4 protein and CTLA-4 mutated with a high-risk ns-SNP. The resulting structure was examined using UCSF Chimera 1.11, a powerful program for interactive visualization and analysis of molecular structures. The TM-align tool was used to investigate structural similarities between native and mutant models based on TM and RMSD scores. Greater structural dissimilarity between wild-type and mutant models is indicated by a higher RMSD and a lower TM score value (Table 8). To validate this finding, we used I-TASSER to perform an additional structural analysis on this SNP in CTLA-4 protein. The mutant model with the lowest C-score was chosen for superimposition over the native structure (Figure 5).
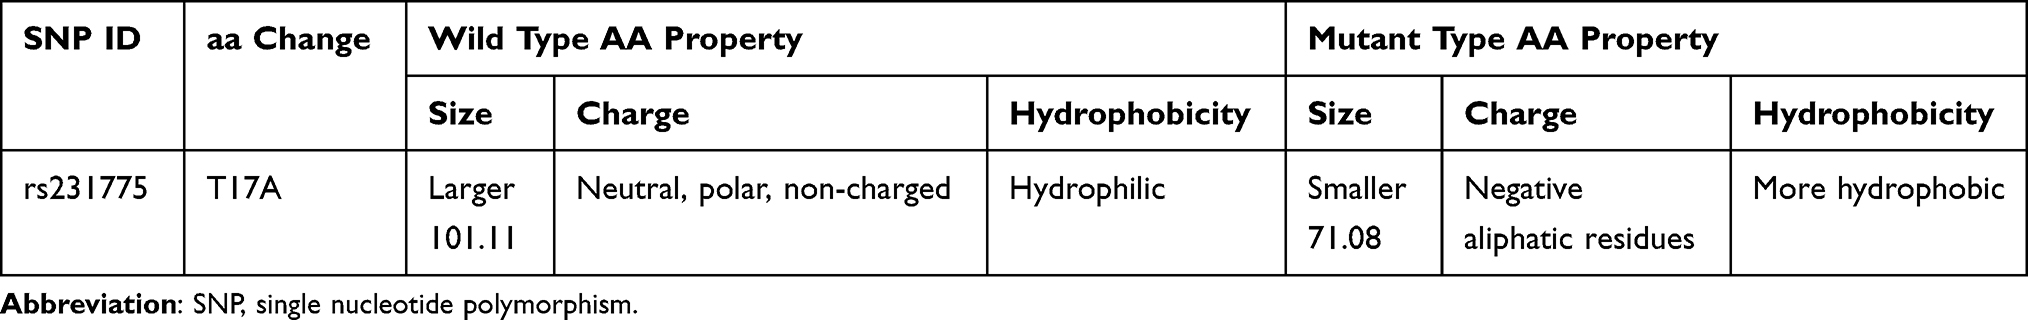 |
Table 8 Results of Wild-Type and Mutant-Type Amino Acid Properties Obtained from Project Hope Software |
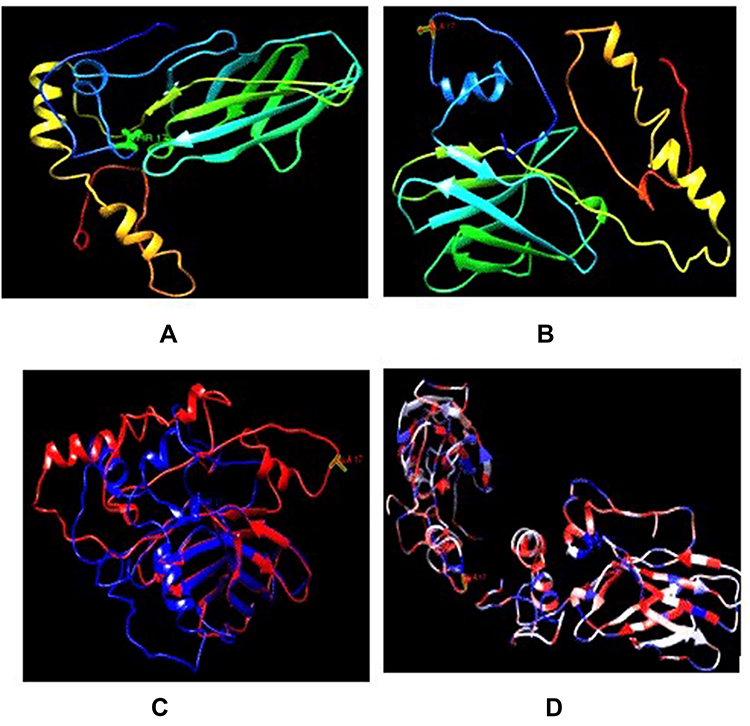 |
Figure 5 Comparison of wild type CTLA-4 protein structure with its mutant forms. (A) 3D model of wild type CTLA-4 protein. (B) 3D model of mutant type CTLA-4 protein. (C) Superimposed structures of wild type CTLA-4 protein and its mutant having mutation from threonine (blue) to alanine at position 17 (red). (D) Superimposed structures of wild type CTLA-4 protein and its mutant having mutation from threonine to alanine at position 17 based on hydrophobicity, more hydrophilic (blue) more hydrophobic (red). |
Molecular Docking and Protein Interacting Network Analysis
The binding affinity of the mutated CTLA-4 protein with B7.1/B72 protein was determined using molecular docking and revealed a significantly reduced binding affinity with B7.1/B72 protein. The UCSF Chimera software was used to investigate the binding affinity and bonding interaction patterns of these docked complexes. The altered T17A variant had the greatest reduction in binding affinity with the B7.1/B72 protein. One is formed by the wild-type peptide sequence1 hydrogen bond of 3.167 Å and higher binding affinity at position 17, whereas the mutant form has no hydrogen bonds with the target B7.1/B72 protein and reduced the binding affinity.
The protein interaction network of CTLA-4 protein was constructed using Cytoscape (v3.8.2), and it predicted that CTLA-4 protein is functionally associated with 10 proteins, of which CD80, CD86, FOXP3, FYN, ICOSL, IL17A, ITGA4, ITGAL, LCK, and PTPN11 form clusters. The CTLA-4 protein serves as a hub for these protein clusters. Any changes to the CTLA-4 protein may have an impact on the overall protein network interaction of these ten proteins (Figure 6).
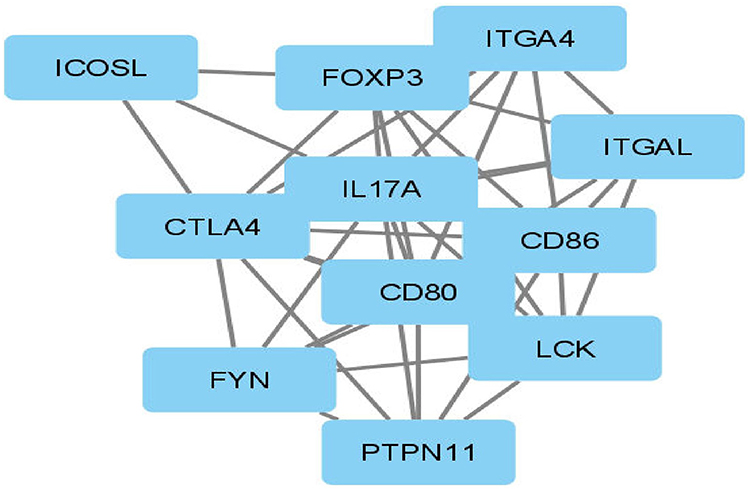 |
Figure 6 Interaction network of CTLA-4 protein. |
Discussion
So far, little to no association was found in agreement on the association of CTLA-4 A49G polymorphism with T1DM. We hypothesized that participants with T1DM would have a relationship with CTLA-4 A49G polymorphism. The ultimate goal of this study was to determine the association of CTLA-4 A49G polymorphism with T1DM in Ethiopian populations. This study’s results demonstrated that CTLA-4 (+A49G) gene polymorphism was found in 56 (26.7%) of the study participants 39 (37.14%) of them were T1DM patients and 17 (16.2%) were controlled. We also identified that the distribution of CTLA-4 (+49 A) alleles 154 (73.3%) T1DM patients and 188 (89.5%) on controls. However, considerable variations in CTLA-4 (+49 G) alleles distribution might be found higher on 56 (26.7%) T1DM patients than 32 (15.2%) controls. This alleles frequencies difference was statistically significant between the two groups as the study findings explored controls carried a high frequency of A alleles (89.5%) over T1DM patients (73.33%) P=0.005 while G allele was higher in T1DM patients (26.67%) than controls (10.5%); OR=3.1; 95% CI,1.82 −5.32; P=0.001).
This finding was highly suggestive that CTLA-4 (+49 A) alleles were protective alleles for T1DM while, CTLA-4 (+49 G) allele was susceptible to T1DM. Our findings match with those mentioned in earlier studies of Turkish,52 Chinese,53 Madurai population of India,54 and Belgian55 populations. This finding provides clues in the understanding of the established scientific evidence that the CTLA-4 (+49 G) allele is a susceptible allele for T1DM and CTLA-4 exon 1 +A49G polymorphism is associated with T1DM.
Another promising finding was genotype distribution of CTLA-4 (+49) AA homozygous genotypes (wild) was predominant in controls which are protective genotypes for diabetes over TIDM patients. However, mutant variants of genotype AG 22/105 (20.95%) and GG 17 (16.19%), were predominant on TIDM over Controls AG 12/105 (11.42%) and GG5 (4.76%) (OR=3.86; 95% CI,1.37–10.90; P=0.01).
Our findings suggested that the CTLA-4 gene was involved in the pathogenesis of T1DM, as evidenced by a higher frequency of heterogeneous A/G variants and homogeneous GG genotypes in T1DM patients (P<0.001, OR=2.44, CI 0.96 −4.41 and P=0.005 OR=3.1195% CI1.37 −10.90), respectively, in the Ethiopian population. As the odds ratio suggested the person who carried G alleles, A/G, and/or GG genotyping has a 3.11,2.44, and 4.53-folds higher in T1DM patients, respectively, as compared with controls. These findings suggest that the G allele of the CTLA-4 +A49G SNP variant was associated with increased incidences of T1DM and could be considered a risk factor for the development of T1DM. These findings are in line with other studies conducted in Egypt,23,56 Estonia,11 China,57 Romania,3 Japan,58 France,15 Sweden,59 Belgium,55 Iran, Tunisia,60 India61 Madurai population of Southern India. Contrary to the findings of studies in Brazil22 Chili62 Turkey52 and Egypt63,64 which argued that the CTLA-4+A49G polymorphism is not recognized as a risk factor for T1DM. The discrepancy in results could be attributed to the small sample size, genetic heterogeneity in the studied populations, and the various environmental factors involved in the pathogenesis of T1DM.
This study showed that the association of CTLA-4 +A49G gene polymorphism with blood glucose level; a person in the T1DM group who carried G allele, AG, and GG genotypes have a higher mean blood glucose level (P<0.001 OR=0.98, 95% CI,0.97–0.98) when compared with respective controls, which argued that the CTLA-4+A49G polymorphism is not recognized as a risk factor for T1DM. The disparity in the results might be due to the sample size variation, genetic heterogeneity in the studied populations, and the various risk factors involved in the pathogenesis of T1DM.15
We observed that when the age of onset of disease increased in the year the odds of getting CTLA-4 (+A49G) gene polymorphism increased by 0.93 this finding was contrasted with the result found in a study conducted in France.15 We strongly believed this difference may be due to the ethnic differences of the study participants. In other research, no connection between gender and CTLA-4 +A49G gene polymorphism has been observed in communities such as Chilean,62 Chinese,65 Portuguese,66 and Brazilian,22 and there has been disagreement with this in French,15 Iranian,67 and Egyptian63 populations.
Based on the age group of study participants CTLA-4 (+A49G) gene polymorphism was higher within the age range of 15–24 years T1DM (P=0.02, OR=2.48, 95% CI,1.16–5.32) when compared with respective age in the controls (P=0.3, OR=0.55, 95% CI,0.18–1.67). The study’s findings revealed that T1DM patients in this age group had twice as much CTLA-4 (+A49G) gene polymorphism as controls. This suggests that gene polymorphism may occur as children grow and are exposed to different environmental factors, and that +A49G polymorphism may confer genetic risk for T1DM, particularly with G allele frequency in younger individuals. These findings are consistent with a Chilean population study.62
Using gene ontology in silico analysis tools, we analyzed CTLA-4 +A49G gene polymorphism to predict the structural and functional effects of SNP on CTLA-4 protein, especially on the biological, molecular, and cellular function of a CTLA-4. The protein sequence has a length of 223 aa with the amino acid substitution at the location of 17 threonines with alanine. The physicochemical properties of protein from software prediction showed a change from medium size and polar threonine to a small size and hydrophobic alanine.49 This amino acid substitution affects T-cell activation by altering CTLA-4ʹs posttranslational modification and ability to bind with B7.1 (CD80), indicating that the +49G allele results in lower CTLA-4 expression compared to the +49A allele.16
The use of these bioinformatics tools can help predict the phenotypic effect of ns SNP on the biological properties of CTLA-4 proteins. Given that ns-SNP in critical cellular gene CTLA-4 modifies the normal programs of T-cell, the regulation of which is thought to play an important role in disease predisposition, such information is critical for genotype–phenotype correlations as well as disease understanding.68 As a result, efforts were made to identify SNPs that can alter the CTLA-4 gene’s structure, function, and expression. When adenine is replaced with guanine at nucleotide +49, one of the most significant CTLA-4 mutations occurs, resulting in an amino acid substitution at position 17 from threonine to alanine, known as T17A, located in the leading peptide segment found in humans. Furthermore, changes in protein sequence can cause changes in protein charge, geometry, hydrophobicity, dynamics, translation, and inter/intra protein interaction, putting cells at risk.13 Our additional in-silico analysis was used to predict this mutation as a harmful substitution that could lead to disease.
According to Project HOPE server results, the wild-type amino-acid residue threonine is larger, neutral in charge, and less hydrophobic. Mutant residue alanine, on the other hand, is smaller, negatively charged, and more hydrophobic. Furthermore, the mutated residue is in a domain that is important for protein activity and is in contact with another domain that is also important for activity. The mutation may disrupt the interaction between these domains, affecting the protein’s function (Figure 6).
The mutation is located within the signal peptide. This sequence of this peptide is important because it is recognized by other proteins and often cleaved off to generate the mature protein. The new residue that is introduced in the signal peptide differs in its properties from the original wild one. This mutation may disturb the recognition of the signal peptide. This mutation matches a previously described variant, with the following description: Thr> Ala (increased risk for, insulin-dependent diabetes mellitus:rs231775).69
The mutation introduces a more hydrophobic residue at position 17, this can result in loss of hydrogen bonds and/or disturb correct folding, this variation in size and hydrophobicity can also disrupt the H-bond interactions with the adjacent molecules.13
We discovered that protein stability is critical for a protein’s structural and functional activity. Using the I-Mutant 3.0 tool, we discovered a damaging ns-SNP that can affect the stability of the CTLA-4 protein. Protein stability determines the protein’s conformational structure and thus its function. Any change in protein stability can result in misfolding, degradation, or abnormal protein conglomeration. Furthermore, evolutionary conservancy in the protein sequence is required to determine whether a mutation is harmful to the host.42 Using the Con-Surf web server, we discovered that damaging ns-SNPs with a high conservation score were found in highly conserved areas,70 therefore, increasing the risk of autoimmune diseases like T1DM by inactivating CTLA-4 protein.
We discovered that damaging ns-SNPs with a high conservation score were found in highly conserved areas using the Con-Surf web server.46 CTLA-4 protein wild-type and mutant protein models were created. Furthermore, we used the Tm- Align tool to predict the RMSD and TM score of these Phyre2-generated wildtype and mutant protein models. Higher RMSD (3.44) and lower TM score (0.59) indicate that mutant protein structures differ from native ones (TM-score >0.5 indicates a model of correct topology and a TM-score<0.17 means a random similarity). (These cutoff does not depend on the protein length).71
For our targeted ns-SNP, we used I-TASSER, which provided more accurate structural and functional information of wild type and mutant protein models with C-score, solvation, and torsion scores (rs231775).47 Furthermore, the missense 3D tool predicted the consequences of the structural ns-SNP and showed that ns-SNP affects the structural conformation of CTLA-4. Later on, we analyzed the energy minimization state of these structural and functional residues using the YASARA tool, as the lowest energy conformation of the modeled protein is closer to the experimental structure, the energy minimization score of wild-type CTLA-4 protein has significantly deviated in T17A. It was found that threonine forms one H-bond with TRP 20 with (3.167 Å), whereas, the mutant T17A has no H-bond.49
Our docking analysis confirmed that out of the ns-SNP, variants (17A), significantly reduced the binding affinity with B7.1/B7.2 compared to the wild type (17T) residues. The most remarkable change in binding affinity was observed where a noticeable loss of H-bond interactions was found in the binding pocket.72 T17 formed an H-bond with TRP 20 in the docking complex, with distances of 3.167, but mutated type A 17 did not form an H-bond with TRP 20. This H-bond was broken when ala replaced T at position 17, altering CTLA-4 protein binding affinity. In other words, molecular docking analysis revealed that the aforementioned variants have a significant impact on CTLA-4 protein functional activity.72
CTLA-4 had strong network interactions with CD80, CD86, FOXP3, FYN, ICOSL, IL17A, ITGA4, ITGAL, LCK, and PTPN11, which participated in the regulation of signal transduction pathways, which is essential for negatively immune regulation and apoptosis of activated cells.41 When B7.1/B7.2 binds to CTLA-4 protein, it activates a signaling pathway that limits proliferation and stimulates apoptosis, which is important in negative immune regulation. Because of non-synonymous mutations in the CTLA-4 protein, the signaling cascade may be disrupted, leading to an improper immune response by infiltrating Islets of Langerhans cells with activated T-cells and anti-Islets of Langerhans antibodies. This may result in insufficient Insulin production by the Islets of Langerhans.73 If a harmful mutation occurs in this CTLA-4 protein, the CTLA-4 protein’s overall immune regulation activity will be significantly reduced. To date, no such experimental study has been documented for the protein CTLA-4. As a result, this study will provide a substantial framework for identifying functional SNP. CTLA-4 protein expression on the surface of T cells is not detected until 24–48 hours after activation. A signal peptide ensures proper targeting to the rough endoplasmic reticulum and subsequent localization within the membrane during this export event, and the leader peptide is cleaved off between serine-35 and glutamine-36. CTLA-4 can be retained at the surface or rapidly internalized by endocytosis and targeted to lysosomes, depending on its molecular interactions at the surface via the mechanisms discussed below. It is rapidly degraded after internalization, with a half-life of 2 hours in activated T cells. Although recycling in the absence of TCR ligation has not been formally demonstrated, TCR signaling can induce CTLA-4 recycling from the lysosomes to the T cell surface, providing an alternative method to rapidly increase CTLA-4 surface expression.16 Polymorphisms in CTLA-4 that cause altered activity are thought to play an important role in the risk of developing T1DM. The mechanism by which this is accomplished, states that disruption of the balance between CD-28 and CTLA-4 interactions with B7 could lead to autoimmune disease by preventing apoptosis or downregulation of activated self-reaction T-lymphocytes.74
Strength and Limitations of the Study
The main strength of this research is that it is the benchmark and a preliminary study in Ethiopia that give clue about genetical and immunological marker of CTLA-4 gene polymorphism as risk factors for T1DM in Ethiopian populations Our study has certain limitations, as with many possible genetic factors, we have not analyzed all the probable causes of diabetes at a large scale in the community and we cannot diagnose the presence of antibodies against the autoimmune disease.
Conclusion and Recommendations
The findings of our study revealed a link between the CTLA4 gene polymorphism 49 (A/G) and TIDM in the study population. The CTLA-4 (+49A/G) gene AG and GG genotypes, as well as G alleles, were linked to an increased risk of TIDM. CTLA-4 protein functions as a negative immune regulator, interacting with protein B7.1/B7.2 to carry out its immune suppressive function. As a result, CTLA-4ʹs structural conformation is critical for its functional role. This in silico analysis of the functional SNP of CTLA-4 protein provides significant insight into the potentially harmful effects of the ns-SNP on the CTLA-4 protein. According to our findings, the ns-SNP (T17A) reduces the binding affinity with B7.1/B 7.2. Overall, the findings of this study emphasize the importance of establishing local data of CTLA-4 allele frequencies and genotypes analysis, as well as the association of CTLA-4 (+A49G) gene polymorphism with T1DM patients. However, a large scale sample size is required for a compressive conclusion using a community-based cohort study in various parts of country, Ethiopia.
Abbreviations
A, adenine; CI, confidence interval; CTLA-4, cytotoxic T-lymphocyte-associated antigen 4; DKA, diabetic keto acidosis; DM, diabetes mellitus; DNA, deoxyribonucleic acid; G, guanine; HIC, high-income countries; HLA, human leukocyte antigen; IDDM, insulin-dependent diabetes mellitus; LADA, latent auto-immune diabetes in adults; LMIC, low middle-income countries; RFLP, restriction fragment length polymorphism; RT-PCR, real-time polymerase chain reaction; SNP, single nucleotide polymorphism; T1DM, type 1 diabetes mellitus.
Data Sharing Statement
All the relevant data are within the manuscript.
Acknowledgment
The authors thank the University of Gondar for its approval and facilitation of the work. In addition, the authors would like to thank the University of Gondar and Wollo University for their financial assistance and sponsorship of successful research opportunities. Any attempt at any level cannot be completed satisfactorily without the support and guidance of Abubeker Alebachew, which assists me with the progression of this research work.
The authors would like to thank Prof. Manuel Lemos (CICS-UBI, Health Sciences Research Centre, University of Beira Interior, Portugal) for providing the genotyping primers. Finally, I could not have completed this project without the help of my classmates, data collectors, study participants, and all of my friends, staff, and Hospital communities who helped me a lot in gathering different information, collecting data, and guiding me from time to time in making this project, despite their busy schedules, they gave me different ideas in making this project successful.
Funding
The authors received no funding source for this work.
Disclosure
The authors declare that no commercial or financial relationships that could be construed as a potential conflict of interest existed during the research.
References
1. Giacco F, Brownlee M, Holt RI, Cockram C, Flyvbjerg A, Goldstein BJ. Textbook of Diabetes. Wiley; 2010.
2. Worede A, Alemu S, Gelaw YA, Abebe M. The prevalence of impaired fasting glucose and undiagnosed diabetes mellitus and associated risk factors among adults living in a rural Koladiba town, northwest Ethiopia. BMC Res Notes. 2017;10(1):251. doi:10.1186/s13104-017-2571-3
3. Guja C, Marshall S, Welsh K, et al. The study of CTLA-4 and vitamin D receptor polymorphisms in the Romanian type 1 diabetes population. J Cellular Mol Med. 2002;6(1):75–81. doi:10.1111/j.1582-4934.2002.tb00312.x
4. Tesfaye T, Shikur B, Shimels T, Firdu N. Prevalence and factors associated with diabetes mellitus and impaired fasting glucose level among members of federal police commission residing in Addis Ababa, Ethiopia. BMC Endocr Disord. 2016;16(1):68. doi:10.1186/s12902-016-0150-6
5. Kanazawa Y, Motohashi Y, Yamada S, et al. Frequency of CTLA-4 gene CT60 polymorphism may not be affected by vitamin D receptor gene Bsm I polymorphism or HLA DR9 in autoimmune-related type 1 diabetes in the Japanese. Ann N Y Acad Sci. 2006;1079(1):251–256. doi:10.1196/annals.1375.038
6. Bouqbis L, Izaabel H, Akhayat O, et al. Association of the CTLA4 promoter region (− 1661G allele) with type 1 diabetes in the South Moroccan population. Genes Immun. 2003;4(2):132. doi:10.1038/sj.gene.6363933
7. Bilous R, Donnelly R. Handbook of Diabetes. John Wiley & Sons; 2010.
8. White PT. HANDBOOK OF DIABETES. Br J Gen Pract. 1993;43(373):355.
9. Powers MA. Handbook of Diabetes Nutritional Management. Aspen Publishers; 1987.
10. Ann Kelly M, Rees SD, Barnett AH, Bain SC. Molecular genetics of type 1 diabetes. In: DeFronzo RA, Ferrannini E, Zimmet P, Alberti KG, editors. International Textbook of Diabetes Mellitus. Chichester, UK: John Wiley & Sons, Ltd; 2015:454–466.
11. Haller K, Kisand K, Nemvalts V, Laine AP, Ilonen J, Uibo R. Type 1 diabetes is insulin −2221 MspI and CTLA-4 +49 A/G polymorphism dependent. Eur J Clin Invest. 2004;34(8):543–548. doi:10.1111/j.1365-2362.2004.01385.x
12. Barani M, Sargazi S, Mohammadzadeh V, et al. Theranostic advances of bionanomaterials against gestational diabetes mellitus: a preliminary review. JFB. 2021;12(4):54. doi:10.3390/jfb12040054
13. Hossain MS, Roy AS, Islam MS. In silico analysis predicting effects of deleterious SNPs of human RASSF5 gene on its structure and functions. Sci Rep. 2020;10(1):14542. doi:10.1038/s41598-020-71457-1
14. Ide A, Kawasaki E, Abiru N, et al. Association between IL-18 gene promoter polymorphisms and CTLA-4 gene 49A/G polymorphism in Japanese patients with type 1 diabetes. J Autoimmun. 2004;22(1):73–78. doi:10.1016/j.jaut.2003.10.001
15. Fajardy I, Vambergue A, Stuckens C, Weill J, Danze PM, Fontaine P. CTLA-4 49 A/G dimorphism and type 1 diabetes susceptibility: a French case-control study and segregation analysis. Evidence of a maternal effect: CTLA-4 dimorphism and type 1 diabetes. Eur J Immunol. 2002;29(3):251–257. doi:10.1046/j.1365-2370.2002.00309.x
16. Teft WA, Kirchhof MG, Madrenas J. A molecular perspective of CTLA-4 FUNCTION. Annu Rev Immunol. 2006;24(1):65–97. doi:10.1146/annurev.immunol.24.021605.090535
17. Jonson C-O, Lernmark Å, Ludvigsson J, Rutledge EA, Hinkkanen A, Faresjö M. The importance of CTLA-4 polymorphism and human leukocyte antigen genotype for the induction of diabetes-associated cytokine response in healthy school children. Pediatr Diabetes. 2007;8(4):185–192. doi:10.1111/j.1399-5448.2007.00245.x
18. Khan MY, Riaz R, Malik SA, Ali M, Afzal MS. Association of CTLA-4 polymorphisms and autoimmune type-1 diabetes mellitus susceptibility in Pakistani population. Turkish J Biochem. 2018;43(2):173–175. doi:10.1515/tjb-2017-0079
19. Ahmed NS. CTLA4 gene polymorphisms associated with insulin dependent diabetes mellitus (IDDM) type I in Iraqi population. Iraqi J Cancer Med Genet. 2018;5(2):1–4.
20. Alam S, Sayem M, Hasan MK, Sharmin Z, Pavel MA, Hossain MF. Prediction of deleterious single nucleotide polymorphisms in human p53 gene. Preprint. Bioinformatics. 2018. doi:10.1101/408476
21. Hassan MM, Omer SE, Khalf-allah RM, Mustafa RY, Ali IS, Mohamed SB. Bioinformatics approach for prediction of functional coding/noncoding simple polymorphisms (SNPs/Indels) in human BRAF gene. Adv Bioinformatics. 2016;2016:1–15. doi:10.1155/2016/2632917
22. Tavares NA, Santos MMS, Moura R, et al. Association of TNF-α, CTLA4, and PTPN22 polymorphisms with type 1 diabetes and other autoimmune diseases in Brazil. Genet Mol Res. 2015;14(4):18936–18944. doi:10.4238/2015.December.28.42
23. Mosaad YM, Elsharkawy AA, El-Deek BS. Association of CTLA-4 (+49A/G) gene polymorphism with type 1 diabetes mellitus in Egyptian children. Immunol Invest. 2012;41(1):28–37. doi:10.3109/08820139.2011.579215
24. World Health Organizations. Global Burden of Diabetes. World Health Organizations. 2021.
25. Wolde HF, Derso T, Biks GA, et al. High hidden burden of diabetes mellitus among adults aged 18 years and above in urban northwest Ethiopia. J Diabetes Res. 2020;2020:1–9. doi:10.1155/2020/9240398
26. Silver B, Ramaiya K, Andrew SB, et al. EADSG guidelines: insulin therapy in diabetes. Diabetes Ther. 2018;9(2):449–492. doi:10.1007/s13300-018-0384-6
27. Wondemagegn AT, Bizuayehu HM, Abie DD, Ayalneh GM, Tiruye TY, Tessema MT. Undiagnosed diabetes mellitus and related factors in East Gojjam (NW Ethiopia) in 2016: a community-based study. J Public Health Res. 2017;6(1). doi:10.4081/jphr.2017.834
28. Sahile AT, Bekele GE. Prevalence of diabetes mellitus and associated factors in Addis Ababa public health facilities, Addis Ababa, Ethiopia, 2016. Diabetes Metab Syndr Obes. 2020;13:501–508. doi:10.2147/DMSO.S237995
29. Balcha SA, Phillips DIW, Trimble ER. Type 1 diabetes in a resource-poor setting: malnutrition related, malnutrition modified, or just diabetes? Curr Diab Rep. 2018;18(7):47. doi:10.1007/s11892-018-1003-7
30. Habtewold TD, Tsega WD, Wale BY. Diabetes mellitus in outpatients in Debre Berhan Referral Hospital, Ethiopia. J Diabetes Res. 2016;2016:1–6. doi:10.1155/2016/3571368
31. Tsega G, Getaneh G, Taddesse G, Alam K. Are Ethiopian diabetic patients protected from financial hardship? PLoS One. 2021;16(1):e0245839. doi:10.1371/journal.pone.0245839
32. Nisticò L, Buzzetti R, Pritchard LE, et al. The CTLA-4 gene region of chromosome 2q33 is linked to, and associated with, type 1 diabetes. Hum Mol Genet. 1996;5(7):1075–1080. doi:10.1093/hmg/5.7.1075
33. CSA. Summary and Statistical Report of the 2007 Population and Housing Census Addis Ababa, Ethiopia. Population and Housing Census Commission. 2008:57–60.
34. World Health Organization. Global Report on Diabetes. Geneva: World Health Organization; 2016.
35. García-Alegría AM, Anduro-Corona I, Pérez-Martínez CJ, Guadalupe Corella-Madueño MA, Rascón-Durán ML, Astiazaran-Garcia H. Quantification of DNA through the NanoDrop spectrophotometer: methodological validation using standard reference material and Sprague Dawley rat and human DNA. Int J Anal Chem. 2020;2020:1–9. doi:10.1155/2020/8896738
36. Choura M, Rebaï A. Applications of computational tools to predict functional SNPs effects in human ErbB genes. J Recept Signal Transduct. 2009;29(5):286–291. doi:10.1080/10799890902911948
37. Arshad M, Bhatti A, John P, Zhang Y. Identification and in silico analysis of functional SNPs of human TAGAP protein: a comprehensive study. PLoS One. 2018;13(1):e0188143. doi:10.1371/journal.pone.0188143
38. Mah JTL, Low ESH, Lee E. In silico SNP analysis and bioinformatics tools: a review of the state of the art to aid drug discovery. Drug Discov Today. 2011;16(17–18):800–809. doi:10.1016/j.drudis.2011.07.005
39. Capriotti E, Fariselli P. PhD-SNPg: a webserver and lightweight tool for scoring single nucleotide variants. Nucl Acids Res. 2017;45(W1):W247–W52. doi:10.1093/nar/gkx369
40. Capriotti E, Calabrese R, Fariselli P, Martelli P, Altman RB, Casadio R. WS-SNPs&GO: a web server for predicting the deleterious effect of human protein variants using functional annotation. BMC Genom. 2013;14(Suppl 3):S6. doi:10.1186/1471-2164-14-S3-S6
41. Shannon P, Markiel A, Ozier O, et al. Cytoscape: a software environment for integrated models of biomolecular interaction networks. Genome Res. 2003;13(11):2498–2504. doi:10.1101/gr.1239303
42. Zhang M, Huang C, Wang Z, Lv H, Li X. In silico analysis of non-synonymous single nucleotide polymorphisms (nsSNPs) in the human GJA3 gene associated with congenital cataract. BMC Mol and Cell Biol. 2020;21(1):12. doi:10.1186/s12860-020-00252-7
43. Pejaver V, Urresti J, Lugo-Martinez J, et al. MutPred2: inferring the molecular and phenotypic impact of amino acid variants. preprint. Bioinformatics. 2017. doi:10.1093/bioinformatics/btx272
44. Kalia N, Sharma A, Kaur M, Kamboj SS, Singh J. A comprehensive in silico analysis of non-synonymous and regulatory SNPs of human MBL2 gene. SpringerPlus. 2016;5(1):811. doi:10.1186/s40064-016-2543-4
45. Saeed NA, Hamzah IH, Ali ANM, Abuderman AA. Prediction of single nucleotide polymorphisms (SNPs) in apolipoprotein E gene and their possible associations with a deleterious effect on the structure and functional properties: an in silico approach. Netw Model Anal Health Inform Bioinform. 2018;7(1):16. doi:10.1007/s13721-018-0178-9
46. Kelley LA, Mezulis S, Yates CM, Wass MN, Sternberg MJ. The Phyre2 web portal for protein modeling, prediction and analysis. Nat Protoc. 2015;10(6):845–858. doi:10.1038/nprot.2015.053
47. Zhang Y. I-TASSER server for protein 3D structure prediction. BMC Bioinform. 2008;9(1):40. doi:10.1186/1471-2105-9-40
48. Pettersen EF, Goddard TD, Huang CC, et al. UCSF Chimera–a visualization system for exploratory research and analysis. J Comput Chem. 2004;25(13):1605–1612. doi:10.1002/jcc.20084
49. Venselaar H, Te Beek TA, Kuipers RK, Hekkelman ML, Vriend G. Protein structure analysis of mutations causing inheritable diseases. An e-Science approach with life scientist friendly interfaces. BMC Bioinform. 2010;11(1):548. doi:10.1186/1471-2105-11-548
50. Berezin C, Glaser F, Rosenberg J; Berezin CeaC. The identification of functionally and structurally important residues in protein sequences. Bioinformatics. 2004;20:1322–1324. doi:10.1093/bioinformatics/bth070
51. Dallakyan S, Olson AJ. Small-molecule library screening by docking with PyRx. Methods Mol Biol. 2015;1263:243–250.
52. Fatih Ç, Doğa T, Deniz Ö, Sema A, Olcay Y. CTLA-4 (+49A/G) polymorphism and type-1 diabetes in Turkish children. J Clin Res Pediatr Endocrinol. 2013;5(1):40–43. doi:10.4274/Jcrpe.879
53. Osei-Hyiaman D, Hou L, Zhiyin R, et al. Association of a novel point mutation (C159G) of the CTLA4 gene with type 1 diabetes in West Africans but not in Chinese. Diabetes. 2001;50(9):2169–2171. doi:10.2337/diabetes.50.9.2169
54. Philip B, Isabel W. Association of cytotoxic T lymphocyte-associated antigen 4 gene single nucleotide polymorphism with type 1 diabetes mellitus in Madurai population of Southern India. Indian J Hum Genet. 2011;17(2):85. doi:10.4103/0971-6866.86189
55. Van der Auwera BJ, Vandewalle CL, Schuit FC, et al. CTLA‐4 gene polymorphism confers susceptibility to insulin‐dependent diabetes mellitus (IDDM) independently from age and from other genetic or immune disease markers. Clin Exp Immunol. 1997;110(1):98–103. doi:10.1111/j.1365-2249.1997.t01-1-512-ce1410.x
56. Bobby Koeleman HMS. Association of CTLA-4 polymorphisms with type 1 diabetes in the Egyptian Population. J Diabetes Metab. 2013;04(07). doi:10.4172/2155-6156.1000291
57. Jin P, Xiang B, Huang G, Zhou Z. The association of cytotoxic T-lymphocyte antigen-4+ 49A/G and CT60 polymorphisms with type 1 diabetes and latent autoimmune diabetes in Chinese adults. J Endocrinol Invest. 2015;38(2):149–154. doi:10.1007/s40618-014-0162-x
58. Fajardy I, Vambergue A, Stuckens C, Weill J, Danze PM, Fontaine P. CTLA‐4 49 A/G dimorphism and type 1 diabetes susceptibility: a French case–control study and segregation analysis. Evidence of a maternal effect. Eur J Immunol. 2002;29(3):251–257.
59. Cosentino A, Gambelunghe G, Tortoioli C, Falorni A. CTLA-4 gene polymorphism contributes to the genetic risk for latent autoimmune diabetes in adults. Ann N Y Acad Sci. 2006;958(1):337–340. doi:10.1111/j.1749-6632.2002.tb03000.x
60. Benmansour J, Stayoussef M, Al-Jenaidi FA, et al. Association of single nucleotide polymorphisms in cytotoxic T-lymphocyte antigen 4 and susceptibility to autoimmune type 1 diabetes in tunisians. CVI. 2010;17(9):1473–1477. doi:10.1128/CVI.00099-10
61. Padma-Malini R, Rathika C, Ramgopal S, et al. Associations of CTLA4 +49 A/G dimorphism and HLA-DRB1*/DQB1* alleles with type 1 diabetes from South India. Biochem Genet. 2018;56(5):489–505. doi:10.1007/s10528-018-9856-7
62. Balic I, Angel B, Codner E, Carrasco E, Pérez-Bravo F. Association of CTLA-4 polymorphisms and clinical-immunologic characteristics at onset of type 1 diabetes mellitus in children. Hum Immunol. 2009;70(2):116–120. doi:10.1016/j.humimm.2008.12.007
63. Kamel AM, Mira MF, Mossallam GI, et al. Lack of association of CTLA-4 +49 A/G polymorphism with predisposition to type 1 diabetes in a cohort of Egyptian families. Egypt J Med Hum Genet. 2014;15(1):25–30. doi:10.1016/j.ejmhg.2013.09.002
64. Tawfik M, Abou El-Ella S, Abouzouna Z. Association of CTLA-4 (+49A/G) gene polymorphism with type 1 diabetes mellitus in Egyptian children. Menoufia Med J. 2016;29(1):100. doi:10.4103/1110-2098.178996
65. Wang J, Liu L, Ma J, Sun F, Zhao Z, Gu M. Common variants on cytotoxic T lymphocyte antigen-4 polymorphisms contributes to type 1 diabetes susceptibility: evidence based on 58 studies. PLoS One. 2014;9(1):e85982. doi:10.1371/journal.pone.0085982
66. Lemos MC, Coutinho E, Gomes L, et al. The CTLA4 +49 A/G polymorphism is not associated with susceptibility to type 1 diabetes mellitus in the Portuguese population. Int J Immunogenet. 2009;36(3):193–195. doi:10.1111/j.1744-313X.2009.00844.x
67. Majaliwa ES, Elusiyan BEJ, Adesiyun OO, et al. Type 1 diabetes mellitus in the African population: epidemiology and management challenges. Acta Biomed. 2008;79(3):255–259.
68. Fernández-Mestre M, Sánchez K, Balbás O, et al. Influence of CTLA-4 gene polymorphism in autoimmune and infectious diseases. Hum Immunol. 2009;70(7):532–535. doi:10.1016/j.humimm.2009.03.016
69. Dunlavy DM, O’Leary DP, Klimov D, Thirumalai D. HOPE: a homotopy optimization method for protein structure prediction. J Comput Biol. 2005;12(10):1275–1288. doi:10.1089/cmb.2005.12.1275
70. Hea A, Abadi S, Martz E. ConSurf: improved methodology to estimate and visualize evolutionary conservation in macromolecules. Nucl Acids Res. 2016;44:W344–W350. doi:10.1093/nar/gkw408
71. Zhang YS. TM-align: a protein structure alignment algorithm based on the TMscore. Nucleic Acids Res. 2005;33:2302–2309. doi:10.1093/nar/gki524
72. Trott O, Olson AJ. AutoDock Vina: improving the speed and accuracy of docking with a new scoring function, efficient optimization, and multithreading. J Comput Chem. 2010;31(2):455–461. doi:10.1002/jcc.21334
73. Gough SCL, Walker LSK, Sansom DM. CTLA4 gene polymorphism and autoimmunity. Immunol Rev. 2005;204(1):102–115. doi:10.1111/j.0105-2896.2005.00249.x
74. Thi-Qar IIN. Investigate the relation between CTLA-4 gene polymorphisms and insulin dependent diabetes mellitus (IDDM) type I in Thi-Qar Population. Int J Med Pharm Sci. 2014;4(6):45–54.
 © 2022 The Author(s). This work is published and licensed by Dove Medical Press Limited. The
full terms of this license are available at https://www.dovepress.com/terms
and incorporate the Creative Commons Attribution
- Non Commercial (unported, 3.0) License.
By accessing the work you hereby accept the Terms. Non-commercial uses of the work are permitted
without any further permission from Dove Medical Press Limited, provided the work is properly
attributed. For permission for commercial use of this work, please see paragraphs 4.2 and 5 of our Terms.
© 2022 The Author(s). This work is published and licensed by Dove Medical Press Limited. The
full terms of this license are available at https://www.dovepress.com/terms
and incorporate the Creative Commons Attribution
- Non Commercial (unported, 3.0) License.
By accessing the work you hereby accept the Terms. Non-commercial uses of the work are permitted
without any further permission from Dove Medical Press Limited, provided the work is properly
attributed. For permission for commercial use of this work, please see paragraphs 4.2 and 5 of our Terms.