")
Back to Journals » Diabetes, Metabolic Syndrome and Obesity » Volume 15
Association Between Triglyceride-Glucose Index and Risk of Metabolic Dysfunction-Associated Fatty Liver Disease: A Cohort Study
Authors Zhang R , Guan Q, Zhang M, Ding Y, Tang Z, Wang H, Zhang W, Chen Y, Jiang R, Cui Y, Wang J
Received 27 July 2022
Accepted for publication 7 October 2022
Published 19 October 2022 Volume 2022:15 Pages 3167—3179
DOI https://doi.org/10.2147/DMSO.S383907
Checked for plagiarism Yes
Review by Single anonymous peer review
Peer reviewer comments 2
Editor who approved publication: Dr Konstantinos Tziomalos
Ru Zhang,1,* Qing Guan,1,* Mengting Zhang,1 Yajie Ding,1 Zongzhe Tang,1 Hongliang Wang,2 Wei Zhang,3 Yue Chen,1 Rong Jiang,1 Yan Cui,1 Jie Wang1
1School of Nursing, Nanjing Medical University, Nanjing, People’s Republic of China; 2Department of General Practice, Community Health Service Center, Nanjing, People’s Republic of China; 3Department of Epidemiology, Shanghai Cancer Institute, Shanghai, People’s Republic of China
*These authors contributed equally to this work
Correspondence: Jie Wang; Yan Cui, School of Nursing, Nanjing Medical University, 101 Longmian Avenue, Jiangning District, Nanjing, Jiangsu, 211166, People’s Republic of China, Tel +86-25-86869557, Email [email protected]; [email protected]
Objective: Insulin resistance (IR) is a major factor involved in the pathogenesis of metabolic dysfunction-associated fatty liver disease (MAFLD). Triglyceride-glucose (TyG) index, an easily detected surrogate marker of IR, has not been explored sufficiently on its relationship with incident MAFLD risk. This study sought to investigate the association of baseline TyG index with the risk of MAFLD in a Chinese cohort.
Methods: This health check-up cohort was constructed with eligible 2056 Chinese from a community. The TyG index was calculated as ln (fasting triglyceride [mg/dL]×fasting glucose [mg/dL]/2). Cox proportion hazard models were used to evaluate the longitudinal association between baseline TyG index and the risk of MAFLD.
Results: During an average follow-up of 2.5 ± 0.5 years, about 12.8% of the subjects developed MAFLD, and the incidence of MAFLD trended to increase with the quartile TyG index (Ptrend < 0.05). After adjusting for all confounders, TyG index was independently correlated with the risk of incident MAFLD (HR = 1.784, 95% CI = 1.383– 2.302, P < 0.001), and the risk of MAFLD in the highest quartile of TyG index was two times higher than that in the lowest quartile (95% CI = 1.377– 2.992, P = 0.001). The restricted cubic spline analysis showed that the relationship between TyG index and the risk of MAFLD was linear in males (P for total < 0.001; P for non-linearity = 0.746), but nonlinear in females (P for non-linearity = 0.040).
Conclusion: A high baseline TyG index was independently associated with a high risk of incident MAFLD, and we might develop the strategy of MAFLD prevention based on the TyG index.
Keywords: triglyceride-glucose index, metabolic dysfunction-associated fatty liver disease, insulin resistance, risk, cohort study
Introduction
Metabolic dysfunction-associated fatty liver disease (MAFLD), previously named as nonalcoholic fatty liver disease (NAFLD), is common worldwide,1 and progresses across simple steatosis, nonalcoholic steatohepatitis (NASH) and cirrhosis.2 The reported prevalence of MAFLD is approximately 25% in the global adult population,3 and has surged to 29.2% in China’s mainland.4 Moreover, the total population of MAFLD patients will rise to about 314 million in China in 2030, manifesting the biggest increase in the world.5 MAFLD is a major cause of cirrhosis, hepatocellular carcinoma and liver transplantation,6 as well as a risk factor for cardiovascular disease (CVD), colorectal tumors and chronic kidney disease.7 Given these, a simple, accurate, and effective tool is urgently needed for early identification of MAFLD.
The pathophysiology of MAFLD remains unclear. Associative factors include insulin resistance (IR), type 2 diabetes mellitus (T2DM), CVD, dyslipidemia and genetic variation.2 Among them, IR plays a pathogenic role in MAFLD, T2DM and CVD.8,9 Therefore, the risk of these diseases may be predicted by an index of IR. The gold standard for IR measurement is the hyperinsulino-euglycemic clamp, but its clinical application is limited due to its cost, time and invasive.10 Homeostasis model assessment of insulin resistance (HOMA-IR) is another well-known IR estimation method. However, the study has shown that HOMA-IR varies greatly according to the type of insulin assay and the normal range of fasting plasma insulin levels.11 Insulin levels are usually measured for diabetic patients and are not suitable for the general population. Thus, a variety of IR replacement markers have emerged in recent years, among which the triglyceride-glucose (TyG) index has been recommended as a simple IR replacement marker.12,13 It has revealed a positive correlation between the TyG index and the occurrence of CVD as well as T2DM.9,14–16 Meanwhile, studies have demonstrated that the TyG index changes with the development of MAFLD.11,17,18 However, most of these studies are cross-sectional. Therefore, we designed this cohort study to investigate the longitudinal association of baseline TyG index with the risk of incident MAFLD in the Chinese.
Methods
Study Population
The cohort in this study was established with a check-up population (aged ≥18 years) in a community in Nanjing (Jiangsu, China). Prior to recruitment, participants were examined for hepatic steatosis by abdominal ultrasound (Logiq E9 ultrasound system, General Electric (GE) Healthcare, Milwaukee, WI, USA) and subsequently diagnosed for the presence or absence of MAFLD according to the MAFLD diagnostic procedure.19 Participants without MAFLD were recruited as study subjects, and baseline data were collected by questionnaire and laboratory assessment. Recruitment and baseline surveys were completed between August 2017 and September 2018 (n = 3062). The follow-up interval was set at least 2 years. Participants who made an active appointment or passively invited to complete a check-up from March 2020 to December 2021 were considered as successful follow-up. Subjects with missing data on baseline fasting triglycerides (TG) and fasting blood glucose (FPG) (n = 826) as well as subjects lost to follow-up (n = 180) were excluded. A total of 2056 eligible participants were included for analysis, including 1298 (63.1%) males and 758 (36.9%) females. The age of all subjects ranged from 19 to 90 years, with an average age of 37.42±10.12. The current study protocol was in accordance with the Declaration of Helsinki, and was approved by the Institutional Ethics Review Committee of Nanjing Medical University (Nanjing, China). Written informed consent was obtained from all participants.
In addition, the primary outcome of this study was set as newly diagnosed MAFLD. According to the requirements of the Cox proportional hazards regression analysis, one independent variable should correspond to at least 15 non-truncated events. A total of 12 independent variables, with at least 180 newly diagnosed MAFLD were included in this study.
Data Collection and Definition
Demographic information (eg, age, sex) and anthropometric data (eg, height, weight, and blood pressure) were collected by a self-designed questionnaire and an electronic medical record system. In measuring height, the participant was required to stand straight on the ground without shoes, with their hips and heels against the wall. In measuring weight, the participant was required to remove shoes and wear light clothing. Body mass index (BMI) was calculated as the weight (kg)/height (m)2. Blood pressure was measured in the seated patient using a mercury sphygmomanometer with a 5-min interval, and the average of two readings was defined as systolic blood pressure (SBP) and diastolic blood pressure (DBP). Hypertension was defined as SBP ≥140 mmHg and (or) DBP ≥90 mmHg.20
After an 8-hours fasting, the blood was sampled to determine biochemical parameters, including γ-glutamyl transpeptidase (GGT), alanine aminotransferase (ALT), aspartate transaminase (AST), low-density lipoprotein cholesterol (LDL-C), high-density lipoprotein cholesterol (HDL-C), total cholesterol (TC), triglyceride (TG), fasting plasma glucose (FPG) and serum uric acid (SUA). All the laboratory parameters were analyzed by an automatic biochemical analyzer (Mindray BC-860; Mindray, Shenzhen, China). In addition, the TyG index was calculated as ln (fasting triglyceride [mg/dL]×fasting plasma glucose [mg/dL]/2).21 Plasma HDL-C <1.0 mmol/L for man (<1.3 mmol/L for woman) was defined as low HDL-C, TG ≥1.7 mmol/L as hypertriglyceridemia, FPG ≥5.6 mmol/L as hyperglycemia, and SUA >420 µmol/L for man (>360 µmol/L for woman) as hyperuricemia.19,22 Other plasma GGT, ALT, AST, LDL-C and TC were defined according to the classification methods or guidelines of routine clinical indicators.23
Statistical Analysis
Continuous variables in normal and skewed distributions were described as mean ± standard deviation (SD) and median with interquartile range (IQR), respectively. Categorical variables were described as frequency and percentage. Missing baseline covariates were imputed by the expectation maximization algorithm. The TyG index was assessed by both continuous variables and quartiles. To investigate the linearity of baseline characteristics across quartiles of TyG index, χ2 test was used for categorical variables, and one-way analysis of variance (ANOVA) and Kruskal–Wallis H-tests for continuous variables with normal and skewed distributions, respectively. Cox proportional hazard regression was used to estimate the hazard ratio (HR) and 95% confidence interval (95% CI) for quantifying the association of TyG index with the risk of incident MAFLD. Subgroup analysis and multiplicative interaction test were performed to verify the robustness of association. In addition, Kaplan–Meier analysis was used for a graphical presentation of the time to the development of MAFLD, and the Log rank test was used to assess differences among groups. Bonferroni correction was used to control the family-wise error rate in all multiple comparisons, and the P-value threshold for significance after Bonferroni correction was 0.05/6=0.008. Besides, restricted cubic spline (RCS) analysis was carried out to explore the non-linearity relationship between TyG index and MAFLD risk. Three knots were generated at the 10th, 50th and 90th percentiles, and the 50th percentile of TyG index was used for reference. The R package “SurvivalROC” was used to plot time-dependent receiver operating characteristic curves (ROC). All statistical analyses were processed using SPSS (version 26.0, SPSS Inc., Chicago, IL, USA), MedCalc (Version 20.1.0, Ostend, Belgium) and R software (version 4.0.2). A two-tailed P<0.05 was regarded as statistically significant.
Results
Baseline Characteristics of Participants
The cohort was divided into four groups based on the quartiles of baseline TyG index (Q1: <7.93, Q2: ≥7.93 to <8.23, Q3: ≥8.23 to <8.58, Q4: ≥8.58), and the demographic and clinical characteristics at baseline are summarized in Table 1. Compared with the lowest quartile, a higher quartile of TyG index was more enriched in male and older subjects (all P for trend <0.001). Similarly, the BMI, SBP, DBP, GGT, ALT, AST, LDL-C, TC, TG, FPG and SUA in the higher TyG index quartile were significantly higher than those in the lower quartile (all P for trend <0.001), while the HDL-C in the higher TyG index quartile was significantly lower than that in the lower quartile (P for trend <0.001).
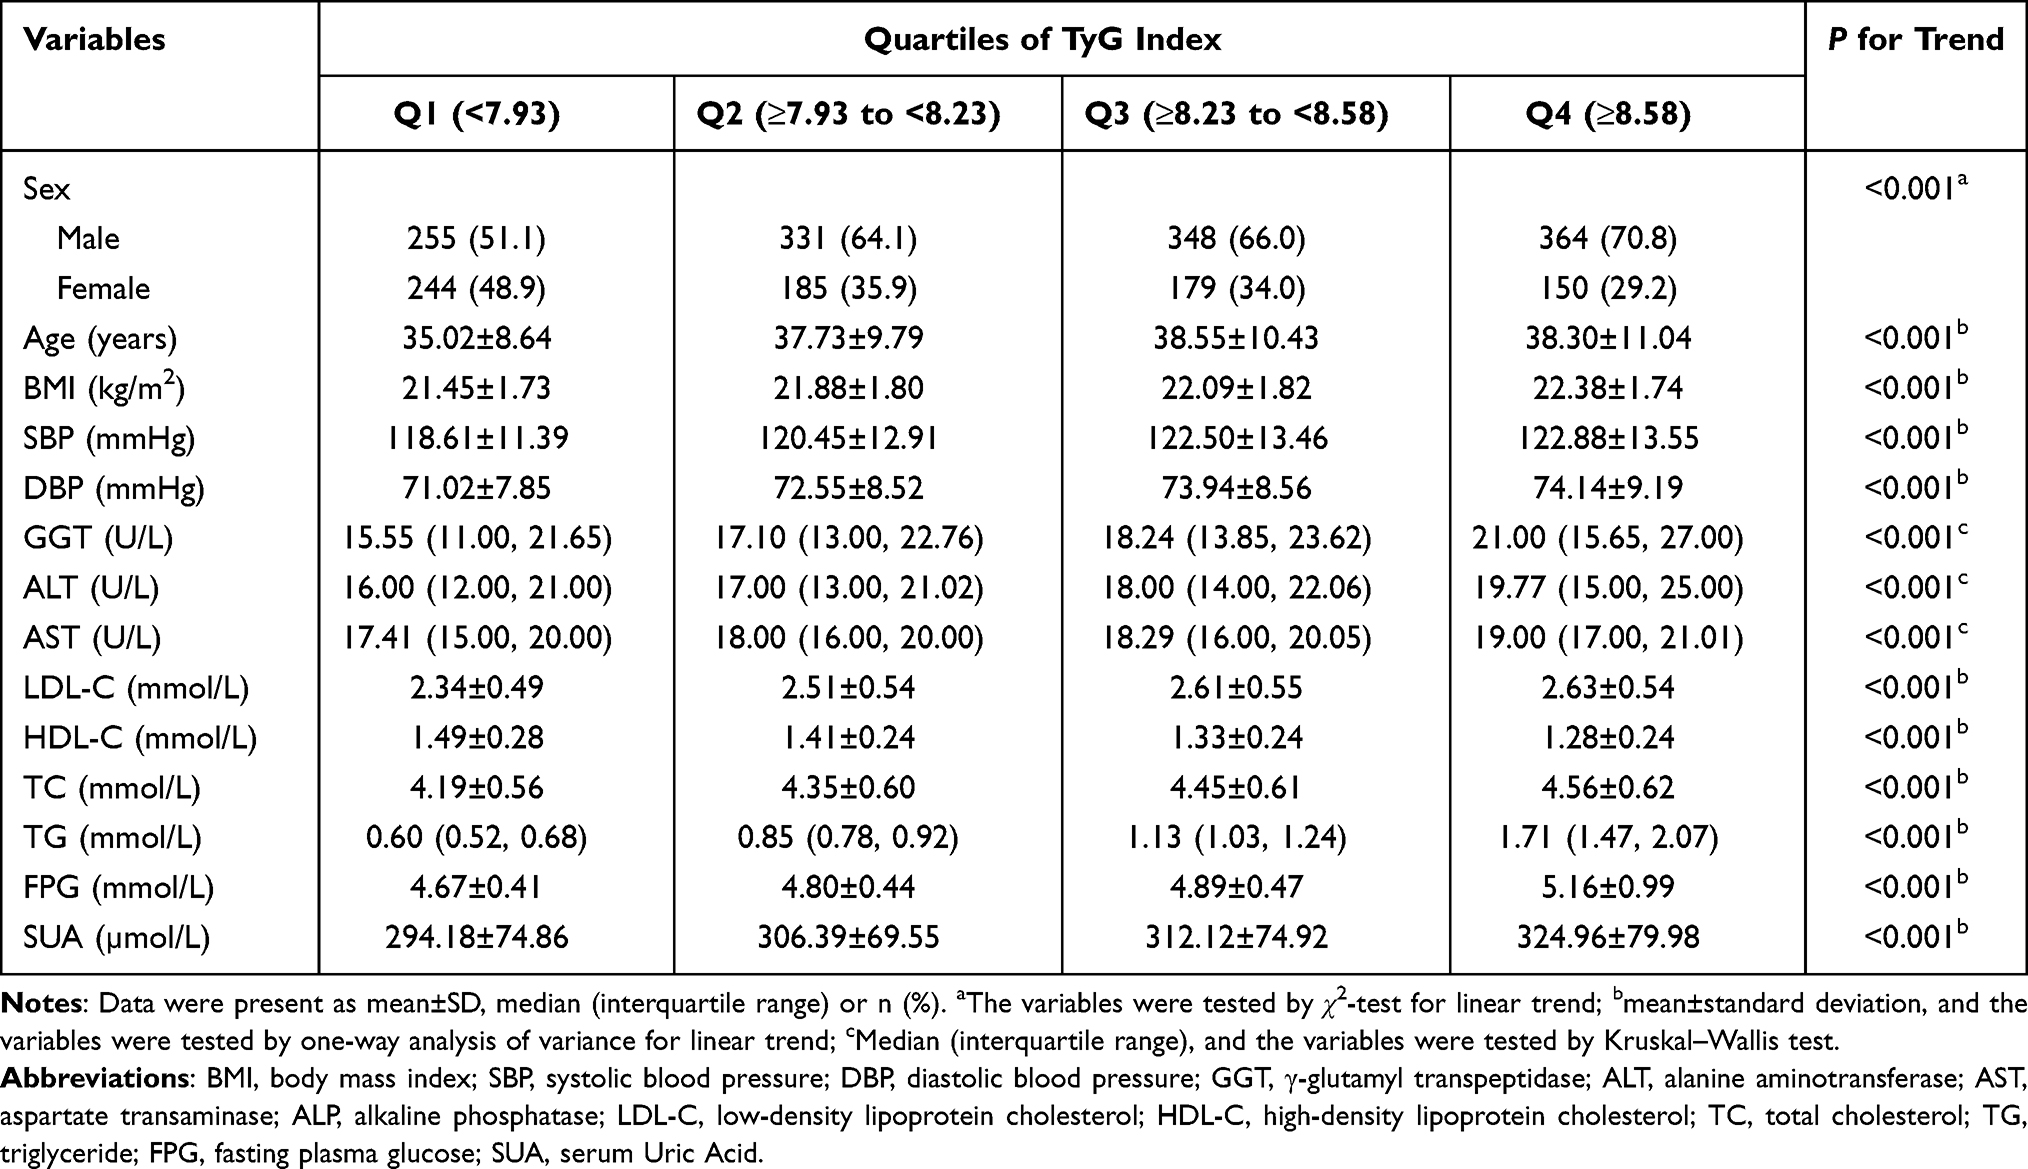 |
Table 1 Baseline Characteristics of Participants According to Quartiles of TyG Index (N = 2056) |
Incidences of MAFLD in Four Quartiles
As shown in Figure 1A, during an average follow-up of 2.5±0.5 years, 264 (12.8%, 264/2056) incident MAFLD cases were observed, and the cumulative incidence of MAFLD increased with the TyG index quartile (χ2 = 38.33, P for trend <0.001). Similarly, multiple comparisons showed that the cumulative incidence of MAFLD in a higher TyG index quartile (Q4 and Q3) was higher than that in a lower TyG index quartile (Q2 and Q1), with all P for Bonferroni correction <0.008. However, there was no significant difference in the cumulative incidence of MAFLD between two adjacent percentile groups (Q4 vs Q3, Q2 vs Q1; all P for Bonferroni correction >0.008).
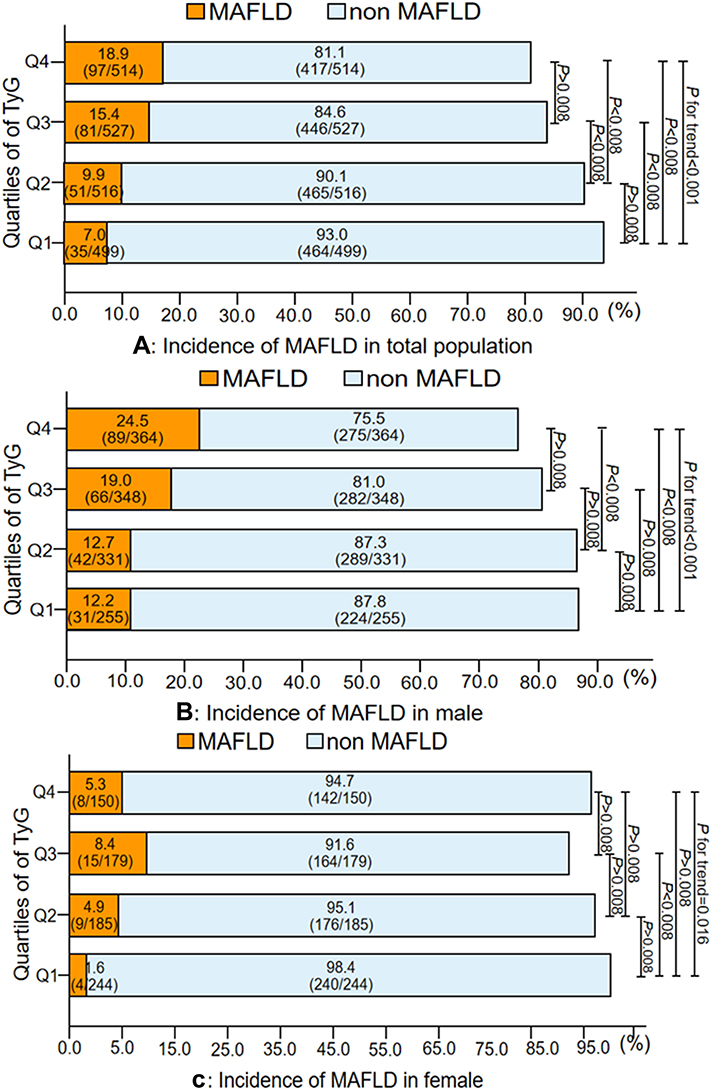 |
Figure 1 Cumulative incidence of MAFLD according to quartiles of TyG at baseline (average follow-up years=2.5±0.5). (A) Incidence of MAFLD in total population. (B) Incidence of MAFLD in male. (C) Incidence of MAFLD in female. The variables were tested by χ2-test for linear trend and multiple comparisons. Bonferroni correction was applied in all multiple comparisons (PBonferroni =0.05/6=0.008). |
In addition, stratified by sex (Figure 1B and C), the incidence of MAFDL increased with the TyG index quartile level in both males (χ2 = 21.21, P for trend <0.001) and females (χ2 = 5.83, P for trend = 0.016). Multiple comparisons showed that the fourth TyG index quartile had a higher incidence of MAFLD than the first and second quartiles in males (all P for Bonferroni correction <0.008), and the incidence of MAFLD was higher in the third quartile than in the first quartile in females (P for Bonferroni correction <0.008).
Univariate Analysis of Predictive Factors for MAFLD
The univariate analysis of potential predictive factors for MAFLD was performed by the Cox hazard regression, and the results are shown in Table 2. When expressed as categorical variables, male, age ≥40 years, BMI ≥23kg/m2, hypertension, GGT >50U/L, ALT >40U/L, LDL-C ≥3.4mmol/L, low HDL-C, TC ≥5.2mmol/L, hypertriglyceridemia, hyperglycemia and hyperuricemia were positively related to the risk of MAFLD (all P<0.05). When expressed as continuous variables, age, BMI, SBP, DBP, GGT, ALT, AST, LDL-C, TC, TG, FPG and SUA were risk factors of MAFLD (all P<0.001), whereas HDL-C was a factor protecting from MAFLD (P<0.001).
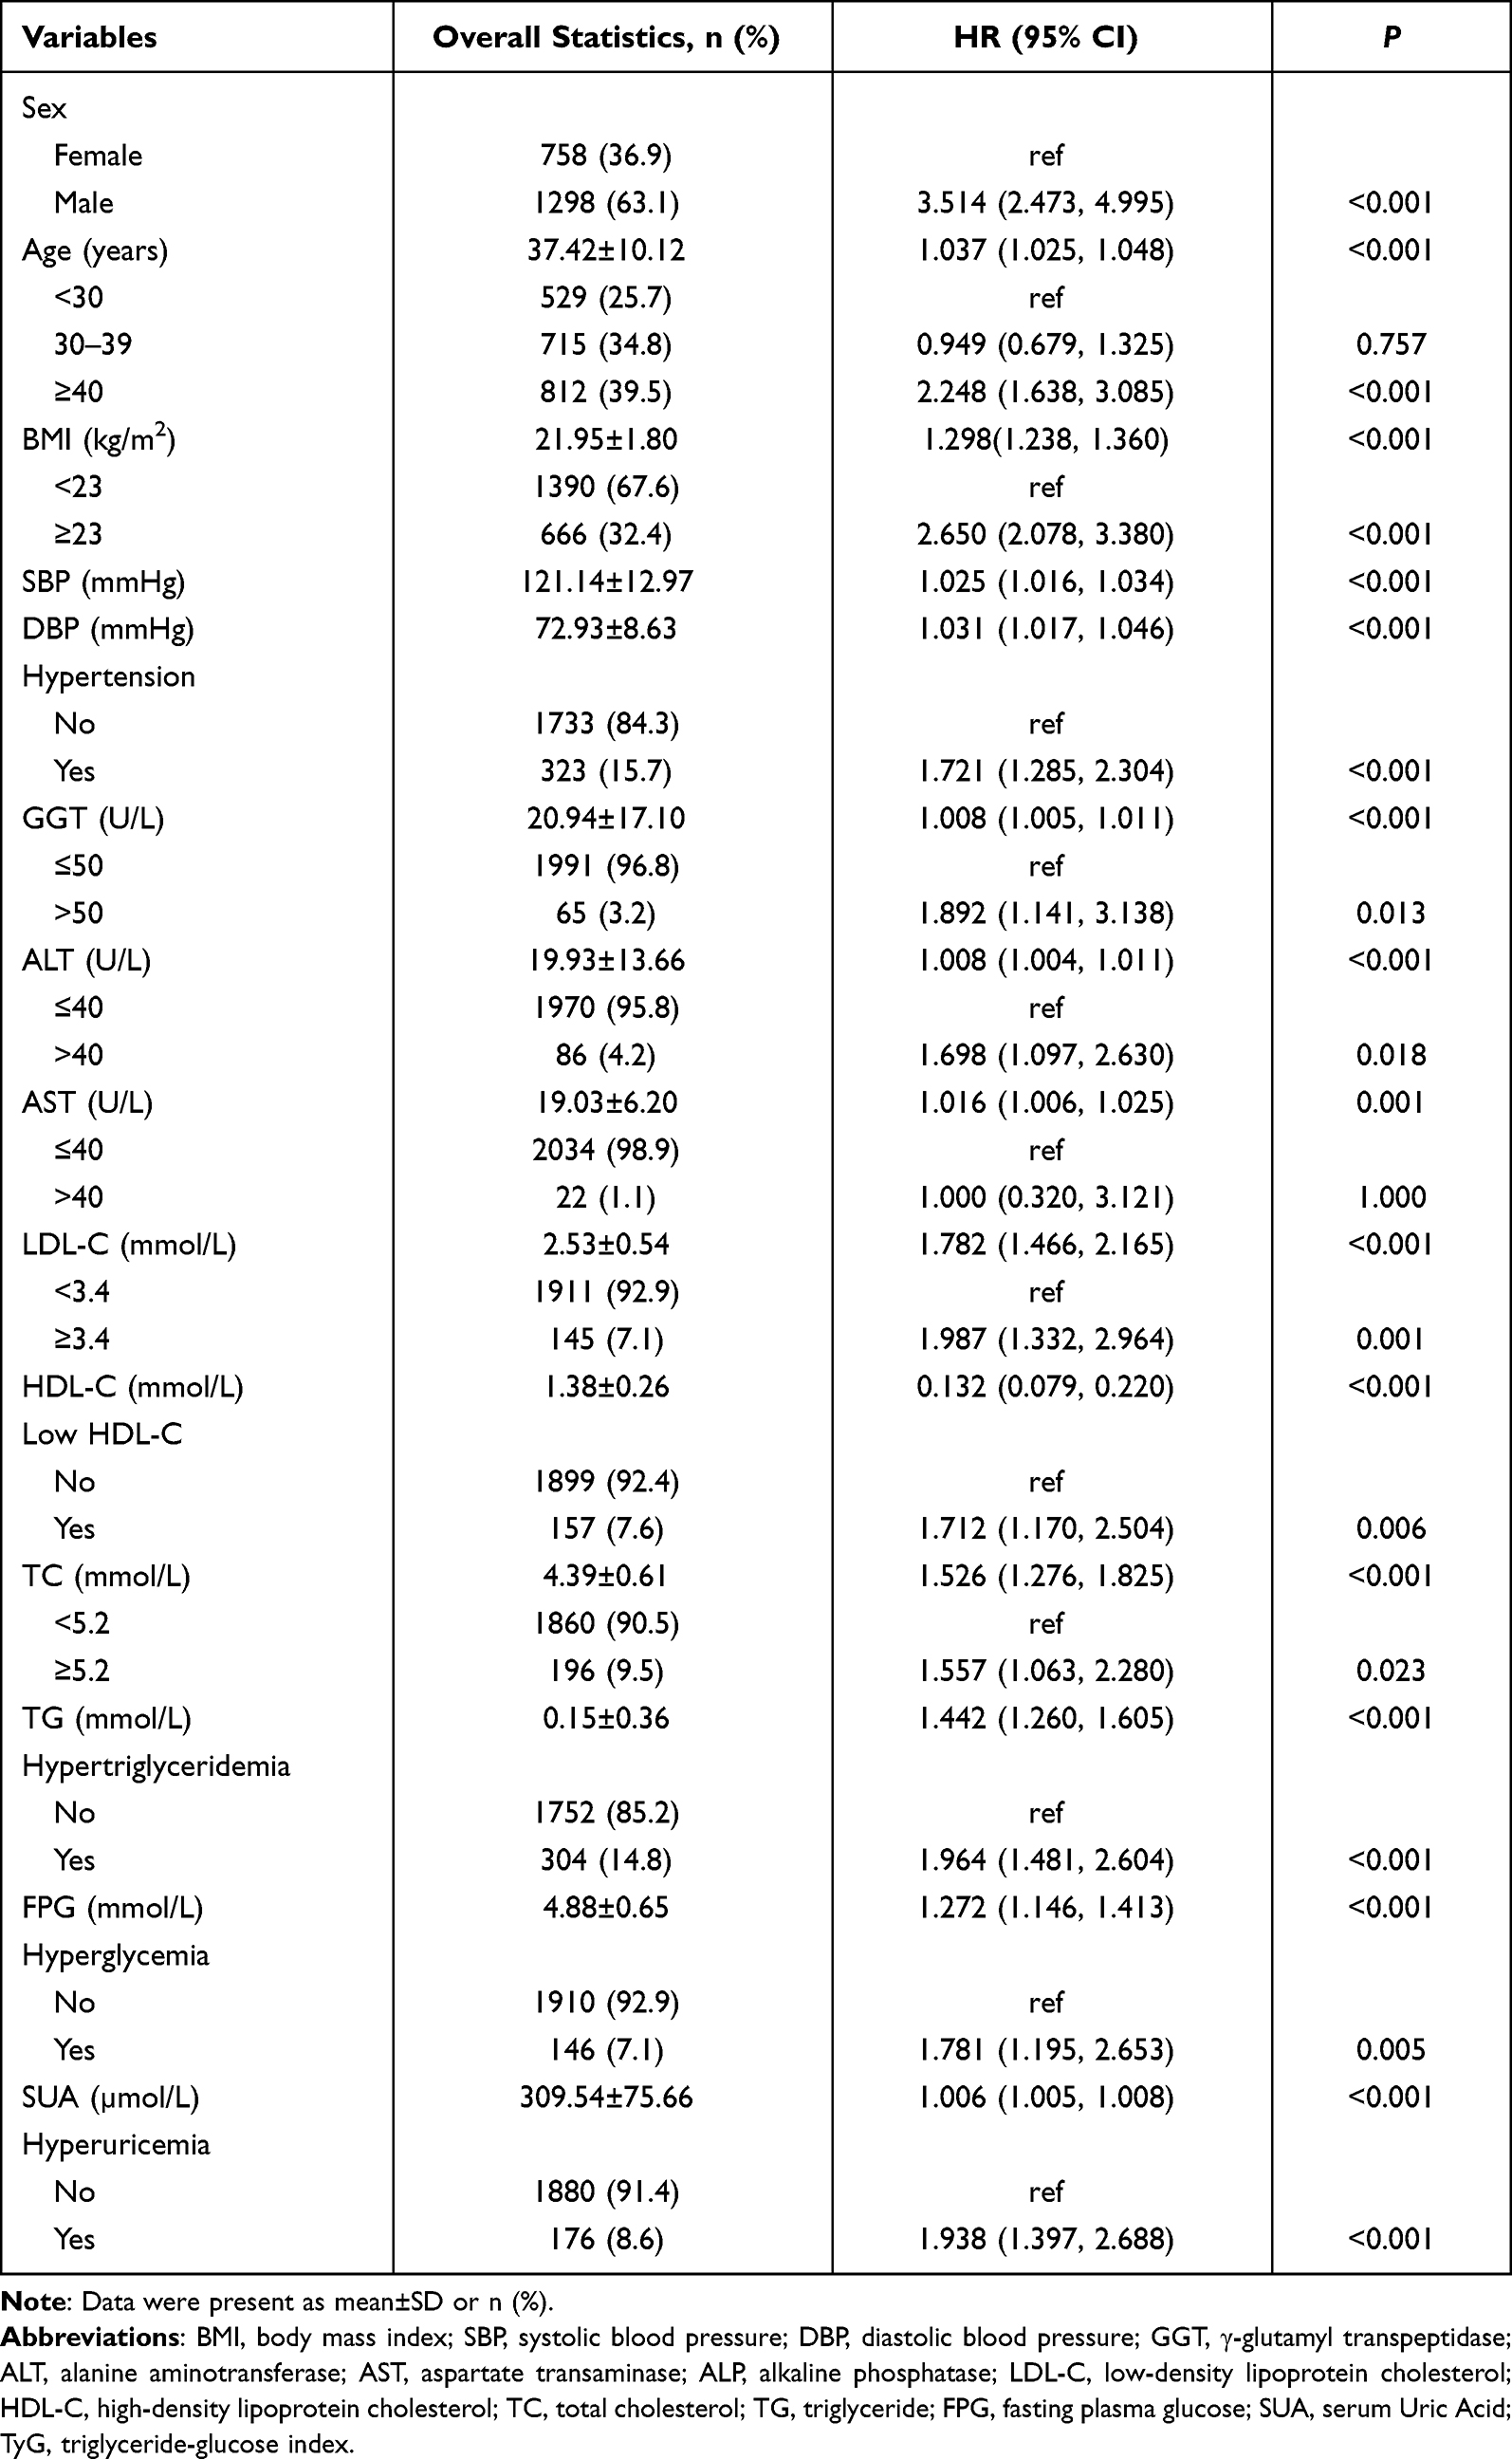 |
Table 2 Univariate Analysis of Potential Predictive Factors for MAFLD |
In Figure 2, the Kaplan–Meier analysis revealed that the cumulative risk of incident MAFLD was markedly different among the TyG index quartiles (Log rank test, P<0.001). Further multiple comparisons showed that the higher quartiles of the TyG index had a higher cumulative risk of incident MAFLD than the lower quartiles, except for data between the fourth and third quartiles (Q4 vs Q3: HR = 1.227, 95% CI = 0.869–1.732).
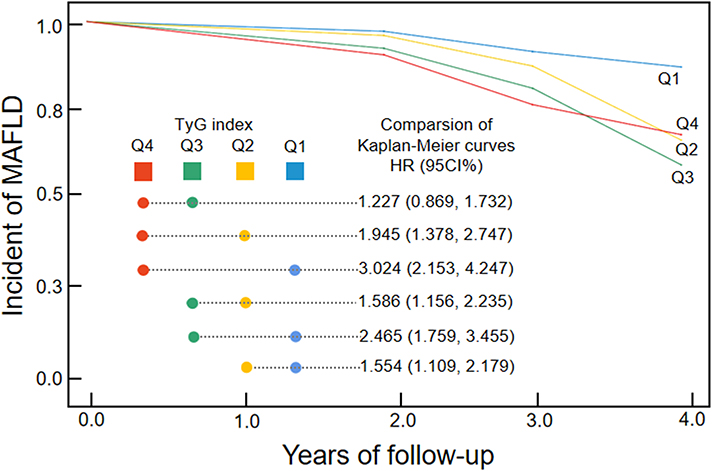 |
Figure 2 Kaplan-Meier analysis of MAFLD risk according to TyG index quartiles (Log rank test P < 0.001). TyG index Q1: <7.93, Q2: ≥7.93 to <8.23, Q3: ≥8.23 to <8.58, Q4: ≥8.58. |
Association Between TyG Index and the Risk of Incident MAFLD
The association between the baseline TyG index and the risk of incident MAFLD is presented in Table 3. After adjusting for sex, age, BMI, hypertension, GGT, ALT, AST, LDL-C, HDL-C, TC and SUA at baseline (model 2), the significant positive associations were observed, and the risk of MAFLD increased by 78.4% (95% CI = 1.383–2.302, P<0.001) with one unit increase of TyG index.
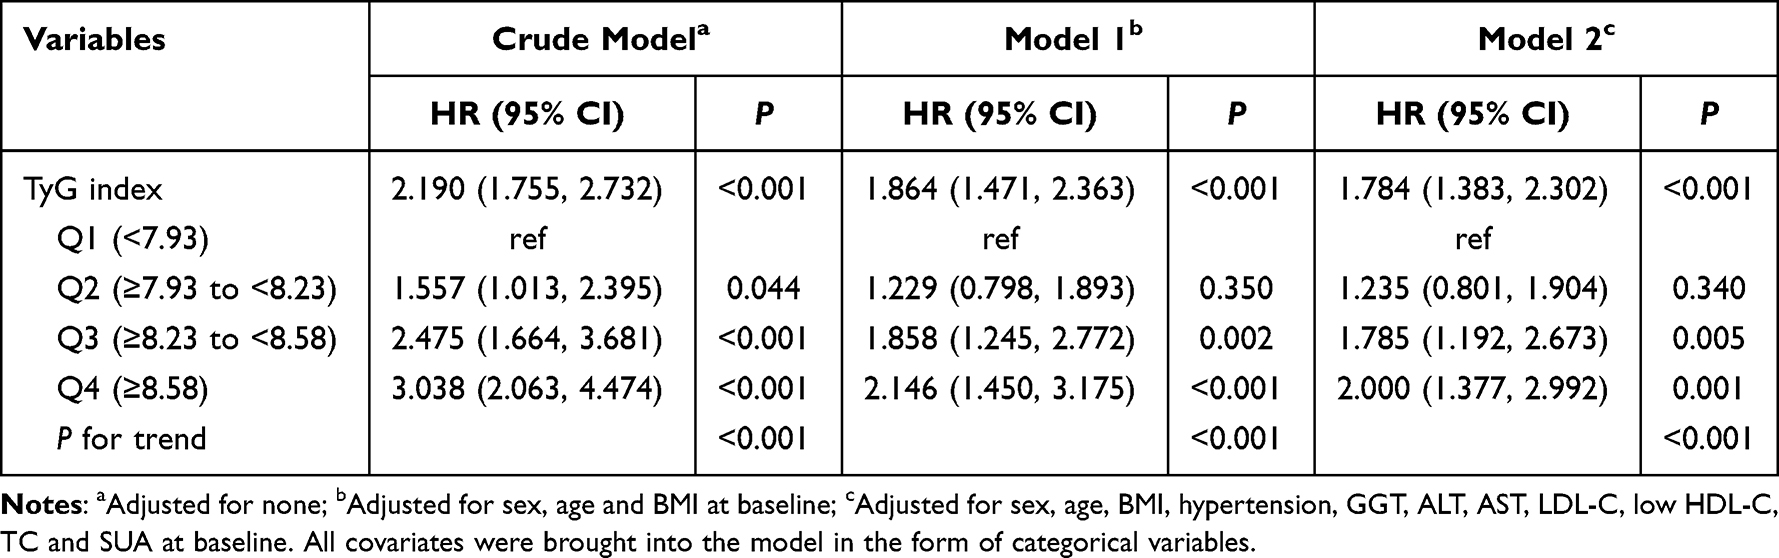 |
Table 3 Association of TyG Index with MAFLD Risk in Cox Proportional Hazard Models |
Taking the lowest quartile of TyG index as a reference, after adjusting for all covariates (model 2), the subjects in the highest (HR = 2.000, 95% CI = 1.377–2.992, P=0.001) and third quartiles (HR = 1.785, 95% CI = 1.192–2.673, P=0.005) all had significantly increased risk of incident MALFD.
In addition, RCS analysis showed that in the crude model, a nonlinear relationship persisted between TyG index and the risk of MAFLD in the total population (P for non-linearity=0.036) (Figure 3A). However, after sex stratification, this nonlinear relationship was only observed in the female stratification (P for non-linearity=0.040) (Figure 3C), whereas only a linear relationship was shown in the male stratification (P for total <0.001; P for non-linearity=0.746) (Figure 3B).
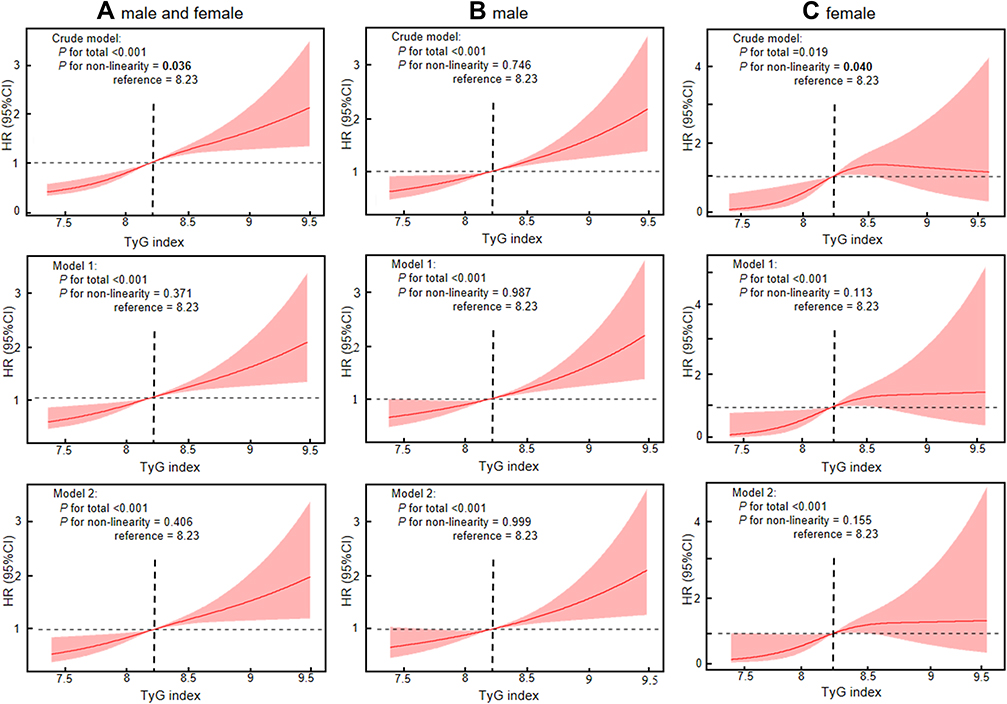 |
Figure 3 A nonlinear relationship of TyG index with risk of MAFLD. (A) male and female (total population). (B) male. (C) female. Data were fitted using a Cox regression model of the restricted cubic spline with 3 knots at 10th, 50th and 90th percentiles of baseline TyG index. The reference point was the 50th percentile of the TyG index (8.23). The solid red line represented point estimation on the association of TyG index with MAFLD, and the shaded portion represented 95% CI estimation. In crude model, adjusted for none. In model 1, adjusted for sex, age and BMI at baseline. In model 2, adjusted for sex, age, BMI, hypertension, GGT, ALT, AST, LDL-C, low HDL-C, TC and SUA at baseline. All covariates were brought into the model in the form of categorical variables. |
We further performed the subgroup analysis according to sex, age, BMI, hypertension, GGT, ALT, AST, LDL-C, HDL-C, TC and SUA at baseline. As shown in Table 4, the associations between TyG index and incident MAFLD risk were still observed in subgroups of males, females, age ≥40 years, BMI <23kg/m2, BMI ≥23 kg/m2, non-hypertension, GGT ≤50U/L, ALT ≤40U/L, LDL-C <3.4mmol/L, non-low HDL-C, low HDL-C, TC <5.2 mmol/L, non-hyperuricemia and hyperuricemia (all P<0.05). The associations between TyG index and MAFLD risk did not differ between subgroups (all P for interaction >0.05), except that a stronger association was found in the subgroup of older age (P for interaction = 0.034).
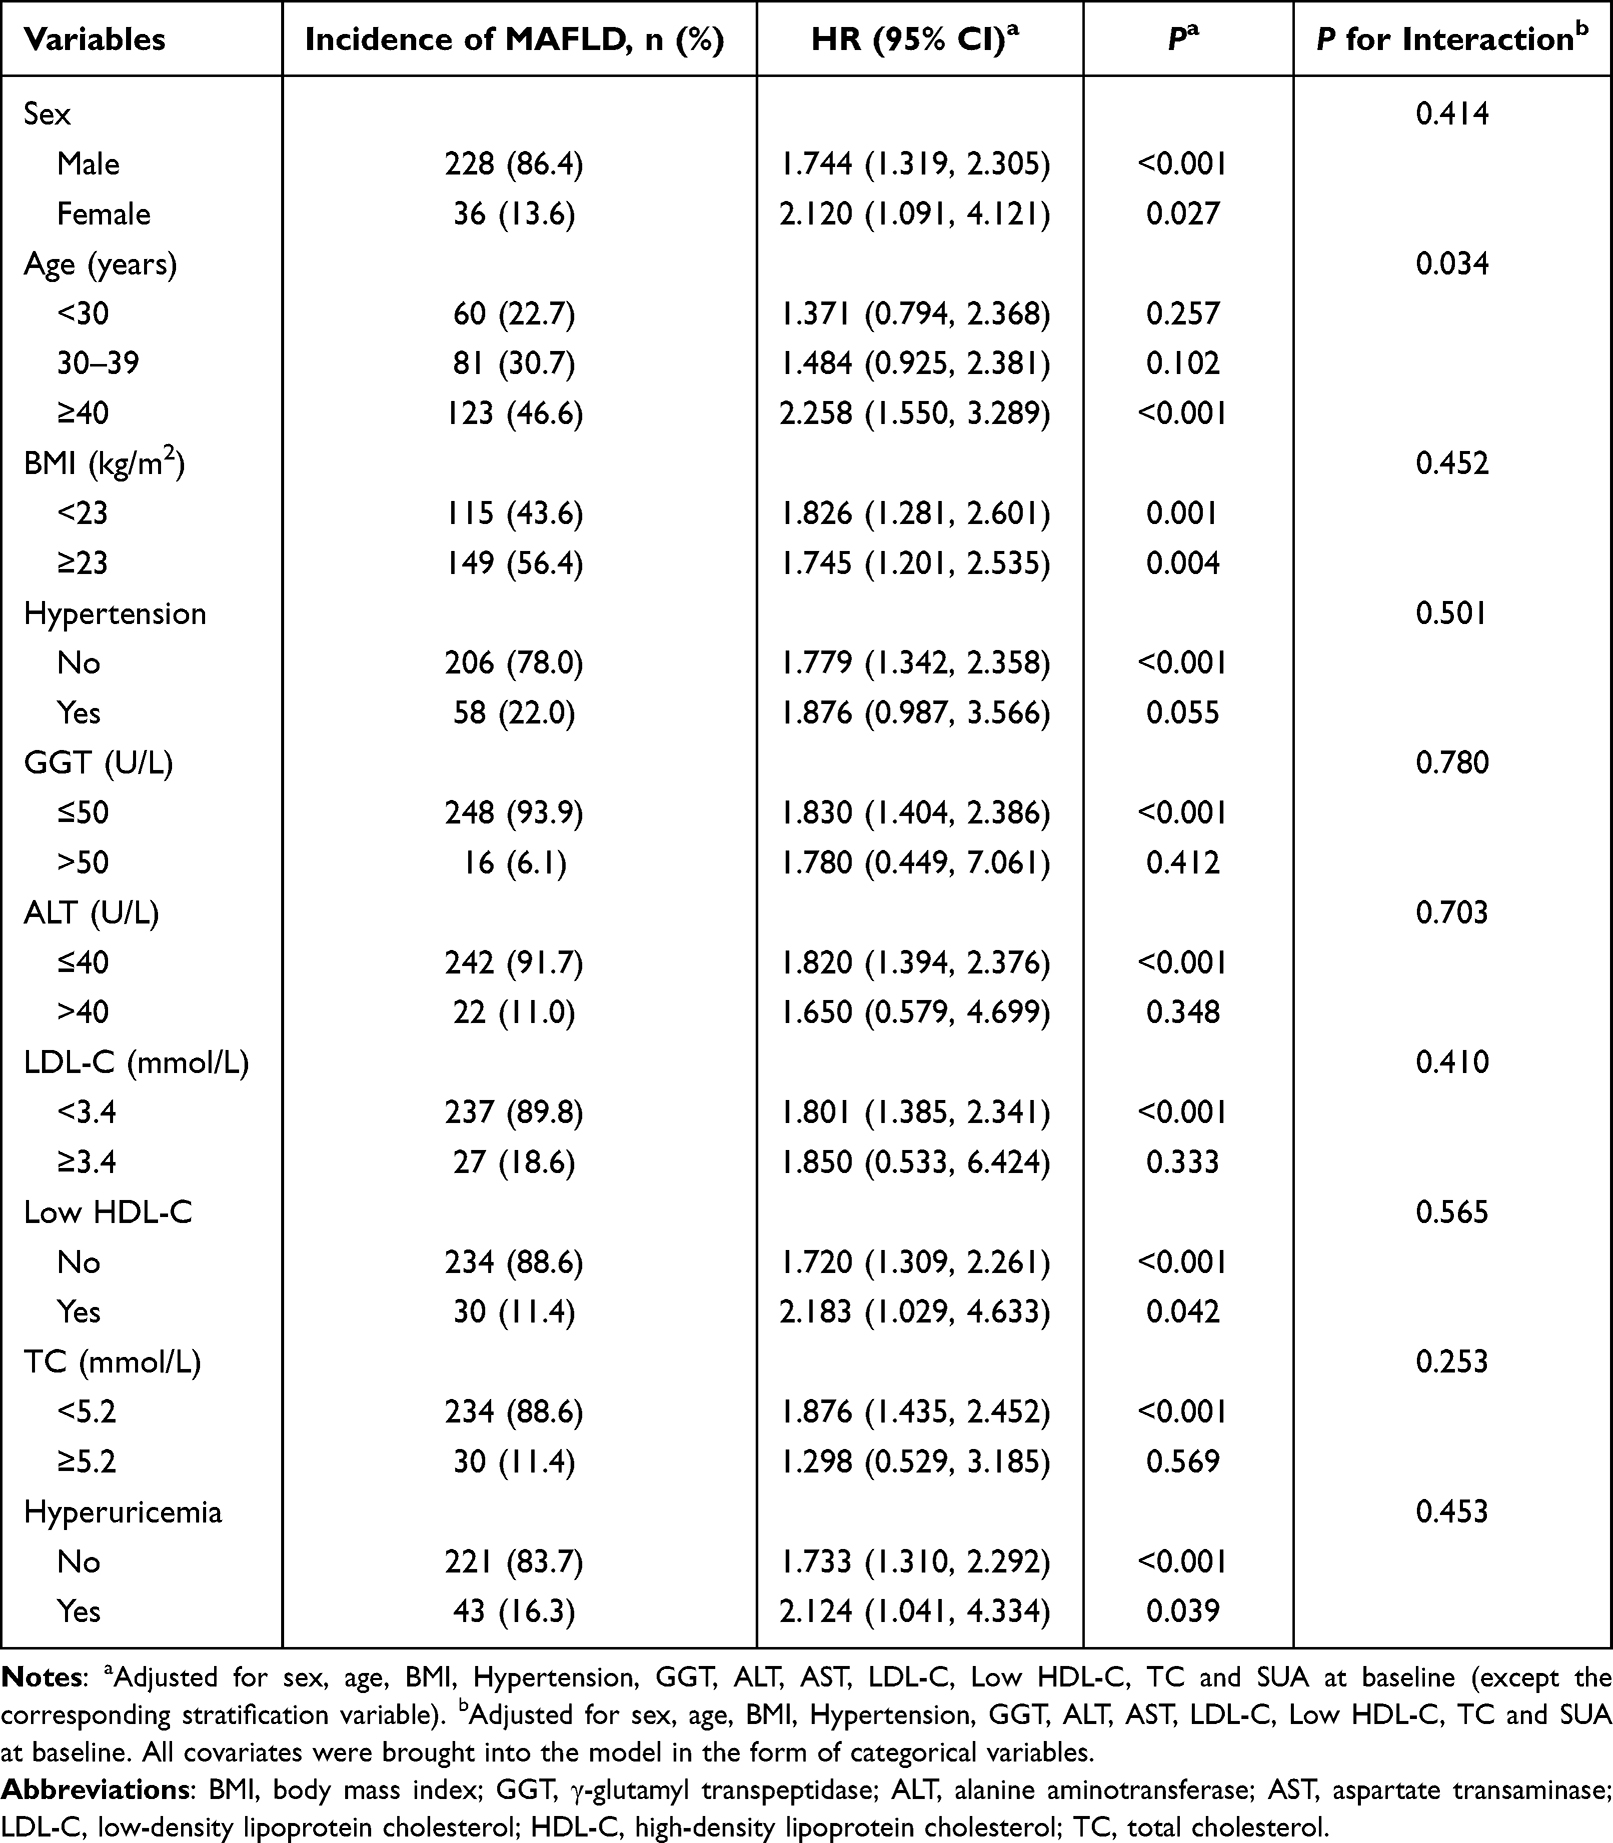 |
Table 4 Subgroup Analysis of Association Between TyG Index and MAFLD Risk |
Diagnostic Performance of TyG Index for MAFLD Risk
The time-dependent ROC curves were used to evaluate the ability of TyG index to predict the 2-, 3-, and 4-year risk of MAFLD. As shown in Figure 4, the areas under ROC curve (AUC) was 0.646 for 2-year, 0.640 for 3-year risk, and 0.638 for 3-year risk. In addition, the optimal cut-off values of AUC for predicting 2-year, 3-year, 4-year MAFLD risk were 8.25, 8.11, 7.97, with sensitivities of 70.9%, 78.8%, 92.7%, specificities of 53.2%, 43.9%, 36.9%, and Youden indexes of 0.242, 0.227, 0.296, respectively.
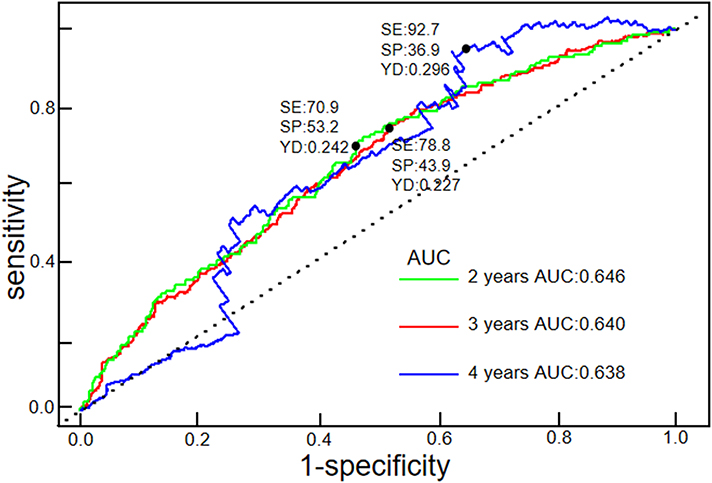 |
Figure 4 Time-dependent ROC of TyG index in predicting 2-, 3-, and 4-year risk of incident MAFLD. Abbreviations: ROC receiver operating characteristic curves, SE sensitivity, SP specificity, YD Youden index, AUC area under curve. |
Discussion
IR has been proven as a key factor of MAFLD pathogenesis.24–26 Thus, IR-related indexes have been trialed in the studies aiming to improve the early identification and prevention of MAFLD. The TyG index derived from FPG and TG has been surrogated to mark IR in many epidemiological studies.10,27 In this prospective cohort study, the subjects without MAFLD at baseline were followed up, and the association between baseline TyG index and MAFLD risk in this cohort was explored. The results showed that 12.8% of the subjects developed MAFLD over an average follow-up of 2.5±0.5 years, and the risk of MAFLD trended to increase with the TyG index quartile.
Recently, a population-based 20-year follow-up study from Olmsted County, Minnesota showed that the incidence of MAFLD increased 5-fold, from 62/100,000 person-years in 1997 to 329/100,000 person-years in 2014.28 Additionally, in a study that followed 565 subjects from Hong Kong for 3–5 years, the incidence of MAFLD was estimated to be 13.5%.29 In another cohort study, 77,425 Koreans free of MAFLD at baseline were followed up for an average of 4.5 years, and 13.4% developed MAFLD.30 Although the follow-up time was shorter in our study, the incidence of MAFLD was similar to that in Hong Kong and Korea, indicating that the incidence of MAFLD was high.31 Additionally, a 9-year follow-up in Chinese employees showed that those with higher baseline TyG levels were more likely to develop MAFLD than those with lower levels, which is consistent with the finding in our study.32 That study also reported that the baseline clinical characteristics, including BMI, SBP, DBP, AST, ALT, HDL-C, LDL-C, TC, TG, FPG and SUA, showed significant differences among quartiles of TyG level, which is also a result in our study. Besides, we further found that except for HDL-C, other indexes, such as BMI, SBP, DBP and metabolic parameters, increased in a higher TyG quartile. The univariate analysis revealed that the risk of incident MAFLD rose with the levels of metabolic parameters and the quartile of TyG index, suggesting that TyG index and MAFLD were closely related to obesity, hypertension, hyperlipidemia and hyperglycemia, which is also in agreement with previous findings.15,20,33
In further analysis, after adjusting for sex, age and metabolic parameters, the risk of incident MAFLD in the highest quartile was twice that in the lowest quartile of TyG index. In a health check-up cohort of Japanese, the hazard rate of progression to MAFLD in the highest tertile of TyG index was approximately twice that in the lowest tertile.34 Another retrospective cohort study in elderly Chinese demonstrated that the risk of incident MAFLD in the highest quartile of TyG index was about 1.3 times that in the lowest quartile, and there was a nonlinear relationship between TyG index and incident MAFLD both in males and females.35 In our study, this nonlinear relationship only appeared in females, whereas in males, the relationship between TyG index and MAFLD risk was linear. That is, when the median TyG of 8.23 was used as the reference point for RSC analysis, a smooth ascending curve was observed in males, while in females, the curve was found to rise smoothly on the left of the reference point, and then declined gently and tended to level after a slight rise on the right of the reference point. This finding was mutually supportive with the results of MAFLD incidence of different sexes at different TyG index quartile in this study. In our study, the incidence of MAFLD in males gradually increased with the increase of TyG index quartile, while the high incidence of MAFLD in females was concentrated at the third quartile of TyG index (≥8.23 to <8.58), followed by the fourth, second and first quartile. This might suggest that the risk of MAFLD in males was consistent with the level of TyG index, while the risk of MAFLD in females tended to be stable after the TyG index reached a certain level.
In subgroup analysis, we found that the association was still significant in all subgroups stratified according to sex, BMI, HDL-C and SUA. However, the significant association was observed in subgroups of non-hypertension, GGT ≤50 U/L, ALT ≤40 U/L, LDL-C <3.4 mmol/l and TC <5.2 mmol/l. A possible explanation was that the follow-up time was relatively short, and all the outcomes were early MAFLD. As a progressive chronic liver disease, early MAFLD is asymptomatic in most cases, with routine laboratory indicators generally normal.2,36,37 Symptoms or abnormal laboratory parameters usually reflect advanced liver diseases or coexisting conditions.38 Thus, it can be considered that TyG index has a sensitivity in predicting early MAFLD, which was also supported by ROC analysis in our study. Therefore, we suggest that whether presenting symptoms or not, MAFLD and extrahepatic morbidities should be suspected once the TyG level is high. Furthermore, the interaction between TyG index and age on MAFLD were statistically significant. An association between TyG index and MAFLD risk was observed in the subgroup ≥40 years. This age-specific association has never been reported. A cohort study revealed an effect of age on the association between TyG index and diabetes risk, and a strong association was found in those aged <40 years, suggesting that subjects aged <40 years should be screened for the risk of incident diabetes.15 Similarly, the TyG index should be evaluated in subjects ≥40 years to prevent MAFLD, as indicated in our study.
The major strength of the study was large sample and the prospective nature, which provided significant epidemiological evidence for the relationship between TyG index and incident MAFLD in Chinese population. Public health worker can screen for MAFLD early by monitoring TyG index. However, there are several limitations in this study. First, we executed abdominal ultrasound, instead of liver biopsy, to diagnose MAFLD. Abdominal ultrasound could not detect fatty infiltration <10–20%,39 which might lead to underestimate the true relationship between TyG index and incident MAFLD. However, it is unrealistic to use liver biopsy in general population screening. Currently, abdominal ultrasound is less expensive than other advanced imaging methods, and the most feasible method for first-line screening of steatosis.40,41 Semi-quantitative ultrasonography and sonoelastography might be more reliable for screening and evaluating MAFLD in future study.42 Second, we did not collect data on confounders, including diet, exercise and history of lipid-lowering therapy, antidiabetic drugs or hypotensor. Also, we could not evaluate the correlation between TyG index and different MAFLD severity. Lastly, the generalizability of our study in non-Chinese population is unclear. Larger-size and multi-center studies should be performed in future.
Conclusion
In summary, the results of this study show that a high level of TyG index is independently associated with a high risk of incident MAFLD, and the findings support the wide use of the TyG index for screening and subsequent management of patients with MAFLD.
Data Sharing Statement
The data that support the findings of this study are available from the corresponding author upon reasonable request.
Statement of Ethics
This study was approved by the Ethics Committee of Nanjing Medical University (NO. (2019) 740). Written informed consent was obtained from all participants.
Acknowledgments
Thank you Mr. Yongke Cao for providing article polishing support.
Author Contributions
All authors made a significant contribution to the work reported, whether that is in the conception, study design, execution, acquisition of data, analysis and interpretation, or in all these areas; took part in drafting, revising or critically reviewing the article; gave final approval of the version to be published; have agreed on the journal to which the article has been submitted; and agree to be accountable for all aspects of the work.
Funding
This study was supported by the Six Talent Peaks Project in Jiangsu Province, China (2019, WSN-049), Natural Science Foundation of Jiangsu Province, China (BK20181369), Priority Academic Program Development of Jiangsu Higher Education Institutions (Nursing Science, 2018, No.87), Research and Innovation Team Project of School of Nursing, Nanjing Medical University, Graduate research and innovation projects in Jiangsu Province, China (KYCX21_1553), Jiangsu Province “333 High-level Personnel Training Programme” Project, and Joint Project of Health Commission of Shanghai Pudong District (PW2019D-11).
Disclosure
The authors report no conflicts of interest in this work.
References
1. Segura-Azuara NLA, Varela-Chinchilla CD, Trinidad-Calderon PA. MAFLD/NAFLD biopsy-free scoring systems for hepatic steatosis, NASH, and fibrosis diagnosis. Front Med. 2021;8:774079. doi:10.3389/fmed.2021.774079
2. Zhang R, Wang M, Wang M, et al. Vitamin D level and vitamin D receptor genetic variation were involved in the risk of non-alcoholic fatty liver disease: a case-control study. Front Endocrinol. 2021;12:648844. doi:10.3389/fendo.2021.648844
3. Powell EE, Wong VW, Rinella M. Non-alcoholic fatty liver disease. Lancet. 2021;397(10290):2212–2224. doi:10.1016/S0140-6736(20)32511-3
4. Li J, Zou B, Yeo YH, et al. Prevalence, incidence, and outcome of non-alcoholic fatty liver disease in Asia, 1999–2019: a systematic review and meta-analysis. Lancet Gastroenterol Hepatol. 2019;4(5):389–398.
5. Zhou J, Zhou F, Wang W, et al. Epidemiological features of NAFLD from 1999 to 2018 in China. Hepatology. 2020;71(5):1851–1864.
6. Fernando DH, Forbes JM, Angus PW, Herath CB. Development and progression of non-alcoholic fatty liver disease: the role of advanced glycation end products. Int J Mol Sci. 2019;20(20):100.
7. Wang M, Zhou BG, Zhang Y, et al. Association between non-alcoholic fatty liver disease and risk of stroke: a systematic review and meta-analysis. Front Cardiovasc Med. 2022;9:812030.
8. Eslam M, Sanyal AJ, George J, et al. MAFLD: a consensus-driven proposed nomenclature for metabolic associated fatty liver disease. Gastroenterology. 2020;158(7):1999–2014 e1991.
9. Mao Q, Zhou D, Li Y, Wang Y, Xu SC, Zhao XH. The triglyceride-glucose index predicts coronary artery disease severity and cardiovascular outcomes in patients with non-ST-segment elevation acute coronary syndrome. Dis Markers. 2019;2019:6891537.
10. Lee SB, Kim MK, Kang S, et al. Triglyceride glucose index is superior to the homeostasis model assessment of insulin resistance for predicting nonalcoholic fatty liver disease in Korean adults. Endocrinol Metab. 2019;34(2):179–186. doi:10.3803/EnM.2019.34.2.179
11. Guo W, Lu J, Qin P, et al. The triglyceride-glucose index is associated with the severity of hepatic steatosis and the presence of liver fibrosis in non-alcoholic fatty liver disease: a cross-sectional study in Chinese adults. Lipids Health Dis. 2020;19(1):218. doi:10.1186/s12944-020-01393-6
12. Du T, Yuan G, Zhang M, Zhou X, Sun X, Yu X. Clinical usefulness of lipid ratios, visceral adiposity indicators, and the triglycerides and glucose index as risk markers of insulin resistance. Cardiovasc Diabetol. 2014;13:146. doi:10.1186/s12933-014-0146-3
13. Mohd Nor NS, Lee S, Bacha F, Tfayli H, Arslanian S. Triglyceride glucose index as a surrogate measure of insulin sensitivity in obese adolescents with normoglycemia, prediabetes, and type 2 diabetes mellitus: comparison with the hyperinsulinemic-euglycemic clamp. Pediatr Diabetes. 2016;17(6):458–465. doi:10.1111/pedi.12303
14. Hong S, Han K, Park CY. The triglyceride glucose index is a simple and low-cost marker associated with atherosclerotic cardiovascular disease: a population-based study. BMC Med. 2020;18(1):361. doi:10.1186/s12916-020-01824-2
15. Li X, Li G, Cheng T, Liu J, Song G, Ma H. Association between triglyceride-glucose index and risk of incident diabetes: a secondary analysis based on a Chinese cohort study: TyG index and incident diabetes. Lipids Health Dis. 2020;19(1):236. doi:10.1186/s12944-020-01403-7
16. Low S, Khoo KCJ, Irwan B, et al. The role of triglyceride glucose index in development of type 2 diabetes mellitus. Diabetes Res Clin Pract. 2018;143:43–49. doi:10.1016/j.diabres.2018.06.006
17. Khamseh ME, Malek M, Abbasi R, Taheri H, Lahouti M, Alaei-Shahmiri F. Triglyceride glucose index and related parameters (triglyceride glucose-body mass index and triglyceride glucose-waist circumference) identify nonalcoholic fatty liver and liver fibrosis in individuals with overweight/obesity. Metab Syndr Relat Disord. 2021;19(3):167–173. doi:10.1089/met.2020.0109
18. Wang J, Su Z, Feng Y, Xi R, Liu J, Wang P. Comparison of several blood lipid-related indexes in the screening of non-alcoholic fatty liver disease in women: a cross-sectional study in the Pearl River Delta region of southern China. BMC Gastroenterol. 2021;21(1):482. doi:10.1186/s12876-021-02072-1
19. Eslam M, Newsome PN, Sarin SK, et al. A new definition for metabolic dysfunction-associated fatty liver disease: an international expert consensus statement. J Hepatol. 2020;73(1):202–209. doi:10.1016/j.jhep.2020.03.039
20. Joint Committee for Guideline R. 2018 Chinese guidelines for prevention and treatment of hypertension-a report of the revision committee of Chinese guidelines for prevention and treatment of hypertension. J Geriatr Cardiol. 2019;16(3):182–241. doi:10.11909/j.issn.1671-5411.2019.03.014
21. Wu S, Xu L, Wu M, Chen S, Wang Y, Tian Y. Association between triglyceride-glucose index and risk of arterial stiffness: a cohort study. Cardiovasc Diabetol. 2021;20(1):146. doi:10.1186/s12933-021-01342-2
22. Huang YF, Yang KH, Chen SH, et al. [Practice guideline for patients with hyperuricemia/gout]. Zhonghua Nei Ke Za Zhi. 2020;59(7):519–527. Chinese. doi:10.3760/cma.j.cn112138-20200505-00449
23. Adults I. Joint Committee issued Chinese guideline for the management of dyslipidemia in adults. [2016 Chinese guideline for the management of dyslipidemia in adults]. Zhonghua Xin Xue Guan Bing Za Zhi. 2016;44(10):833–853.
24. Noureddin M, Sanyal AJ. Pathogenesis of NASH: the impact of multiple pathways. Curr Hepatol Rep. 2018;17(4):350–360. doi:10.1007/s11901-018-0425-7
25. Armandi A, Rosso C, Caviglia GP, Bugianesi E. Insulin resistance across the spectrum of nonalcoholic fatty liver disease. Metabolites. 2021;11(3):155. doi:10.3390/metabo11030155
26. Jiang M, Wu N, Chen X, et al. Pathogenesis of and major animal models used for nonalcoholic fatty liver disease. J Int Med Res. 2019;47(4):1453–1466. doi:10.1177/0300060519833527
27. Liu J, Guan L, Zhao M, et al. Association between the triglyceride-glucose index and outcomes of nonalcoholic fatty liver disease: a large-scale health management cohort study. Diabetes Metab Syndr Obes. 2021;14:2829–2839. doi:10.2147/DMSO.S316864
28. Allen AM, Therneau TM, Larson JJ, Coward A, Somers VK, Kamath PS. Nonalcoholic fatty liver disease incidence and impact on metabolic burden and death: a 20 year-community study. Hepatology. 2018;67(5):1726–1736. doi:10.1002/hep.29546
29. Wong VW, Wong GL, Yeung DK, et al. Incidence of non-alcoholic fatty liver disease in Hong Kong: a population study with paired proton-magnetic resonance spectroscopy. J Hepatol. 2015;62(1):182–189. doi:10.1016/j.jhep.2014.08.041
30. Chang Y, Jung HS, Cho J, et al. Metabolically healthy obesity and the development of nonalcoholic fatty liver disease. Am J Gastroenterol. 2016;111(8):1133–1140. doi:10.1038/ajg.2016.178
31. Cotter TG, Rinella M. Nonalcoholic fatty liver disease 2020: the state of the disease. Gastroenterology. 2020;158(7):1851–1864. doi:10.1053/j.gastro.2020.01.052
32. Zheng R, Du Z, Wang M, Mao Y, Mao W. A longitudinal epidemiological study on the triglyceride and glucose index and the incident nonalcoholic fatty liver disease. Lipids Health Dis. 2018;17(1):262.
33. Lim GEH, Tang A, Ng CH, et al. An observational data meta-analysis on the differences in prevalence and risk factors between MAFLD vs NAFLD. Clin Gastroenterol Hepatol. 2021. doi:10.1016/j.cgh.2021.11.038
34. Kitae A, Hashimoto Y, Hamaguchi M, Obora A, Kojima T, Fukui M. The triglyceride and glucose index is a predictor of incident nonalcoholic fatty liver disease: a population-based cohort study. Can J Gastroenterol Hepatol. 2019;2019:5121574.
35. Huanan C, Sangsang L, Amoah AN, et al. Relationship between triglyceride glucose index and the incidence of non-alcoholic fatty liver disease in the elderly: a retrospective cohort study in China. BMJ Open. 2020;10(11):e039804.
36. Wang XJ, Malhi H. Nonalcoholic fatty liver disease. Ann Intern Med. 2018;169(9):ITC65–ITC80.
37. Sweet PH, Khoo T, Nguyen S. Nonalcoholic fatty liver disease. Prim Care. 2017;44(4):599–607.
38. Torres DM, Williams CD, Harrison SA. Features, diagnosis, and treatment of nonalcoholic fatty liver disease. Clin Gastroenterol Hepatol. 2012;10(8):837–858.
39. Ballestri S, Nascimbeni F, Baldelli E, et al. Ultrasonographic fatty liver indicator detects mild steatosis and correlates with metabolic/histological parameters in various liver diseases. Metabolism. 2017;72:57–65.
40. Hernaez R, Lazo M, Bonekamp S, et al. Diagnostic accuracy and reliability of ultrasonography for the detection of fatty liver: a meta-analysis. Hepatology. 2011;54(3):1082–1090.
41. Yu Y, Cai J, She Z, Li H. Insights into the epidemiology, pathogenesis, and therapeutics of nonalcoholic fatty liver diseases. Adv Sci. 2019;6(4):1801585.
42. Ballestri S, Romagnoli D, Nascimbeni F, Francica G, Lonardo A. Role of ultrasound in the diagnosis and treatment of nonalcoholic fatty liver disease and its complications. Expert Rev Gastroenterol Hepatol. 2015;9(5):603–627.
 © 2022 The Author(s). This work is published and licensed by Dove Medical Press Limited. The full terms of this license are available at https://www.dovepress.com/terms.php and incorporate the Creative Commons Attribution - Non Commercial (unported, v3.0) License.
By accessing the work you hereby accept the Terms. Non-commercial uses of the work are permitted without any further permission from Dove Medical Press Limited, provided the work is properly attributed. For permission for commercial use of this work, please see paragraphs 4.2 and 5 of our Terms.
© 2022 The Author(s). This work is published and licensed by Dove Medical Press Limited. The full terms of this license are available at https://www.dovepress.com/terms.php and incorporate the Creative Commons Attribution - Non Commercial (unported, v3.0) License.
By accessing the work you hereby accept the Terms. Non-commercial uses of the work are permitted without any further permission from Dove Medical Press Limited, provided the work is properly attributed. For permission for commercial use of this work, please see paragraphs 4.2 and 5 of our Terms.