Back to Journals » International Journal of General Medicine » Volume 18
Association Between Time in Range and Diabetic Retinopathy in Type 2 Diabetes Mellitus Patients with Hypoglycemia Unawareness: A Single‐center Retrospective Study
Authors Xu C, Dai W, Liu Y ![]() , Zhang R, Shi E, Shan X, Cao Y
, Zhang R, Shi E, Shan X, Cao Y ![]()
Received 12 November 2024
Accepted for publication 8 April 2025
Published 7 June 2025 Volume 2025:18 Pages 2911—2921
DOI https://doi.org/10.2147/IJGM.S498567
Checked for plagiarism Yes
Review by Single anonymous peer review
Peer reviewer comments 4
Editor who approved publication: Dr Jacopo Manso
Chi Xu,1,2 Wu Dai,1 Yan Liu,1 Rong Zhang,1 Erlan Shi,1 Xiangxiang Shan,1 Yonghong Cao1,2
1Department of Endocrinology, Hefei Hospital Affiliated to Anhui Medical University (Hefei Second People’s Hospital), Hefei, 230011, People’s Republic of China; 2The Fifth Clinical Medical College, Anhui Medical University, Hefei, 230032, People’s Republic of China
Correspondence: Yonghong Cao, Department of Endocrinology, Hefei Hospital Affiliated to Anhui Medical University (Hefei Second People’s Hospital), Hefei, 230011, People’s Republic of China, Email [email protected]
Aim: Our study aimed to investigate the association between time in range (TIR) and diabetic retinopathy (DR) in type 2 diabetes mellitus (T2DM) patients with hypoglycemia unawareness.
Methods: This is a retrospective cross-sectional study. In our study, 298 T2DM patients with hypoglycemia unawareness were recruited from the Department of Endocrinology, Hefei Second People’s Hospital from 01/09/2020 to 30/06/2023. Patients were divided into DR group (97 cases) and non-DR group (NDR, 201 cases). We compared the clinical data and blood glucose fluctuation indexes of the two groups. Meanwhile, we also observed these indicators, especially the prevalence of DR and the time below range (TBR) in groups with different TIR levels (Q1 group: TIR≤ 70%, 79 cases; Q2 group: 70%
Results: TIR of DR group was significantly lower than that of NDR group (P< 0.05). And TIR was an independent protective factor for DR after correcting confounding factors in logistic regression analysis (OR=0.937, P=0.032). ROC curve showed that the AUC of TIR for DR diagnosis prediction was 0.756. The comparison among TIR groups showed that the prevalence of DR in Q1 group was higher than that in Q2 to Q4 group; and the TBR in Q3 group was higher than that in other TIR groups (P< 0.05). Spearman analysis showed that TBR was negatively correlated with MG (r=− 0.221, P< 0.001). Only Q1 group (TIR≤ 70%) was a risk factor for DR in logistic regression with Q3 group as the reference group.
Conclusion: Lower TIR is associated with an increased risk of DR in T2DM patients with hypoglycemia unawareness. After weighing the risk of DR and TBR, TIR at 70– 85% is the satisfactory range for T2DM patients with hypoglycemia unawareness.
Keywords: T2DM, hypoglycemia unawareness, time in range, time below range, diabetic retinopathy
Introduction
According to the statistics, in China, the number of patients with diabetes exceeds 140 million, with the largest number of patients with diabetes all over the world.1 Diabetes retinopathy (DR) is one of the major microvascular complications of diabetes, which can lead to serious permanent visual impairment.2 Global prevalence was 22.27% for DR in individuals with diabetes, and the global DR burden is expected to remain high through 2045.3 Good glycemic control can help slow down the occurrence and progression of DR. However, patients with T2DM sometimes suffer from hypoglycemia (blood glucose ≤3.9 mmol/L) during active treatment, and some of them do not have obvious symptoms of hypoglycemia, which is referred to as hypoglycemia unawareness or asymptomatic hypoglycemia. Hypoglycemia is an adverse event in patients, and even life-threatening in severe cases.4 A recent meta-analysis has reported that the prevalence of impaired awareness of hypoglycemia in T2DM is 22%.5 Therefore, hypoglycemia unawareness should attract our attention because of its concealment.
Hemoglobin A1C (HbA1C) has been clinically considered as the gold standard for glycemic control, and self-monitoring of blood glucose (SMBG) has been recommended as a useful tool to verify daily glucose variability.6 However, HbA1C has limitations such as diverse HbA1c testing standards and poor reflection of glycemic fluctuations, while SMBG cannot detect fluctuations that may occur between each capillary glucose test unless the tests are performed consecutively within a short period of time.6,7 Continuous glucose monitoring (CGM) tracks real-time glucose levels and is considered as a tool for early detection of abnormal glucose, helping patients make more informed decisions on their diet and physical activity.8 With the wide application of continuous glucose monitoring (CGM), time in range (TIR), one of the key indicators, has been confirmed to be associated with many complications of diabetes in related studies on patients with T2DM and it was validated as an outcome measure for complementing extra information which could not be captured by HbA1c.6,7,9–11 The inclusion of another important derivative indicator, time below range (TBR), makes hypoglycemia unawareness easier to be discovered by clinicians compared with traditional blood glucose monitoring methods,12 and can help us to be more comprehensive understanding of patients’ hypoglycemia information. The guidelines of American Diabetes Association (ADA)13 recommend that hypoglycemia unawareness should trigger hypoglycemic avoidance education to reduce hypoglycemia. Therefore, our study intends to investigate the association among TIR, TBR and DR in T2DM patients with hypoglycemia unawareness, so as to provide clinical evidence for individual glycemic control targets.
Methods
Participants
This was a retrospective cross-sectional study. In our study, T2DM patients with hypoglycemia unawareness during CGM were recruited from the Department of Endocrinology, Hefei Second People’s Hospital from 01/09/2020 to 30/06/2023. The data of the patients were extracted from the hospital’s patient management system. Inclusion criteria included (1) patients with blood glucose ≤ 3.9 mmol/L during CGM, but without symptoms of hypoglycemia; (2) a stable hypoglycemic regimen over the previous three months. Exclusion criteria included (1) patients with acute complications of diabetes; (2) patients with subclinical hypothyroidism; (3) patients with mental or physical disabilities who were unable to cooperate; (4) patients who could not complete fundus photography. The patient selection process is shown in Figure 1. A total of 298 T2DM patients (170 male and 128 female) with hypoglycemia unawareness were included. The age of the patients ranged from 20 to 94 (57.87 ± 11.88).
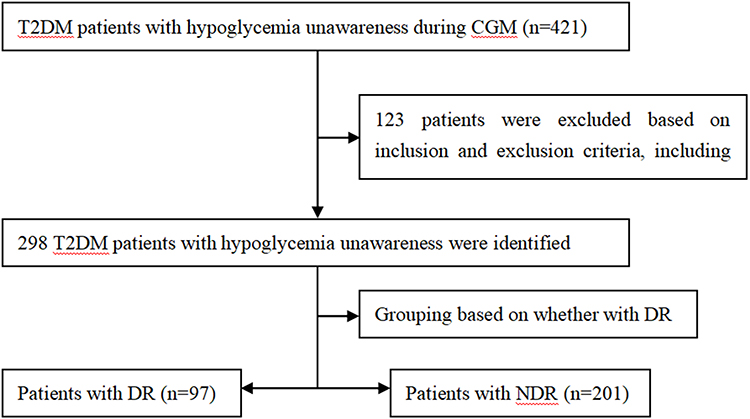 |
Figure 1 Patient selection process. |
Sample Size
We use the PASS15.0 software for sample size estimation. According to relevant literature and preliminary experimental results, the ROC curve shows that the AUC of TIR for DR diagnosis prediction is 0.798. This study assumes that β ≤ 0.1, confidence level (1- β)=90%, test level α=0.05, using a 1:2 ratio, the DR occurrence group is 80 people, and the control group is 160 people. Considering a dropout rate of 20%, the minimum sample size should be 97 people in the DR occurrence group and 194 people in the non-DR group.
Grouping
According to fundus photography, participants were divided into DR group (DR, 97 cases) and non-DR group (NDR, 201 cases). Meanwhile, they were divided into four nearly equal groups by TIR pointcut, which were divided into Q1 group (TIR≤70%, 79 cases), Q2 group (70%<TIR≤85%, 72 cases), Q3 group (85%<TIR≤95%, 73 cases) and Q4 group (TIR>95%, 74 cases).
Ethical Approval
All procedures performed in the study involving human participants were in accordance with the ethical standards of the institutional and/or national research committee(s) and the Helsinki Declaration (as revised in 2013). The requirement for informed consent was waived by the ethics committee of Hefei Hospital Affiliated to Anhui Medical University because of the observational and retrospective nature of the study. Our study was approved by the ethics Committee of Hefei Hospital Affiliated to Anhui Medical University (No. 2019 Scientific Research 084). All data were stored securely, and confidentiality was maintained throughout the study.
Clinical Information
The information including age, sex, duration of diabetes, smoking history, hypertension and use of lipid-lowering drugs and insulin (INS)/INS secretagogues were recorded by clinicians. All clinicians were trained to ensure the standardization of data collection. Blood pressure including SBP and DBP was measured. Height and structure were also measured and BMI was calculated. After fasting for 10 hours, fasting plasma glucose (FPG), fasting C-peptide (FC-P), hemoglobin A1C (HbA1C), triglyceride (TG), total cholesterol (TC), low-density lipoprotein-cholesterol (LDL-C), high-density lipoprotein-cholesterol (HDL-C), serum uric acid (SUA), serum creatinine (Scr) and urinary albumin creatinine ratio (UACR) were detected in the next morning. For diagnosis of DR, fundus photographs were taken by professional ophthalmologists and then reviewed by both the ophthalmologists and endocrinologists. DR was diagnosed when microaneurysm formation, intraretinal hemorrhage, hard exudates, cotton-wool spots, retinal microvascular abnormalities, venous beading, retinal neovascularization, vitreous hemorrhage, and fibroplasia were observed.
CGM Parameters
During the 72-hour study period, patients were required to wear the CGM system (Meiqi) to monitor blood glucose. And the CGM system was corrected by capillary blood glucose measured four times a day. TIR referred to the percentage of blood glucose within the target of 3.9–10.0 mmol/L. And glucose fluctuation indexes including standard deviation (SD), mean amplitude of glycemic excursions (MAGE), mean blood glucose level (MG), TIR, TBR, largest amplitude of glycemic excursions (LAGE) and glucose coefficient of variation (CV) were recorded. The patients kept their diet, exercise routines and hypoglycemic regimen as usual during the study period.
Statistical Analysis
Differences in clinical, biochemical measurements and CGM parameters were examined by Student’s t-tests and ANOVA (for normal distributions) or the Mann–Whitney U and Kruskal–Wallis H-test (for non-normal distributions). Categorical variables were analyzed using χ2 test. Spearman analysis was used to analyze the relationship between TBR and other indicators. In order to determine the factors associated with DR, logistic regression analysis was performed. And ROC curve was drawn to analyze the value of diagnosis prediction of TIR for DR in T2DM patients with hypoglycemia unawareness. SPSS 25.0 software was used for all of the above. A p-value of less than 0.05 was considered statistically significant. All reported p-values were two-sided.
Results
Clinical Information and Blood Glucose Fluctuation Indexes Between DR Group and NDR Group
The 97/298 (32.55%) patients were diagnosed as DR in all recruited patients. Compared with the NDR group, age, prevalence of hypertension, duration of diabetes, FPG, HbA1C, UACR, and the utilization rate of INS/INS secretagogues were higher in DR group, while FC-P was lower (P<0.05) (Table 1). For blood glucose fluctuation indexes, compared with the NDR group, SD, MAGE, MG, LAGE and CV were higher in DR group, while TIR was lower (P<0.05) (Table 2), suggesting better TIR control in the NDR group.
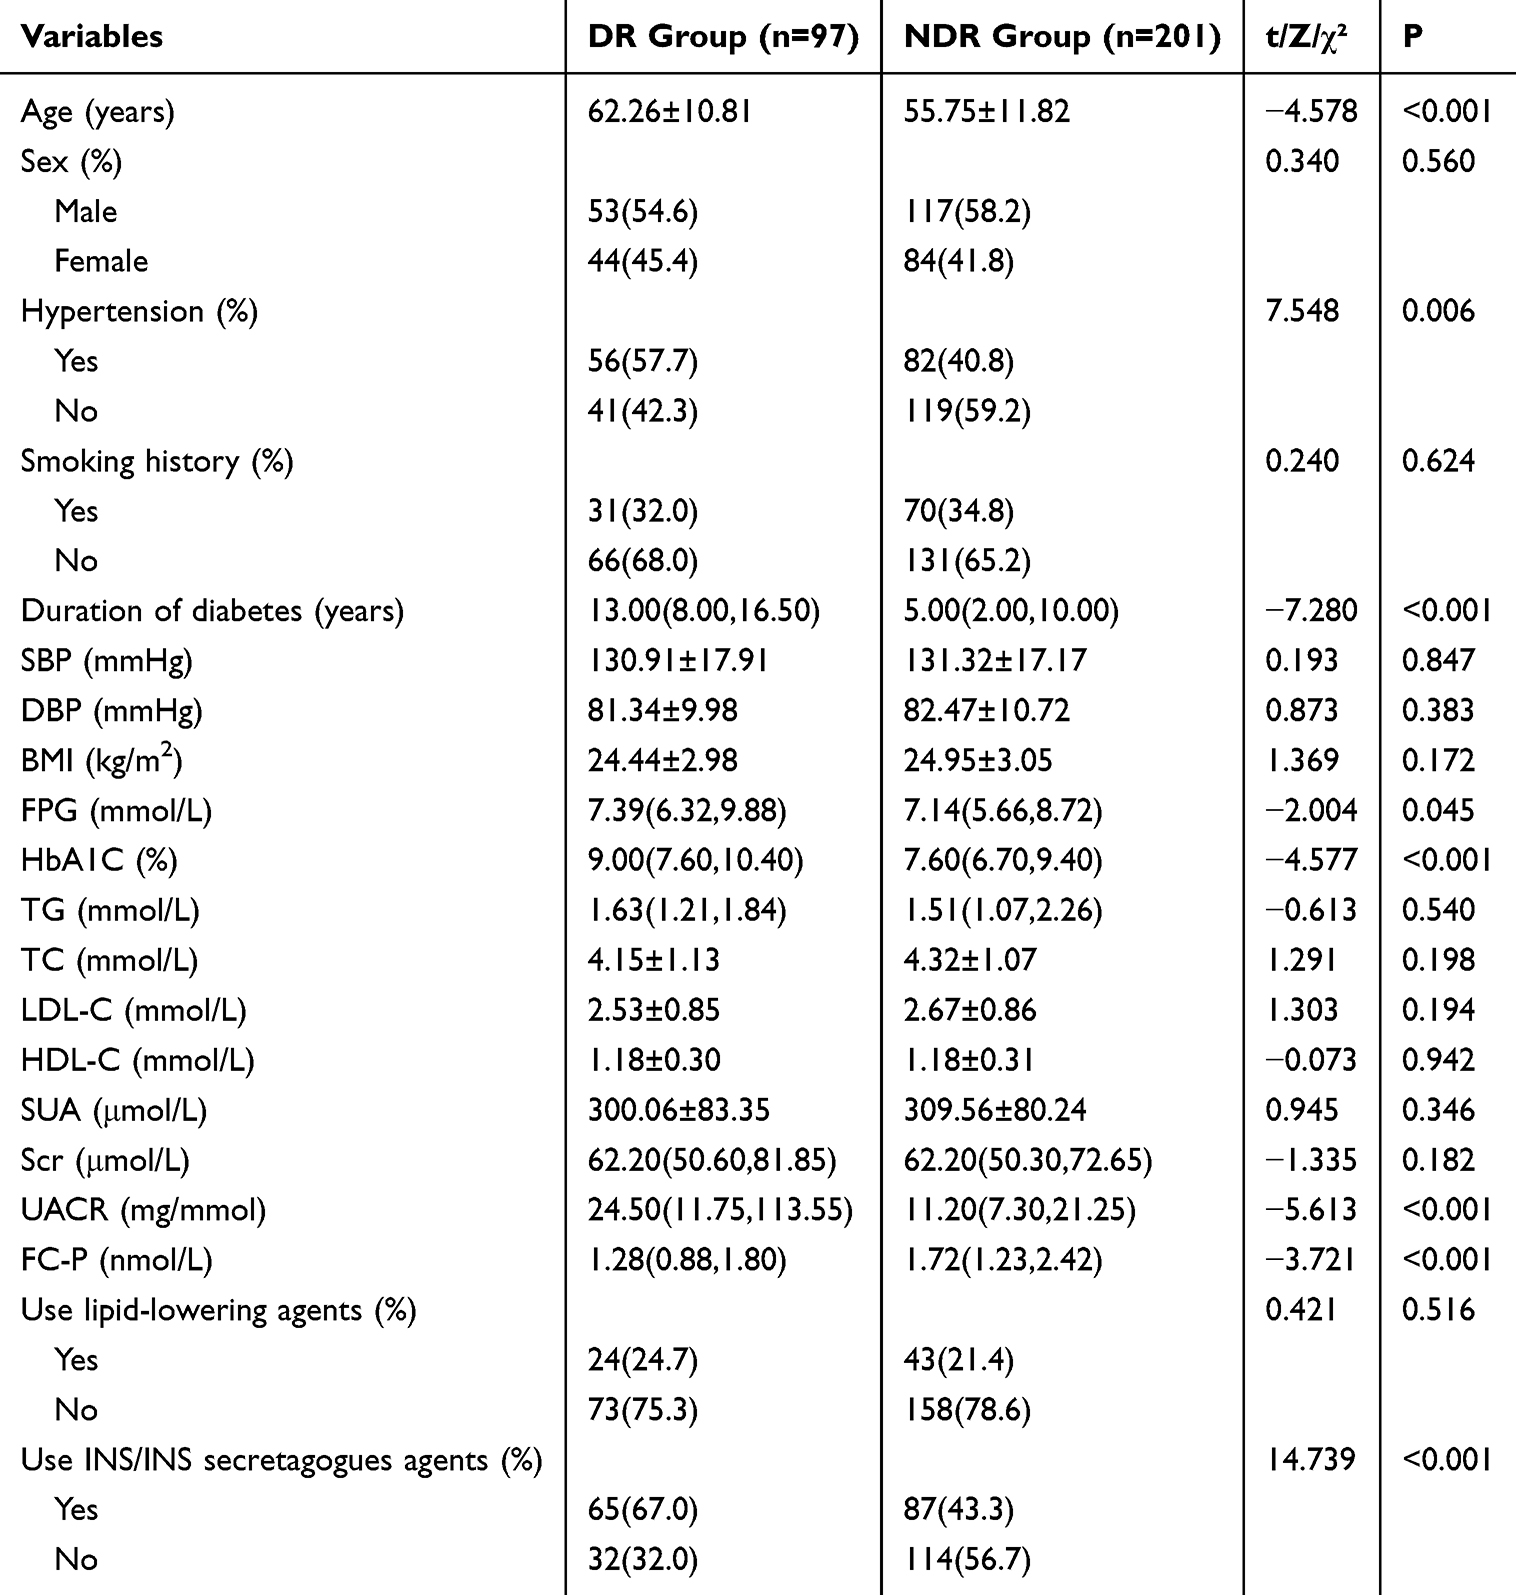 |
Table 1 Clinical Characteristics According to the Presence of DR |
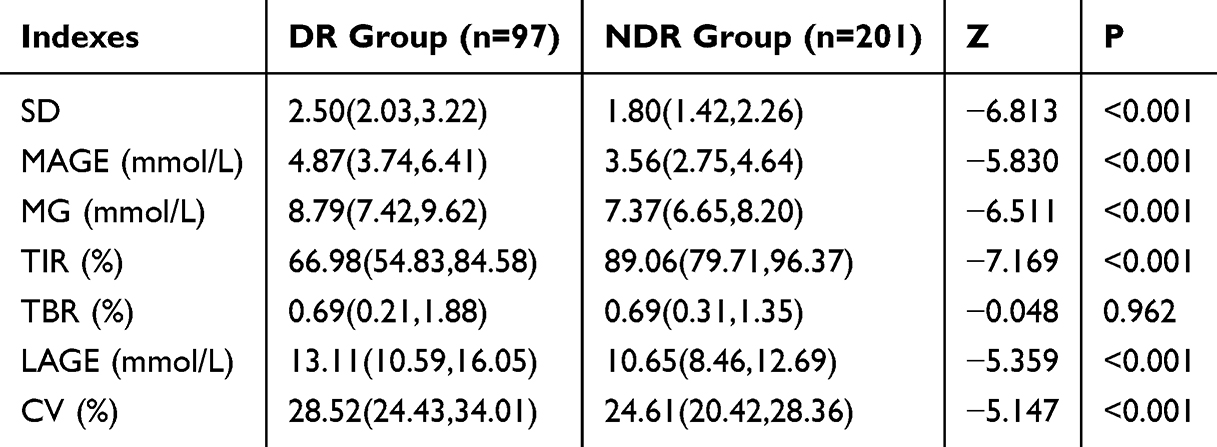 |
Table 2 Blood Glucose Fluctuation Indexes According to the Presence of DR |
Logistic Regression Analysis of DR in T2DM Patients with Hypoglycemia Unawareness
Association of TIR and other factors with DR was investigated by using univariate logistic regression. The data revealed that age, duration of diabetes, hypertension, FPG, Scr, HbA1C, UACR, SD, MAGE, MG, LAGE and CV were risk factors for DR. While FC-P and TIR were protective factors for DR (Table 3). Then the above variables were included in the multivariate logistic regression analysis. The results suggested that the TIR was an independent protective factor for DR (OR=0.937, P=0.032, Table 4).
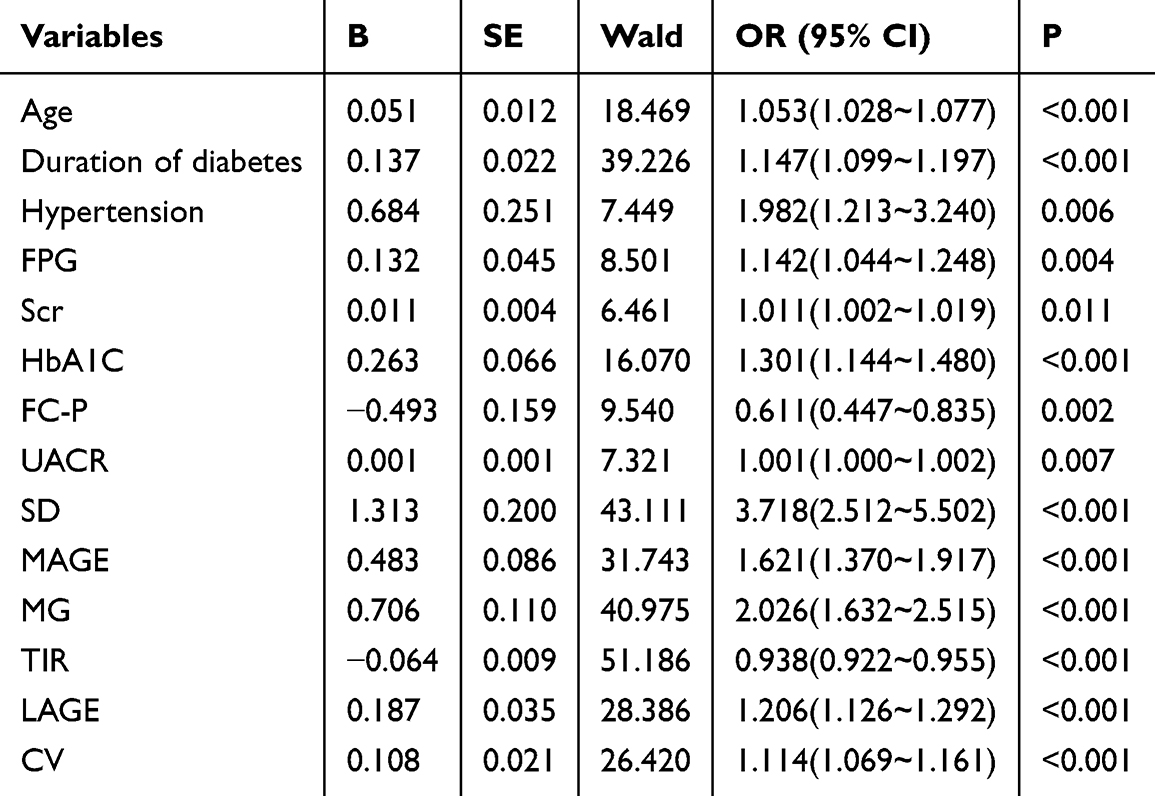 |
Table 3 The Logistic Univariate Regression Analysis of DR |
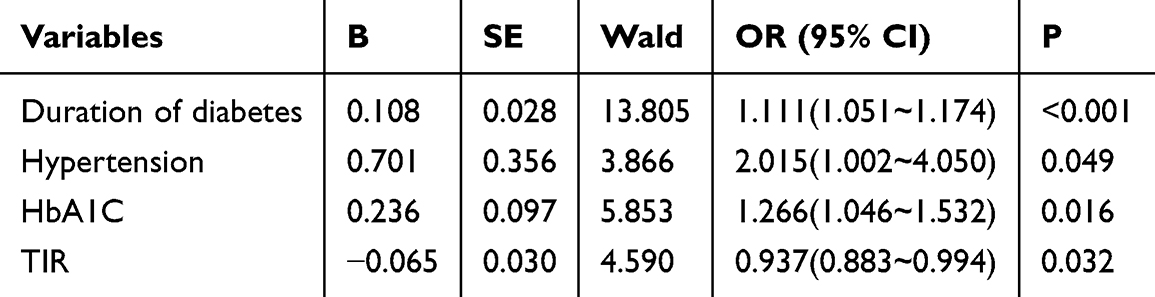 |
Table 4 The Logistic Multivariate Regression Analysis of DR |
The Predictive Value of TIR for DR by ROC Curve
The AUC of TIR for DR diagnosis prediction was 0.756 (95% CI 0.692–0.820, P<0.001), with a sensitivity of 66.0%, specificity of 80.6%, and an optimal cutoff value of 77.3%.
The Comparison of Clinical Characteristics and Blood Glucose Fluctuation Indexes by Quartiles (Q1-Q4) of TIR
There were statistical significances in the duration of diabetes, FPG, HbA1C, SUA, UACR, FCP and prevalence of DR among groups with different TIR levels. The prevalence of DR in the four TIR groups was 70.9%, 23.6%, 17.8%, and 14.9% (Table 5). It is suggested that TIR control is better and the prevalence of DR is lower. After pairwise comparison, it was worth noting that the prevalence of DR in Q1 group was higher than that in Q2 to Q4 group, while there was no statistical significance in the prevalence of DR among Q2 to Q4 group (P<0.05) (Figure 2). For blood glucose fluctuation indexes, statistical significances in SD, MAGE, MG, TBR, LAGE and CV existed among groups with different TIR levels. After pairwise comparison, it was worth noting that the TBR in group Q3 was higher than that in other groups (P<0.05) (Table 6 and Figure 3).
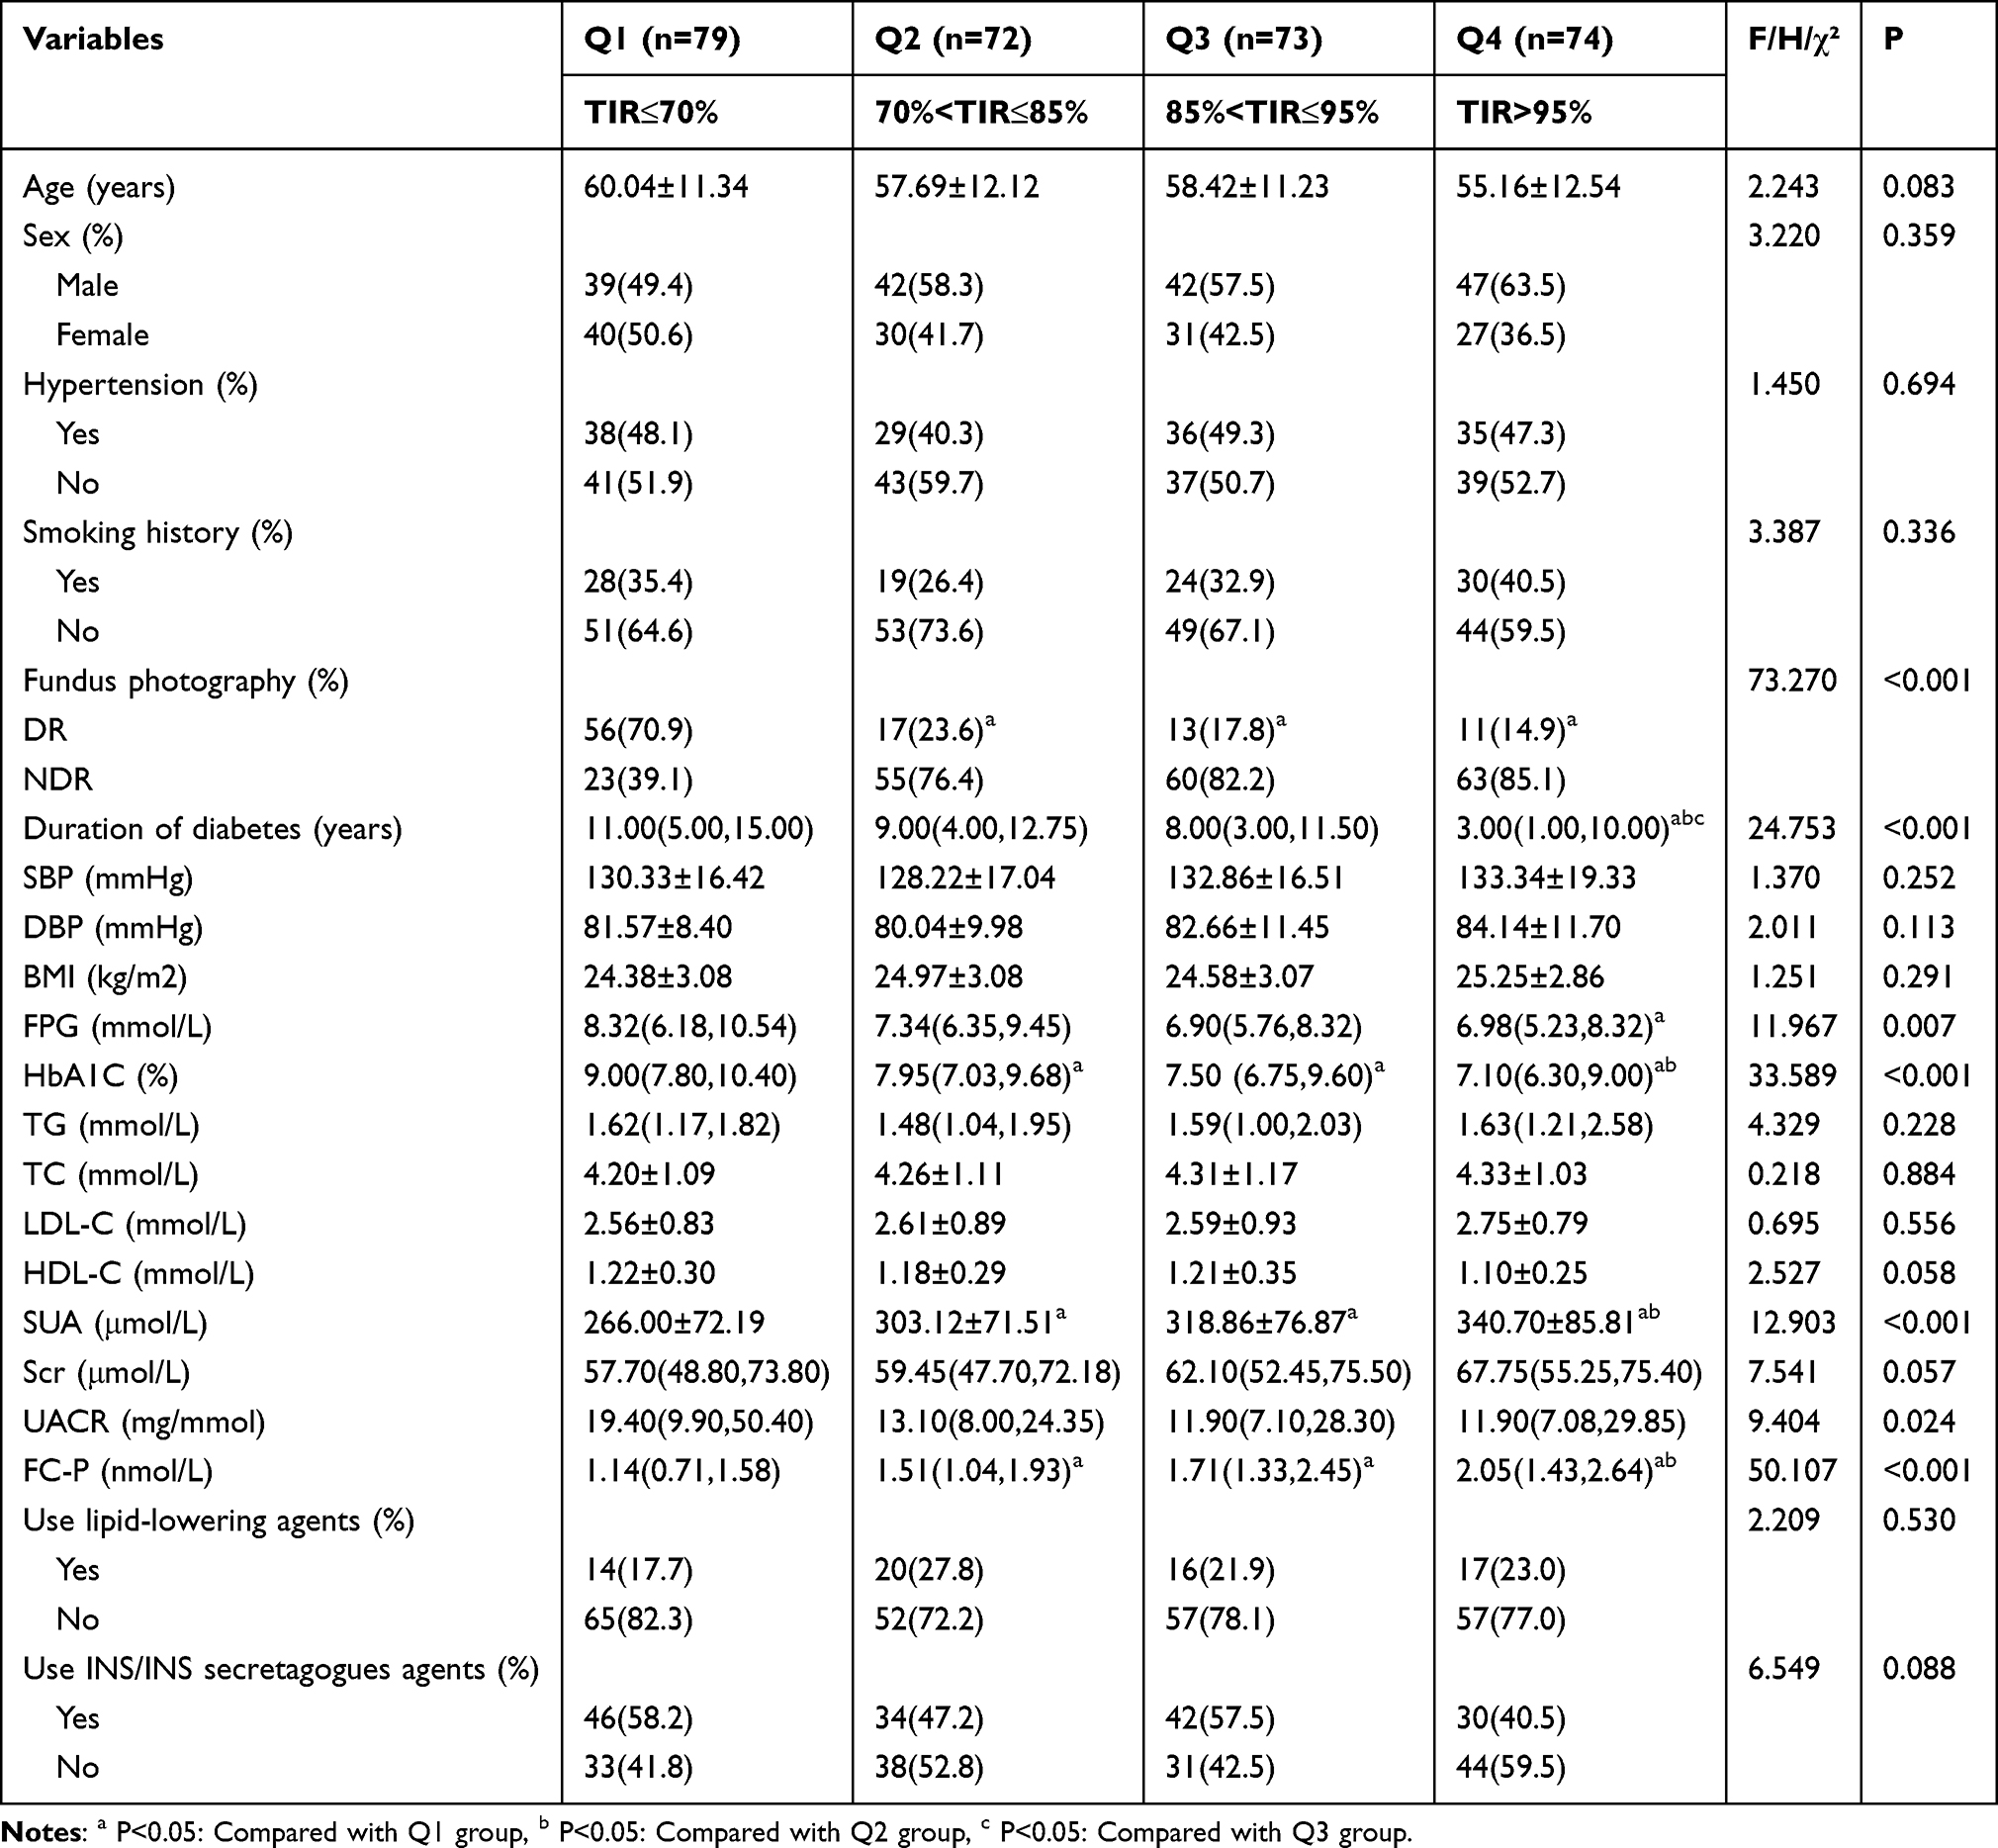 |
Table 5 Clinical Characteristics of TIR grouping |
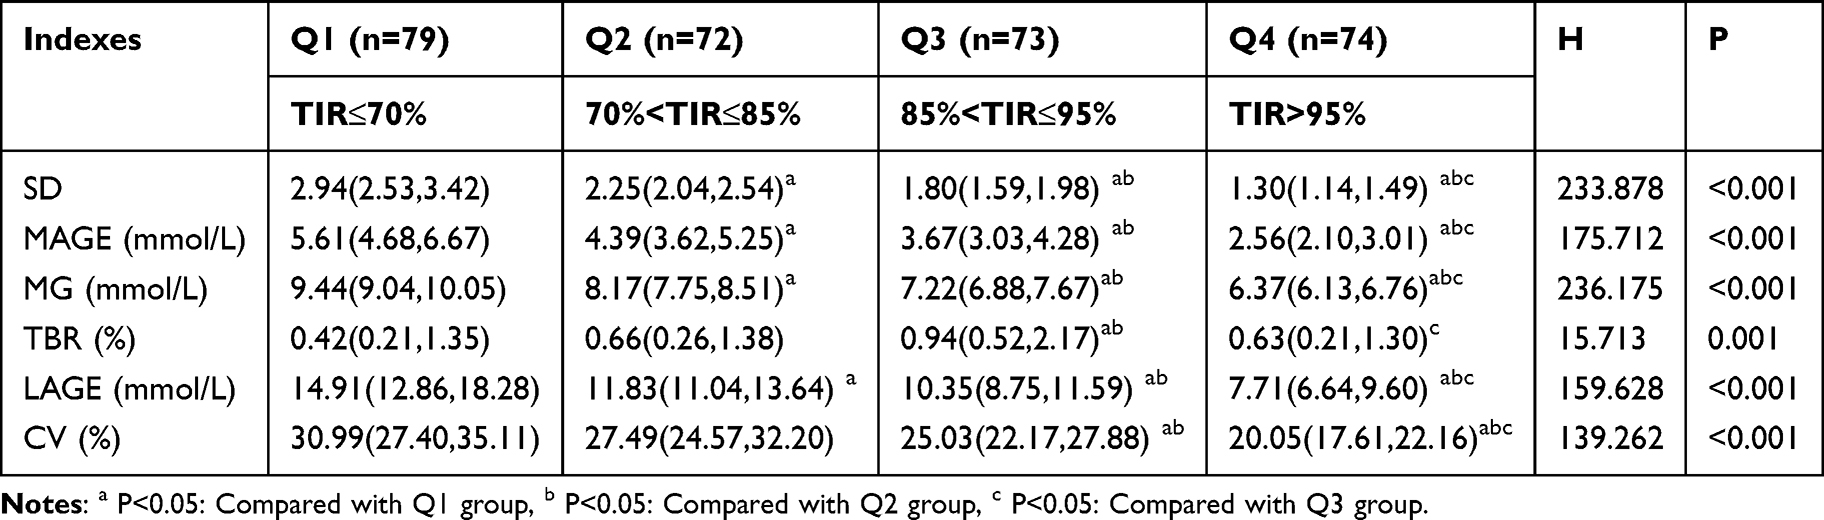 |
Table 6 Blood Glucose Fluctuation Indexes of TIR grouping |
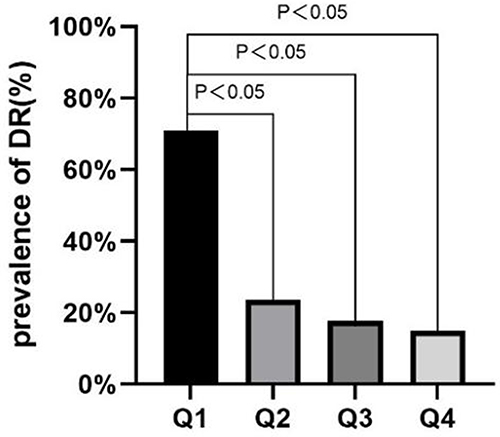 |
Figure 2 Prevalence of DR among groups with different TIR levels. |
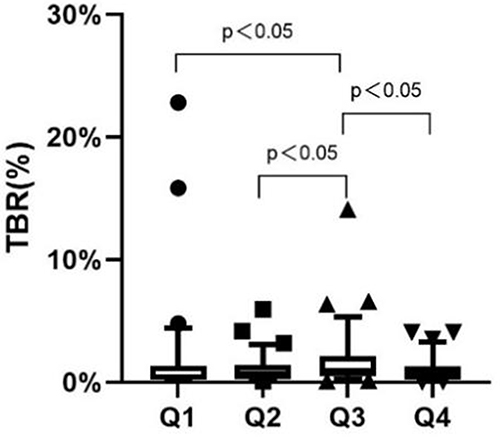 |
Figure 3 TBR among groups with different TIR levels. |
The Correlation Between TBR and Other Indicators
Spearman analysis showed that TBR was negatively correlated with MG (r=−0.221, P<0.001) in T2DM patients with hypoglycemia unawareness (Figure 4).
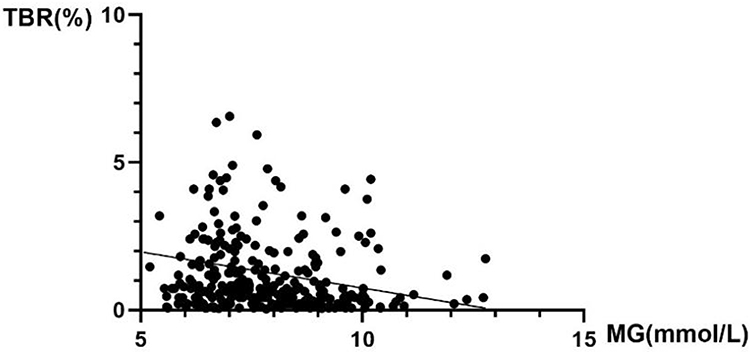 |
Figure 4 Spearman analysis between TBR and MG. |
Logistic Regression Analysis of DR and TIR Groups
In logistic regression models with DR as the dependent variable and Q3 as the reference group, we constructed three models, which were unadjusted model, Model 1 and Model 2. Model 1 was adjusted for age, duration of diabetes, hypertension, FPG, Scr, HbA1C, FC-P and UACR. Model 2 was further adjusted for MAGE, MG and LAGE on the basis of Model 1. The results showed that only Q1 group was a risk factor, regardless of whether there were adjusted for confounding factors (Table 7).
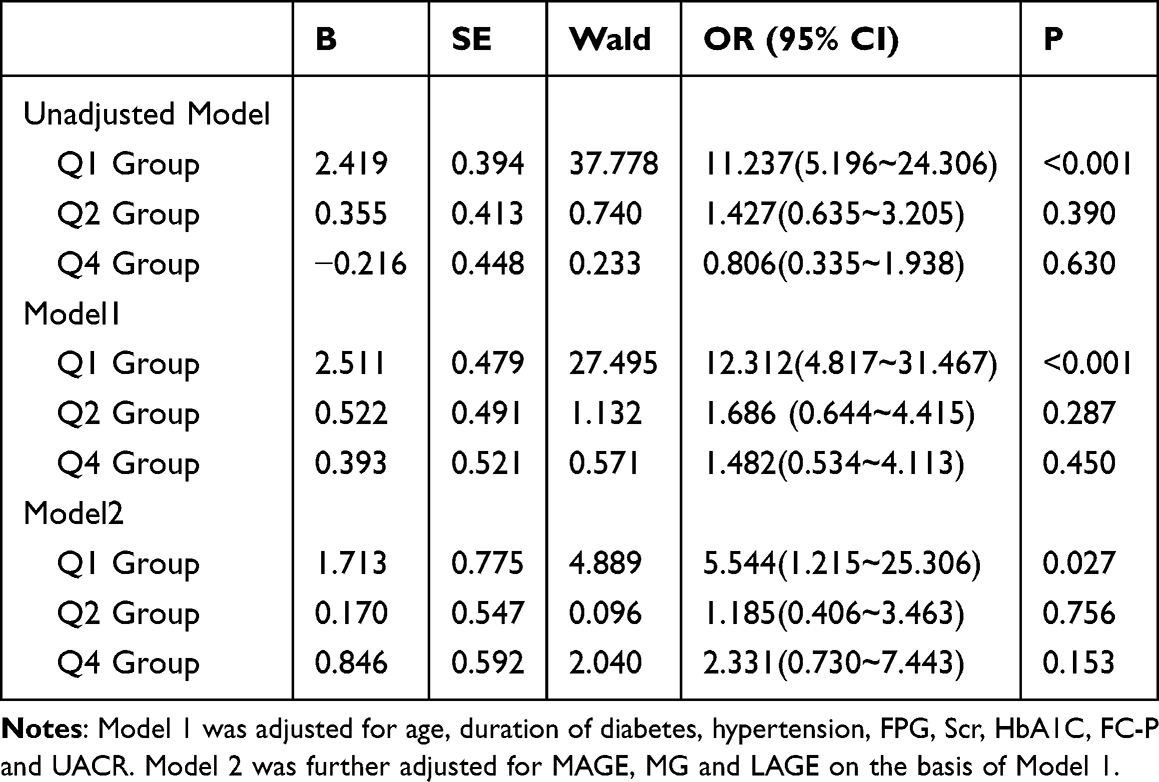 |
Table 7 Logistic Regression Analysis Between TIR Groups and DR |
Discussion
DR is a serious microangiopathy complication of diabetes, which lacks specific clinical symptoms in the early stage. Blindness and low vision caused by DR have become major public health problems. Poor glycemic management is an important risk factor for DR.14 HbA1C, as the gold standard for evaluating glycemic control, also has its limitations. It does not reflect short-term control of blood glucose, including information about hyperglycemia, hypoglycemia and blood glucose fluctuations. In addition, it is not reliable in patients with hemoglobinopathies, anemia and iron deficiency.15,16 The emergence of TIR has gradually revealed its superiority in more and more studies on diabetic complications.9–11 And the improvement of TIR can improve the clinical outcome of patients with diabetes has been continuously confirmed. It provides a new idea for the current concept of glycemic control with HbA1C as the mainstream indicator.
Our study found that in T2DM patients with hypoglycemia unawareness, compared with NDR group, the prevalence of hypertension, utilization rate of INS/INS secretagogue, FPG, HbA1C, UACR, age and duration of diabetes were higher in DR group, while FC-P was lower (P<0.05). The increase of UACR in DR group is not difficult to understand, because diabetic nephropathy (DN) and DR are both diabetic microangiopathy. And the increase of UACR is often parallel to the development of DR.17 The decrease of FC-P in the DR group was also mentioned in the study of Lu et al,4 suggesting that the decline of islet function was more significant in DR group, which may be related to the higher diabetes duration. Although some studies suggest that dyslipidemia may promote the occurrence and progression of DR,18 no correlation between DR and blood lipids was found in our study. An important reason may be that most patients began to receive lipid-lowering treatment when their blood lipids do not reach the target. After multivariable logistic regression analysis, we found that the diabetes duration (P<0.001), hypertension (P<0.05) and HbA1C (P<0.05) were all independent risk factors for DR, consistent with the risk factors mentioned in a meta-analysis.19
In the comparison of blood glucose fluctuation indexes, compared with NDR group, SD, MAGE, MG, LAGE, and CV were higher in DR group (P<0.001), while TIR was lower, suggesting that the blood glucose fluctuations in the DR group were larger and control of TIR was not satisfactory. And TIR was an independent protective factor for DR after correcting confounding factors in logistic regression analysis. Meanwhile, ROC curve showed that the AUC of TIR for DR diagnosis prediction was 0.756, the sensitivity was 66.0%, and the specificity was 80.6%. All of these confirmed the correlation and value of diagnosis prediction of TIR for DR in T2DM patients with hypoglycemia unawareness and were consistent with the conclusions of previous studies.9,20 Therefore, consistent with general patients with T2DM, for T2DM patients with hypoglycemia unawareness, the improvement of TIR can also reduce the occurrence of DR. The potential mechanisms linking TIR to DR progression may be as follows: (1) Reduced TIR levels are associated with an increased risk of hyperglycemia exposure. It has been shown that the AUC correlation coefficient between TIR and indicators for evaluating hyperglycemia, such as time above range and glucose >10 mmol/L, is greater than 0.9, indicating a strong correlation.21 Hyperglycemia can induce mitochondria to produce a large amount of superoxide including reactive oxygen species, causing oxidative stress, thereby activating the production of advanced glycation end products and protein kinase C in cells, and also increasing the flux of key pathways such as hexosamine and polyols, thereby increasing the risk of DR occurrence and development. (2) Lower TIR levels are also associated with increased glucose fluctuations, and abnormal glucose fluctuations can contribute to the development of DR by causing vascular damage through increased oxidative stress, exacerbating inflammatory responses, and impairing endothelial cell function.22,23 Furthermore, it is also shown that, compared with prolonged hyperglycemic states, fluctuations in blood glucose are more likely to stimulate the occurrence of oxidative stress.24
Active glycemic control helps prevent the DR. But some studies25 have pointed to the risk of hypoglycemia and cardiovascular events associated with active glycemic control. Therefore, compared with intensive glycemic control, we recommend scientific glycemic control, emphasizing that close observation should be made during glycemic control to prevent hypoglycemia and cardiovascular events, and attention should be paid to the occurrence of hypoglycemia events and the increased risk of death caused by them.26 And it is also very important to reduce the hypoglycemia unawareness because of its strong concealment. In the following TIR group comparison, we found something interesting.
We divided the participants into four nearly equal groups by TIR pointcut. We found that the prevalence of DR in the three groups with TIR > 70% was lower than that in the Q1 group (TIR < 70%) (P<0.05), but there was no statistical significance in the prevalence of DR among the three TIR groups with TIR > 70% (P>0.05). It verifies the rationality of the TIR control target of greater than 70%.27 However, it should be noted that the TBR in Q3 group was higher than that in other TIR groups (P<0.05). To this end, we found a negative correlation between TBR and MG (r =−0.221, P<0.001) by using spearman analysis. And with the increase of TIR quartile, MG showed a decreasing trend. In short, tighter glycemic control goals of TIR led to lower MG, which may have led to an increase in TBR.
Uemura et al28 found that MG was an important factor in the occurrence of hypoglycemia in a study on insulin treatment of patients with T2DM. Similarly, a study of outpatients with T2DM29 found a strong association between MG and the occurrence of nocturnal hypoglycemia unawareness. And Kilpatrick et al30 conducted a study on patients with T1DM, and the results suggested that MG plays an independent role in the increased risk of hypoglycemia. For every 1 mmol/l decrease in MG, the incidence of the first hypoglycemic event increases by 1.05 times. These all confirm that the occurrence of hypoglycemia should be more vigilant when the glycemic control is more stringent.
Finally, we performed logistic regression analysis with DR as the dependent variable and the Q3 group as the reference group. We found that only Q1 group (TIR < 70%) was a risk factor for DR, regardless of whether there were adjusted for confounding factors. Therefore, for T2DM patients with hypoglycemia unawareness, glycemic control needs to be individualized. When TIR > 70%, there is no need to set a stricter target of TIR, which may reduce the TBR of patients, thereby reducing the risk of hypoglycemia.
Previous studies on the association between TIR and DR usually focused on patients with T2DM,9,20 but in the current study, we focused on T2DM patients with hypoglycemia unawareness so as to provide more evidence for the management of this specific population. However, our research has some limitations. Firstly, this is a retrospective study, which can just describe association, not causation. Secondly, the dynamic glucose monitoring time is relatively short which may not completely reflect the long-term glucose fluctuations of the patients. Thirdly, the sample size of this study is small from a single center, and the severity of DR was not grouped, which may limit the generalization of the findings. Fourthly, antihypertensive treatment was not registered in the current study, which may affect the results as ß-blockers are drugs that can cause hypoglycemia. Lastly, the current study analyzed the history of usage of INS/INS secretagogues agents, but the exact dose of insulin used was not investigated, which could be further studied in future research. Future studies with larger sample size are required to further validate the findings of the current study.
In conclusion, for T2DM patients with hypoglycemia unawareness, TIR is a protective factor for DR, while hypertension, duration of diabetes, HbA1C are risk factors. T2DM patients with hypoglycemia unawareness with TIR between 85% and 95% had a higher TBR than other TIR groups, but there was no statistical significance in the risk of DR compared with patients with TIR between 70% and 85%. Therefore, for T2DM patients with hypoglycemia unawareness, the satisfactory range of TIR is 70% to 85%, which will reduce TBR without increasing the risk of DR, thereby reducing the risk of hypoglycemia. Our findings suggest that lower TIR is associated with an increased risk of DR in T2DM patients with hypoglycemia unawareness. TIR should be more widely accepted as a routine metric in diabetes management,9,20 and addressing specific thresholds of TIR associated with DR risk would strengthen practical utility.
Data Sharing Statement
Our study only collected the clinical data of patients and did not interfere with the treatment plan of patients. The datasets related to this study are not publicly available due to privacy or ethical restrictions but are available from the corresponding author on reasonable request.
Author Contributions
All authors made a significant contribution to the work reported, whether that is in the conception, study design, execution, acquisition of data, analysis and interpretation, or in all these areas; took part in drafting, revising or critically reviewing the article; gave final approval of the version to be published; have agreed on the journal to which the article has been submitted; and agree to be accountable for all aspects of the work.
Funding
This work was supported by the Anhui Province Health and Wellness Research Project (AHWJ2024Aa20141), Medical Application Research Project of Hefei ([2019] No. 172, Hwk2020yb0013, Hwk2022zc048, Hwk2023zd003) and the Scientific Research Project of Bengbu Medical College ([2023] No. 3).
Disclosure
The authors declare that they have no competing interests in this work.
References
1. Sun H, Saeedi P, Karuranga S, et al. IDF diabetes atlas: global, regional and country-level diabetes prevalence estimates for 2021 and projections for 2045. Diabetes Res Clin Pract. 2022;183:109119. doi:10.1016/j.diabres.2021.109119
2. Cheung N, Mitchell P, Wong TY. Diabetic retinopathy. Lancet. 2010;376(9735)::124–136. doi:10.1016/S0140-6736(09)62124-3
3. Teo ZL, Tham YC, Yu M, et al. Global prevalence of diabetic retinopathy and projection of burden through 2045: systematic review and meta-analysis. Ophthalmology. 2021;128(11):1580–1591. doi:10.1016/j.ophtha.2021.04.027
4. Zoungas S, Patel A, Chalmers J, et al. Severe hypoglycemia and risks of vascular events and death. N Engl J Med. 2010;363(15):1410–1418. doi:10.1056/NEJMoa1003795
5. Li XN, Kan YS, Liu HY, et al. Prevalence and contributing factors of impaired awareness of hypoglycemia in patients with type 2 diabetes: a meta-analysis. Acta Diabetol. 2023;60(9):1155–1169. doi:10.1007/s00592-023-02102-2
6. Gabbay MAL, Rodacki M, Calliari LE, et al. Time in range: a new parameter to evaluate blood glucose control in patients with diabetes. Diabetol Metab Syndr. 2020;12:22. doi:10.1186/s13098-020-00529-z
7. Xu SY, LiuCY, Zhang Z, et al. Association between time in range, a novel measurement of glycemic control and islet secretory function in Chinese patients with type 2 diabetes mellitus-An observational study. Diabetes Res Clin Pract. 2021;173:108684. doi:10.1016/j.diabres.2021.108684
8. Klupa T, Czupryniak L, Dzida G, et al. Expanding the role of continuous glucose monitoring in modern diabetes care beyond type 1 disease. Diabetes Ther. 2023;14(8):1241–1266. doi:10.1007/s13300-023-01431-3
9. Lu J, Ma X, Zhou J, et al. Association of time in range, as assessed by continuous glucose monitoring, with diabetic retinopathy in type 2 diabetes. Diabetes Care. 2018;41(11):2370–2376. doi:10.2337/dc18-1131
10. Lu J, Ma X, Shen Y, et al. Time in range is associated with carotid intima-media thickness in type 2 diabetes. Diabetes Technol Ther. 2020;22(2):72–78. doi:10.1089/dia.2019.0251
11. Yoo JH, Choi MS, Ahn J, et al. Association between continuous glucose monitoring-derived time in range, other core metrics, and albuminuria in type 2 diabetes. Diabetes Technol Ther. 2020;22(10):768–776. doi:10.1089/dia.2019.0499
12. Battelino T, Alexander CM, Amiel SA, et al. Continuous glucose monitoring and metrics for clinical trials: an international consensus statement. Lancet Diabetes Endocrinol. 2023;11(1):42–57. doi:10.1016/S2213-8587(22)00319-9
13. ElSayed NA, Aleppo G, Aroda VR, et al. 6. glycemic targets: standards of care in diabetes-2023. Diabetes Care. 2023;46:S97–S110. doi:10.2337/dc23-S006
14. Kumari N, Bhargava M, Nguyen DQ, et al. Six-year incidence and progression of diabetic retinopathy in Indian adults: the Singapore Indian Eye study. Br J Ophthalmol. 2019;103(12):1732–1739. doi:10.1136/bjophthalmol-2018-313282
15. Danne T, Nimri R, Battelino T, et al. International consensus on use of continuous glucose monitoring. Diabetes Care. 2017;40:1631–1640. doi:10.2337/dc17-1600
16. Beck RW, Connor CG, Mullen DM, Wesley DM, Bergenstal RM. The fallacy of average: how using HbA1C alone to assess glycemic control can be misleading. Diabetes Care. 2017;40(8):994–999. doi:10.2337/dc17-0636
17. Saini DC, Kochar A, Poonia R. Clinical correlation of diabetic retinopathy with nephropathy and neuropathy. Indian J Ophthalmol. 2021;69(11):3364–3368. doi:10.4103/ijo.IJO_1237_21
18. Eid S, Sas KM, Abcouwer SF, et al. New insights into the mechanisms of diabetic complications: role of lipids and lipid metabolism. Diabetologia. 2019;62(9):1539–1549. doi:10.1007/s00125-019-4959-1
19. Yau JW, Rogers SL, Kawasaki R, et al. Global prevalence and major risk factors of diabetic retinopathy. Diabetes Care. 2012;35(3):556–564. doi:10.2337/dc11-1909
20. G PK, Angelia M, S AY, et al. Time in range: unveiling the correlation with diabetic retinopathy in type 2 diabetes: a systematic review and meta-analysis. Clinical Diabetology. 2024;13(3):132–139. doi:10.5603/cd.99931
21. Beck RW, Bergenstal RM, Cheng P, et al. The relationships between time in range, hyperglycemia metrics, and HbA1c. J Diabetes Sci Technol. 2019;13(4):614–626. doi:10.1177/1932296818822496
22. Costantino S, Paneni F, Battista R, et al. Impact of glycemic variability on chromatin remodeling, oxidative stress, and endothelial dysfunction in patients with type 2 diabetes and with target HbA1c levels. Diabetes. 2017;66(9):2472–2482. doi:10.2337/db17-0294
23. Papachristoforou E, Lambadiari V, Maratou E, et al. Association of glycemic indices (hyperglycemia, glucose variability, and hypoglycemia) with oxidative stress and diabetic complications. J Diabetes Res. 2020;2020:7489795. doi:10.1155/2020/7489795
24. Monnier L, Mas E, Ginet C, et al. Activation of oxidative stress by acute glucose fluctuations compared with sustained chronic hyperglycemia in patients with type 2 diabetes. JAMA. 2006;295(14):1681–1687. doi:10.1001/jama.295.14.1681
25. Gerstein HC, Miller ME, Robert P Byington, et al; Action to Control Cardiovascular Risk in Diabetes Study Group. Effects of intensive glucose lowering in type 2 diabetes. N Engl J Med. 2008;358(24):2545–2559.
26. International Hypoglycaemia Study Group. Hypoglycaemia, cardiovascular disease, and mortality in diabetes: epidemiology, pathogenesis, and management [published correction appears in. Lancet Diabetes Endocrinol. 2019;7(6):e18.
27. Battelino T, Danne T, Bergenstal RM, et al. Clinical targets for continuous glucose monitoring data interpretation: recommendations from the international consensus on time in range. Diabetes Care. 2019;42(8):1593–1603. doi:10.2337/dci19-0028
28. Uemura F, Okada Y, Torimoto K, Tanaka Y. Relation between hypoglycemia and glycemic variability in type 2 diabetes patients with insulin therapy: a study based on continuous glucose monitoring. Diabetes Technol Ther. 2018;20(2):140–146. doi:10.1089/dia.2017.0306
29. Wang S, Tan Z, Wu T, et al. Largest amplitude of glycemic excursion calculating from self-monitoring blood glucose predicted the episodes of nocturnal asymptomatic hypoglycemia detecting by continuous glucose monitoring in outpatients with type 2 diabetes. Front Endocrinol. 2022;13:858912. doi:10.3389/fendo.2022.858912
30. Kilpatrick ES, Rigby AS, Goode K, Atkin SL. Relating mean blood glucose and glucose variability to the risk of multiple episodes of hypoglycaemia in type 1 diabetes. Diabetologia. 2007;50(12):2553–2561. doi:10.1007/s00125-007-0820-z
 © 2025 The Author(s). This work is published and licensed by Dove Medical Press Limited. The
full terms of this license are available at https://www.dovepress.com/terms
and incorporate the Creative Commons Attribution
- Non Commercial (unported, 4.0) License.
By accessing the work you hereby accept the Terms. Non-commercial uses of the work are permitted
without any further permission from Dove Medical Press Limited, provided the work is properly
attributed. For permission for commercial use of this work, please see paragraphs 4.2 and 5 of our Terms.
© 2025 The Author(s). This work is published and licensed by Dove Medical Press Limited. The
full terms of this license are available at https://www.dovepress.com/terms
and incorporate the Creative Commons Attribution
- Non Commercial (unported, 4.0) License.
By accessing the work you hereby accept the Terms. Non-commercial uses of the work are permitted
without any further permission from Dove Medical Press Limited, provided the work is properly
attributed. For permission for commercial use of this work, please see paragraphs 4.2 and 5 of our Terms.
Recommended articles
Non-Linear Relationship Between Fasting C-Peptide and Retinopathy in Patients with Type 2 Diabetes Mellitus - A Retrospective Study
Ma J, Han C, Lv Y, Cai H
Diabetes, Metabolic Syndrome and Obesity 2025, 18:1035-1045
Published Date: 7 April 2025
Development and Validation of a Nomogram-Based Risk Prediction Model for Diabetic Retinopathy in Elderly Adults with Type 2 Diabetes Mellitus
Chen M, Niu T, Sun Y, Chang M, Liu S, Xu T, Cui H
Diabetes, Metabolic Syndrome and Obesity 2025, 18:2509-2523
Published Date: 25 July 2025