Back to Journals » Journal of Pain Research » Volume 16
Association Between Power Doppler Ultrasound Signals and Chronic Pain After Total Knee Arthroplasty: A Cross-Sectional Explorative Study
Authors Sugimura N ![]() , Aso K, Wada H, Izumi M
, Aso K, Wada H, Izumi M ![]() , Ikeuchi M
, Ikeuchi M
Received 22 March 2023
Accepted for publication 21 August 2023
Published 29 August 2023 Volume 2023:16 Pages 2981—2992
DOI https://doi.org/10.2147/JPR.S403641
Checked for plagiarism Yes
Review by Single anonymous peer review
Peer reviewer comments 3
Editor who approved publication: Dr Alaa Abd-Elsayed
Supplementary video of "PD ultrasonography and CPSP after TKA" [ID 403641].
Views: 95
Natsuki Sugimura,1,2 Koji Aso,1 Hiroyuki Wada,1 Masashi Izumi,1 Masahiko Ikeuchi1
1Department of Orthopedic Surgery, Kochi Medical School, Kochi University, Nankoku, Kochi, 783-8505, Japan; 2Department of Orthopedic Surgery, Hata Prefectural Hospital, Sukumo, Kochi, 788-0785, Japan
Correspondence: Natsuki Sugimura, Department of Orthopedic Surgery, Kochi Medical School, Kochi University, 185-1 Oko-cho Kohasu, Nankoku, Kochi, 783-8505, Japan, Tel +81-88-880-2386, Fax +81-88-880-2388, Email [email protected]
Purpose: Some patients experience chronic postsurgical pain (CPSP) after total knee arthroplasty (TKA) despite the absence of clinical or radiographic abnormalities. Postoperative synovitis as a cause of CPSP after TKA has received limited research attention. This study aimed to investigate the relationship between synovitis after TKA and CPSP.
Patients and Methods: A total of 111 knees of 85 patients, with at least 1-year post-TKA follow-up, were assessed retrospectively and cross-sectionally. Power Doppler (PD) ultrasonography was used to detect the synovial hypervascularity associated with synovitis. The knee joint was divided into 15 areas, and PD signals were graded semi-quantitatively (0– 3) in each area, the sum of which was defined as the total PD score. Clinical information regarding CPSP, including the Western Ontario and McMaster Universities Osteoarthritis Index (WOMAC) pain subscales, was recorded. The relationship between pain and PD ultrasonography findings was accessed. Patients were divided into two groups (CPSP+ and CPSP− groups) based on pain severity. Clinical information, including PD ultrasonography findings and other possible causes, was compared between the groups.
Results: The WOMAC pain subscale was significantly correlated with the total PD score and maximum PD grade (r=0.3977, p< 0.0001; r=0.2797, p=0.0029; respectively). The CPSP+ group had a significantly higher maximum PD grade and total PD score than the CPSP− group (median [interquartile range]: 2 [1, 2] vs 1 [1, 2], p=0.0001; 6 [2, 11] vs 2 [1, 4], p=0.0002; respectively). Multiple and logistic regression analyses showed that the total PD score was an independent factor for the WOMAC pain subscale (β=0.3822, 95% confidence interval [CI]=0.1460, 0.6184, p=0.00176) and CPSP (odds ratio=1.19, 95% CI=1.01, 1.41, p=0.0424).
Conclusion: This study indicated a possible association between the total PD score and chronic pain after TKA; however, further studies are needed to corroborate these findings.
Keywords: chronic postsurgical pain, synovitis, ultrasonography
Introduction
Total knee arthroplasty (TKA) is one of the most common and successful orthopedic surgeries. The number of TKAs performed is increasing and is expected to grow with the aging population.1 Although good pain relief and improved quality of life can be achieved in general,2,3 a significant proportion of patients experience chronic postsurgical pain (CPSP), the leading cause of dissatisfaction after TKA.4,5 Etiologies of CPSP after TKA, including implant malpositioning, aseptic loosening of prosthesis, instability, and infection, can be diagnosed based on radiological images and laboratory analysis. However, Brander et al and Elson et al reported that 13% and 5% of patients with CPSP, respectively, have no clinical or radiographic abnormalities.6,7 However, imaging examinations that can visualize possible local causes of pain are limited. Therefore, further studies are required to analyze other possible local causes of CPSP and reduce its incidence.
Inflammatory lesions (ie, synovitis and effusion) seen in magnetic resonance imaging (MRI) and histological synovitis are one of the primary pathologic lesions that have been consistently associated with pain of knee osteoarthritis.8,9 Baler et al showed that synovitis detected by contrast-enhanced MRI had a strong association (adjusted odds ratio 9.2) with knee pain of moderate severity.10 Power Doppler (PD) ultrasonography is generally used for clinical evaluation of synovitis in rheumatoid arthritis and can detect intraarticular hyperemia indicating synovium inflammation, which is also correlated with knee pain in osteoarthritis.11 Few reports have described postoperative synovial proliferation in painful TKA, which can be detected by arthroscopy in patella clunk syndrome patients12,13 or MR angiography in recurrent hemarthrosis patients.14,15 Furthermore, the association between pain after TKA and effusion and Hoffa’s synovitis on MRI is recently reported.16 Although PD ultrasonography can well represent pathological components of active synovitis in rheumatoid arthritis and osteoarthritis,17 no observational studies have investigated the relationship between PD ultrasonography findings and chronic pain in patients who underwent TKA.
This exploratory study aimed to clarify the relationship between PD findings and chronic pain after TKA. We hypothesized that the intensity of PD findings after TKA is associated with the intensity of chronic pain in patients who underwent primary TKA for knee osteoarthritis.
Materials and Methods
Study Design and Patient Selection
A retrospective cross-sectional study using univariable and multivariable analyses was performed to assess the relationship between chronic pain after TKA and its factors, including synovitis after TKA. Additionally, an exploration of the causes of synovitis after TKA was performed using univariable analysis.
This study included patients recruited from the outpatient clinic of our departments in Hata Prefectural Hospital and Kochi University Hospital between September 2017 and October 2022. From among the patients visiting our outpatient clinic, those meeting the inclusion criteria were informed of the study; its methods, objectives, procedures, potential risks and benefits; and their rights as participants, and consent to participate was obtained. Participation in the study was voluntary and consent could be withdrawn at any point without any negative consequences. The study included patients who underwent TKA after the diagnosis of osteoarthritis and were followed up for more than 1-year postoperatively, regardless of knee pain. The exclusion criteria were infection, malalignment, instability, aseptic loosening of components, patella clunk syndrome, hemarthrosis, and cases with ipsilateral limb pain due to other diseases (such as sciatic nerve pain due to lumbar deformity).
The study procedures were approved by the Ethical Review Board of our hospitals (31–280 and ERB-105784).
Clinical Evaluation
Demographic data, including age, sex, knee passive range of motion (ROM), and body mass index (BMI), were collected. The symptoms were evaluated using patient-reported outcome measures (PROMs: the Western Ontario and McMaster Universities Osteoarthritis Index (WOMAC) and a pain visual analog scale (VAS) at rest and during walking). WOMAC score is evaluated using a brief questionnaire on the clinical symptoms and physical limitations for postoperative knee evaluation. It comprises three subscales, including pain (five items, 0–20 points), joint stiffness (two items, 0–8 points), and physical function (17 items, 0–68 points), and has a minimum score of 0 (best score) and a maximum score of 96 (worst score).18 WOMAC questionnaire was translated and adapted to our cultural setting.19 The pain was evaluated using a 100-mm VAS, where 0 indicated no pain and 100 indicated intractable pain.20 The type of implant (posterior stabilize type [PS], cruciate retaining type [CR] or cruciate substitute type [CS]), was recorded as a factor of the surgical procedure.
Ultrasonographic Evaluation of Synovitis
All ultrasonographic evaluations were conducted by orthopedic doctors with 14 and 8 years of experience (N.S. and H.W., respectively) in the outpatient clinic. The doctors were blinded to the results of the pain questionnaire to avoid any potential bias. During ultrasound, patients were placed in a supine position on the bed and the knees were exposed at approximately 30-degree flexion. Knee joints were examined by patellofemoral transverse, lateral longitudinal, and medial longitudinal scanning using an 18 MHz electronic linear transducer (HI VISION Preirus, Hitachi Tokyo, Japan). The findings of synovitis in PD ultrasonography were assessed in the standard settings according to recommendations.21,22 The pulse repetition and Doppler frequencies were 800 Hz and 7.5 MHz, respectively. Doppler gain was used to avoid random noise. The PD signal was used to assess vascularity in the synovial tissue. Synovial perfusion detected by PD was scored according to a semi-quantitative four-point grading scale as follows: grade 0, normal (undetectable PD vessel signals in the ultrasonographic synovial thickening area); grade 1, mild (intra-synovial PD flow signal distribution detectable over < 25%); grade 2, moderate (<50%); and grade 3, marked (>50%) (Figure 1). Positive PD signals at the genicular artery and quadricipital and/or patellar entheses were excluded. In the Supplementary Video, extensive pulsatile PD-positive grade 2 synovitis can be observed within the thickened tissue, as depicted on the gray scale.
 |
Figure 1 Representative images of power Doppler (PD) ultrasonography. The left and right images show PD grade 1 and grade 2 synovitis, respectively. |
Since the knee joint is spacious, to evaluate the severity of synovitis of the knee joint, we devised a scoring system for intraarticular PD signals with ultrasonography. First, intraarticular PD mapping was developed to evaluate localization. The following 15 areas with grid lines were used for intraarticular PD mapping: 1) superomedial, 2) inferomedial, 3) supra, 4) superolateral, and 5) inferolateral patellofemoral joints; 6) suprapatellar pouch; 7) anteromedial, 8) posteromedial, 9) anterolateral, and 10) posterolateral tibial plateaus; 11) anteromedial, 12) posteromedial, 13) anterolateral, and 14) posterolateral femoral condyles; and 15) posterior patellar tendon (Figure 2). The PD grade of each area was recorded. The maximum PD score was defined as the highest grade in the respective knee. The total PD score was calculated as the sum of all PD grades in each area.
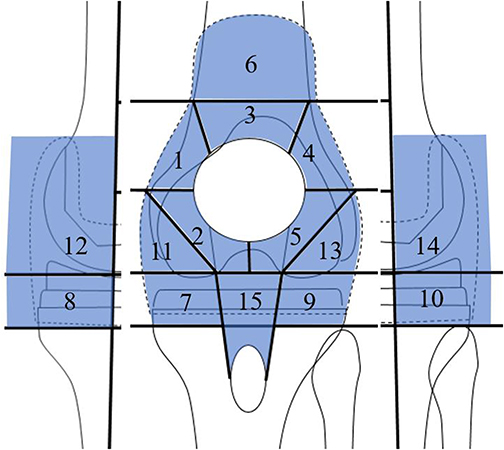 |
Figure 2 The knee joint was divided into the following 15 areas with grid lines for knee-synovitis mapping: 1) superomedial, 2) inferomedial, 3) supra, 4) superolateral, and 5) inferolateral patellofemoral joints; 6) suprapatellar pouch; 7) anteromedial, 8) posteromedial, 9) anterolateral, and 10) posterolateral tibial plateaus; 11) anteromedial, 12) posteromedial, 13) anterolateral, and 14) posterolateral femoral condyles; and 15) posterior patellar tendon. |
Intra-Observer and Inter-Observer Reliability
To assess intra-observer repeatability, the observer made a second assessment of the same 120 areas of eight patients. The time interval between the first and second assessment was 15 minutes. To assess inter-observer reliability, another orthopedic physician (K.A.) with 15 years of experience in musculoskeletal imaging independently assessed the ultrasonographic findings in 120 areas of eight patients.
Pressure Pain Threshold
To investigate the direct relationship between PD signals with ultrasonography and local pain, we evaluated pressure pain thresholds (PPTs). A handheld pressure algometer (Somedic, Hörby, Sweden) mounted with a 1-cm² probe (covered by a disposable latex sheath) was used to record the PPT on marks where the intraarticular PD signal with ultrasonography was observed. An interval of at least 20s was maintained between each PPT assessment. PPT was defined as “the time point at which the pressure sensation changed into pain”. The pressure was increased gradually at a rate of 30 kPa/s until the pain threshold was reached, at which point the participant was asked to press a button. PPTs on marks just above positive PD signals were measured in 38 parts (PD grade 0:8 parts, grade 1: 21 parts, grade 2: 9 parts) in eight patients.
Radiographical Evaluation
The standing anteroposterior radiographs of the lower extremities, lateral radiographs, and skyline patellar radiographs of the outpatients were obtained. The orientation of the components and sagittal alignments were measured according to the method of Ewald23 as α° (coronal femoral angle, optimum, 96), β° (coronal tibial angle, optimum, 90), γ° (sagittal femoral flexion angle), δ° (sagittal tibial posterior slope angle), and patellar tilting angle (Figure 3). All alignment data were measured using PACS digital radiographic software (Synapse5, Fujifilm, Tokyo, Japan).
 |
Figure 3 Radiographical evaluation. Femoro-tibial angle, α° (coronal femoral angle), β° (coronal tibial angle), γ° (sagittal femoral flexion angle), δ° (sagittal tibial posterior slope angle), and patellar tilting angle. |
Statistical Analysis
Descriptive statistics were used for all variables with distributions assessed. We employed multiple measures of pain factors to effectively address a complex clinical problem. Though CPSP presents after TKA, it is important to recognize that pain itself is a continuous variable. CPSP after TKA was defined as moderate-to-severe pain (VAS > 30 mm), either at rest or walking.24 The CPSP+ and CPSP− groups were compared regarding factors such as age, sex, BMI, ROM, type of implant, PROMs, implant positioning angle, maximum PD grade, and total PD score, depending on whether they were normally distributed. For normally distributed data, data are expressed as the mean ± standard deviation (SD), and groups were compared using the Student’s t-test. Differences were considered significant at P<0.05. For non-normally distributed data, data are expressed as the median and interquartile range (IQR), and groups were compared using the Wilcoxon rank test. The ratio of sex and type of implant in the two groups were compared using Fisher’s exact test. Additionally, logistic regression analysis was conducted using the CPSP± groups as objective variables and the significant factors on univariable analysis as the explanatory variables.
To assess the relationships between pain and its factors, univariable analyses between the WOMAC pain subscale and factors such as demographic factors (sex, age, BMI), ROM, type of implant, implant positions, patellar tilting angle, maximum PD grade, and total PD score were performed using Spearman’s rank correlation coefficient or Student’s t-test. Additionally, multiple regression analysis was conducted using the WOMAC pain subscale scores as objective variables and the significant factors on univariable analysis as the explanatory variables.
To investigate specific symptom characteristics of synovitis, the relationship between total PD score and PROMs was evaluated using Spearman’s rank correlation coefficient. One-way analysis of variance (ANOVA) was performed on PPTs using the PD grade. The Tukey–Kramer (TK) test was used for post hoc comparisons incorporating corrections for the multiple comparisons when ANOVA showed significant factors or interactions. Intra-observer and inter-observer reliability was assessed using the intraclass correlation coefficient (ICC) for PD grades and kappa statistics for the frequency of each ultrasonographic finding. The degree of agreement based on the ICC and kappa values was interpreted using the following criteria: poor, 0–0.20; fair, 0.21–0.40; moderate, 0.41–0.60; good, 0.61–0.80; and excellent, 0.81–1.00.25
To explore the causes of synovitis after TKA, univariable analyses between total PD score and possible factors such as demographic factors (sex, age, BMI), ROM, type of implant, implant positioning, and patellar tilting angle were performed using Spearman’s rank correlation coefficient or Student’s t-test, followed by multiple regression analysis using total PD score as the objective variable and the significant factors identified by univariable analysis as explanatory variables.
A priori power analysis for multiple regression analysis was conducted with an effect size of 0.15, an α value of 0.05, a power of 0.8, and predictors of four.26 A minimum of 65 knees were required.
Statistical analysis was performed using JMP 10.0 software (SAS Institute Inc. Cary, NC, USA), RStudio (http://www.rstudio.com/), or G*Power version 3.1.9.7 (Kiel, Germany).
Results
Demographic Data
Herein, 111 knees of 85 Japanese patients (70 women, 15 men) were evaluated. The demographic data of all patients included in this study (CPSP+ and CPSP− groups) are listed in Table 1. Regarding the background data, there were no differences between the groups, except for the scores in the clinical questionnaires (pain VAS at rest and during walking, WOMAC subscales, and total WOMAC score).
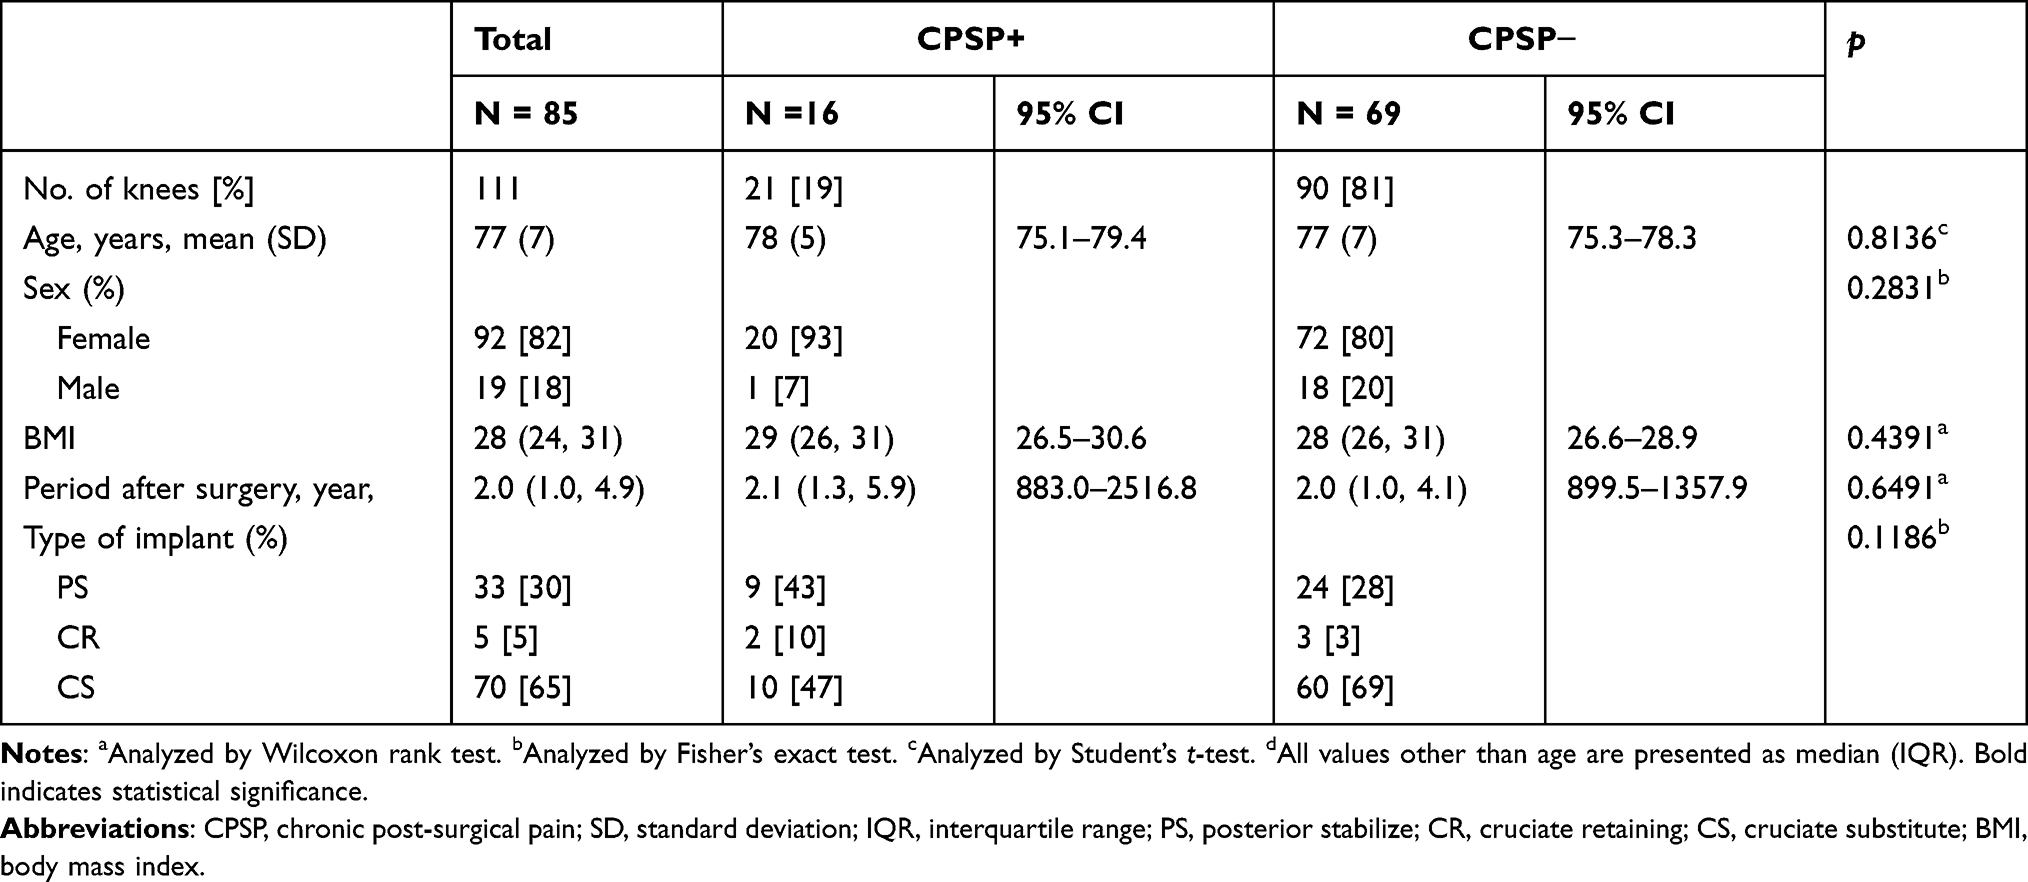 |
Table 1 Patient Demographic Data (N = 85) |
Incidence and Location of Synovitis
PD signal was observed in 85% of knees. Maximum PD grades were grades 1 and 2 observed in 60% and 25% of the knees, respectively; grade 3 was not observed. The mean (SD) total PD scores was 4.1 (4.0).
Figure 4 illustrates the prevalence rate of PD signals in mapping. Among patients with synovitis, the highest prevalence (43%) of synovitis was observed at the posterolateral femoral area (area 14), followed by the anterolateral femoral area (area 13; 36%), anterolateral tibial plateau area (area 11; 32%), anteromedial tibial plateau and inferolateral patellofemoral areas (areas 7 and 5; 29% for both), and posteromedial tibial plateau and supralateral patellofemoral areas (areas 9 and 4; 28% for both).
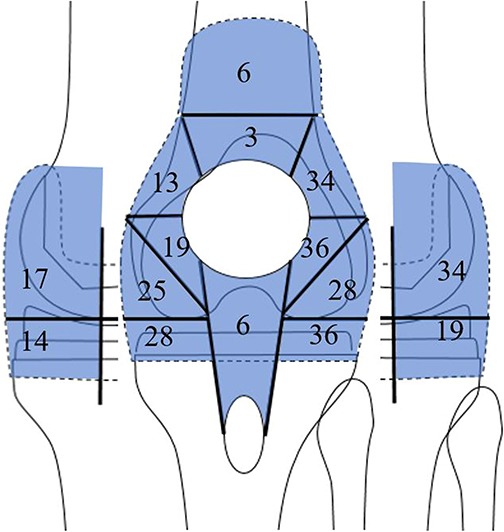 |
Figure 4 Synovitis mapping. The percentage of synovitis is shown. |
The ICC values for intra-observer and inter-observer reliability were 0.917 and 0.819, respectively, for the PD grade, indicating excellent reliability.
Factors Affecting Pain and Synovitis
The CPSP+ group had significantly higher maximum PD grade and total PD score than the CPSP− group (median maximum PD grade [IQR]: 2 [1, 2] vs 1 [1, 2], p=0.0001; median total PD score [IQR]: 6 [2, 11] vs 2 [1, 4], p=0.0002) (Table 2). Logistic regression analysis showed that only the total PD score (odds ratio=1.19, 95% confidence interval [CI]=1.01, 1.41, p=0.0424) was an independent factor for CPSP (maximum PD grade: odds ratio=2.84, 95% CI=0.903, 9.22, p=0.0758).
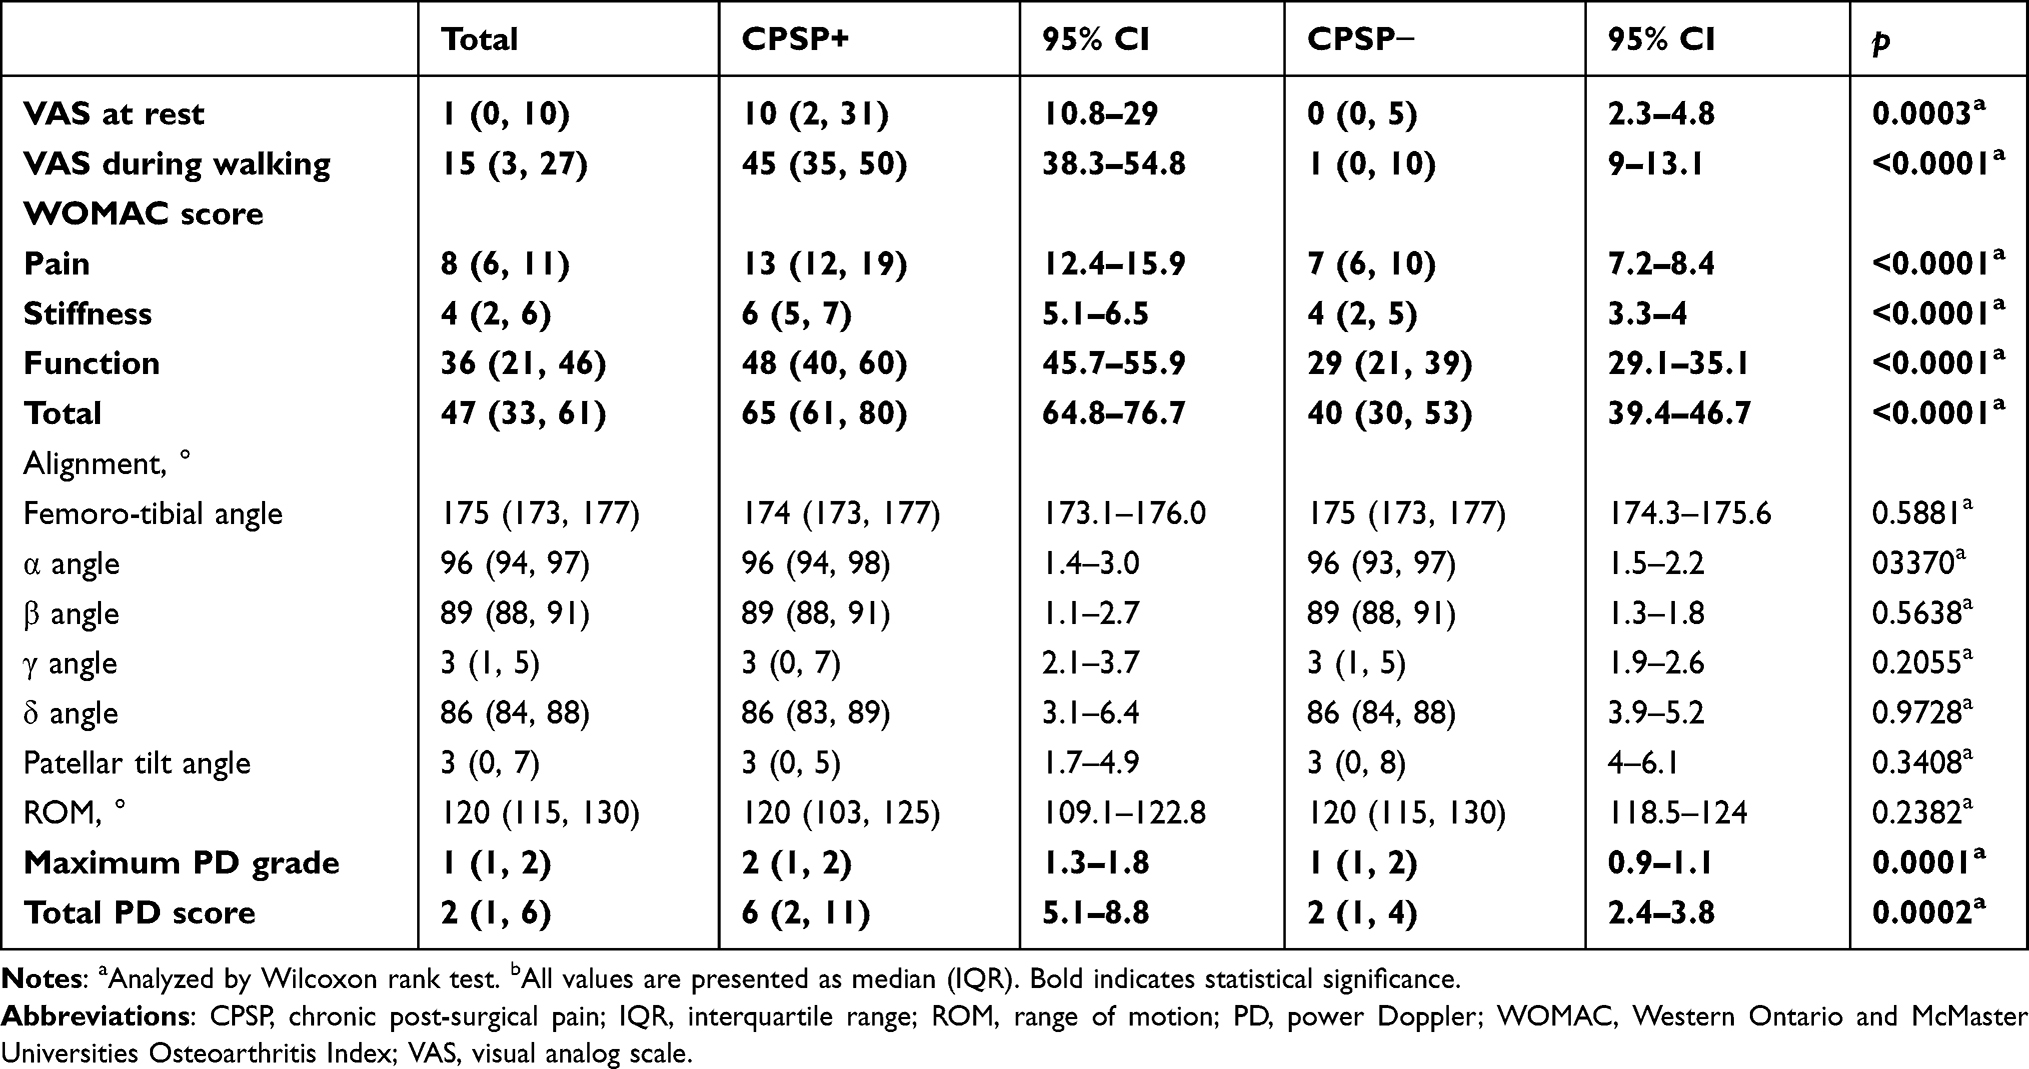 |
Table 2 Clinical, Radiographical, and Ultrasonographic Evaluation |
The WOMAC pain subscale score was significantly correlated with the total PD score (r=0.3977, p<0.0001) and maximum PD grade (r=0.2797, p=0.0029) (Table 3). Multiple regression analysis showed that only the total PD score (β=0.3822, 95% CI=0.1460, 0.6184, p=0.00176) was an independent factor for the WOMAC pain subscale (R2=0.1428, maximum PD grade: β=−0.0204, 95% CI=−0.2157, 0.2566, p=0.8643). The total PD score was correlated with all PROMs other than WOMAC functional subscale (pain VAS at rest, pain VAS during walking, WOMAC stiffness, and function subscale, and total score: r=0.3803 [p < 0.0001], 0.4399 [p < 0.0001], 0.2741 [p=0.0036], 0.1596 [p=0.0944], 0.2267 [p=0.0167], respectively).
 |
Table 3 Correlation with WOMAC Pain Subscale |
PPTs were significantly decreased in positive PD grades compared with grade 0 (Figure 5; average PPTs (SD) on grades 0, 1, and 2: 484 (21), 255 (13), 268 (20) kPa; ANOVA: p<0.001; TK: p<0.001). There was no significant difference between grades 1 and 2 (p=0.862).
 |
Figure 5 Pressure pain thresholds (PPTs) at power Doppler (PD) positive sites. Asterisks (*) indicate p value 0.01 compared with grade zero. Grade 0: G0, Grade 1: G1, Grade 2: G2. |
Regarding the factors for synovitis, the total PD score was significantly correlated with BMI (r=−0.2631, p=0.0072, Table 4), but not with any other factors.
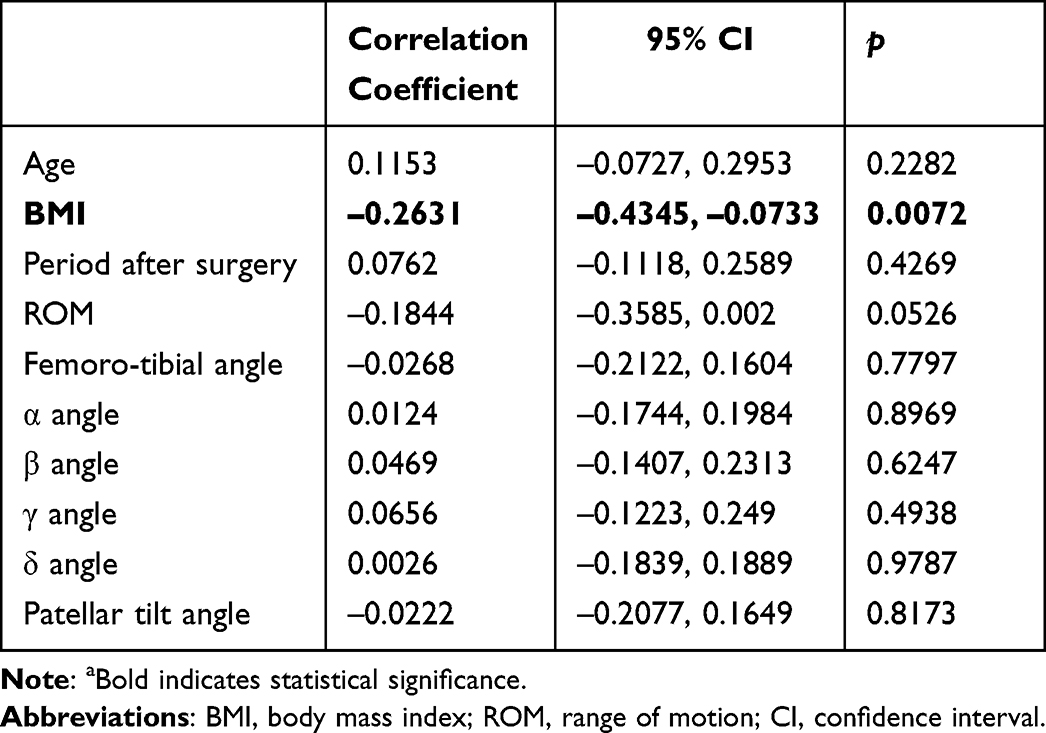 |
Table 4 Correlation with Total PD Score |
Discussion
The total PD score was an independent factor for the WOMAC pain subscale score and CPSP in multivariable analyses. PPTs in the positive PD area significantly decreased compared with those in the negative PD areas. These results indicate the association between synovitis after TKA and pain. To our knowledge, this is the first study to show that PD signals on ultrasonography after TKA is one of the independent factors associated with CPSP.
In knee osteoarthritis without prosthesis, synovitis detected using PD ultrasonography,11 grayscale ultrasonography,27 or MRI8,28,29 is the primary pathological lesion that has been consistently associated with pain. Korien et al showed synovitis findings on MRI (Hoffa synovitis and effusion synovitis) are independent factors for CPSP 6 months after TKA in multivariable regression analysis. Our results support the association between synovitis and CPSP after TKA. Although MRI is affected by metal artifacts, PD ultrasonography can detect synovitis adjacent to metal implants. PD ultrasonography may be suitable for repeated assessment of local synovitis (eg, pre-, post-treatment, and chronological assessment) because it is an inexpensive and non-invasive imaging method.
Although the total PD scores and maximum PD grade were correlated with the WOMAC pain subscales, multivariable regression analysis showed that only the total PD score was an independent pain indicator. This result suggests that knee pain may be more affected by the sum of inflammation in the entire knee (total PD score) than by the spotted inflammation with maximum PD grade. According to an MRI study of knee osteoarthritis patients, larger bone marrow lesions are associated with significant knee pain.30 It is expected that significant deformities naturally result in substantial pain.31 Knee joints have a larger intra-articular space than the smaller joints, such as the interphalangeal joints, and the grades obtained from a single field of ultrasonographic view may not be sufficient to adequately assess inflammation of the entire joint. Our study revealed that 85% of knees had synovitis, and the median total PD score in the CPSP− group (81% of our cohort) was 2 (1, 4), indicating that mild synovitis may not lead to significant pain issues.
Herein, the localization of synovitis was not specific; however, more synovitis was observed in the patellofemoral joint than in the peri-meniscal region in a previous osteoarthritis study.32 This result may imply the difference in the origin of synovitis between osteoarthritis and after TKA. This conjecture is reasonable because cartilage debris and subchondral bone edema are major causes of synovitis in osteoarthritis;33 however, all cartilage and subchondral bone are removed in TKA.
Regarding the analysis of the causes of synovitis after TKA, only BMI showed a negative correlation with the total PD score. This result is consistent with that of a study evaluating the relationship between obesity and the PD score in rheumatoid arthritis, reporting that obesity is associated with a lower PD score.34 In rheumatoid arthritis, this phenomenon is attributed to the protective effects of adipocytes on synovial tissue and the anti-inflammatory properties of adiponectin and estrogen,35 and these mechanisms could affect synovitis after TKA in patients with obesity. Recently, Giordano et al reported long non-coding RNA regulating the expression of genes related to the inflammatory process in patients undergoing TKA.36 Thus, further studies including possible factors (eg, pre-operative synovitis, post-operative inflammation, and epigenetic factor) are necessary to investigate the causes of synovitis after TKA.
This study had some limitations. First, the number of study participants was relatively small. Second, our participants underwent surgery in several institutions, reducing the generalizability of our results. Third, this study lacked preoperative information; previous studies have shown that preoperative pain conditions can cause CPSP after TKA.26,37,38 Fourth, this study lacked the assessment of sensitization, which is associated with CPSP and synovitis.16 Further investigation using a prospective longitudinal observational study design with more patients and more confounding factors for CPSP and synovitis after TKA is warranted. Fifth, the reliability of ultrasonography can be influenced by factors such as the skill and experience of operators, imaging techniques used, and specific context or condition being examined. The intra- and inter-observer reliability of this study was high as 0.917 and 0.819, respectively. The intra-observer and inter-observer reliability of still-image interpretation in ultrasonography for synovitis detection in RA is generally high, particularly for PD.39 Therefore, assessment of synovitis with PD ultrasonography can be reliable.
Conclusions
Our study demonstrates the utility of PD ultrasonography in assessing synovitis and its relationship with post-TKA CPSP. We discovered a significant correlation between total PD score and WOMAC pain subscale and a higher PD grade and total PD score in the CPSP+ group. Additionally, we observed decreased PPTs in positive PD areas. These findings suggest that the total PD score may be a useful indicator for pain assessment after TKA. The results of our study emphasize the potential value of PD ultrasonography as a beneficial tool in managing post-TKA pain, suggesting new avenues for future research.
Abbreviations
TKA, total knee arthroplasty; VAS, visual analog scale; PD, power Doppler; PPTs, pressure pain thresholds; BMI, body mass index; ROM, range of motion; SD, standard deviation; MRI, magnetic resonance imaging; PROMs, patient-reported outcome measures; WOMAC, Western Ontario and McMaster Universities Osteoarthritis Index; CPSP, chronic postsurgical pain; CI, confidence interval; ICC, intraclass correlation coefficient; IQR, interquartile range; TK, Tukey–Kramer; ANOVA, analysis of variance.
Data Sharing Statement
The datasets used and analyzed during the current study are available from the corresponding author.
Ethics Approval and Informed Consent
The study procedures were approved by the Ethical Review Board of our facilities (IRB numbers: Hata Prefectural Hospital, 31-280; Kochi university, ERB-105784).
Author Contributions
All authors made a significant contribution to the work reported, whether that is in the conception, study design, execution, acquisition of data, analysis and interpretation, or in all these areas; took part in drafting, revising or critically reviewing the article; gave final approval of the version to be published; have agreed on the journal to which the article has been submitted; and agree to be accountable for all aspects of the work.
Funding
The study did not receive any funding from commercial or non-commercial sources.
Disclosure
The authors report no conflicts of interest regarding this work.
References
1. Schwartz AM, Farley KX, Guild GN, Bradbury TL. Projections and epidemiology of revision Hip and knee arthroplasty in the United States to 2030. J Arthroplasty. 2020;35(6S):S79–S85. doi:10.1016/j.arth.2020.02.030
2. Skou ST, Roos EM, Laursen MB, et al. Total knee replacement and non-surgical treatment of knee osteoarthritis: 2-year outcome from two parallel randomized controlled trials. Osteoarthr Cartil. 2018;26(9):1170–1180. doi:10.1016/j.joca.2018.04.014
3. Siviero P, Marseglia A, Biz C, et al. Quality of life outcomes in patients undergoing knee replacement surgery: longitudinal findings from the QPro-Gin study. BMC Musculoskelet Disord. 2020;21(1):436. doi:10.1186/s12891-020-03456-2
4. Wylde V, Beswick A, Bruce J, Blom A, Howells N, Gooberman-Hill R. Chronic pain after total knee arthroplasty. EFORT Open Rev. 2018;3(8):461–470. doi:10.1302/2058-5241.3.180004
5. Baker PN, van der Meulen JH, Lewsey J, Gregg PJ; National Joint Registry for England and Wales. The role of pain and function in determining patient satisfaction after total knee replacement. Data from the National Joint Registry for England and Wales. J Bone Joint Surg Br. 2007;89(7):893–900. doi:10.1302/0301-620X.89B7.19091
6. Brander VA, Stulberg SD, Adams AD, et al. Predicting total knee replacement pain: a prospective, observational study. Clin Orthop Relat Res. 2003;416:27–36. doi:10.1097/01.blo.0000092983.12414.e9
7. Elson DW, Brenkel IJ. A conservative approach is feasible in unexplained pain after knee replacement: a selected cohort study. J Bone Joint Surg Br. 2007;89(8):1042–1045. doi:10.1302/0301-620X.89B8.19389
8. Yusuf E, Kortekaas MC, Watt I, Huizinga TW, Kloppenburg M. Do knee abnormalities visualised on MRI explain knee pain in knee osteoarthritis? A systematic review. Ann Rheum Dis. 2011;70(1):60–67. doi:10.1136/ard.2010.131904
9. Aso K, Shahtaheri SM, Hill R, Wilson D, McWilliams DF, Walsh DA. Associations of symptomatic knee osteoarthritis with histopathologic features in subchondral bone. Arthritis Rheumatol. 2019;71(6):916–924. doi:10.1002/art.40820
10. Baker K, Grainger A, Niu J, et al. Relation of synovitis to knee pain using contrast-enhanced MRIs. Ann Rheum Dis. 2010;69(10):1779–1783. doi:10.1136/ard.2009.121426
11. Riecke BF, Christensen R, Torp-Pedersen S, Boesen M, Gudbergsen H, Bliddal H. An ultrasound score for knee osteoarthritis: a cross-sectional validation study. Osteoarthritis Cartilage. 2014;22(10):1675–1691. doi:10.1016/j.joca.2014.06.020
12. Takahashi M, Miyamoto S, Nagano A. Arthroscopic treatment of soft-tissue impingement under the patella after total knee arthroplasty. Arthroscopy. 2002;18(4):E20. doi:10.1053/jars.2002.31968
13. Diduch DR, Scuderi GR, Scott WN, Insall JN, Kelly MA. The efficacy of arthroscopy following total knee replacement. Arthroscopy. 1997;13(2):166–171. doi:10.1016/s0749-8063(97)90150-x
14. Ohdera T, Tokunaga M, Hiroshima S, Yoshimoto E, Matsuda S. Recurrent hemarthrosis after knee joint arthroplasty: etiology and treatment. J Arthroplasty. 2004;19(2):157–161. doi:10.1016/j.arth.2003.09.009
15. Ravi B, Hosack L, Backstein D, Spangehl M. Recurrent hemarthrosis after total Knee arthroplasty: evaluation and treatment. J Am Acad Orthop Surg. 2019;27(17):652–658. doi:10.5435/JAAOS-D-18-00182
16. Kurien T, Kerslake RW, Graven-Nielsen T, et al. Chronic postoperative pain after total knee arthroplasty: the potential contributions of synovitis, pain sensitization and pain catastrophizing-An explorative study. Eur J Pain. 2022;26(9):1979–1989. doi:10.1002/ejp.2018
17. Takase K, Ohno S, Takeno M, et al. Simultaneous evaluation of long-lasting knee synovitis in patients undergoing arthroplasty by power Doppler ultrasonography and contrast-enhanced MRI in comparison with histopathology. Clin Exp Rheumatol. 2012;30(1):85–92.
18. Bellamy N, Buchanan WW, Goldsmith CH, Campbell J, Stitt LW. Validation study of WOMAC: a health status instrument for measuring clinically important patient relevant outcomes to antirheumatic drug therapy in patients with osteoarthritis of the Hip or knee. J Rheumatol. 1988;15(12):1833–1840.
19. Hashimoto H, Hanyu T, Sledge CB, Lingard EA. Validation of a Japanese patient-derived outcome scale for assessing total knee arthroplasty: comparison with Western Ontario and McMaster Universities osteoarthritis index (WOMAC). J Orthop Sci. 2003;8(3):288–293. doi:10.1007/s10776-002-0629-0
20. Downie WW, Leatham PA, Rhind VM, Wright V, Branco JA, Anderson JA. Studies with pain rating scales. Ann Rheum Dis. 1978;37(4):378–381. doi:10.1136/ard.37.4.378
21. Iagnocco A, Meenagh G, Riente L, et al. Ultrasound imaging for the rheumatologist XXIX. Sonographic assessment of the knee in patients with osteoarthritis. Clin Exp Rheumatol. 2010;28(5):643–646.
22. Riente L, Delle Sedie A, Filippucci E, et al. Ultrasound Imaging for the rheumatologist XXVII. Sonographic assessment of the knee in patients with rheumatoid arthritis. Clin Exp Rheumatol. 2010;28(3):300–303.
23. Ewald FC. The Knee Society total knee arthroplasty roentgenographic evaluation and scoring system. Clin Orthop Relat Res. 1989;248:9–12. doi:10.1097/00003086-198911000-00003
24. Collins SL, Moore RA, McQuay HJ. The visual analogue pain intensity scale: what is moderate pain in millimetres? Pain. 1997;72(1–2):95–97. doi:10.1016/s0304-3959(97)00005-5
25. Landis JR, Koch GG. The measurement of observer agreement for categorical data. Biometrics. 1977;33(1):159–174. doi:10.2307/2529310
26. Lewis GN, Rice DA, McNair PJ, Kluger M. Predictors of persistent pain after total knee arthroplasty: a systematic review and meta-analysis. Br J Anaesth. 2015;114(4):551–561. doi:10.1093/bja/aeu441
27. Abbasi B, Pezeshki-Rad M, Akhavan R, Sahebari M. Association between clinical and sonographic synovitis in patients with painful knee osteoarthritis. Int J Rheum Dis. 2017;20(5):561–566. doi:10.1111/1756-185X.12834
28. Hunter DJ, Guermazi A, Roemer F, Zhang Y, Neogi T. Structural correlates of pain in joints with osteoarthritis. Osteoarthritis Cartilage. 2013;21(9):1170–1178. doi:10.1016/j.joca.2013.05.017
29. Hunter DJ, Zhang W, Conaghan PG, et al. Systematic review of the concurrent and predictive validity of MRI biomarkers in OA. Osteoarthritis Cartilage. 2011;19(5):557–588. doi:10.1016/j.joca.2010.10.029
30. Driban JB, Price L, Lo GH, et al. Evaluation of bone marrow lesion volume as a knee osteoarthritis biomarker--longitudinal relationships with pain and structural changes: data from the Osteoarthritis Initiative. Arthritis Res Ther. 2013;15(5):R112. doi:10.1186/ar4292
31. Biz C, Maso G, Gambato M, et al. Challenging surgical treatment of displaced articular tibial plateau fractures: do early knee radiographic features have a predictive value of the mid-term clinical functional outcomes? Orthop Surg. 2019;11(6):1149–1162. doi:10.1111/os.12577
32. Nanus DE, Badoume A, Wijesinghe SN, et al. Synovial tissue from sites of joint pain in knee osteoarthritis patients exhibits a differential phenotype with distinct fibroblast subsets. EBioMedicine. 2021;72:103618. doi:10.1016/j.ebiom.2021.103618
33. Hugle T, Geurts J. What drives osteoarthritis? Synovial versus subchondral bone pathology. Rheumatology. 2017;56(9):1461–1471. doi:10.1093/rheumatology/kew389
34. Bauer EM, Ben-Artzi A, Duffy EL, et al. Joint-specific assessment of swelling and power Doppler in obese rheumatoid arthritis patients. BMC Musculoskelet Disord. 2017;18(1):99. doi:10.1186/s12891-017-1406-7
35. Giles JT, Allison M, Bingham CO, Scott WM, Bathon JM. Adiponectin is a mediator of the inverse association of adiposity with radiographic damage in rheumatoid arthritis. Arthritis Rheum. 2009;61(9):1248–1256. doi:10.1002/art.24789
36. Giordano R, Petersen KK, Santoro M, et al. Circulating long non-coding RNA signature in knee osteoarthritis patients with postoperative pain one-year after total knee replacement. Scand J Pain. 2021;21(4):823–830. doi:10.1515/sjpain-2021-0069
37. Aso K, Ikeuchi M, Takaya S, et al. Chronic postsurgical pain after total knee arthroplasty: a prospective cohort study in Japanese population. Mod Rheumatol. 2021;31(5):1038–1044. doi:10.1080/14397595.2020.1859709
38. Neogi T, Guermazi A, Roemer F, et al. Association of joint inflammation with pain sensitization in knee osteoarthritis: the multicenter osteoarthritis study. Arthritis Rheumatol. 2016;68(3):654–661. doi:10.1002/art.39488
39. Cheung PP, Dougados M, Gossec L. Reliability of ultrasonography to detect synovitis in rheumatoid arthritis: a systematic literature review of 35 studies (1415 patients). Arthritis Care Res. 2010;62(3):323–334. doi:10.1002/acr.20102
 © 2023 The Author(s). This work is published and licensed by Dove Medical Press Limited. The
full terms of this license are available at https://www.dovepress.com/terms
and incorporate the Creative Commons Attribution
- Non Commercial (unported, 3.0) License.
By accessing the work you hereby accept the Terms. Non-commercial uses of the work are permitted
without any further permission from Dove Medical Press Limited, provided the work is properly
attributed. For permission for commercial use of this work, please see paragraphs 4.2 and 5 of our Terms.
© 2023 The Author(s). This work is published and licensed by Dove Medical Press Limited. The
full terms of this license are available at https://www.dovepress.com/terms
and incorporate the Creative Commons Attribution
- Non Commercial (unported, 3.0) License.
By accessing the work you hereby accept the Terms. Non-commercial uses of the work are permitted
without any further permission from Dove Medical Press Limited, provided the work is properly
attributed. For permission for commercial use of this work, please see paragraphs 4.2 and 5 of our Terms.