Back to Journals » Neuropsychiatric Disease and Treatment » Volume 18
Association Between Non-Suicidal Self-Injury and Gut Microbial Characteristics in Chinese Adolescent
Authors Cai L ![]() , Wang S, Hou C, Li Z
, Wang S, Hou C, Li Z ![]() , Liao Y, Jia FJ
, Liao Y, Jia FJ
Received 30 January 2022
Accepted for publication 3 June 2022
Published 1 July 2022 Volume 2022:18 Pages 1315—1328
DOI https://doi.org/10.2147/NDT.S360588
Checked for plagiarism Yes
Review by Single anonymous peer review
Peer reviewer comments 2
Editor who approved publication: Dr Yu-Ping Ning
Li-Fei Cai,1,2 Shi-Bin Wang,2 Cai-Lan Hou,2 Ze-Bin Li,1 Yi-Jun Liao,1 Fu-Jun Jia1,2
1The Second School of Clinical Medicine, Southern Medical University, Guangzhou, Guangdong Province, People’s Republic of China; 2Guangdong Mental Health Center, Guangdong Provincial People’s Hospital, Guangdong Academy of Medical Sciences, Guangzhou, Guangdong Province, People’s Republic of China
Correspondence: Fu-Jun Jia, Guangdong Mental Health Center, Guangdong Provincial People’s Hospital, Guangdong Academy of Medical Sciences, Guangzhou, Guangdong Province, People’s Republic of China, Tel +86-13609049731, Fax +86-02081884713, Email [email protected]
Purpose: By exploring the gut-related microbiota differences of adolescents with non-suicidal self-injury (NSSI) and depression (without NSSI) and healthy volunteers, we provide a theoretical basis for the prevention and control of NSSI in adolescents through intestinal microecological regulation.
Patients and Methods: A total of 99 subjects were recruited in Guangdong Province, China, including 51 adolescents with NSSI (KD), 24 healthy adolescents (NOR1), and 24 depression adolescents without NSSI (NOR2). General clinical data and fecal samples were collected from all subjects, who were assessed using the NSSI Behavioral Questionnaire and the 24-item Hamilton Depression Scale. The taxonomic composition of the gut microbiota was determined using the 16S rDNA gene sequencing method.
Results: There were significant differences in diversity between the KD and NOR1, and the species uniformity index of the KD according to the Shannon and Simpson indices was significantly reduced compared with that of the NOR1 (4.81 vs 5.21, p< 0.01; 0.02 vs 0.01, p< 0.05). The relative abundances were different among the KD, NOR1 and NOR2, as reflected at the taxonomic levels of class, order, family, genus, and species. Bacteroides were the dominant flora of the KD and NOR2, while Mitsuokella was the dominant flora that distinguished the KD from the NOR2.
Conclusion: We found that gut microbiota diversity was decreased in adolescents with NSSI, and the relative abundance was altered at different taxonomic levels. These results enrich the understanding of the relationship between NSSI and depression and the gut microbiota, Supporting that NSSI and depression are not homologous disorders. What is more, it establishes the basis for exploring the mechanisms of flora action in NSSI, providing a possible direction for NSSI to achieve a better prognosis and prevent relapse.
Keywords: NSSI, gut microbiota, depression, adolescents
Graphical Abstract:

Introduction
Non-suicidal self-injury (NSSI) is defined as a direct, repetitive, and socially unacceptable injury to one’s own body tissue but with no suicidal ideation.1 This includes cutting, scratching or burning the surface of the body as well as hitting objects, causing direct injuries to the skin or bone.NSSI has been redefined as an independent clinical disorder in the Diagnostic and Statistical Manual of Mental Disorders, Fifth Edition (DSM-5). According to a meta-analysis, the average lifetime prevalence of NSSI occurring at least once in school students around the world was 17.2% (range 8.0–26.3%), and the detection rate of NSSI in adolescents in mainland China was 5.4%-44.3%.2,3 Previous studies have shown that the hypothalamic–pituitary–adrenal (HPA) axis, endogenous opioid system abnormalities and gene (eg, LC6A4 gene) interactions with the environment are associated with NSSI.4–7 Although these mechanisms remain inconclusive, a neurobiological bias shows evidence for NSSI.NSSI has a high incidence in the adolescent population and is a complex social problem.8 Although the understanding of the neurobiological basis of NSSI has improved substantially over the past 5 years, its etiology and its subsequent treatment options remain unclear. Moreover, NSSI significantly increases the risk of suicide,9 seriously endangering the psychosomatic mental health of adolescents and constitutes a significant public health risk.This requires us to better understand and identify the related factors and elucidate the pathogenesis, which bases the development and implementation of appropriate interventions and to prevent NSSI.
Recently, the role of the brain-gut-microbiota axis in maintaining physical and mental health has attracted much attention.As a bidirectional modulation system, this axis builds a bridge between the brain and the gut through the nervous system, immune system and endocrine system. A growing number of studies have shown that human cognition and emotion are influenced through the brain-gut axis, and that the gut microbiome can affect brain function and behavior.10 Many studies have shown that gut microbiota has a specific structure in neuropsychiatric diseases. Preliminary studies have explored the relationship between gut microbiota and psychiatric disorders such as depression,11 autism,12 Attention Deficit Hyperactivity Disorder (ADHD),13 and eating disorders.14 Gut microbiota is expected to be a new target for the treatment of psychosomatic diseases.The etiology and mechanism of various mental diseases are unknown, and the application of gut microbiota in mental diseases is still in its initial stage.
NSSI is included as a diagnosis of independent disease in DSM-5, but this division is continuously debated.There are no clear neurobiological markers for NSSI.The presence of neuroendocrine and neurotransmitter changes in adolescents with NSSI suggests a possible imbalance in intestinal flora.To the best of our knowledge, the relationship between NSSI and gut microbiota has not been reported in the literature. Therefore, we designed this topic to use PCR testing to detect the diversity and abundance of gut microbiota in adolescents with NSSI and adolescents with depression without NSSI.The first goal is to test whether the gut microbiota of NSSI and depression is the same, and also focuses on exploring the relationship between NSSI and gut microbiota, which establishes the basis for further revealing the mechanism of action of gut microbiota and provides a new possible target for the treatment in NSSI.
Materials and Methods
Study Population and Procedures
This study was a controlled trial performed at Guangdong Provincial People’s Hospital from November 2020 to November 2021. Considering the young age of the participants, parents or guardians could be allowed to participate in the assessment of health and mental status before or during the study, as well as assisting with the relevant questionnaires.The patients included 51 adolescents with NSSI in the experimental group, Set as NSSI group (KD), 24 healthy adolescent participants in control group 1 (NOR1) and 24 depressed adolescents without NSSI in control group 2 (NOR2). All patients provided an informed consent form prior to participating in this study. We trained the investigator on scale consistency before evaluation. Inclusion criteria for KD include: (1) Age was 12–18 years old; (2) Consistent with the NSSI diagnosis in DSM-5. Exclusion criteria include: (1) Taking oral intestinal microecological preparations, antibiotics, antipsychotic drugs, Gastrointestinal drug, or diet pills within approximately 1 month; (2) Physical infection or severe physical diseases within approximately 1 month, and history of digestive tract surgery; (3) Irritable bowel syndrome (IBS), obese patients (body mass index (BMI) > 28); (4) Vegetarians or meat eaters or severely particular eaters. Inclusion criteria for NOR1 include: Age was 12–18 years old. Exclusion criteria include:(1) Had suicidal or NSSI behavior, or attempted suicide; (2) Previous or currently suffering from mental illness and a positive family history of mental illness; (3) The rest were the same as those in KD. Inclusion criteria for NOR2 include: (1) Age was 12–18 years old; (2) Compliance with the diagnostic criteria of depressive disorder included in DSM-5. Exclusion criteria include: (1) Had suicidal or NSSI behavior, or attempted suicideI; (2) Comorbidity with other psychiatric disorders; (3) The rest were the same as those in KD.
The study protocol was approved by the Research Ethics Committee of the Guangdong Provincial People’s Hospital, Guangdong Academy of Medical Sciences (Reference number: GDREC2018470H (R1)) and all participants had signed the consent form by their parents or legal guardian prior in the survey. Our study was consistent with the Declaration of Helsinki.
Data Collection and Measurement
Before being included in the study, we assessed the participants’ physical condition and general data. All self-injury behavior and depression symptoms and initial screening of mental disorders were assessed using the NSSI Behavioral Questionnaire, the 24-item Hamilton Depression Scale (HAMD24) and the Mini-International Neuropsychiatric Interview (M.I.N.I)-Chinese Edition. These assessments were performed by a clinically experienced attending psychiatrist.
General Data Table: After collecting a detailed medical history and performing physical and mental examinations, general clinical data were collected for all subjects, including sex, age, education, height, weight, smoking, drinking habits and daily eating habits in the past 2 weeks.
NSSI Behavioral Questionnaire: Using medical history and physical examination findings, NSSI was defined as one of the following: patients had three NSSI events in the past six months, including at least one in the last 1 month, or patients had five NSSI events in the last 1 year, including at least one in the last 1 month.
HAMD24: This scale was developed by Hamilton in 1960 to assess the symptoms and their severity of patients with severe depressive disorder. The HAMD24 version of the present study was divided into seven factor classes. Most items are divided into five grades, with each item scoring between 0 and 4 points; some items are divided into three levels, with a score range of 0 to 2 points. Higher scale scores indicate worse depressive symptoms.
The Chinese version of M.I.N.I: A questionnaire based on the DSM-4 and the International Classification of Diseases, Tenth Revision (ICD-10) was used to screen and exclude diagnosis at baseline levels of psychiatric disorders. It has good reliability and validity and a short structure, and a total of 130 questions can be completed in 20 minutes.
Fecal Specimen Collection and Gene DNA Extraction
Approximately 2 g of fresh stool samples was collected in a 40 mL sterile stool collection tube (containing 1 mL of storage fluid) for inspection within 72 hours at room temperature. The stool collection process was completed by one person trained in strict aseptic procedures. Genomic DNA extraction was performed by using a QIAsymphony DSP Virus/Pathogen Midi Kit (Qiagen) within 1 week of stool collection. The 170 μL fecal samples were vortexed for 1 min at 70 °C for 5 min and vortexed for 15s at 70 °C for 10 min, and approximately 200 μL of DNA-containing samples were extracted by at least 1040μL centrifugation for 5 min and stored in a −20°C refrigerator. The process was completed by the Jinyu Medical Testing Center in Guangzhou, China.
PCR Technology and Bioinformatics Analysis
Cluster analysis was performed using 16S rDNA amplicon sequencing, which is commonly used for bacterial phylogeny and taxonomic identification.15,16 The 16S rDNA genes of different regions (16S V4/16S V3/16S V3-V4/16S V4/18S V9, Arc V4) were amplified with specific primers (16SV4:16SV4F:18SV4-706R, 18SV9:1380F-1510R, etc.). All PCRs were performed using Phusion® High-Fidelity PCR Master Mix (New England Biolabs, Ipswich, MA, USA). The mixed PCR products were purified using a Qiagen gel extraction kit (Qiagen, Dusseldorf, Germany). Sequencing libraries were generated using the US kit (Illumina, San Diego, CA, USA). Library quality control was performed using a Qubit 2.0 fluorometer (Thermal Science, WA, MA, USA) and the Agilent Bioanalyzer 2100 System (Agilent Technologies, Beijing, China).17 Library on-board sequencing was performed using the Illumina HiSeq 2500 (Illumina, San Diego, CA, USA) platform. Raw data were processed to obtain high-quality tag data. The UPARSE software (UPARSE v7.0.1001, http://drive5.com/uparse/) was used to cluster sequences into operational taxonomic unit (OTU) with 97% consistency, and the most frequent sequences were selected as representative sequences.18 A species accumulation curve (species accumulation curves) was created by performing OTU PCA (Principal Component Analysis, PCA) using the ade4 package in R (v3.6.1). Using QIIME software (Version 1.7.0, http://qiime.org/), the alpha diversity index was calculated for the species, including the observed species index, Chao index, ACE index, Shannon index, and Simpson index. The linear discriminant analysis (LDA) effect size (LEfSe) analysis software (http://huttenhower.sph.harvard. edu/galaxy/root/index) was used to analyze statistically significant differences in relative abundance between groups. Species annotation analysis of representative sequences of OTUs was performed using the Mothur method (set threshold of 0.8) to obtain taxonomic information and community compositions of the phyla, class, order, family, genus, and species.19
Statistical Analysis
Statistical analysis was performed using QIIME,20 the bioinformatics platforms Galaxy,21 SPSS 24.0 and GraphPad Prism 9.0. Normality hypothesis was assessed using the Shapiro–Wilk test. Parameter-free tests were chosen throughout the analysis assumptions of normal distribution were violated in several variables.General data comparison: the sex between subgroups was analyzed by chi-square test, and the Kruskal–Wallis test for age and BMI.Diversity analysis: Alpha comparisons between subgroups passed the Mann–Whitney U-test. Abundance difference and difference species screening analysis: Through LEfSe, LDA method and significant difference standard test (using Kruskal–Wallis test and pairwise Wilcoxon test) were applied to compare and feature selection of abundance differences between subgroups. Abundance analysis of different taxonomic information: Groups were significantly analyzed by using Metastats software (http://metastats.cbcb.umd. edu /).The two-tailed p value of <0.05 indicated statistical significance.
Results
General Information
A total of 99 patients were enrolled, including 51 in the KD and 24 in each of the control groups (NOR1 and NOR2). There were no significant differences in sex, age, or BMI among the KD, NOR1, and NOR2 (Table 1).
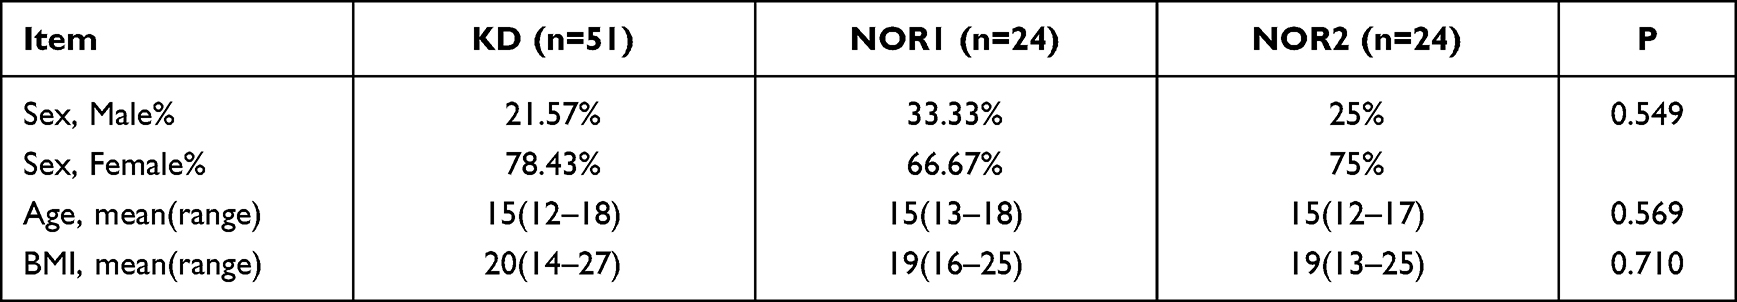 |
Table 1 Differences in Sex, Age and BMI Among the Three Groups |
After 16S rDNA sequencing of 99 fecal samples, a total of 20,982,690 original gene sequences were selected. After optimization, 20,841,749 high-quality gene sequences were obtained, with an average of 210,522 reads per sample. To prevent sequence diversity, we clustered sequences with high comparability into an OTU. After clustering, a total of 10,287 units were obtained.
Species accumulation curves are used to describe the increase in species with increasing sampling size and, widely used when examining sampling adequacy and estimating species richness. When the curve tends to be flat, a sufficient sampling quantity is indicated (Figure 1).
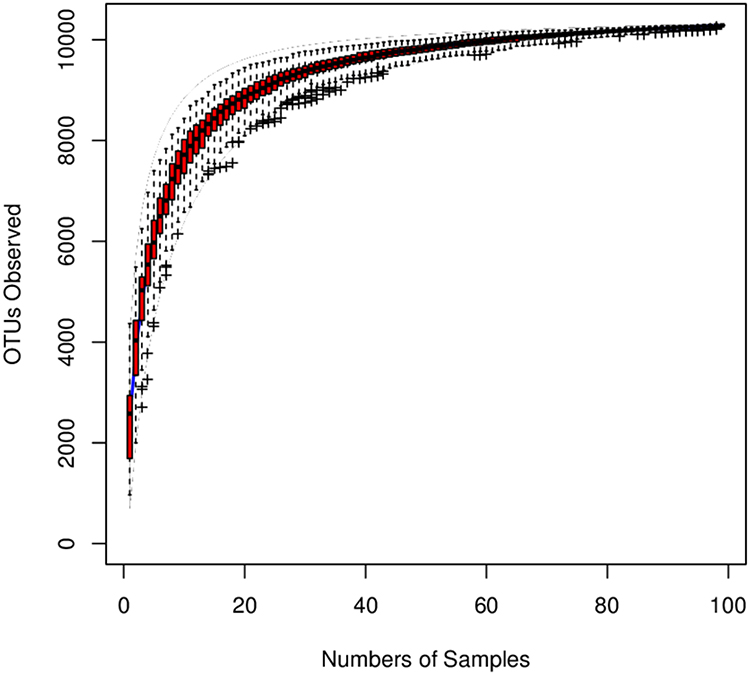 |
Figure 1 Species accumulation curves for the sample: species accumulation curves is used to describe the status of increasing species with increasing sampling volume and is an effective tool for understanding species composition and predicting species richness in survey plots. It is widely used for judgments of sampling adequacy as well as estimation of species richness in biodiversity and community surveys. According to the extracted sample, the number of non-redundant OTU is calculated for the sample group, and the number of statistical samples is taken as the abscissa, and the number of non-redundant OTU for the sample group is calculated as the ordinate. Mapping was performed using the R (v3.6.1) software. As visible by the figure the curve tends to be flat, suggesting that the sampling quantity was sufficient. |
The number of OTUs per sample was obtained at 97% similarity. In total, there were 10,287 OTUs, with the KD, NOR1, and NOR2 having 9850, 9316, and 8850, respectively, with no significant difference in the number of OTUs among the three groups.
Alpha Diversity Analysis Among the Three Groups
Differences in the Shannon and Simpson diversity indices were statistically significant between groups (Table 2), with significantly lower species uniformity in the KD than in the NOR1 and poor community diversity in the KD (4.81 vs 5.21, p<0.01; 0.02 vs 0.01, p <0.05) (Table 3). There was no significant difference between the KD and NOR2 or between the NOR1 and NOR2 (all p> 0.05) (Tables 4 and 5).
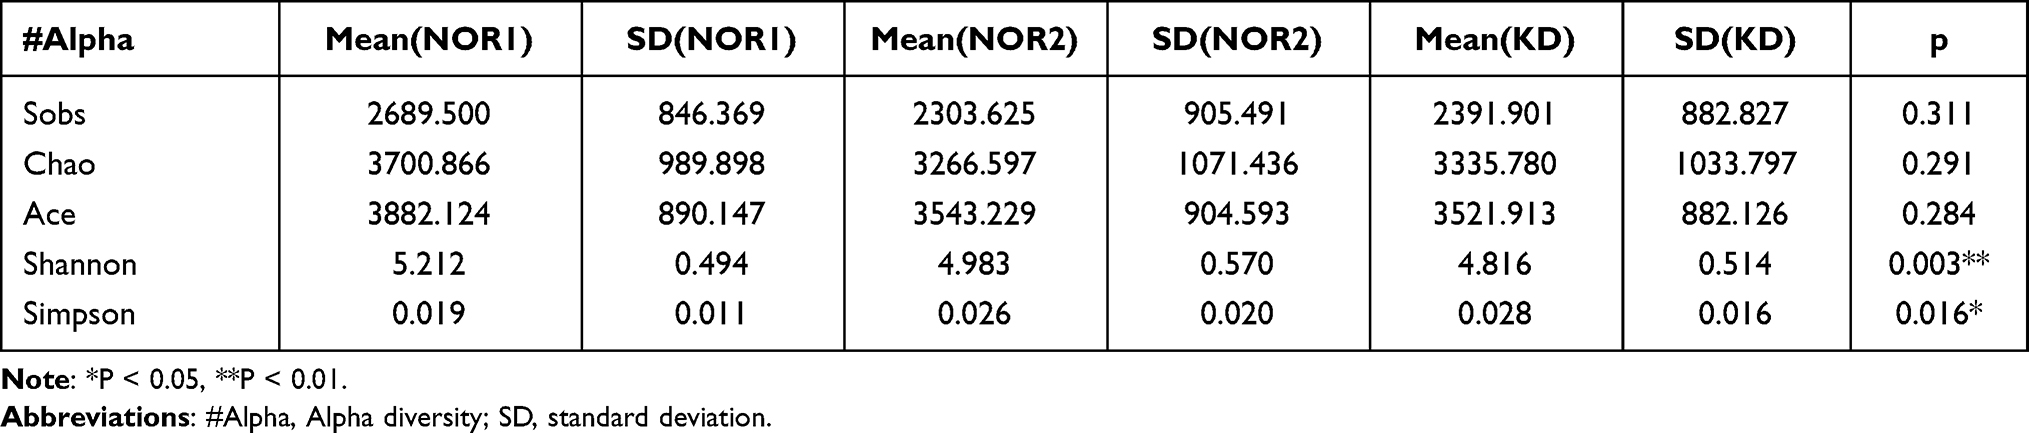 |
Table 2 Comparison of the Alpha Diversity Indices for the Three Groups |
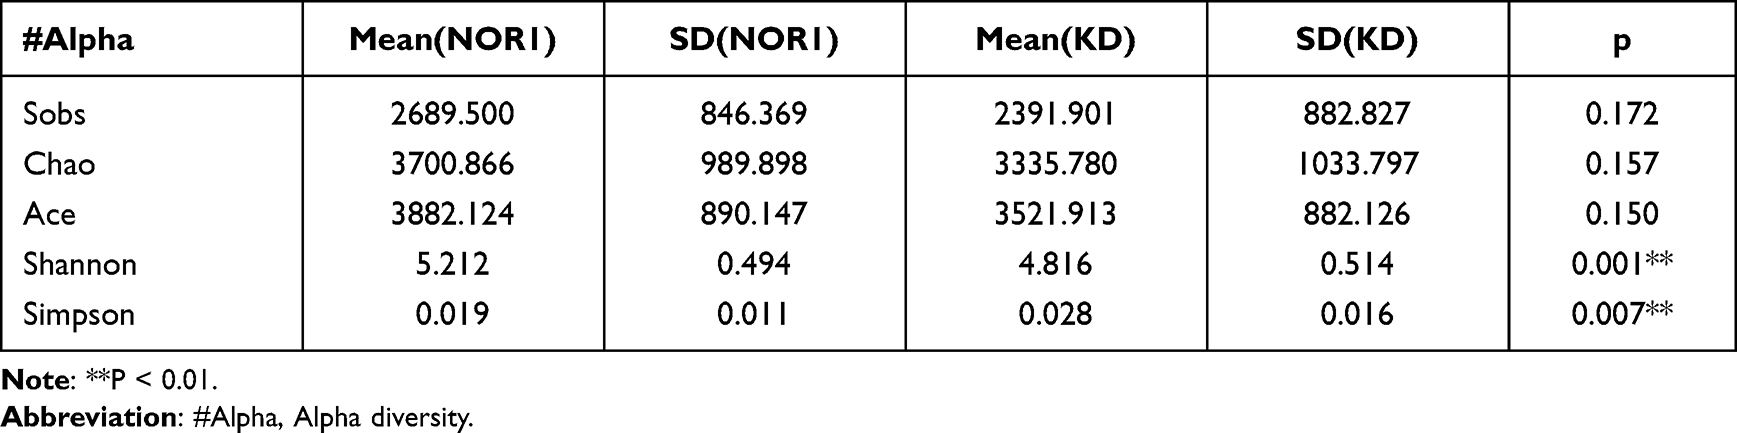 |
Table 3 Comparison of the Alpha Diversity Indices for the NOR1 vs KD |
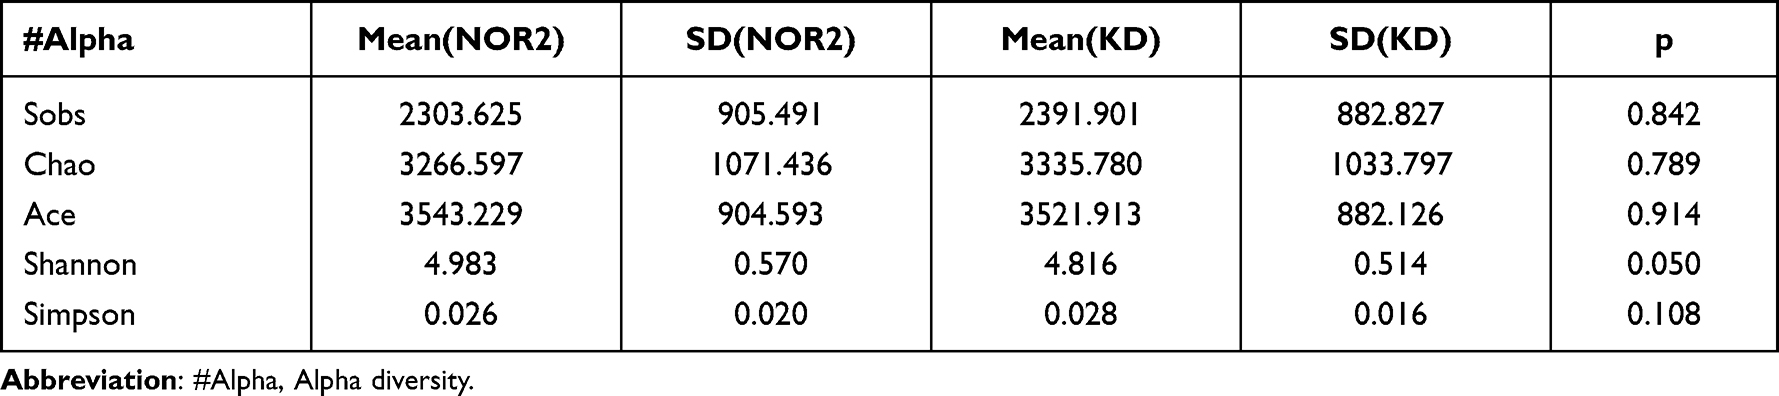 |
Table 4 Comparison of the Alpha Diversity Indices for the NOR2 vs KD |
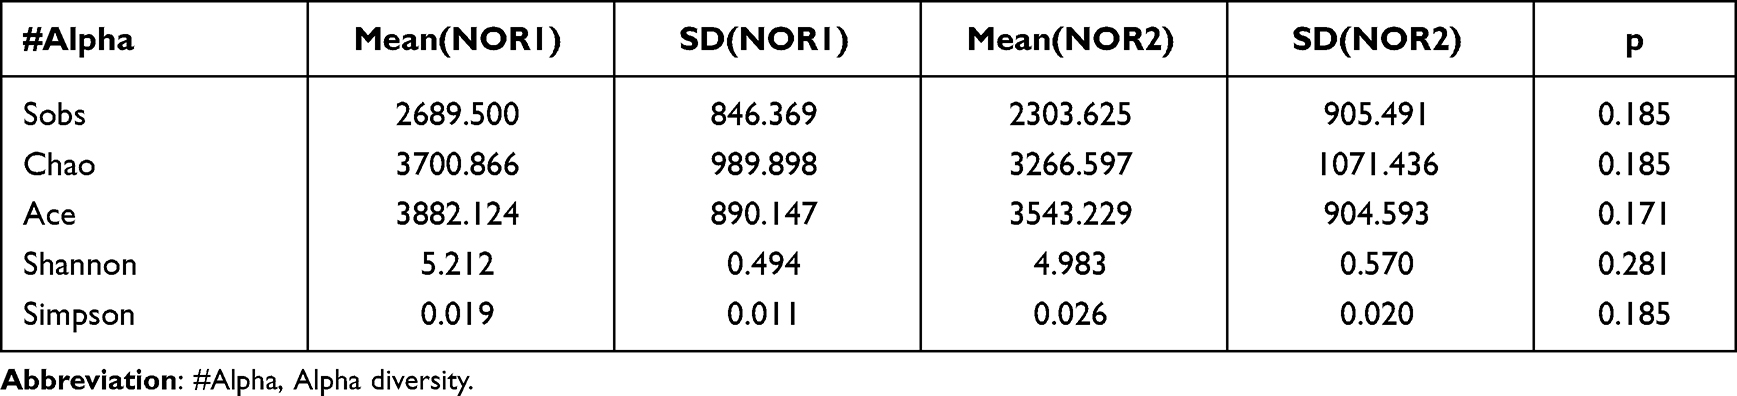 |
Table 5 Comparison of the Alpha Diversity Indices for the NOR1 vs NOR2 |
Relative Abundance Comparison Performed by LEfSe Analysis
LEfSe analysis is a method to determine bacteria most likely to explain differences between classes by coupling standard tests for statistical significance with additional tests encoding effect relevance. It can detect important features and sort functional features based on effect values. These functional properties could explain most of the biological differences at the top. The following are the bacterial colonies selected within the top 10 of the abundance ranking at the taxonomic level.
KD vs NOR1 comparison: The KD contained more Bacteroides, Streptococcus_gallolyticus_subsp_macedonicus, Eubacterium_ruminantium_group, Anaerostipes, Flavonifractor, Burkholderiales, Betaproteobacteria than in the NOR1. While the Collinsella, Eubacterium_rectale_group, Mollicutes RF9, Prevotella_2, Collinsella_aerofaciens, Christensenellaceae and R_7 group, Lachnospiraceae_NK4A136_group, Ruminococcaceae_UCG_002 Eubacterium_coprostanoligenes_group, Bifidobacterium_sp_MC_4 were lower in the KD than the NOR1. These differences were all statistically significant (all P<0.05). According to the LDA score, Polymorphobacteria and Bacterioidaceae were the more dominant bacterias in the KD than the NOR1 (Figure 2).
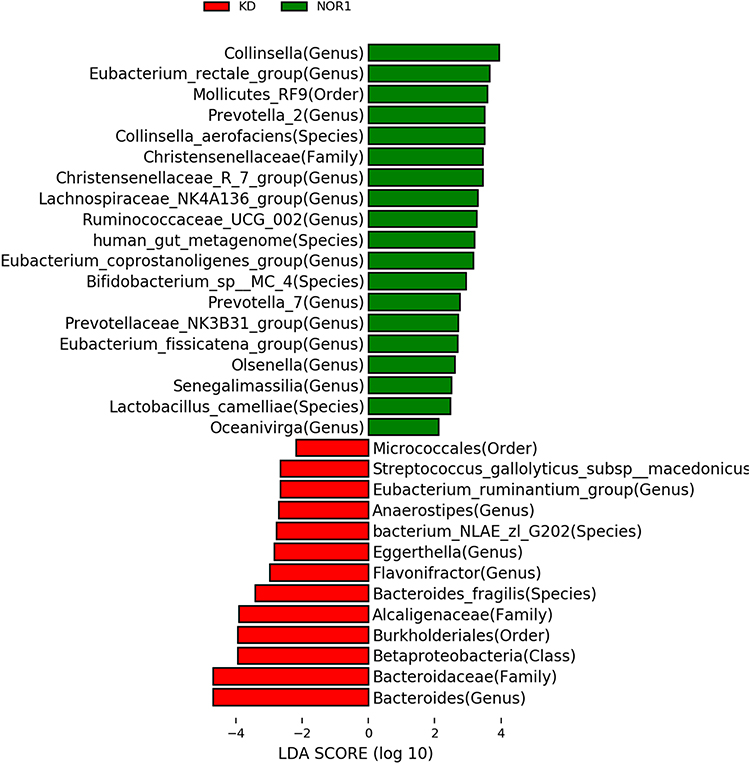 |
Figure 2 Biomarker based on the LDA score for the NOR1 vs KD: LDA is a method of feature selection by combining the significant difference standard test and linear discriminant analysis after increasing the information relationship between species and genera. This analysis can find species that differ significantly in abundance between groups. Species with significant differences between groups can be called biomarkers. The abscissa represents the effect size, and different colors in the ordinate represent the biomarkers of different groups. According to the effect size, the larger the effect value, the more it represents the different species between groups. Red represents significant species in KD (ie, group of adolescents with NSS behavior), and green represents significant species in NOR1 (ie, group of healthy adolescent). We found 13 dominant bacteria in the KD and 19 dominant bacteria in the NOR1. |
KD vs NOR2 comparison: The relative abundances of Fimbriimonadia and bacteria under Fimbriimonadia and Mitsuokella were higher in the KD than the NOR2, while the relative abundances of Parvimonas, Tyzzerella, Dialister_pneumosintes and Clostridiaceae_1 were lower than those in the NOR2. These differences were all statistically significant (all P <0.05). Mitsuokella was more dominant in the KD than the NOR2 (Figure 3).
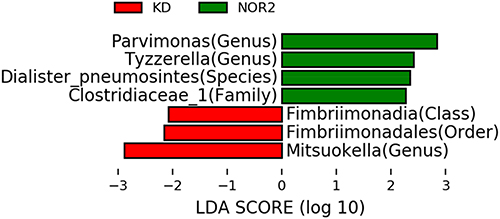 |
Figure 3 Biomarker based on the LDA score for the NOR2 vs KD: Red represents significant species in KD (ie, group of adolescents with NSS behavior), and green represents significant species in NOR2 (ie, group of depressed adolescents without NSSI). We found 3 dominant bacteria in the KD and 4 dominant bacteria in the NOR2. |
NOR2 vs NOR1 comparison: The relative abundances of Bacteroides genus and its family, Betaproteobacteria, Burkholderiales, Alcaligenaceae, Porphyromonadaceae, Parabacteroides, Bacteroides_fragilis, bacterium_NLAE_ZL_G202, Flavonifractor in the NOR2 were higher than those in the NOR1. In contrast, for Veillonellaceae, Coriobacteriaceae, Coriobacteriia, Coriobacteriales, Collinsella, Ruminococcus_2, Collinsella_aerofaciens, Christensenellaceae_R_7_group, Fimbriimonadales and their subordinate classes, the relative abundances were lower in the NOR2 group than the NOR1. These differences were all statistically significant (all P <0.05). In contrast to NOR1, Bacteriaceae was the more dominant bacteria in the NOR2 (Figure 4).
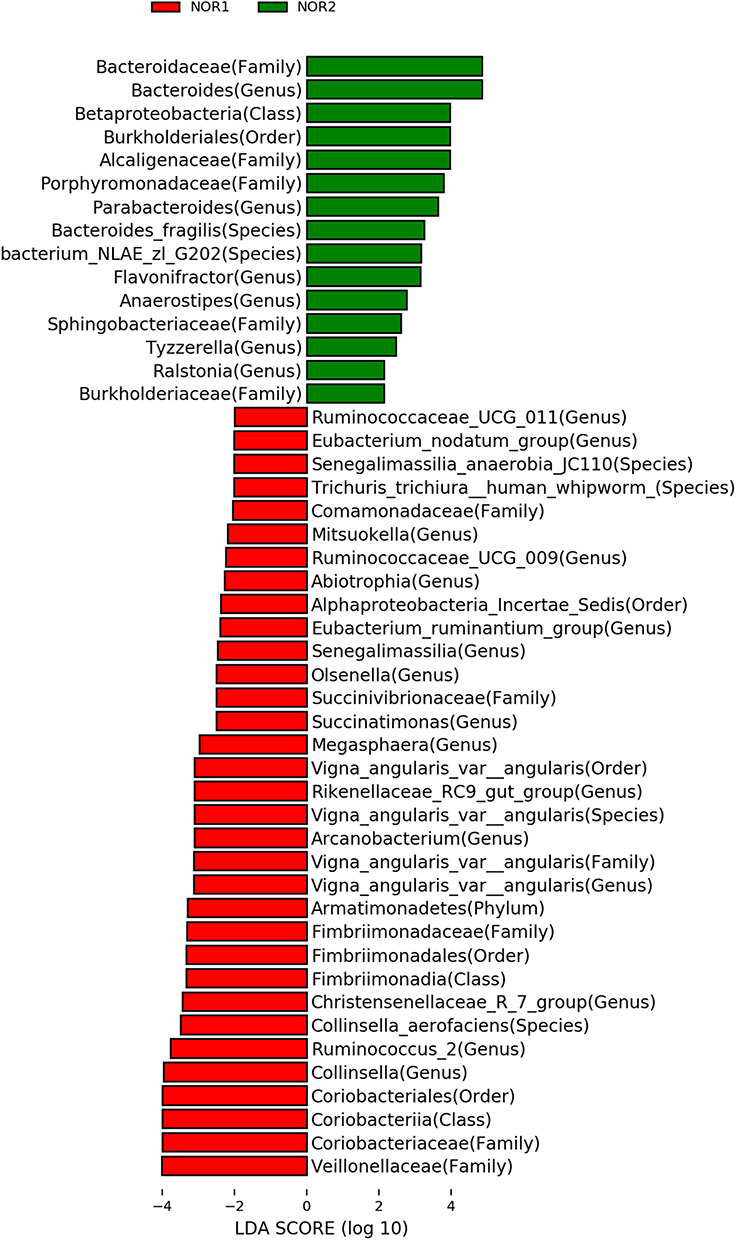 |
Figure 4 Biomarker based on the LDA score for the NOR1 vs NOR2: Red represents significant species in NOR1 (ie, group of healthy adolescent), and green represents significant species in NOR2 (ie, group of depressed adolescents without NSSI). We found 33 dominant bacteria in the NOR1 and 15 dominant bacteria in the NOR2. |
Relative Abundance Comparisons Performed with Metastats Analysis
Species causing differences in the composition of the two groups of samples can be screened by Metastats analysis. This software analyzed significant group differences in the phylum, class, order, family, genus, and species classifications. For bacterial populations with less than 0.1% relative abundance, the accuracy of the data is extremely low. Therefore, bacterial colonies with an abundance less than 0.1% were removed from the analysis. Detailed statistical results are shown in Table 6. At the phylum level, differences in the proportions of bacteria were not significant among the three groups (all P <0.05).
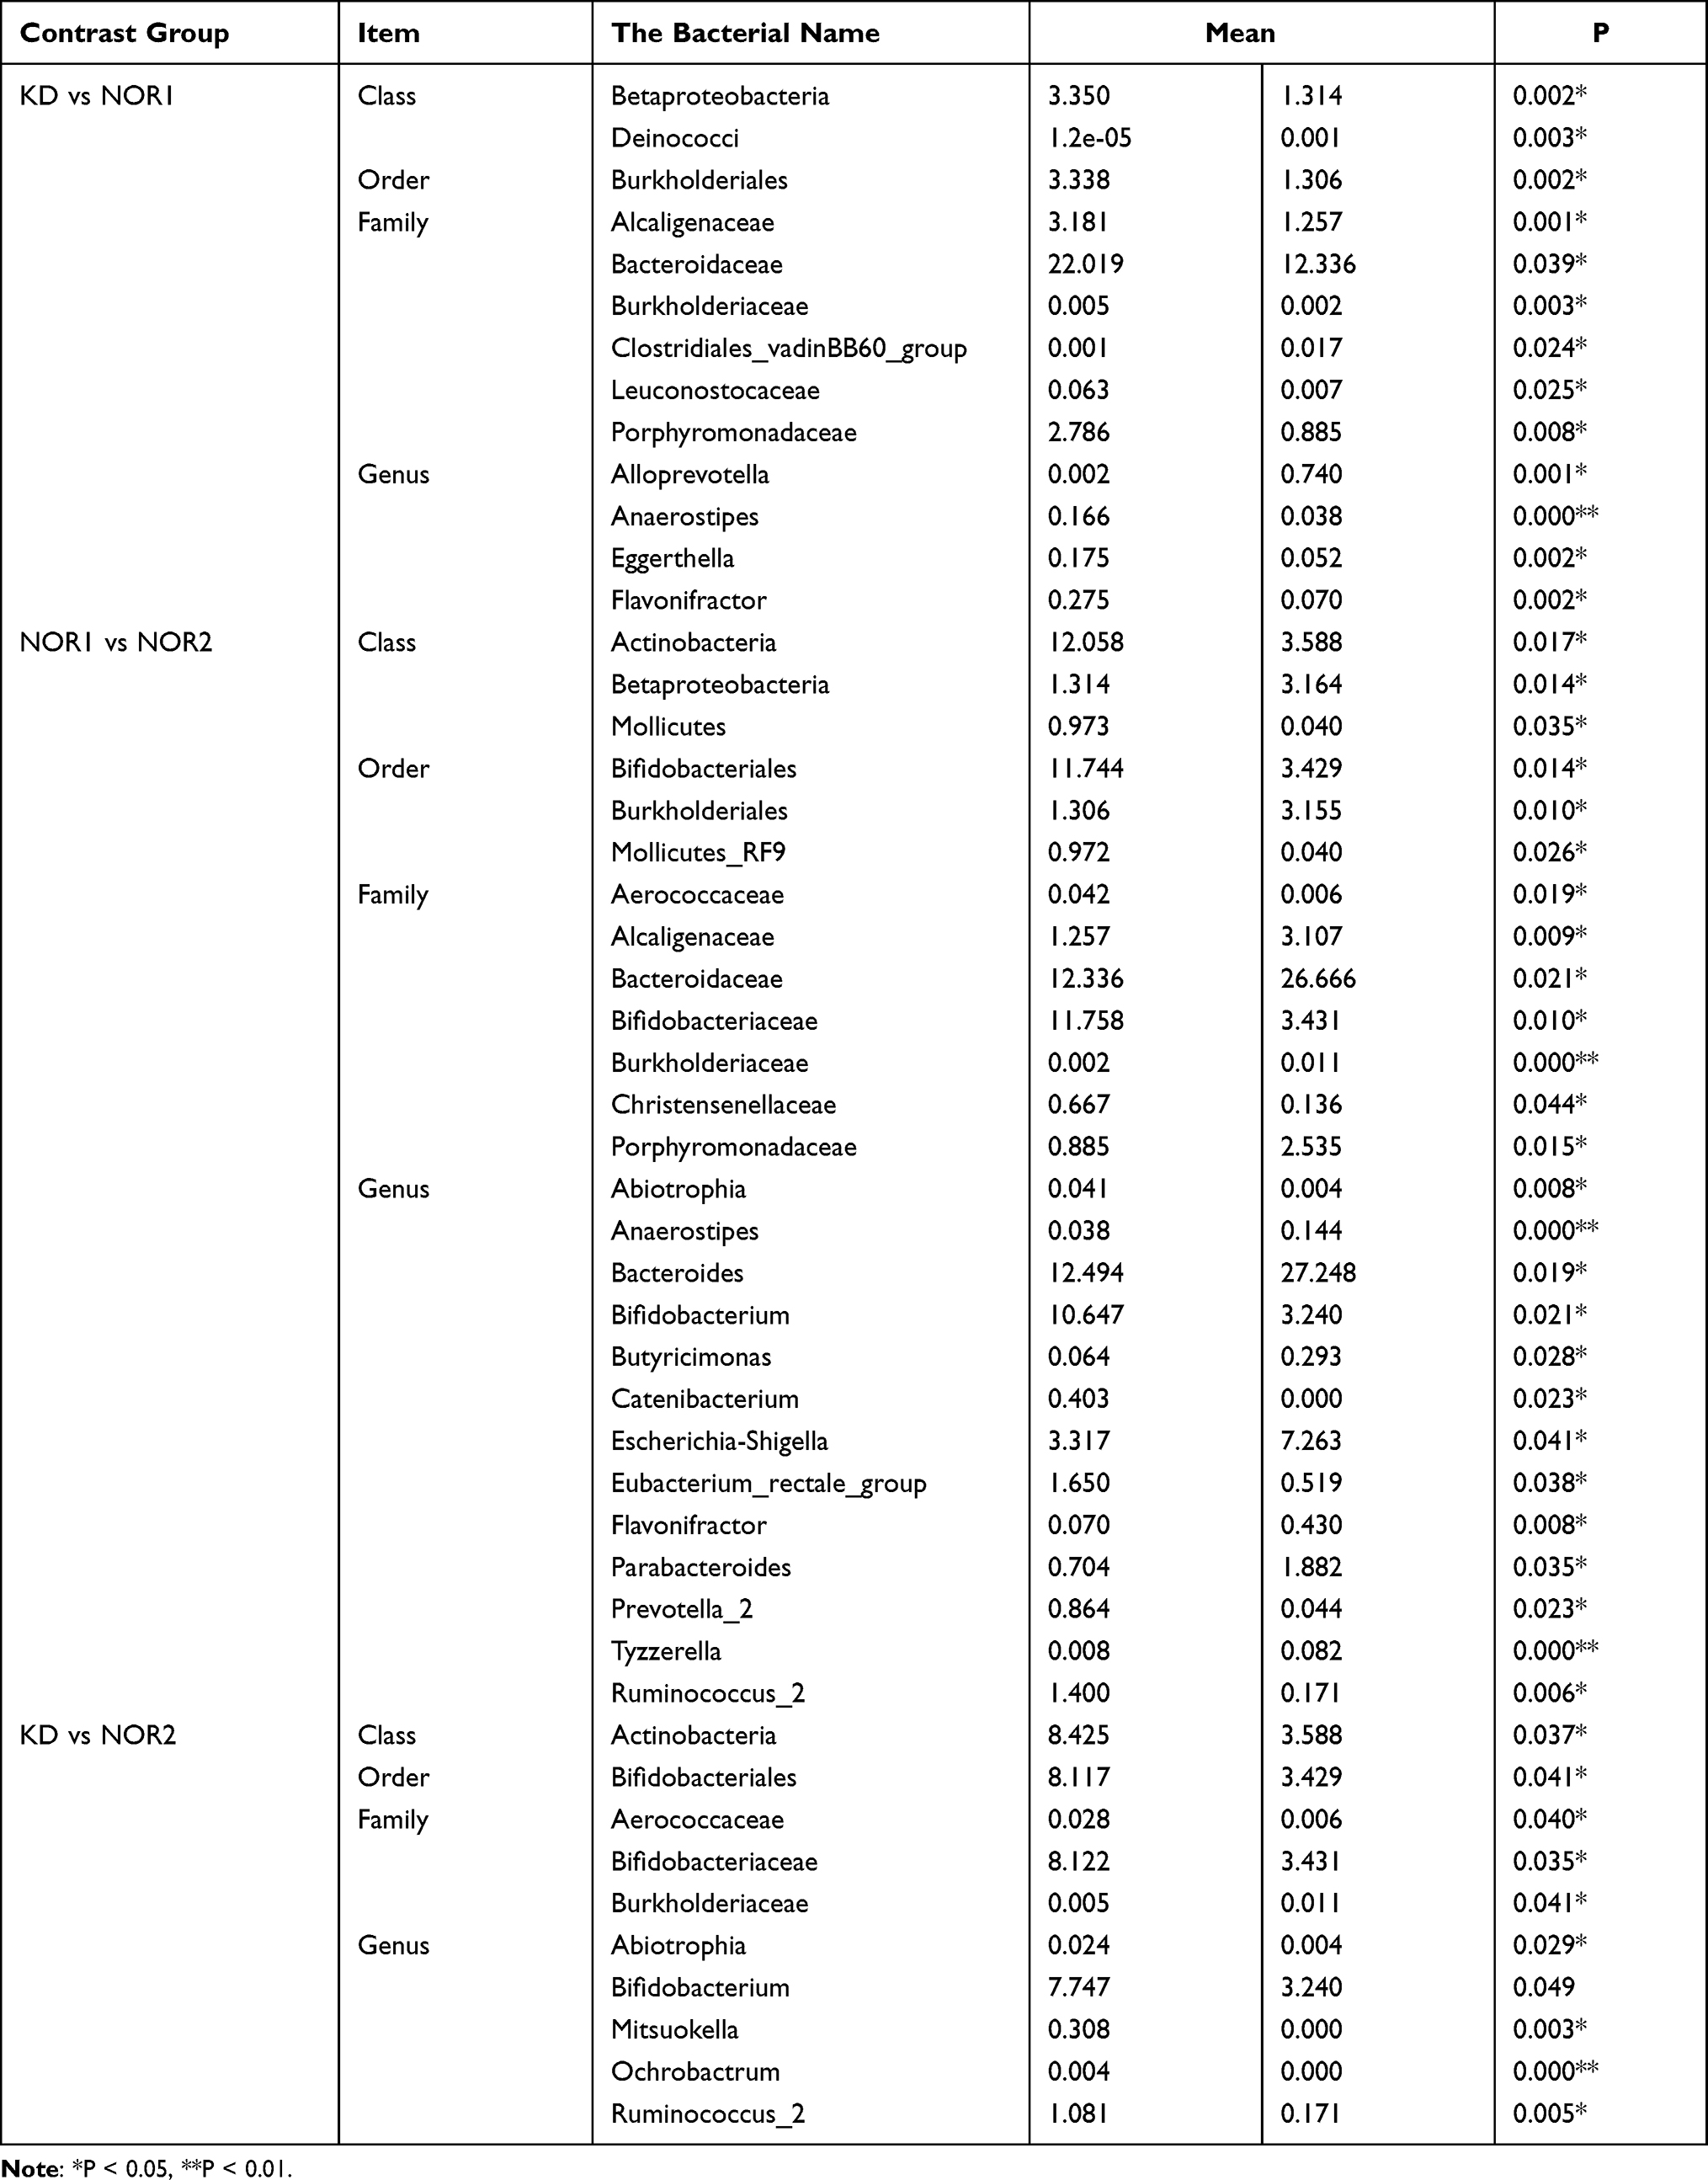 |
Table 6 Abundances Comparisons Analyzed by Metastat for the Three Groups |
At the class level, the proportion of Actinobacteria in the KD was significantly higher than that in the NOR2. The proportions of Betaproteobacteria in both the KD and NOR2 were significantly higher than that in the NOR1. The proportions of Actinobacteria and Mollicutes in the NOR2 were significantly lower than those in the NOR1 (both P <0.05).
At the order level, the proportion of Bifidobacteriales was significantly higher in the KD than in the NOR2. The proportions of Burkholderiales in both the KD and NOR2 were significantly increased compared with that in the NOR1. The proportion of Bifidobacteriales was significantly higher in the NOR1 than in the NOR2 (all P <0.05).
At the family level, the proportion of Bifidobacteriaceae was significantly higher in the KD than in the NOR2, and the proportion of Burkholderiaceae was significantly decreased. The proportions of Burkholderiaceae, Bacteroidaceae, and Porphyromonadaceae were all significantly higher in the KD and NOR2 than in the NOR1. However, the proportion of Clostridiales was significantly reduced in the KD compared with the NOR1. The proportions of Aerococcaceae, Bifidobacteriaceae and Christensenellaceae were decreased in the NOR2 compared with the NOR1 (all P <0.05).
At the genus level, the proportions of Bifidobacterium, Mitsuokella, and Ruminococcus_2 were significantly higher in the KD than in the NOR2. The proportion of Anaerostipes was significantly higher in the KD than in the NOR1, while the proportion of Alloprevotella was decreased significantly. The proportions of Anaerostipes, Bacteroides, Escherichia-Shigella, and Parabacteroides were significantly increased in the NOR2 compared to the NOR1, while the proportions of Bifidobacterium, Catenibacterium, Eubacterium, Prevotella, and Ruminococcus were significantly decreased (all P <0.05).
Discussion
Using sequencing data and alpha diversity analysis, we found statistically significant differences in the diversity index based on the Shannon and Simpson indexes between the NSSI and healthy groups. The NSSI group showed significantly lower species uniformity according to the Shannon and Simpson indexes than the healthy group. This suggests poor community diversity in the NSSI group. However, the difference between the NSSI and depression groups and the depression and healthy groups was not significant. At present, the relationship between NSSI and intestinal flora diversity has not been reported in the relevant literature. Most scholars believe that the diversity and stability of the gut flora are important indicators of an individual’s overall health.22 We know that the gut flora produces metabolites that may affect human mental state and mood. Studies have shown that probiotic supplementation to depressed patients can produce metabolites such as short-chain fatty acids (SCFAs), thus reducing depressive symptoms.23,24 The combination of a gluten-free diet and probiotic supplements may inhibit the immune-inflammatory cascade during depression and improve mental and gut barrier-related features.25 In addition, the statistically insignificant differences in the depression and healthy groups we observed were similar to those of Nasserivruy et al.26 However, there is also substantial evidence that depression and changes in gut microbiota composition often manifest as a reduced abundance of some flora and diversity.27,28 These inconsistent findings may be influenced by geographical differences as well as dietary habits. The current study suggests that NSSI is mainly influenced by multiple factors, including interpersonal stressors, neurobiological background, emotional dysregulation in childhood, and adverse experiences. Neurobiological studies have found changes in the HPA axis and endogenous opioid system, as well as in the neural processing of emotional stimuli. However, more studies are needed to test these findings, and research focused on etiology (especially in neurobiology) is required. Although there is ample evidence that the microbiome is associated with emotional behavior, we do not understand the specific mechanisms underlying this clinical relevance.29 Therefore, the specific mechanisms underlying the altered microbial diversity in NSSI patients remain to be further explored.
This study showed that the significant flora of adolescents with NSSI compared with healthy adolescents was Bacteroides fragilis, along with its related genus and family levels, including Micrococcales, Streptococcus, Eubacterium, Anaerostipes, Burkholderiales, and Betaproteobacteria. The significant flora of patients with depression were Bacteroidaceae, Burklexidae, Betaproteobacteria, Parabacteroides, and Anaerostipes. Bacteroides is the dominant flora related to NSSI and depression, while Mitsuokella is the dominant flora that distinguishes NSSI from depression. In the above results, we found that NSSI was mostly identical to the significant flora of depression but also had significantly different populations. Although it is not known how to explain this difference, this could suggest that NSSI and depression are not necessarily homologous diseases. This is also consistent with the diagnosis of NSSI as an independent disease in DSM-5. Although this division has an ongoing debate, it triggers new research directions that can significantly improve the study of the etiology, phenomenology and treatment of NSSI. In a 2015 study of a depressed population, we found higher levels of Bacteroides, Proteobacteria, and Acinetobacter in depressed patients and significantly lower numbers of Firmicutes.30 The results of this study are roughly the same as those for depression. In addition, 16S rDNA analysis showed that the largest number of bacteria in the stool samples of healthy individuals is Aspergillus, representing 70–75% of the total, with other bacteria including Aspergillus, Actinobacteria, and Clostridium as well as microorganisms.31 The proportion of microbiota in depressed patients is different from that in healthy people. It has the largest number of order Bacteroidales and fewer family Lachnospiraceae.26
A recent study of the PG group and conventional mice demonstrated that Bacteroides, a major human symbiont, regulates the enteroendocrine network mainly through its fermentation products, including acetate, propionic acid, and succinate.32,33 All these results suggest that the gut microbiota is involved in the programming of neuronal circuits and thus affects behavior.34 Therefore, we hypothesized that the elevated abundance of Bacteriaceae may be involved in NSSI as well as in the development of depression.
According to LEfSe software analysis, 19 species were significantly less abundant in the NSSI group compared with the healthy group, including Lactobacillus; moreover, greater than 20 species associated with depression were less abundant than in the healthy group, including Rumgastrococcus. Studies have shown that microbial dysbiosis, especially Lactobacillus depletion and Akkermansia enrichment, is associated with neuroinflammatory activity.35 Antibiotic-mediated microbiota-exhausted mice showed reduced Lactobacillus abundance, upregulated serotonin transporter expression, and reduced serotonin, which play a key role in the pathophysiology of depression.36 Previous studies have shown that lactic acid bacteria are greatly reduced by stress and that the administration of lactic acid bacteria improves stress-induced behavior.37,38 Another study showed decreased Protococcus, Faecalibacterium, Ruminococcus, Bifidobacterium and Escherichia coli, while accessory bacteria increased in patients with depression.39 Our results for the gut microbiota of depression are consistent with these studies. The above indicates that the relative abundance of gut flora was altered in NSSI individuals compared with individuals with depression.
In this study, the imbalance of gut flora was mainly manifested in the five levels of class, order, family, genus and species. For example, at the class level, the beta-proteobacteria ratio was significantly increased in both NSSI and depressed adolescents compared to healthy individuals. The proportion of Actinobacteria was significantly increased in NSSI adolescents, while the proportion of Actinobacteria decreased in depressed patients. At the order level, Burkholderia were significantly elevated in the NSSI and depression groups compared with the healthy group. Bifidobacterium was significantly elevated in the NSSI group compared with the depression group. Several studies have found differences in the gut microbiota composition across taxonomic levels between depressed patients and healthy controls, changing the relative abundances of Firmicutes, Bacteroidetes, Proteobacteria and Actinobacteria.30,40 Similar changes have been observed in animal models of depression.41,42 Some of our results are consistent with this finding. The two recent systematic meta-analyses found inconsistent findings at the phylum level; at the family level, Pforataceae, Pratt and Closiaceae were lower in depression, while Actinomycetes were higher than in controls.26,30 An intestinal permeability study of depressed patients with recent suicide attempts found changes in the intestinal permeability marker azoline protein and intestinal fatty acid-binding protein (I-FABP) in patients with recent suicide attempts compared with controls. These markers were correlated with IL-6 levels. However, I-FABP concentrations were correlated with the severity of depressive symptoms. The authors suggest that the leaky bowel hypothesis may elucidate the link between inflammation and suicidal behavior.39,43 Unfortunately, this study was performed on depressed patients with suicide attempts rather than an NSSI population. We know that NSSI is a high-risk factor for suicide and inflammation, and whether the “intestinal leakage hypothesis” can explain the mechanism of NSSI can be used as a reference entry point to conduct in-depth analysis.
There were some limitations about the present study. First, this is a cross-sectional study lacking follow-up tracking studies.Participants can be follow-up in later studies to explore the subsequent changes in gut flora abundance and the effect of drugs on flora abundance. Secondly, Studies of the gut microbiota of the study subjects were mainly based on gene sequencing or on the analysis of gut microbiota indicators and clinical parameters, so the relevance of the findings are not causal. Thirdly, no further analysis at the metabolic level has affected the interpretation of the findings. Therefore, it is necessary to further analyze the molecular mechanisms of the metagenes and metabolic levels and to improve the clinical observational indicators to improve the accuracy of the experiments.
Conclusion
We used 16S rDNA high-throughput sequencing to perform a joint analysis of the intestinal microecology of adolescents with NSSI and depression and healthy adolescents. We identified characteristic alterations in the diversity and abundance of the gut microbiota in adolescents with NSSI that have not been explored in previous publications. Characteristic changes in gut microbiota abundance in depressed adolescents were also identified.
The diversity of gut microbiota was poor in NSSI adolescents, reflected by significantly lower species uniformity on Shannon and Simpson than the healthy group, while the difference between depression and healthy groups was not significant. In the abundance of gut microbiota analysis, the NSSI is mostly the same as the significant gut microbiota for depression, but also has significantly different bacteria. Bacteroidetes are the common dominant flora of NSSI and depression, while the Pseudophote genus is the dominant flora that distinguishes NSSI from depression. According to LEfSe, 19 species of NSSI had significantly decreased in abundance compared to the healthy group, including Lactobacillus, while more than 20 species of depression had decreased in abundance compared to the healthy group, including ruminococcus. We found significant differences in microflora abundance at different taxonomic levels among NSSI and depressed patients and healthy controls by the metastat analysis. These differences are mainly manifested in the five levels of class, order, family, genus and species. The beta-proteobacteria ratio was significantly higher in both NSSI and depression at the class level. The proportion of actinobacteria bacteria was significantly higher in NSSI, and decreased in depression. Burkholderia was significantly elevated both in NSSI and depression at the order level. Bifidobacteria were significantly elevated in the NSSI as compared to the depressed group.
Our results show that both NSSI and depression have a distinct flora structure, Supporting that NSSI and depression are not homologous disorders, and establishes the basis for exploring the mechanisms of flora action in NSSI. In the future. We may improve adolescent NSSI behavior as well as depressive symptoms by regulating the microflora, providing a possible direction for both to achieve a better prognosis and prevent relapse.
Acknowledgments
This study was supported by the Special Fund for Science and Technology of Guangdong Provincial People’s Hospital (Grant No.2017zh02). We would like to thank Professor Shixiong Dai for excellent technical support and nurse Xuting Chen for her help in specimen collection. Best paper writing service on https://authorservices.springernature.cn.
Disclosure
The authors report no conflicts of interest in this work.
References
1. Lloyd-Richardson EE, Perrine N, Dierker L, Kelley ML. Characteristics and functions of non-suicidal self-injury in a community sample of adolescents. Psychol Med. 2007;37(8):1183–1192. doi:10.1017/S003329170700027X
2. Swannell SV, Martin GE, Page A, Hasking P, St JN. Prevalence of nonsuicidal self-injury in nonclinical samples: systematic review, meta-analysis and meta-regression. Suicide Life Threat Behav. 2014;44(3):273–303. doi:10.1111/sltb.12070
3. ZY L, GM W, C B, JY S, H G. Current status and risk factors of adolescent non-suicidal self-injury. Int J Psychiatry. 2021;48(04):586–589.
4. Osuch E, Ford K, Wrath A, Bartha R, Neufeld R. Functional MRI of pain application in youth who engaged in repetitive non-suicidal self-injury vs. psychiatric controls. Psychiatry Res. 2014;223(2):104–112. doi:10.1016/j.pscychresns.2014.05.003
5. Blasco-Fontecilla H, Fernández-Fernández R, Colino L, Fajardo L, Perteguer-Barrio R, de Leon J. The addictive model of self-harming (non-suicidal and suicidal) behavior. Front Psychiatry. 2016;7:8. doi:10.3389/fpsyt.2016.00008
6. van der Venne P, Balint A, Drews E, et al. Pain sensitivity and plasma beta-endorphin in adolescent non-suicidal self-injury. J Affect Disord. 2021;278:199–208. doi:10.1016/j.jad.2020.09.036
7. Hankin BL, Barrocas AL, Young JF, Haberstick B, Smolen A. 5-HTTLPR × interpersonal stress interaction and nonsuicidal self-injury in general community sample of youth. Psychiatry Res. 2015;225(3):609–612. doi:10.1016/j.psychres.2014.11.037
8. Plener PL, Schumacher TS, Munz LM, Groschwitz RC. The longitudinal course of non-suicidal self-injury and deliberate self-harm: a systematic review of the literature. Borderline Personal Disord Emot Dysregul. 2015;2:2. doi:10.1186/s40479-014-0024-3
9. Ribeiro JD, Franklin JC, Fox KR, et al. Self-injurious thoughts and behaviors as risk factors for future suicide ideation, attempts, and death: a meta-analysis of longitudinal studies. Psychol Med. 2016;46(2):225–236. doi:10.1017/S0033291715001804
10. Eisenstein M. Microbiome: bacterial broadband. Nature. 2016;533(7603):S104. doi:10.1038/533S104a
11. Knudsen JK, Bundgaard-Nielsen C, Hjerrild S, Nielsen RE, Leutscher P, Sørensen S. Gut microbiota variations in patients diagnosed with major depressive disorder-A systematic review. Brain Behav. 2021;11(7):e2177. doi:10.1002/brb3.2177
12. Iglesias-Vázquez L, Van Ginkel RG, Arija V, Canals J. Composition of gut microbiota in children with autism spectrum disorder: a systematic review and meta-analysis. Nutrients. 2020;12(3):792. doi:10.3390/nu12030792
13. Sukmajaya AC, Lusida MI, Soetjipto S, Setiawati Y. Systematic review of gut microbiota and attention-deficit hyperactivity disorder (ADHD). Ann Gen Psychiatry. 2021;20(1):12. doi:10.1186/s12991-021-00330-w
14. Lam YY, Maguire S, Palacios T, Caterson ID. Are the gut bacteria telling us to eat or not to eat? Reviewing the role of gut microbiota in the etiology, disease progression and treatment of eating disorders. Nutrients. 2017;9(6):602. doi:10.3390/nu9060602
15. Caporaso JG, Lauber CL, Walters WA, et al. Global patterns of 16S rRNA diversity at a depth of millions of sequences per sample. Proc Natl Acad Sci U S A. 2011;108(Suppl 1):4516–4522. doi:10.1073/pnas.1000080107
16. O’Mahony L, McCarthy J, Kelly P, et al. Lactobacillus and bifidobacterium in irritable bowel syndrome: symptom responses and relationship to cytokine profiles. Gastroenterology. 2005;128(3):541–551. doi:10.1053/j.gastro.2004.11.050
17. Bokulich NA, Subramanian S, Faith JJ, et al. Quality-filtering vastly improves diversity estimates from Illumina amplicon sequencing. Nat Methods. 2013;10(1):57–59. doi:10.1038/nmeth.2276
18. Edgar RC. UPARSE: highly accurate OTU sequences from microbial amplicon reads. Nat Methods. 2013;10(10):996–998. doi:10.1038/nmeth.2604
19. Quast C, Pruesse E, Yilmaz P, et al. The SILVA ribosomal RNA gene database project: improved data processing and web-based tools. Nucleic Acids Res. 2013;41(D1):D590–D596. doi:10.1093/nar/gks1219
20. Caporaso JG, Kuczynski J, Stombaugh J, et al. QIIME allows analysis of high-throughput community sequencing data. Nat Methods. 2010;7(5):335–336. doi:10.1038/nmeth.f.303
21. Goecks J, Nekrutenko A, Taylor J. Galaxy: a comprehensive approach for supporting accessible, reproducible, and transparent computational research in the life sciences. Genome Biol. 2010;11(8):R86. doi:10.1186/gb-2010-11-8-r86
22. Lach G, Schellekens H, Dinan TG, Cryan JF. Anxiety, depression, and the microbiome: a role for gut peptides. Neurotherapeutics. 2018;15(1):36–59. doi:10.1007/s13311-017-0585-0
23. Rudzki L, Ostrowska L, Pawlak D, et al. Probiotic Lactobacillus Plantarum 299v decreases kynurenine concentration and improves cognitive functions in patients with major depression: a double-blind, randomized, placebo controlled study. Psychoneuroendocrino. 2019;100:213–222. doi:10.1016/j.psyneuen.2018.10.010
24. Chahwan B, Kwan S, Isik A, van Hemert S, Burke C, Roberts L. Gut feelings: a randomised, triple-blind, placebo-controlled trial of probiotics for depressive symptoms. J Affect Disord. 2019;253:317–326. doi:10.1016/j.jad.2019.04.097
25. Karakula-Juchnowicz H, Rog J, Juchnowicz D, et al. The study evaluating the effect of probiotic supplementation on the mental status, inflammation, and intestinal barrier in major depressive disorder patients using gluten-free or gluten-containing diet (SANGUT study): a 12-week, randomized, double-blind, and placebo-controlled clinical study protocol. Nutr J. 2019;18(1):50. doi:10.1186/s12937-019-0475-x
26. Naseribafrouei A, Hestad K, Avershina E, et al. Correlation between the human fecal microbiota and depression. Neurogastroenterol Motil. 2014;26(8):1155–1162. doi:10.1111/nmo.12378
27. Ciocan D, Cassard AM, Becquemont L, et al. Blood microbiota and metabolomic signature of major depression before and after antidepressant treatment: a prospective case-control study. J Psychiatry Neurosci. 2021;46(3):E358–E368. doi:10.1503/jpn.200159
28. Rong H, Xie XH, Zhao J, et al. Similarly in depression, nuances of gut microbiota: evidences from a shotgun metagenomics sequencing study on major depressive disorder versus bipolar disorder with current major depressive episode patients. J Psychiatr Res. 2019;113:90–99. doi:10.1016/j.jpsychires.2019.03.017
29. Liang S, Wang T, Hu X, et al. Administration of Lactobacillus helveticus NS8 improves behavioral, cognitive, and biochemical aberrations caused by chronic restraint stress. Neuroscience. 2015;310:561–577. doi:10.1016/j.neuroscience.2015.09.033
30. Jiang H, Ling Z, Zhang Y, et al. Altered fecal microbiota composition in patients with major depressive disorder. Brain Behav Immun. 2015;48:186–194. doi:10.1016/j.bbi.2015.03.016
31. Kelly CR, Khoruts A, Staley C, et al. Effect of fecal microbiota transplantation on recurrence in multiply recurrent clostridium difficile infection: a randomized trial. Ann Intern Med. 2016;165(9):609–616. doi:10.7326/M16-0271
32. Aktar R, Parkar N, Stentz R, et al. Human resident gut microbe Bacteroides thetaiotaomicron regulates colonic neuronal innervation and neurogenic function. Gut Microbes. 2020;11(6):1745–1757. doi:10.1080/19490976.2020.1766936
33. Modasia A, Parker A, Jones E, et al. Regulation of enteroendocrine cell networks by the major human gut symbiont Bacteroides thetaiotaomicron. Front Microbiol. 2020;11:575595. doi:10.3389/fmicb.2020.575595
34. Heijtz RD, Wang S, Anuar F, et al. Normal gut microbiota modulates brain development and behavior. Proc Natl Acad Sci. 2011;108(7):3047–3052. doi:10.1073/pnas.1010529108
35. Li N, Wang Q, Wang Y, et al. Fecal microbiota transplantation from chronic unpredictable mild stress mice donors affects anxiety-like and depression-like behavior in recipient mice via the gut microbiota-inflammation-brain axis. Stress. 2019;22(5):592–602. doi:10.1080/10253890.2019.1617267
36. Cao H, Liu X, An Y, et al. Dysbiosis contributes to chronic constipation development via regulation of serotonin transporter in the intestine. Sci Rep. 2017;7(1):10322. doi:10.1038/s41598-017-10835-8
37. Lutgendorff F, Akkermans LM, Söderholm JD. The role of microbiota and probiotics in stress-induced gastro-intestinal damage. Curr Mol Med. 2008;8(4):282–298. doi:10.2174/156652408784533779
38. Marin IA, Goertz JE, Ren T, et al. Microbiota alteration is associated with the development of stress-induced despair behavior. Sci Rep. 2017;7:43859. doi:10.1038/srep43859
39. Sanada K, Nakajima S, Kurokawa S, et al. Gut microbiota and major depressive disorder: a systematic review and meta-analysis. J Affect Disord. 2020;266:1–13. doi:10.1016/j.jad.2020.01.102
40. Chen H, Xie H, Huang S, et al. Development of mass spectrometry-based relatively quantitative targeted method for amino acids and neurotransmitters: applications in the diagnosis of major depression. J Pharm Biomed Anal. 2021;194:113773. doi:10.1016/j.jpba.2020.113773
41. Yu M, Jia H, Zhou C, et al. Variations in gut microbiota and fecal metabolic phenotype associated with depression by 16S rRNA gene sequencing and LC/MS-based metabolomics. J Pharm Biomed Anal. 2017;138:231–239. doi:10.1016/j.jpba.2017.02.008
42. Tillmann S, Abildgaard A, Winther G, Wegener G. Altered fecal microbiota composition in the Flinders sensitive line rat model of depression. Psychopharmacology. 2019;236(5):1445–1457. doi:10.1007/s00213-018-5094-2
43. Ohlsson L, Gustafsson A, Lavant E, et al. Leaky gut biomarkers in depression and suicidal behavior. Acta Psychiatr Scand. 2019;139(2):185–193. doi:10.1111/acps.12978
 © 2022 The Author(s). This work is published and licensed by Dove Medical Press Limited. The
full terms of this license are available at https://www.dovepress.com/terms
and incorporate the Creative Commons Attribution
- Non Commercial (unported, 3.0) License.
By accessing the work you hereby accept the Terms. Non-commercial uses of the work are permitted
without any further permission from Dove Medical Press Limited, provided the work is properly
attributed. For permission for commercial use of this work, please see paragraphs 4.2 and 5 of our Terms.
© 2022 The Author(s). This work is published and licensed by Dove Medical Press Limited. The
full terms of this license are available at https://www.dovepress.com/terms
and incorporate the Creative Commons Attribution
- Non Commercial (unported, 3.0) License.
By accessing the work you hereby accept the Terms. Non-commercial uses of the work are permitted
without any further permission from Dove Medical Press Limited, provided the work is properly
attributed. For permission for commercial use of this work, please see paragraphs 4.2 and 5 of our Terms.
Recommended articles
Association Between Breakfast Consumption and Suicidal Attempts in Adolescents
Park H, Lee K
Psychology Research and Behavior Management 2022, 15:2529-2541
Published Date: 13 September 2022
Vitamin B12, Folate, Homocysteine, Inflammatory Mediators (Interleukin-6, Tumor Necrosis Factor-α and C-Reactive Protein) Levels in Adolescents with Anxiety or Depressive Symptoms
Tan Y, Zhou L, Huang J, Chen X, Wu Y, Song X, Wang J, Hu H, Yang Q
Neuropsychiatric Disease and Treatment 2023, 19:785-800
Published Date: 7 April 2023
The Effect of Loneliness on Non-Suicidal Self-Injury Behavior in Chinese Junior High School Adolescents: A Moderated Mediation Model
Huang X, Liu H, Lan Z, Deng F
Psychology Research and Behavior Management 2023, 16:1831-1843
Published Date: 16 May 2023
Why is Smartphone Addiction More Common in Adolescents with Harsh Parenting? Depression and Experiential Avoidance‘s Multiple Mediating Roles
Lin W, Liang H, Jiang H, Mohd Nasir MA, Zhou H
Psychology Research and Behavior Management 2023, 16:4817-4828
Published Date: 28 November 2023
AI Technology panic—is AI Dependence Bad for Mental Health? A Cross-Lagged Panel Model and the Mediating Roles of Motivations for AI Use Among Adolescents
Huang S, Lai X, Ke L, Li Y, Wang H, Zhao X, Dai X, Wang Y
Psychology Research and Behavior Management 2024, 17:1087-1102
Published Date: 12 March 2024