Back to Journals » Diabetes, Metabolic Syndrome and Obesity » Volume 16
Association Between Hypertension and New-Onset Non-Alcoholic Fatty Liver Disease in Chinese Non-Obese People: A Longitudinal Cohort Study
Authors Yang D, Lan J, Cen J, Han Y, Hu H ![]()
Received 3 November 2022
Accepted for publication 18 January 2023
Published 8 February 2023 Volume 2023:16 Pages 345—363
DOI https://doi.org/10.2147/DMSO.S396011
Checked for plagiarism Yes
Review by Single anonymous peer review
Peer reviewer comments 3
Editor who approved publication: Professor Gian Paolo Fadini
Dezhi Yang,1,* Jing Lan,2,* Ji Cen,3,* Yong Han,4– 6 Haofei Hu6– 8
1Department of Cardiology Second Ward, Hechi People’s Hospital, Hechi, People’s Republic of China; 2Department of Gastroenterology, Hechi People’s Hospital, Hechi, People’s Republic of China; 3Department of Nephrology, Hechi People’s Hospital, Hechi, People’s Republic of China; 4Department of Emergency, Shenzhen Second People’s Hospital, Shenzhen, People’s Republic of China; 5Department of Emergency, The First Affiliated Hospital of Shenzhen University, Shenzhen, People’s Republic of China; 6Shenzhen University Health Science Center, Shenzhen University, Shenzhen, People’s Republic of China; 7Department of Nephrology, Shenzhen Second People’s Hospital, Shenzhen, People’s Republic of China; 8Department of Nephrology, The First Affiliated Hospital of Shenzhen University, Shenzhen, People’s Republic of China
*These authors contributed equally to this work
Correspondence: Yong Han, Department of Emergency, Shenzhen Second People’s Hospital, No. 3002 Sungang Road, Futian District, Shenzhen, Guangdong Province, People’s Republic of China, Tel +86-755-83366388, Email [email protected] Haofei Hu, Department of Nephrology, Shenzhen Second People’s Hospital, No. 3002 Sungang Road, Futian District, Shenzhen, Guangdong Province, People’s Republic of China, Tel +86-755-83366388, Email [email protected]
Background: Quantification of the relationship between hypertension and non-alcoholic fatty liver disease (NAFLD) risk is limited and controversial. This study aimed to investigate the relationship between hypertension and NAFLD in non-obese Chinese and to use different methods to demonstrate that hypertension is an independent risk factor for NAFLD.
Methods: On 16,153 nonobese individuals, a retrospective cohort study was conducted in China to examine the impact of hypertension on incident NAFLD. We compared five methods: multivariable Cox proportional-hazards regression, propensity score-matched (PSM) analysis, propensity score adjustment method (considering the propensity score as a covariate in a multivariable Cox proportional-hazard regression), and two propensity score-based weighted methods-The first one estimated the hypertension effect in the overall study population-inverse probability of treatment weights (IPTW), the other in the hypertensive population-standardized mortality ratio (SMR) weights. We also used a genetic matching (GenMatch) algorithm to match the participants for sensitive analysis.
Results: Between 2010 and 2014, 16,153 participants met our inclusion criteria, including 2427 (15.03%) with hypertension. A total of 2321 (14.37%) participants developed NAFLD during the median follow-up of 2.98 years. The crude hazard ratio (HR) between hypertension and incident NAFLD was 2.05 (95% confidence interval (CI): 1.87, 2.25). The adjusted HR depended on the different methods, ranging from 1.09 (95% CI: 0.77, 1.23) for the PSM method to 2.24 (95% CI: 2.05, 2.44) for the SMR weighted analysis. Hypertensive participants with high propensity scores had a higher risk of developing NAFLD in the future. Excluding participants with propensity scores < 8% yielded comparable hazard ratios with a narrower range, from 1.04 to 1.80. After adjusting for the confounding variables, the relationship also existed in the GenMatch cohort as a sensitivity analysis (HR=1.06, 95% CI 1.01– 1.13).
Conclusion: Hypertension is a significant cause of NAFLD in Chinese adults in non-obese Chinese adults, with the hazard ratio ranging from 1.09 to 2.24.
Keywords: hypertension, non-alcoholic fatty liver disease, propensity-score matching, standardized-mortality-ratio weights, inverse probability of treatment weights
Background
Non-alcoholic fatty liver disease (NAFLD) covers a wide range of pathological conditions, from simple steatosis to steatohepatitis (NASH) to advanced fibrosis, cirrhosis, and finally, hepatocellular carcinoma. A global prevalence of 25% makes it the most common chronic liver disease.1,2 NAFLD is a prevalent condition and represents a growing global clinical and economic burden. According to recent estimates, NAFLD prevalence ranges from 24.77% to 43.91% in China.3,4 The prevalence of NAFLD rapidly increases with the global obesity epidemic.3,5 NAFLD is presently recognized as a major cause of liver-related mortality and morbidity, among which mortality is mainly due to cirrhosis. In addition, NAFLD might also increase the risk of cardiovascular disease, hypertension, type 2 diabetes, and chronic kidney disease.6–9 Hence, clinically various pharmacological approaches using existing drugs such as anti-diabetic, anti-obesity, antioxidants, and cytoprotective agents have been considered in managing NAFLD and NASH. However, several pharmacological therapies aiming to alleviate NAFLD-NASH are currently being examined at various phases of clinical trials.10 Clinically, obesity is closely related to NAFLD.11 In general, however, individuals with normal body mass index (BMI) are still diagnosed with NAFLD. In the Third National Health and Nutrition Inspection Survey of America, an ultrasound found 7.4% of non-obese adults to have hepatic steatosis.12 A high percentage of this can be found in Asia (8–19%).13 Furthermore, a growing body of evidence shows that patients with NAFLD who are not obese are more likely to develop metabolic syndrome and progressive liver disease.14,15 Additionally, the detection of non-obese NAFLD can decrease the risk of diabetes and cardiovascular disease.16,17 Since the risk of NAFLD is more likely to be overlooked in non-obese populations, identifying non-obese people at risk of NAFLD is still essential.
Multifactorial hypertension is a growing public health problem caused by the interaction between genetic predisposition and environmental factors, affecting ≈30% of the general population.18 NAFLD is significantly associated with blood pressure (BP),19–22 even in individuals without hypertension.22,23 Aneni et al showed that early hypertension might lead to NAFLD even in the absence of other metabolic risk factors and indicated that controlling blood pressure might help prevent or limit NAFLD in non-obese patients with hypertension.24 A recent meta-analysis showed a bidirectional association between hypertension and NAFLD.25 Several recent cohort studies have also found hypertension to be an independent factor in the risk of NAFLD.26–28 However, some other studies have found no association between hypertension and the risk of NAFLD.29 In addition, most current studies on the relationship between hypertension and NAFLD are cross-sectional or case-control, and the wide range of odds ratios (ORs) /hazard ratios (HRs) for the association between hypertension and NAFLD fluctuated from 1.23 to 16.72.30,31 The use of different statistical methods may be an important reason for this phenomenon. Current research on the relationship between hypertension and NAFLD is still controversial, the number of cohort studies is limited, and the range of ORs/HRs also needs further precision. Therefore, the association between hypertension and NAFLD still needs further study.
Results from traditional parsimonious regression models used in previous observational studies may be skewed by residual or unmeasured confounding or overfitting of the model,32 which might prevent identifying the association between hypertension and incident NAFLD. The propensity score (PS) estimated the probability of a patient having hypertension given baseline characteristics. The use of propensity score for adjustments enabled us to balance the two groups (with hypertension or not) regarding numerous important covariates. Propensity score matching (PSM) is useful in such studies in which there are resource constraints that prevent the conduction of randomized clinical trials.33
Several PS-based methods were used for confounding adjustment, including matching,8,34,35 regression adjustment,36,37 and weighting.8,38–41 When unmeasured confounding was absent, the first weighting method estimated hypertensive effects in a population where the distribution of risk factors was equal to that found in all study subjects. This method was considered an inverse-probability-of-treatment-weighted (IPTW) estimator.41 The second weighting method estimated the hypertensive effect in a population with a distribution of risk factors similar to that found among hypertensive individuals. This method was considered as the standardized mortality ratio (SMR)-weighted estimator.42 The two primary PS weighting methods were referred to as standardization methods that depended on establishing a standard population.
A difficulty faced by all methods of confounding control (ie, Cox proportional hazards regression or propensity score-based methods) was that if the propensity score model or outcome regression model did not include critical predictors or significant interactions, the residual confounding effects due to excluded covariates and interactions might then be significant. On the other hand, having all available covariates and their lower-order interactions could make the estimated hypertensive effect very imprecise. It might even be biased in nonlinear models such as the Cox proportional hazards regression.43–45 Thus, it is unknown which method is preferable in which situation in the real-world setting.
Therefore, to assess the utility of different methods of adjusting for confounders, a large cohort study using real-world data from 16,153 nonobese Chinese adults using five methods (four propensity score methods-propensity score adjustment, matching, and two weighted regression adjustments, and multiple Cox proportional-hazards regressions) to evaluate the association between hypertension and NAFLD should be performed. Also, this study can further clarify the precise range of HRs fluctuations in the relationship between hypertension and NAFLD.
Methods
Study Design and Participants
The present retrospective cohort study was conducted based on extracting data from records of regular clinical visits from a computerized database established by the Wenzhou Medical Center of Wenzhou People’s Hospital in China. We downloaded the raw data freely from the DATADRYAD database (https://datadryad.org/stash) provided by Sun et al46 from: Association of low-density lipoprotein cholesterol within the normal range and NAFLD in the non-obese Chinese population: a cross-sectional and longitudinal study. Dryad, Dataset, https://doi.org/10.5061/dryad.1n6c4. To minimize selection bias, participants who underwent a health examination were collected non-selectively and consecutively from Wenzhou Medical Center in Wenzhou People’s Hospital between January 2010 and December 2014. The study initially included 33,153 participants. Participants had a detailed annual clinical evaluation throughout the follow-up period. The yearly evaluation was scheduled as part of the original study. Subjects were excluded from the study if they met any of the following criteria: (1) those who consumed excessive amounts of alcohol (140g/week for men and 70g/week for women); (2) participants with chronic hepatic diseases, such as autoimmune hepatitis, NAFLD, or viral hepatitis; (3) those with BMI ≥25 kg/m2 and low-density lipoprotein cholesterol (LDL-c)>3.12 mmol/L; (4) persons who were taking antihypertensive, cholesterol-lowering, or diabetes medications; and (5) those who failed to follow-up or did not collect any data for BMI, total cholesterol (TC), LDL-c, triglycerides (TG), high-density lipoprotein cholesterol (HDL-c), etc.46 A total of 16,173 initially NAFLD-free individuals were included in the original research. Participants with incomplete blood pressure (including SBP and/or DBP) were further excluded from the present study (n=20). The study selection and reviewing process were depicted in Figure 1, which was also exposited explicitly in the previous report.46 Finally, this secondary analysis included data on 16,153 participants without NAFLD at the baseline.
 |
Figure 1 Flowchart of study participants. The process of screening participants. |
Data Collection
The data extracted included the following: gender, age, diastolic blood pressure (DBP), BMI, systolic blood pressure (SBP), albumin (ALB), alanine aminotransferase (ALT), HDL-c, globulin (GLB), serum creatinine (Scr), alkaline phosphatase (ALP), fasting plasma glucose (FPG), TG, uric acid (UA), aspartate aminotransferase (AST), blood urea nitrogen (BUN), TC, γ-glutamyl transpeptidase (GGT), LDL-c, duration of follow-up, and incident NAFLD during follow-up. Standard methods were used to measure all the biochemical values (Abbott AxSYM). Physicians took a medical history and health habit inventory. Height in meters square was divided by weight in kilograms to calculate BMI (kg/m2). More information was provided in the previous report.46 Data collection was conducted under standard conditions and treated according to uniform procedures.21,46,47
Researchers are allowed to use this data for secondary analysis without breaching the authors’ rights according to the Dryad Terms of Service. Informed verbal consent was obtained from each study participant. The data were handled on a group level, and health examination numbers replaced personal information. The ethics committee of Wenzhou People’s Hospital and Hechi People’s Hospital approved the research protocol of the study.46
Outcome Measures
NAFLD was the outcome of interest. An incident NAFLD diagnosis was made via ultrasonography based on recommendations from the Chinese Liver Disease Association.48 Specifically, there were five diagnostic criteria for NAFLD: 1) diffuse enhancement of near-field echo in the liver region and progressive attenuation of far-field echo; 2) intrahepatic lacunar structures appear ill-defined; 3) mild to moderate hepatomegaly with round and blunt margins; 4) reduced blood flow signal in the liver; 5) the right hepatic lobe and diaphragm appeared ill-defined or incomplete.46 There was also an essential abnormal finding on abdominal ultrasonography: hyperechogenity of liver tissue (“bright liver”), as often compared to hypoechogenity of the kidney cortex.49 During the observation period, annual follow-up evaluations were performed. The incidence of NAFLD was determined by hepatic ultrasonic examinations performed blinded (as at baseline). Following the diagnosis of NAFLD or the last visit, participants were censored.
Exposure of Interest and Covariates
The exposure of interest was hypertension. This study defined hypertension as systolic blood pressure ≥140 mmHg or diastolic blood pressure ≥90 mmHg.50–52 BP was measured with the participant in a sitting position using an automatic sphygmomanometer through office blood pressure measurements. Before taking blood pressure, the examinee should sit down and rest quietly for 5–10 minutes. Covariates of interest included sex, ALB, age, LDL-c, ALP, BUN, GGT, TG, AST, GLB, ALT, Scr, UA, TC, GLU, HDL-c, and BMI.
Statistical Analyses
Continuous variables were expressed as mean (standard deviation) (Normal distribution) or median (range) (Non-normal distribution), and categorical variables as No. (%). We used the t-test (normal distribution), the Chi-square test (categorical variables), or Wilcoxon’s Rank Sum test (skewed distribution) to test for differences among different groups.53 The number of participants with missing data of ALP, GGT, ALT, and AST was 4041 (25.0%), 4043 (25.0%), 4041 (25.0%), and 4043 (25.0%), respectively. Meanwhile, the missing data of ALB and GLB was 1380 (8.5%). In comparison, only one person was missing in BUN, UA, Scr, and FPG (Figure S1). Multiple imputations were used to handle the missing data of covariants.54 The imputation model included sex, ALB, age, LDL-c, ALP, BUN, GGT, TG, AST, GLB, ALT, Scr, UA, TC, GLU, HDL-c, and BMI. Missing at random (MAR) assumptions were used for missing data analysis.55
Assembling a balanced cohort through PS matching could reduce significant imbalances between patients with and without hypertension (Table 1). In the case of hypertension, we calculated PS using a non-parsimonious multivariate logistic regression model, with hypertension as the dependent variable and all other baseline characteristics as covariates.56 Table 1 presented the covariates used in the model. The variables used for matching included BMI, gender, age, ALT, UA, ALP, AST, FPG, ALB, HDL-c, GLB, TC, GGT, TG, BUN, LDL-c, and Scr. The PSM included a 1:1 greedy algorithm without replacement, with a caliper width equal to 0.01. We also attempted to find a more stringent caliper, but 0.01 gave the best matching model. We measured the standardized differences (SD) for each covariate at baseline to determine the level of balance between the matched groups.57 The matching was deemed satisfactory when the standardized mean differences were less than 10%.58,59
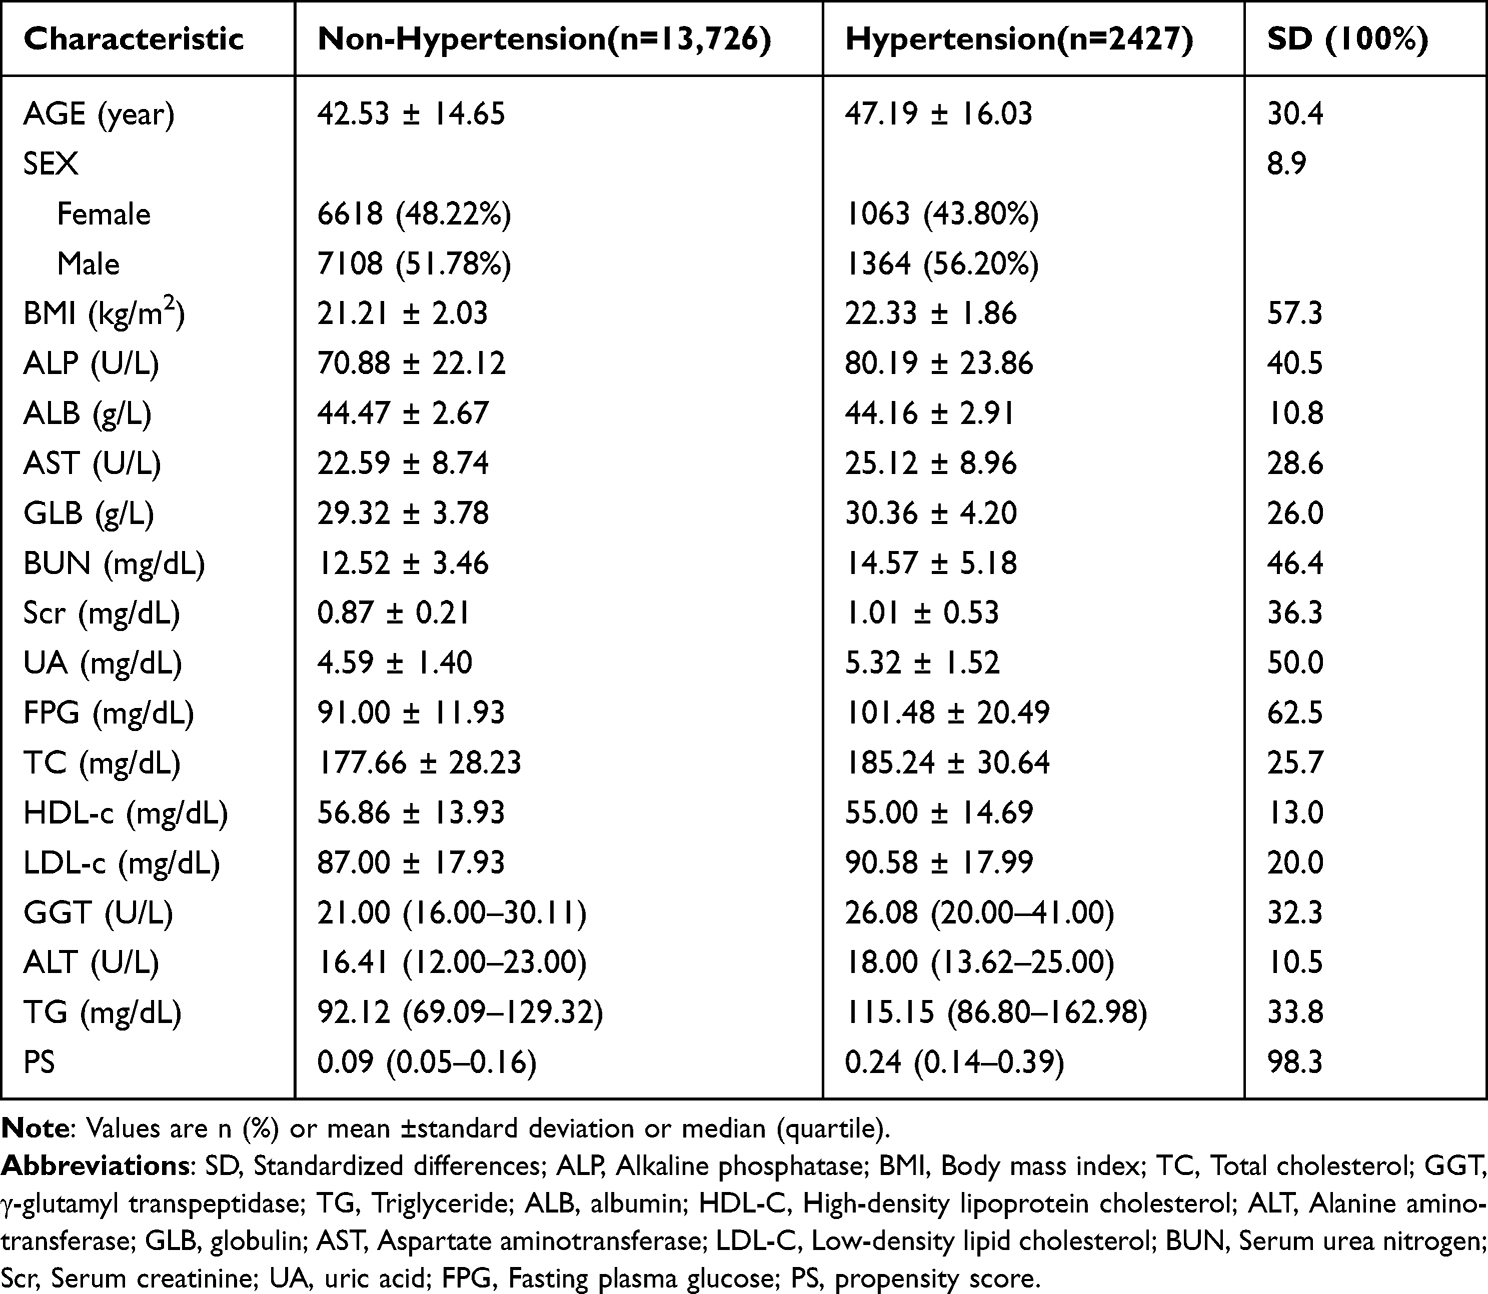 |
Table 1 Baseline Characteristics Before Propensity-Score Matching in the Entire Study Population |
The goal of the present study was to assess the effect of hypertension on incident NAFLD by using regression modeling and other methods to control for confounding. Specifically, we checked the robustness of our findings by comparing five methods: there were four propensity score methods (propensity score adjustment, matching, and two weighted regression adjustments) and multiple Cox proportional-hazards regressions. IPTW was used as weight for the inverse (estimated) propensity score, 1/PS, for hypertensive participants and the inverse of 1 minus the propensity score, 1/(1–PS), for non-hypertensive subjects. In this way, IPTW calculated a standardized effect measure based on all participants in the study as the standard population.41,60 SMR-weighted was analyzed using as weights the value 1 for hypertension and the propensity odds for the non-hypertension, PS/(1–PS), and estimated a standardized effect measure that considered the hypertensive group as the standard population.42
Subgroups were based on age, gender, and BMI. For the continuous variables, we converted them to categorical variables according to the clinical cut point. Each stratification was adjusted for all the factors except for the stratification factor itself. In the subgroup analyses, only the corresponding matched pairs in the same subgroup were chosen to maintain the balance of baseline characteristics between hypertensive and nonhypertensive groups. For example, in the subgroup of participants with BMI < 24 kg/m2, only when matched pairs of hypertensive and non-hypertensive participants both belong to the BMI < 24 kg/m2 subgroup, these participants could be included in the subgroup analysis.
For sensitivity analyses, genetic matching (GenMatch) was used. We applied a GenMatch algorithm (Diamond & Sekhon, 2013) implemented in the R Matching package (Sekhon, 2011) to perform matching.61 Matching implemented matching estimators as well as standard error estimators described by Abadie and Imbens (2006) for estimating treatment effects.61 Scaling was used in GenMatch. The main feature of GenMatch was that it could be repeatedly matched, ie, one observation (hypertensive participants) could be matched to multiple controls (non-hypertensive participants), and the matching goal was to maximize the balance of covariates between the matched groups, with matching resulting in numbers of both hypertensive and non-hypertensive individuals equal to the total study population. Cox proportional-hazards regression was used to assess the association between hypertension and incident NAFLD after GenMatch for the sensitivity analysis. Based on the STROBE statement, all results were written.62,63 Additionally, we explored the potential for unmeasured confounding between hypertension and the risk of NAFLD by calculating E-values.64
The statistics were analyzed using Empower Stats (X & Y Solutions, Boston, MA, USA) as well as the statistical package R. (http://www.R-project.org, The R Foundation). HRs and 95% confidence intervals (CIs) were calculated. P<0.05 was taken as statistically significant.
Results
Study Population
16,153 participants (52.45% male and 47.55% female) met the inclusion criteria (Figure 1), of whom 2427 (15.03%) had hypertension, and 13,726 (84.97%) had no hypertension. The mean age of the participants was 43.23±14.96 years. 2321 (14.37%) developed NAFLD during the median of 2.98 years of follow-up. Before propensity-score matching, several baseline characteristics differed between participants in the hypertensive and non-hypertensive groups (Table 1). We found that individuals with hypertension generally had higher age, TC, Scr, LDL-c, ALT, TG, FPG, AST, GGT, ALP, GLB, BUN, BMI, and UA. In contrast, persons with hypertension had lower levels of ALB and HDL-c. Taking into account the bias caused by multiple imputation of the data, we compared the differences in baseline variables between the interpolated cohort and the complete cohort after the removal of missingness (Table S1). The results found no significant differences in most variables, such as age, gender, the proportion of hypertension, and incidence of NAFLD. This suggested that missing data did not lead to significant selection bias.
Propensity Score Model
The C-statistic was 0.795 for the logistic model used for propensity matching (Figure 2). The ORs of hypertension for all variables included in the propensity score model were presented in Table S2. The mean propensity score of hypertensive participants was 0.26 (standard deviation, 0.21) compared with 0.13 (standard deviation, 0.12) for participants without hypertension (P<0.001) (Figure S2). The probability density functions of the propensity score for hypertensive and non-hypertensive participants were summarized in Figure 3. As expected, the distribution curve of the propensity score for hypertensive participants shifted toward 1, whereas the distribution for the non-hypertensive group was toward 0. This figure also illustrated that the overlap of the propensity score for hypertension and non-hypertension was restricted to a narrow range (Figure 3). We also used the generalized additive models (GAM) and smooth curve fitting (penalized spline method) to address the nonlinear relationship between the propensity score and hypertension (Figure S3). We found that as PS increased, the prevalence of hypertension increased accordingly, with a highly consistent trend between the two.
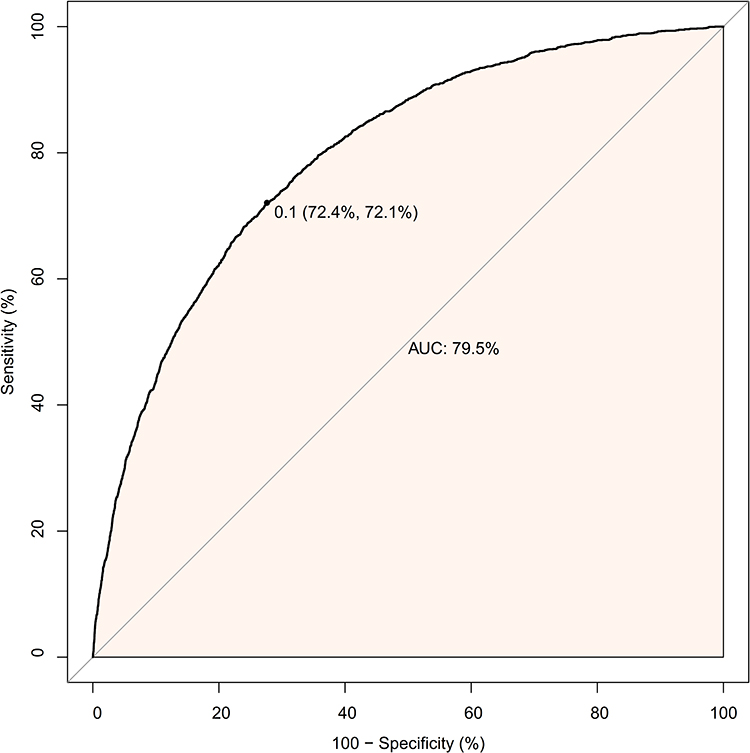 |
Figure 2 The ROC curve of the propensity score to predict hypertension. The logistic model was used to estimate the propensity score, which yielded a c-statistic of 0.795. |
 |
Figure 3 Distribution of propensity score in hypertension and non-hypertension groups before matching. The probability density functions of the propensity score for hypertensive and non-hypertensive participants. |
Propensity-Stratum-Specific Effects
NAFLD incidence varied markedly between hypertensive and non-hypertensive groups in terms of PS levels. According to percentiles of propensity scores, information on the proportion of participants in the hypertensive and non-hypertensive groups who developed NAFLD during follow-up was summarized in Table 2. Several things were notable. First, no individuals were in the hypertension group below the 1st percentile of the overall PS. Second, the incidence of NAFLD increased with the propensity scores among those two groups. As a result, the associated empirical odds ratio for NAFLD risk had gone from 0.67 for those in the 90–95th percentile of the PS to 7.48 for those in the 5–10th percentile (Table 2).
 |
Table 2 Proportion of NAFLD Among 16,153 NAFLD-Free Non-Obese Individuals Who Were Hypertension or Not, According to Percentiles of the Propensity Score for the Entire Study Population |
Matching
Using a matching criterion of ±0.01 of the PS, 85.1% of the 2427 participants with hypertension could be matched with those without hypertension. Participants’ baseline characteristics in the matched groups (hypertensive and non-hypertensive groups) were well matched after propensity score matching (Table 3). Based on the baseline characteristics, there were less than 10% standardized differences for all variables, indicating good matching between the participants. The average propensity scores in the matched population were 0.27 (standard deviation, 0.18) for hypertensive and 0.26 (standard deviation, 0.18) for non-hypertensive participants (P=0.112) (Figure S4).
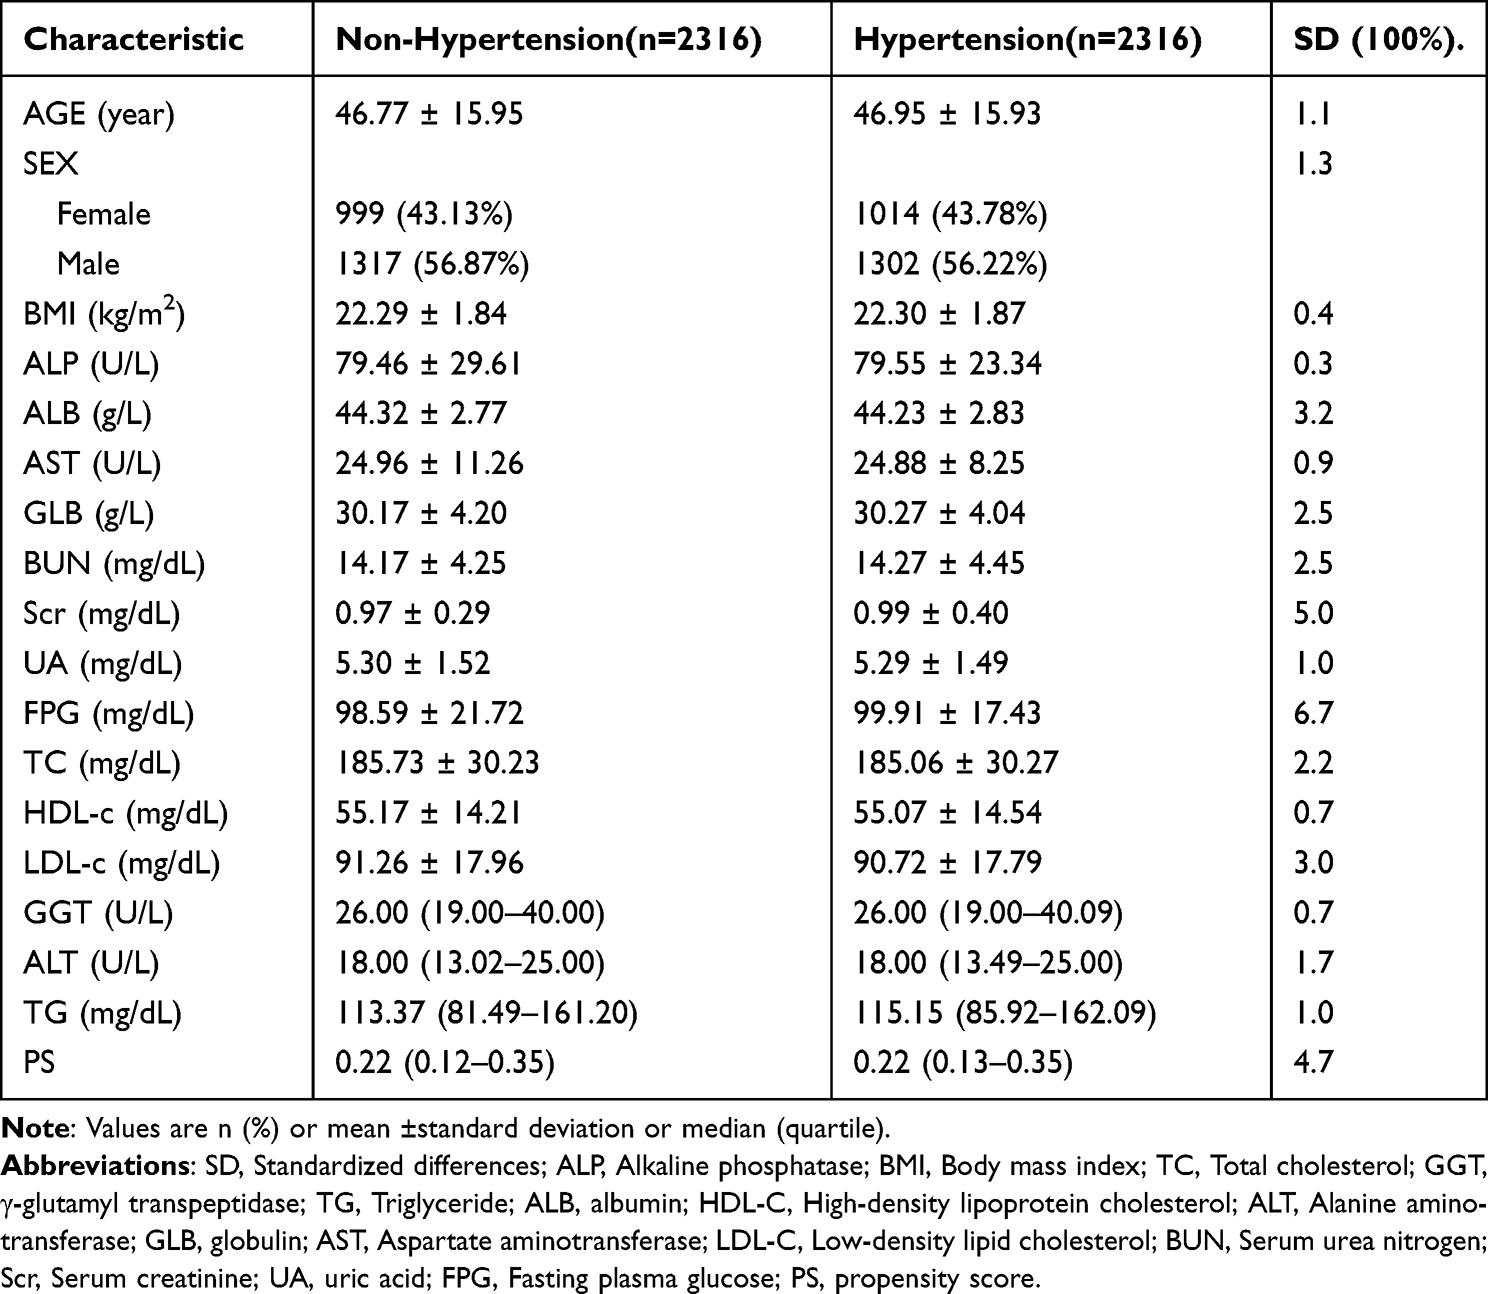 |
Table 3 Baseline Characteristics After Propensity-Score Matching in the Matching Study Population |
A summary of the probability density functions of the propensity score for hypertensive and non-hypertensive participants was shown in Figure 4. There was no significant difference in the distribution of propensity scores for hypertensive and non-hypertensive participants (Figure 4).
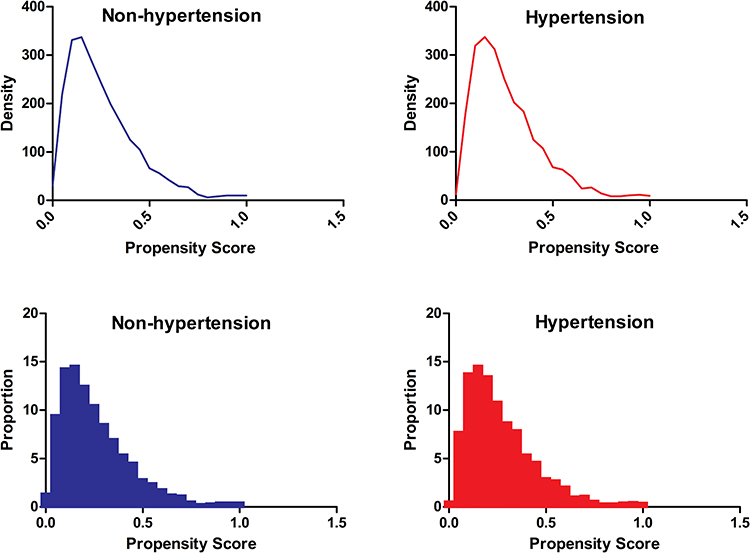 |
Figure 4 Distribution of propensity score in hypertension and non-hypertension groups after matching. The probability density functions of the propensity score for hypertensive and non-hypertensive participants after matching. |
Comparison of Different Methods to Control for Confounding
The crude hazard ratio between hypertension and incident NAFLD was 2.05 (95% CI: 1.87, 2.25). Hazard ratios of NAFLD for all variables included as covariates in the Cox multivariable model were presented in Table S3. Participants with hypertension in the original population had a lower probability of surviving without NAFLD than those without hypertension, according to Kaplan-Meier curves (P<0.0001) (Figure 5).
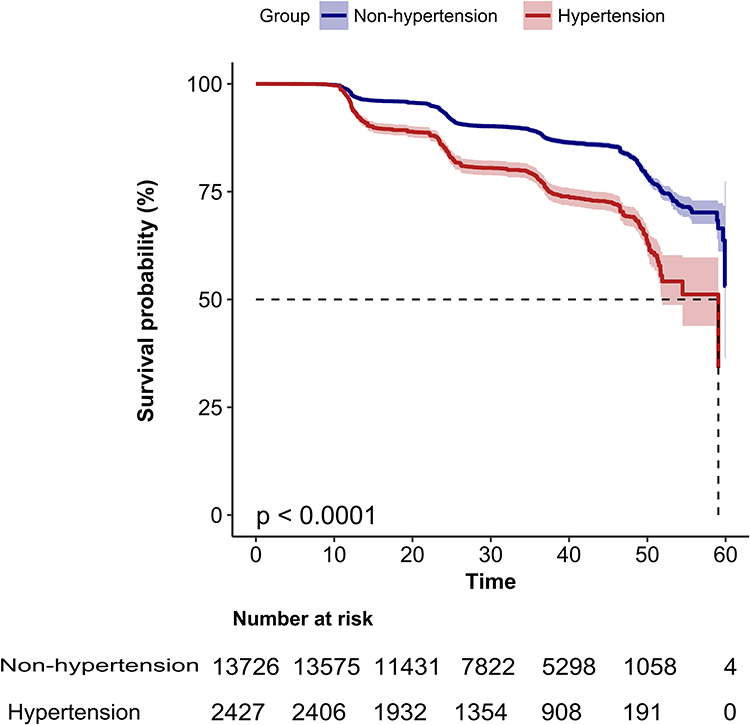 |
Figure 5 Kaplan–Meier event-free survival curve based on hypertension in the original cohort. Kaplan–Meier analysis of the probability of NAFLD-free survival based on hypertension (HBP) and non-hypertension (NHBP) in the original cohort (log-rank, P < 0.0001). |
Statistically, the estimated effects from the five different methods of controlling confounding differed from each other, and they were summarized in Table 4. The propensity-matched analysis yielded the smallest estimated hazard ratio of 1.09 (95% CI: 0.97,1.23), followed by the Cox proportional-hazards regression model, including the individual covariates without the PS produced an estimated hazard ratio of 1.15 (95% CI: 1.04, 1.28). After additional adjusting for the PS in the Cox proportional-hazards regression model, yielded estimated hazard ratios were to a high of 1.19 (95% CI: 1.08, 1.32), compared to adjusting for covariates without the propensity score in the Cox proportional-hazards regression model. Besides, the IPTW and SMR-weighted models yielded a higher hazard ratio estimate of 1.59 (95% CI: 1.43, 1.77) and 2.24 (95% CI: 2.05, 2.44), respectively.
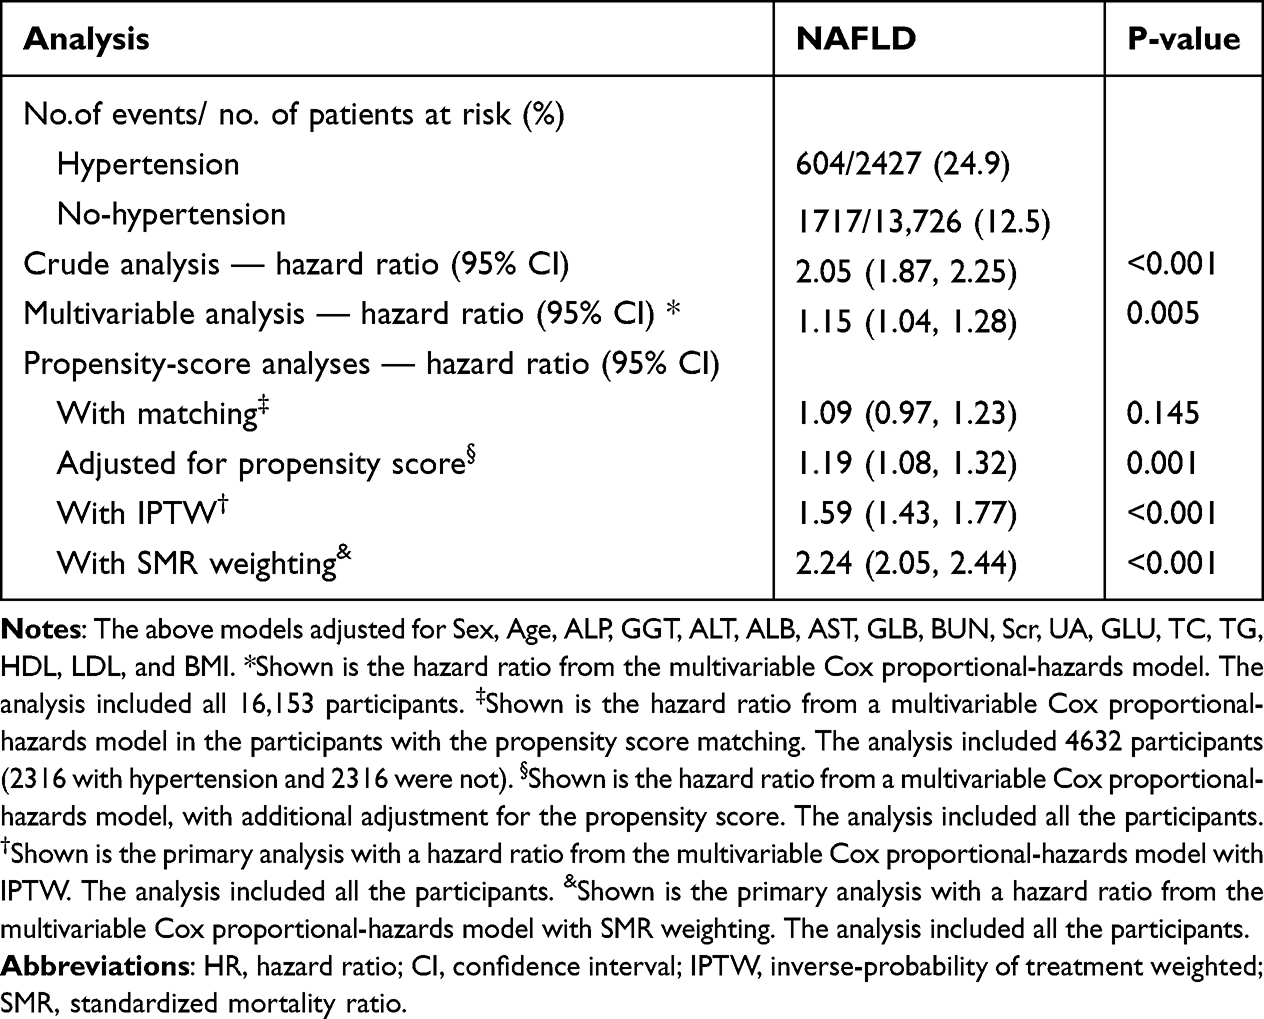 |
Table 4 Associations Between Hypertension and NAFLD in the Crude Analysis, Multivariable Analysis, and Propensity-Score Analyses |
Because of the difference in the empirical NAFLD hazard ratio shown in Table 2 between the low-propensity stratum and the high-propensity stratum, we reported in Table 5 an analysis limited to participants with a propensity score ≥0.08. The crude hazard ratio in this restricted population was 1.34 (95% CI: 1.22, 1.47). From the five different methods, the ranges of estimated HRs were getting smaller and smaller from each other or from the crude HR. The SMR-weighted analysis again yielded the highest estimated HR of 1.80 (95% CI: 1.67, 1.97), while the propensity-matched analysis yielded the lowest estimated HR of 1.04 (95% CI: 0.92, 1.17).
 |
Table 5 Associations Between Hypertension and NAFLD in the Crude Analysis, Multivariable Analysis, and Propensity-Score Analyses (Restriction to Participants Whose Propensity Score is Above 0.08) |
Subgroup Analysis
We used a subgroup analysis to detect the effect of potential confounders, which might affect the relationship between hypertension and incident NAFLD. We treated age, gender, and BMI as the stratification variables to evaluate the trend of effect sizes in these variables. Table 6 showed that among people with different gender, ages, and BMI groups, the relationship between hypertension and NAFLD was basically stable.
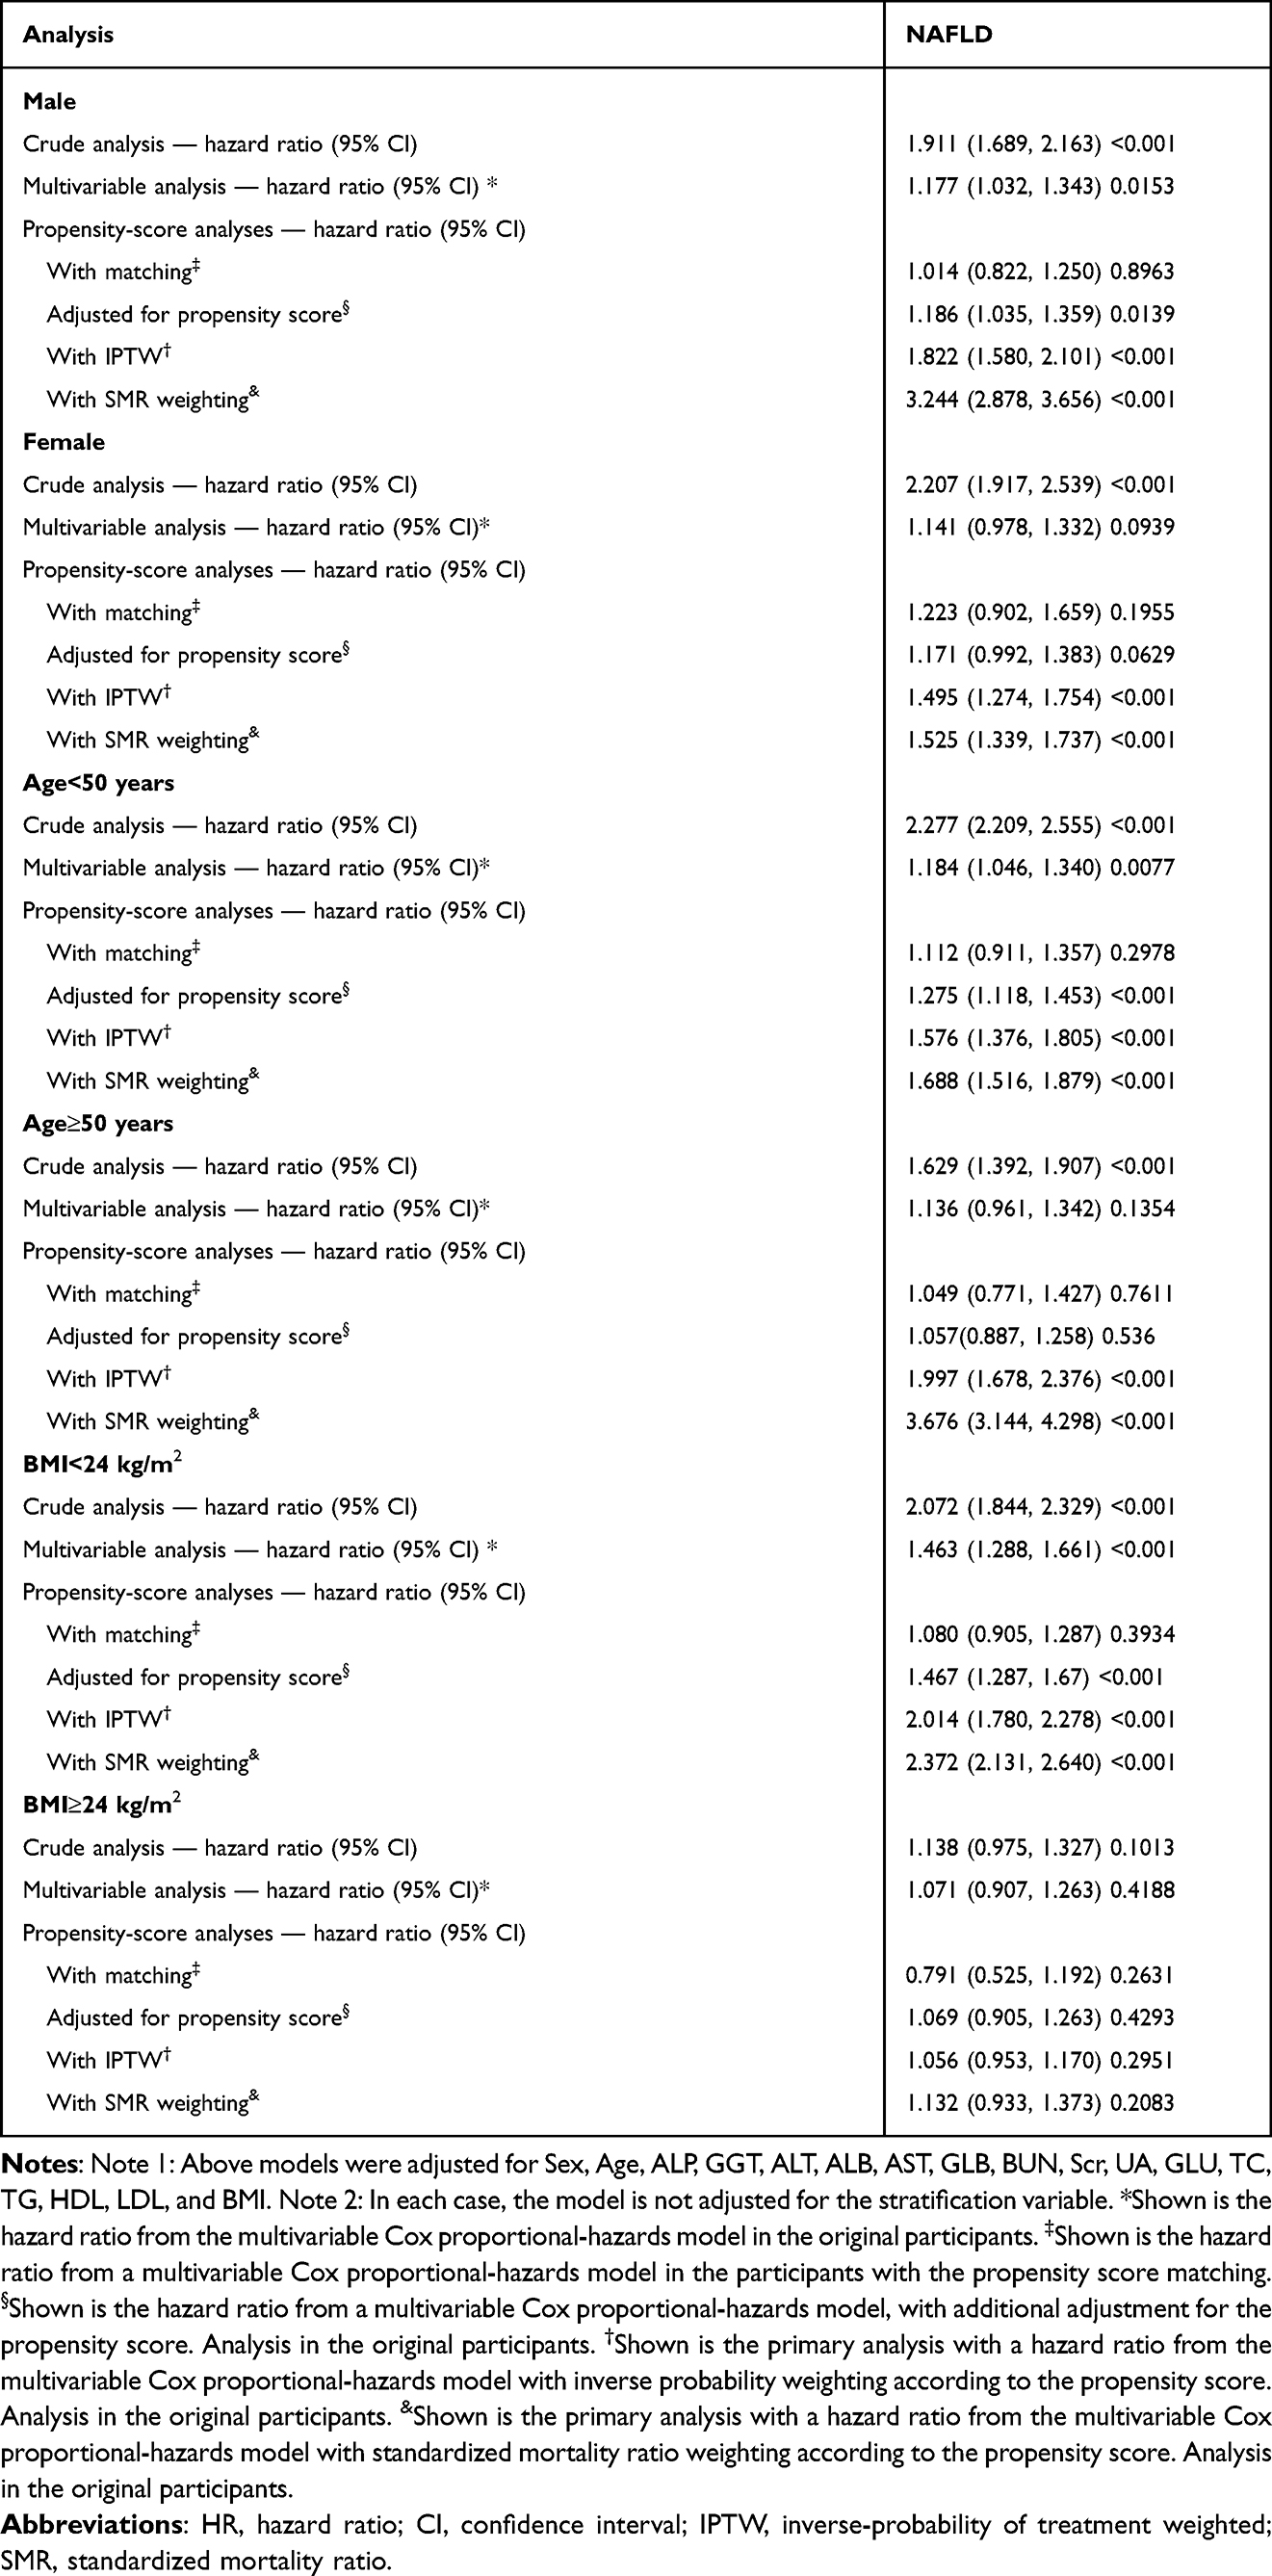 |
Table 6 Associations Between Hypertension and NAFLD in Different Subgroups |
Sensitivity Analysis
Because part of the HR obtained from the five analyses was not statistically significant, we would perform sensitivity analysis using another matching method. The Cox proportional hazard regression model was applied to assess the relationship between hypertension and incident NAFLD in the GenMatch cohort to ensure the robustness of the results.
16,153 hypertensive subjects were matched with 16,153 non-hypertensive participants with one-to-one genetic matching. After matching, the standardized mean differences between the two groups in the most baseline characteristics were less than 10%, suggesting minimal differences (Table 7).
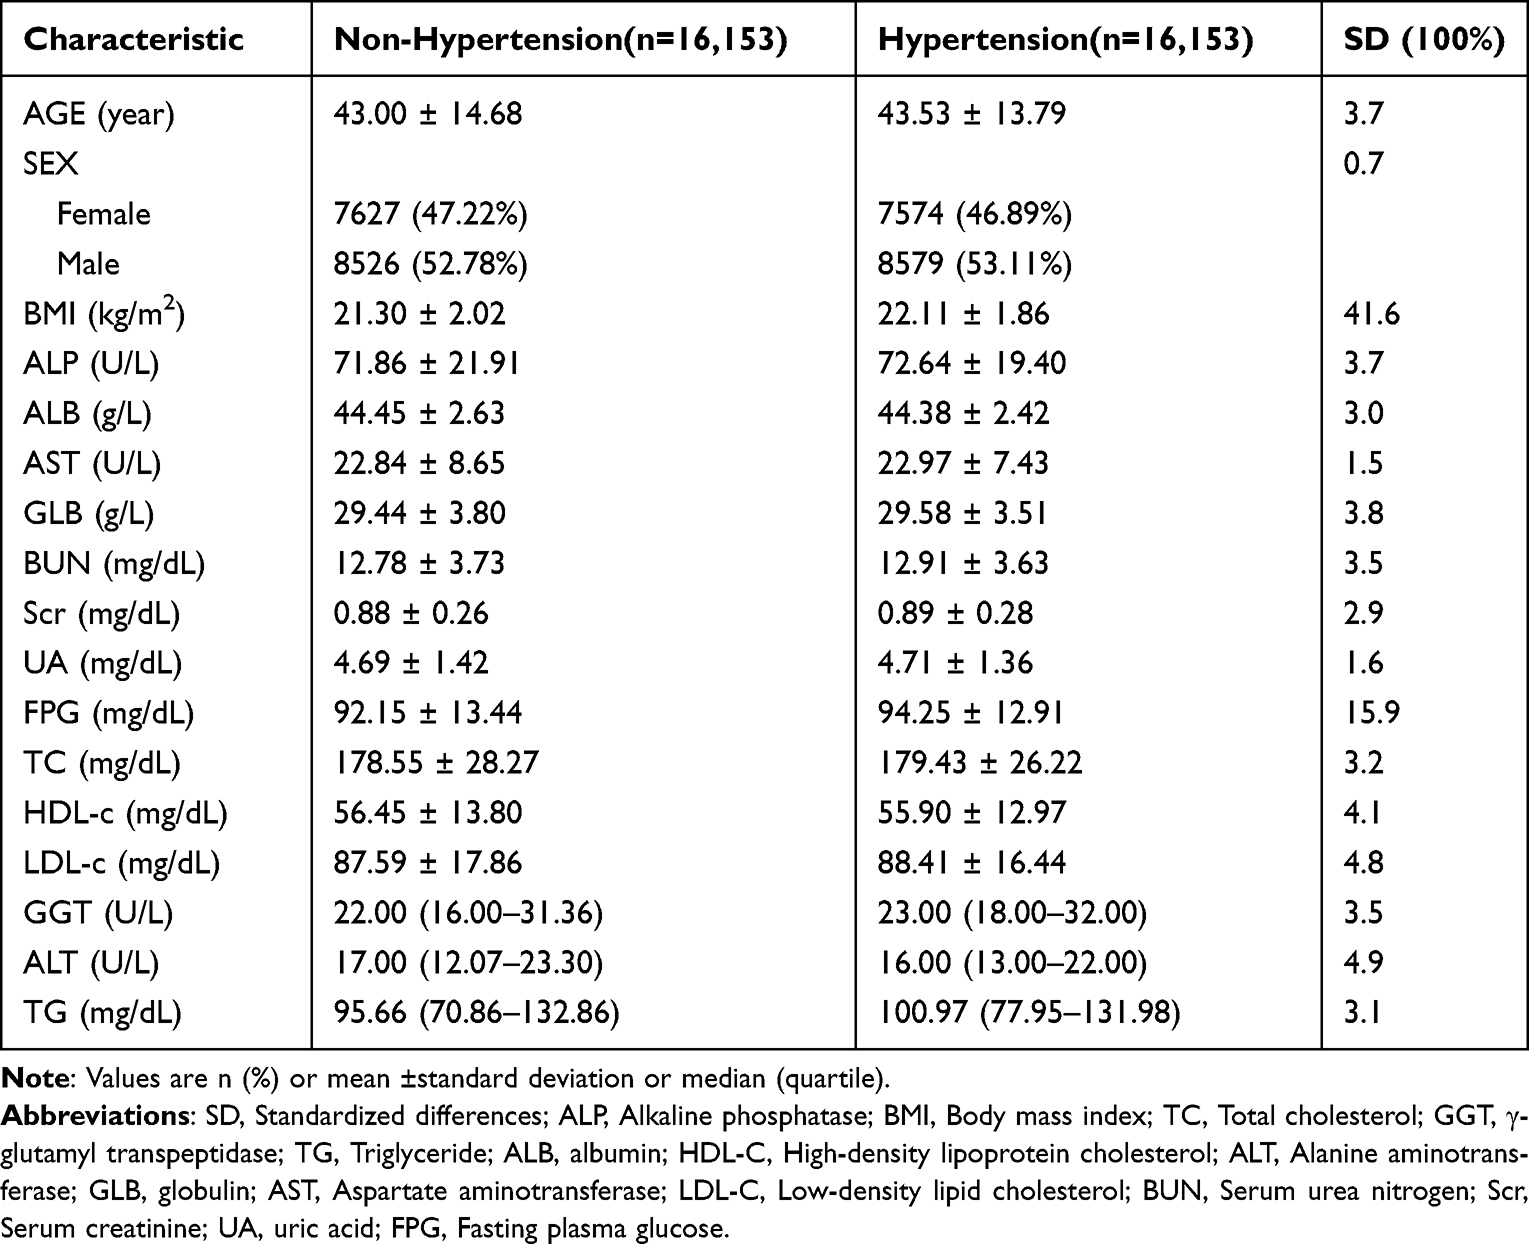 |
Table 7 Baseline Characteristics After Genetic Matching |
The results of unadjusted, minimally adjusted, and fully adjusted analyses in the GenMatch cohort were simultaneously shown in Table 8. We found that hypertension was associated with an increased risk of NALFD. Compared with the participants with non-hypertension, the risk of NAFLD in the hypertensive population increased by 6% (HR=1.06, 95% CI: 1.01–1.12, P= 0.030) in the full model. Besides, the authors generated an E-value to assess the sensitivity to unmeasured confounding. The E-value was 1.40–3.91. The E-value was greater than the relative risk of unmeasured confounders and hypertension, suggesting unmeasured or unknown confounders had little effect on the relationship between hypertension and NAFLD risk.
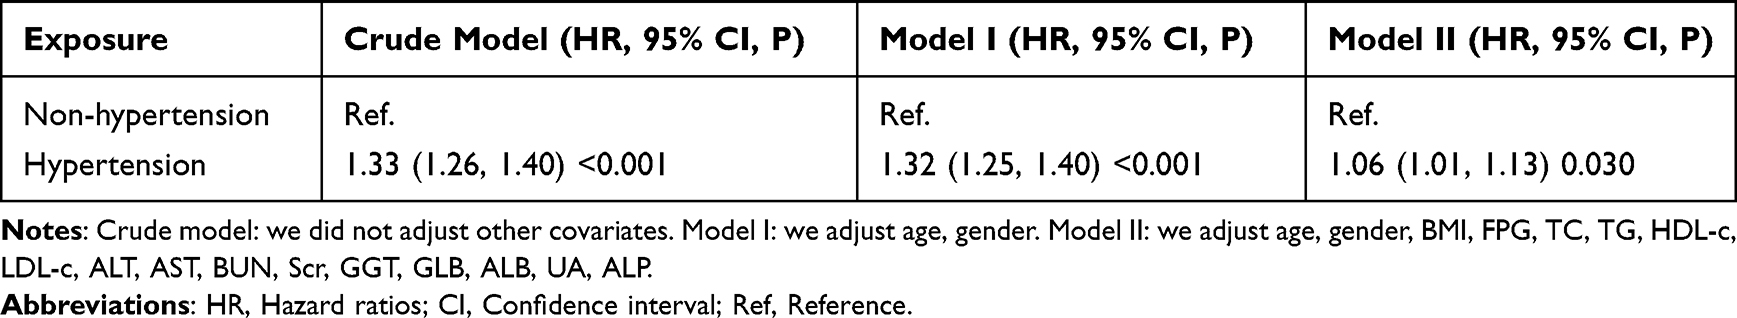 |
Table 8 Associations Between Hypertension and NAFLD After Genetic Matching |
Discussion
Using data on hypertension and NAFLD from a computerized database, we found that five different methods to control for confounding resulted in not much difference in effect estimates, ranging from estimated HRs of 1.09 (95% CI: 0.97, 1.23) for the propensity-matched analysis to 2.24 (95% CI: 2.05, 2.44) for the SMR weighted analysis. The results suggested that hypertension was an independent risk for developing NAFLD. The relationship also exists in the GenMatch cohort as a sensitivity analysis.
Both hypertension and NAFLD are growing public health problems that affect 30% to 45% and 25% of adults worldwide, respectively.3,65 NAFLD and hypertension are typically co-occurring disorders that increase metabolic and cardiovascular risks.66 Although these cardiovascular disease risk factors aggregate in metabolic syndrome, their independent associations have not been fully explored. Meanwhile, few such studies have been carried out in China so far. A study based on a cohort of 16,153 adults published in the Journal of the Gastroenterology Research and Practice found that after further adjustment for confounding variables, with increasing quartiles of the mean arterial pressure (MAP) (P for trend=0.002), the chance of developing NAFLD gradually increased. Compared with females in the Q1 of MAP, the HR for NAFLD in Q2, Q3, and Q4 was 1.76 (1.28–2.43), 2.08 (1.43–3.02), and 2.38 (1.45–3.89), respectively. In contrast, MAP was not associated with incident NAFLD in males (P >0.05).20 In another longitudinal study in China with 10,915 individuals, the researchers demonstrated that elevated SBP levels within the normal range were connected to significantly higher risks of NAFLD.23 In a cross-sectional study in Greece, Michopoulos et al found that newly diagnosed essential hypertension was independently associated with NAFLD (OR=2.18,95% CI:1.25,3.78). Some results were consistent with ours in the above studies, and some research results were inconsistent with ours. After analyzing these inconsistent findings, we hypothesized that they might be explained by the following factors: (1) The research population differed, including age, gender, and race. (2) Sample sizes varied among studies. (3) Different studies adjusted for different covariates, affecting the relationship between hypertension and NAFLD risk. (4) Different research types might lead to different research results. (5) It was worth noting that different methods of dealing with confounding factors might affect the study results to a large extent. It is necessary to explore the relationship between hypertension and incident NAFLD by dealing with confounding factors in different ways. Our study simultaneously analyzed the relationship between hypertension and NAFLD through five methods commonly used in observational studies and obtained consistent results. We also found that the results of the propensity-matched analysis were not in line with the results of other statistical methods. We tend to think that this was related to the reduction of the sample after propensity score matching. Before the PSM, there were a total of 16,173 participants. However, only 4632 participants (2316 hypertensive and 2316 non-hypertensive) left after the PSM. In addition, other indicators might influence the relationship between hypertension and NAFLD. After propensity score matching, the effects of other indicators between hypertensive and non-hypertensive participants were eliminated. This might also lead to a weakening of the strength of the association between hypertension and NAFLD. However, although the HR for the association between hypertension and NAFLD was not statistically significant after propensity matching, the trend toward hypertension as a risk factor for NAFLD was still present. We added to the existing literature supporting hypertension as a risk factor for NAFLD. Our results supported a positive impact of hypertension on the development of NAFLD. Hypertension plays a significant role in NAFLD risk, and understanding its effects will help clinicians better communicate with patients and develop more individualized management plans. Therefore, actively controlling blood pressure can reduce the risk of NAFLD in the future. In addition, using natural products as an alternative approach in the treatment of NAFLD has drawn growing attention among physicians. In recent years, some random control trials have found that Spirulina maxima, Olive oil, Garlic powder supplement, Berberine, and Curcumin are used for NAFLD treatment and achieved significant results.67
In the absence of unmeasured confounding, the SMR-weighted method calculates the average hypertensive effect in a population with a distribution of risk factors equivalent to that in hypertensive individuals.42 As shown in Table 2, participants with hypertension had an increased risk of NAFLD with an empirical odds ratio of 2.32, so it was not surprising that the SMR-weighted hazard ratio was 2.24. Therefore, an SMR-weighted hazard ratio down to 1.80 was also accepted when restricted to participants with a propensity score ≥0.08. Contrary to this, IPTW estimated the average hypertensive effect across the entire study population, including participants with and without hypertension. Considering that 80% of the whole study population was in the four PS strata associated with empirical OR ranging from 1.05 to 2.77 (Table 2), it was not surprising that the IPTW estimated HR to be 1.59. Similarly, it was acceptable that the IPTW estimated HR down to 1.38 when the participants in 10–25% strata were excluded by limiting the analysis to the population with a propensity score ≥ 0.08. In fact, in the subpopulations dominated by participants with higher propensity scores, the estimated effect of treatment was close to 1. We thus found that, when limiting our study population to participants with a propensity score of above 0.08, all methods yielded comparable estimates, none of which differed significantly from 1.
As in the present study, when the number of non-hypertensive subjects was many times larger than that of hypertensive persons, the PSM process would match nearly all hypertensive participants. In contrast, this could result in some non-hypertensive participants being excluded from the analysis (which might result in slightly less efficiency). Consequently, the distribution of covariates in the non-hypertensive successfully matched subpopulation would be close to the distribution of covariates in the hypertensive participants. Therefore, it was acceptable that the propensity-matched estimated HR was the smallest among the five analysis methods.
Compared to the propensity-matched method, the SMR-weighted and IPTW analysis have the theoretical advantages that 1) data from all participants are used, and 2) further uncontrolled confounding factors unrelated to the inability to find a matching hypertensive participant are not a problem.68 To ensure that each of the hypertensive and non-hypertensive participants successfully matched each other without reducing the sample size, we adopted a one-to-one GenMatch method. We obtained consistent results with the above five methods, further supporting that hypertension is an independent risk for the high-risk development of NAFLD.
Based on this study, we propose a possible causal relationship between hypertension and NAFLD. However, there is considerable overlap in the etiology and disease mechanisms of hypertension and NAFLD. These two diseases have several things in common, including age, metabolic syndrome, obesity, and insulin resistance.69,70 It is common for the two to coexist in one individual in a complex, bidirectional relationship.71 The increase in blood pressure is caused by insulin resistance, which enhances salt absorption and activates the sympathetic nervous system.72 In turn, hypertension is an independent predictor of insulin resistance,73,74 but insulin resistance also promotes NAFLD through endothelial dysfunction in the liver.73,75 Therefore, hypertension could identify more vulnerable subjects to NAFLD in the nonobese population.
Our study has some strengths worth mentioning. Few cohort studies have used propensity scores to explore the association between hypertension and incident NAFLD. By balancing the distribution of baseline covariates, the PSM minimizes measurement confounding factors. According to PS, compared to other statistical methods, a correlation between the dependent and explanatory variables is not required since the effectiveness is calculated using the mean difference between matched individuals. Furthermore, potential confounding factors could affect the results, due to the observational study, we used five methods to deal with confounding factors to ensure the integrity and robustness of our results. We performed a set of sensitivity analyses to ensure the reliability of the results. In particular, we used a one-to-one GenMatch approach, which has the advantage of not reducing the sample size. Additionally, our study has the advantage of having a relatively larger sample size compared to previous studies.
Of course, our study has some limitations that should be noted. First, in light of the fact that the study participants were Chinese, further research is needed to determine whether these findings generalize to other races. Second, from the electronic database, we were unable to find any other significant variables, such as the history of diabetes and hypertension, change in BP, abnormal LDL levels, and fat participants. Third, primary (essential) hypertension was not distinguished from secondary (symptomatic) hypertension in the raw data. Since primary (essential) hypertension represents approximately 95% of the population with hypertension, arterial hypertension in the study was referred to as primary hypertension.76 Fourth, propensity score matching can lead to a reduction in sample size. This led to the HR for the association between hypertension and NAFLD was not statistically significant after propensity matching. When the weights for a small number of subjects are extremely large, weighted methods are likely to perform poorly. Even though some approximate fixes have been described, no perfect solution has yet been found.77 These few large weights mean that, without making additional a priori assumptions, it is not possible to obtain accurate estimates of the population parameters through the weighted method. The estimated standard-error-of-treatment effect, in this case, might underestimate the actual measure between the weighted estimator and the estimate of the population parameter. We conducted a set of sensitivity analyses to ensure the reliability of the results: restricting our study population to participants whose propensity scores were ≥0.08, establishing a GenMatch cohort through gene matching, and re-analyzing the relationship between hypertension and NAFLD. Fifth, there were missing data for some variables in our study, and some electronic health records might be inaccurate. Nonetheless, we used multiple imputations to handle the missing data of covariants to minimize bias.
Conclusion
We compared five methods for evaluating the effect of hypertension on the risk of NAFLD. Hypertension is a major cause of NAFLD in Chinese adults, with the hazard ratio ranging from 1.09 to 2.24. Considering interventions aimed at preventing NAFLD, blood pressure can be modified as a risk factor.
Abbreviations
NAFLD, Non-alcoholic fatty liver disease; FPG, Fasting plasma glucose; BMI, Body mass index; TC, Total cholesterol; BUN, Serum urea nitrogen; TG, Triglyceride; Scr, Serum creatinine; ALT, Alanine aminotransferase; LDL-c, Low-density lipid cholesterol; UA, Uric acid; ALP, Alkaline phosphatase; ALB, Albumin; GGT, γ-Glutamyl transpeptidase; GLB, Globulin; DM, Diabetes mellitus; HDL-c, High-density lipoprotein cholesterol; HR, hazard ratio; Ref, Reference; OR, odds ratio; PSM, Propensity score matching; CI, Confidence intervals; SMR, Standardized mortality ratio; HBP, Hypertension; PS, Propensity score; BP, Blood pressure; NHBP, Non-hypertension; DBP, Diastolic blood pressure; IPTW, Inverse probability of treatment weights; SBP, Systolic blood pressure; AST, Aspartate aminotransferase; SD, Standardized difference; GenMatch, genetic matching.
Data Sharing Statement
Data can be downloaded from the “DATADRYAD” database (https://datadryad.org/stash).
Ethical Approval and Consent to Participate
The previously published article46 stated the study was conducted in accordance with the Declaration of Helsinki. Written informed consent was obtained from each participant before participation in the study. The personal information of participants was erased, and their health examination numbers were replaced. The ethics committee of Wenzhou People’s Hospital and Hechi People’s Hospital approved the research protocol of the study.46
Acknowledgments
As this is a secondary analysis, the data and method description are mainly derived from the following research: Association of low-density lipoprotein cholesterol within the normal range and NAFLD in the non-obese Chinese population: a cross-sectional and longitudinal study. BMJ Open, doi:10.1136/bmjopen-2016-013781. We are grateful to all the authors of the study.
Author Contributions
All authors made a significant contribution to the work reported, whether that is in the conception, study design, execution, acquisition of data, analysis and interpretation, or in all these areas; took part in drafting, revising or critically reviewing the article; gave final approval of the version to be published; have agreed on the journal to which the article has been submitted; and agree to be accountable for all aspects of the work.
Funding
This study was supported by the Discipline Construction Ability Enhancement Project of the Shenzhen Municipal Health Commission (SZXJ2017031) and the Shenzhen Key Medical Discipline Construction Fund (SZXK009).
Disclosure
The authors declare that they have no competing interests.
References
1. Yu Y, Cai J, She Z, Li H. Insights into the epidemiology, pathogenesis, and therapeutics of nonalcoholic fatty liver diseases. Adv Sci. 2019;6:1801585. doi:10.1002/advs.201801585
2. Chalasani N, Younossi Z, Lavine JE, et al. The diagnosis and management of nonalcoholic fatty liver disease: practice guidance from the American Association for the Study of Liver Diseases. Hepatology. 2018;67:328–357. doi:10.1002/hep.29367
3. Younossi ZM, Koenig AB, Abdelatif D, Fazel Y, Henry L, Wymer M. Global epidemiology of nonalcoholic fatty liver disease-Meta-analytic assessment of prevalence, incidence, and outcomes. Hepatology. 2016;64:73–84. doi:10.1002/hep.28431
4. Amarapurkar DN, Hashimoto E, Lesmana LA, Sollano JD, Chen PJ, Goh KL. How common is non-alcoholic fatty liver disease in the Asia-Pacific region and are there local differences? J Gastroenterol Hepatol. 2007;22:788–793. doi:10.1111/j.1440-1746.2007.05042.x
5. Araújo AR, Rosso N, Bedogni G, Tiribelli C, Bellentani S. Global epidemiology of non-alcoholic fatty liver disease/non-alcoholic steatohepatitis: what we need in the future. Liver Int. 2018;38(Suppl 1):47–51. doi:10.1111/liv.13643
6. Hyogo H, Chayama K, Yamagishi S. Nonalcoholic fatty liver disease and cardiovascular disease. Curr Pharm Des. 2014;20:2403–2411. doi:10.2174/13816128113199990476
7. Musso G, Gambino R, Tabibian JH, et al. Association of non-alcoholic fatty liver disease with chronic kidney disease: a systematic review and meta-analysis. Plos Med. 2014;11:e1001680. doi:10.1371/journal.pmed.1001680
8. Zheng X, Cao C, He Y, Wang X, Wu J, Hu H. Association between nonalcoholic fatty liver disease and incident diabetes mellitus among Japanese: a retrospective cohort study using propensity score matching. Lipids Health Dis. 2021;20:59. doi:10.1186/s12944-021-01485-x
9. Zhao Y, Zhao G, Chen Z, She Z, Cai J, Li H. Nonalcoholic fatty liver disease. Hypertension. 2020;75:275–284. doi:10.1161/HYPERTENSIONAHA.119.13419
10. Negi CK, Babica P, Bajard L, Bienertova-Vasku J, Tarantino G. Insights into the molecular targets and emerging pharmacotherapeutic interventions for nonalcoholic fatty liver disease. Metabolism. 2022;126:154925. doi:10.1016/j.metabol.2021.154925
11. Rinella ME. Nonalcoholic fatty liver disease: a systematic review. JAMA. 2015;313:2263–2273. doi:10.1001/jama.2015.5370
12. Younossi ZM, Stepanova M, Negro F, et al. Nonalcoholic fatty liver disease in lean individuals in the United States. Medicine. 2012;91:319–327. doi:10.1097/MD.0b013e3182779d49
13. Fan JG, Kim SU, Wong VW. New trends on obesity and NAFLD in Asia. J Hepatol. 2017;67:862–873. doi:10.1016/j.jhep.2017.06.003
14. Vanwagner LB, Armstrong MJ. Lean NAFLD: a not so benign condition? Hepatol Commun. 2018;2:5–8. doi:10.1002/hep4.1143
15. Hagström H, Nasr P, Ekstedt M, et al. Risk for development of severe liver disease in lean patients with nonalcoholic fatty liver disease: a long-term follow-up study. Hepatol Commun. 2018;2:48–57. doi:10.1002/hep4.1124
16. Fukuda T, Hamaguchi M, Kojima T, et al. The impact of non-alcoholic fatty liver disease on incident type 2 diabetes mellitus in non-overweight individuals. Liver Int. 2016;36:275–283. doi:10.1111/liv.12912
17. Yoshitaka H, Hamaguchi M, Kojima T, Fukuda T, Ohbora A, Fukui M. Nonoverweight nonalcoholic fatty liver disease and incident cardiovascular disease: a post hoc analysis of a cohort study. Medicine. 2017;96:e6712. doi:10.1097/MD.0000000000006712
18. Whelton PK, Carey RM, Aronow WS, et al. 2017 ACC/AHA/AAPA/ABC/ACPM/AGS/APhA/ASH/ASPC/NMA/PCNA guideline for the prevention, detection, evaluation, and management of high blood pressure in adults: a report of the American College of Cardiology/American Heart Association Task Force on clinical practice guidelines. Hypertension. 2018;71:e13–e115. doi:10.1161/HYP.0000000000000065
19. Vasunta RL, Kesäniemi YA, Ylitalo AS, Ukkola OH. High ambulatory blood pressure values associated with non-alcoholic fatty liver in middle-aged adults. J Hypertens. 2012;30:2015–2019. doi:10.1097/HJH.0b013e3283576faf
20. Xu S, Chen L, Hong D, Yang L, Li X, Wang X. Mean arterial pressure is related to incident nonalcoholic fatty liver disease among the nonobese female with normal low-density lipoprotein cholesterol levels: a large cohort study in China. Gastronet Res Pract. 2020;2020:1–9. doi:10.1155/2020/2549486
21. Wu SJ, Zou H, Zhu GQ, et al. Increased levels of systolic blood pressure within the normal range are associated with significantly elevated risks of nonalcoholic fatty liver disease. Medicine. 2015;94:e842. doi:10.1097/MD.0000000000000842
22. Qian LY, Tu JF, Ding YH, et al. Association of blood pressure level with nonalcoholic fatty liver disease in nonhypertensive population: normal is not the new normal. Medicine. 2016;95:e4293. doi:10.1097/MD.0000000000004293
23. Wu S, Zou H, Zhu G, et al. Increased levels of systolic blood pressure within the normal range are associated with significantly elevated risks of nonalcoholic fatty liver disease. Medicine. 2015;94:e842.
24. Aneni EC, Oni ET, Martin SS, et al. Blood pressure is associated with the presence and severity of nonalcoholic fatty liver disease across the spectrum of cardiometabolic risk. J Hypertens. 2015;33:1207–1214. doi:10.1097/HJH.0000000000000532
25. Li G, Peng Y, Chen Z, Li H, Liu D, Ye X. Bidirectional association between hypertension and NAFLD: a systematic review and meta-analysis of observational studies. Int J Endocrinol. 2022;2022:1–10.
26. Tsuneto A, Hida A, Sera N, et al. Fatty liver incidence and predictive variables. Hypertens Res. 2010;33:638–643. doi:10.1038/hr.2010.45
27. Zhang T, Zhang C, Zhang Y, et al. Metabolic syndrome and its components as predictors of nonalcoholic fatty liver disease in a northern urban Han Chinese population: a prospective cohort study. Atherosclerosis. 2015;240:144–148. doi:10.1016/j.atherosclerosis.2015.02.049
28. Liu P, Tang Y, Guo X, et al. Bidirectional association between nonalcoholic fatty liver disease and hypertension from the Dongfeng-Tongji cohort study. J Am Soc Hypertens. 2018;12:660–670. doi:10.1016/j.jash.2018.06.013
29. Kirovski G, Schacherer D, Wobser H, et al. Prevalence of ultrasound-diagnosed non-alcoholic fatty liver disease in a hospital cohort and its association with anthropometric, biochemical and sonographic characteristics. Int J Clin Exp Med. 2010;3:202–210.
30. Huang Q, Yu H, Zhong X, Tian Y, Cui Z, Quan Z. Association between hypertension and nonalcoholic fatty liver disease: a cross-sectional and meta-analysis study. J Hum Hypertens. 2022. doi:10.1038/s41371-022-00686-w
31. Yin JM, Li Z, Jiang LY. Case-control study on the risk factors of nonalcoholic fatty liver disease based on physical examination people in hospital. Chin J Prev Control Chronic Dis. 2011;20:154.
32. Siu JM, McCarty JC, Gadkaree S, et al. Association of vessel-sealant devices vs conventional hemostasis with postoperative neck hematoma after thyroid operations. Jama Surg. 2019;154:e193146. doi:10.1001/jamasurg.2019.3146
33. Braitman LE, Rosenbaum PR. Rare outcomes, common treatments: analytic strategies using propensity scores. Ann Intern Med. 2002;137:693–695. doi:10.7326/0003-4819-137-8-200210150-00015
34. Rosenbaum PR, Rubin DB. Constructing a Control Group using multivariate matched sampling methods that incorporate the propensity score. Am Stat. 1985;39:33–38.
35. Thomas RN, Thomas N. Matching using estimated propensity scores: relating theory to practice. Biometrics. 1996;52:249–264. doi:10.2307/2533160
36. D’Agostino RJ. Propensity score methods for bias reduction in the comparison of a treatment to a non-randomized control group. Stat Med. 1998;17:2265–2281. doi:10.1002/(SICI)1097-0258(19981015)17:19<2265::AID-SIM918>3.0.CO;2-B
37. Geleris J, Sun Y, Platt J, et al. Observational study of hydroxychloroquine in hospitalized patients with Covid-19. N Engl J Med. 2020;382:2411–2418. doi:10.1056/NEJMoa2012410
38. Hirano K, Imbens GW, Ridder G. Efficient estimation of average treatment effects using the estimated propensity score. Econometrica. 2003;71:1161–1189. doi:10.1111/1468-0262.00442
39. Hirano K, Imbens GW. Estimation of causal effects using propensity score weighting: an application to data on right heart catheterization. Health Serv Outcomes Res Methodol. 2001;2:259–278. doi:10.1023/A:1020371312283
40. Wu Y, Hu H, Cai J, et al. Association of hypertension and incident diabetes in Chinese adults: a retrospective cohort study using propensity-score matching. BMC Endocr Disord. 2021;21:87. doi:10.1186/s12902-021-00747-0
41. Robins JM, Hernán MA, Brumback B. Marginal structural models and causal inference in epidemiology. Epidemiology. 2000;11:550–560. doi:10.1097/00001648-200009000-00011
42. Sato T, Matsuyama Y. Marginal structural models as a tool for standardization. Epidemiology. 2003;14:680–686. doi:10.1097/01.EDE.0000081989.82616.7d
43. Cepeda MS, Boston R, Farrar JT, Strom BL. Comparison of logistic regression versus propensity score when the number of events is low and there are multiple confounders. Am J Epidemiol. 2003;158:280–287. doi:10.1093/aje/kwg115
44. Harrell FJ, Lee KL, Mark DB. Multivariable prognostic models: issues in developing models, evaluating assumptions and adequacy, and measuring and reducing errors. Stat Med. 1996;15:361–387. doi:10.1002/(SICI)1097-0258(19960229)15:4<361::AID-SIM168>3.0.CO;2-4
45. Harrell FJ, Lee KL, Califf RM, Pryor DB, Rosati RA. Regression modelling strategies for improved prognostic prediction. Stat Med. 1984;3:143–152. doi:10.1002/sim.4780030207
46. Sun D, Wu S, Liu W, et al. Association of low-density lipoprotein cholesterol within the normal range and NAFLD in the non-obese Chinese population: a cross-sectional and longitudinal study. BMJ Open. 2016;6:e13781. doi:10.1136/bmjopen-2016-013781
47. Wu SJ, Zhu GQ, Ye BZ, et al. Association between sex-specific serum uric acid and non-alcoholic fatty liver disease in Chinese adults: a large population-based study. Medicine. 2015;94:e802. doi:10.1097/MD.0000000000000802
48. Zeng MD, Li YM, Chen CW, et al. Guidelines for the diagnosis and treatment of alcoholic liver disease. J Dig Dis. 2008;9:113–116. doi:10.1111/j.1751-2980.2008.00332.x
49. Gao X, Fan JG. Diagnosis and management of non-alcoholic fatty liver disease and related metabolic disorders: consensus statement from the Study Group of Liver and Metabolism, Chinese Society of Endocrinology. J Diabetes. 2013;5:406–415. doi:10.1111/1753-0407.12056
50. Jones NR, McCormack T, Constanti M, McManus RJ. Diagnosis and management of hypertension in adults: NICE guideline update 2019. Br J Gen Pract. 2020;70:90–91. doi:10.3399/bjgp20X708053
51. Wang JG, Chia YC, Chen CH, et al. What is new in the 2018 Chinese hypertension guideline and the implication for the management of hypertension in Asia? J Clin Hypertens. 2020;22:363–368. doi:10.1111/jch.13803
52. Williams B, Mancia G, Spiering W. 2018 ESC/ESH Guidelines for the management of arterial hypertension. Rev Esp Cardiol. 2019;72:160. doi:10.1016/j.rec.2018.12.004
53. Wu Y, Hu H, Cai J, et al. A prediction nomogram for the 3-year risk of incident diabetes among Chinese adults. Sci Rep. 2020;10:21716. doi:10.1038/s41598-020-78716-1
54. Groenwold RH, White IR, Donders AR, Carpenter JR, Altman DG, Moons KG. Missing covariate data in clinical research: when and when not to use the missing-indicator method for analysis. CMAJ. 2012;184:1265–1269. doi:10.1503/cmaj.110977
55. White IR, Royston P, Wood AM. Multiple imputation using chained equations: issues and guidance for practice. Stat Med. 2011;30:377–399. doi:10.1002/sim.4067
56. Ahmed A, Husain A, Love TE, et al. Heart failure, chronic diuretic use, and increase in mortality and hospitalization: an observational study using propensity score methods. Eur Heart J. 2006;27:1431–1439. doi:10.1093/eurheartj/ehi890
57. Normand ST, Landrum MB, Guadagnoli E, et al. Validating recommendations for coronary angiography following acute myocardial infarction in the elderly: a matched analysis using propensity scores. J Clin Epidemiol. 2001;54:387–398. doi:10.1016/S0895-4356(00)00321-8
58. Austin P. Using the standardized difference to compare the prevalence of a binary variable between two groups in observational research. Commun Stat. 2009;1228–1234. doi:10.1080/03610910902859574
59. Navale SM, Szubski CR, Klika AK, Schiltz NK, Desai PP, Barsoum WK. The impact of solid organ transplant history on inpatient complications, mortality, length of stay, and cost for primary total hip arthroplasty admissions in the United States. J Arthroplasty. 2017;32:1107–1116. doi:10.1016/j.arth.2016.10.017
60. Hernán MA, Brumback B, Robins JM. Marginal structural models to estimate the causal effect of zidovudine on the survival of HIV-positive men. Epidemiology. 2000;11:561–570. doi:10.1097/00001648-200009000-00012
61. Abadie A, Imbens GW. Bias-corrected matching estimators for average treatment effects. J Bus Econ Stat. 2011;29:1–11. doi:10.1198/jbes.2009.07333
62. von Elm E, Altman DG, Egger M, Pocock SJ, Gøtzsche PC, Vandenbroucke JP. The Strengthening the Reporting of Observational Studies in Epidemiology (STROBE) statement: guidelines for reporting observational studies. Int J Surg. 2014;12:1495–1499. doi:10.1016/j.ijsu.2014.07.013
63. Vandenbroucke JP, von Elm E, Altman DG, et al. Strengthening the Reporting of Observational Studies in Epidemiology (STROBE): explanation and elaboration. Plos Med. 2007;4:e297. doi:10.1371/journal.pmed.0040297
64. Haneuse S, VanderWeele TJ, Arterburn D. Using the E-value to assess the potential effect of unmeasured confounding in observational studies. JAMA. 2019;321:602–603. doi:10.1001/jama.2018.21554
65. Chow CK, Teo KK, Rangarajan S, et al. Prevalence, awareness, treatment, and control of hypertension in rural and urban communities in high-, middle-, and low-income countries. JAMA. 2013;310:959–968. doi:10.1001/jama.2013.184182
66. Fallo F, Dalla PA, Sonino N, et al. Non-alcoholic fatty liver disease is associated with left ventricular diastolic dysfunction in essential hypertension. Nutr Metab Cardiovasc Dis. 2009;19:646–653. doi:10.1016/j.numecd.2008.12.007
67. Tarantino G, Balsano C, Santini SJ, et al. It is high time physicians thought of natural products for alleviating NAFLD. Is there sufficient evidence to use them? Int J Mol Sci. 2021;22:13424. doi:10.3390/ijms222413424
68. Rosenbaum PR, Rubin DB. The bias due to incomplete matching. Biometrics. 1985;41:103–116. doi:10.2307/2530647
69. Ferrannini E, Natali A, Capaldo B, Lehtovirta M, Jacob S, Yki-Järvinen H. Insulin resistance, hyperinsulinemia, and blood pressure: role of age and obesity. European Group for the Study of Insulin Resistance (EGIR). Hypertension. 1997;30:1144–1149. doi:10.1161/01.HYP.30.5.1144
70. Mancia G, Facchetti R, Bombelli M, et al. Relationship of office, home, and ambulatory blood pressure to blood glucose and lipid variables in the PAMELA population. Hypertension. 2005;45:1072–1077. doi:10.1161/01.HYP.0000165672.69176.ed
71. Zhao YC, Zhao GJ, Chen Z, She ZG, Cai J, Li H. Nonalcoholic fatty liver disease: an emerging driver of hypertension. Hypertension. 2020;75:275–284.
72. Reaven GM, Hoffman BB. A role for insulin in the aetiology and course of hypertension? Lancet. 1987;2:435–437. doi:10.1016/S0140-6736(87)90968-8
73. Donati G, Stagni B, Piscaglia F, et al. Increased prevalence of fatty liver in arterial hypertensive patients with normal liver enzymes: role of insulin resistance. Gut. 2004;53:1020–1023. doi:10.1136/gut.2003.027086
74. Ferrannini E, Buzzigoli G, Bonadonna R, et al. Insulin resistance in essential hypertension. N Engl J Med. 1987;317:350–357. doi:10.1056/NEJM198708063170605
75. Bugianesi E, Gastaldelli A, Vanni E, et al. Insulin resistance in non-diabetic patients with non-alcoholic fatty liver disease: sites and mechanisms. Diabetologia. 2005;48:634–642. doi:10.1007/s00125-005-1682-x
76. Manosroi W, Williams GH. Genetics of human primary hypertension: focus on hormonal mechanisms. Endocr Rev. 2019;40:825–856. doi:10.1210/er.2018-00071
77. Scharfstein DO, Robins R, Robins JM. Adjusting for nonignorable drop-out using semiparametric nonresponse models. J Am Stat Assoc. 1999;94:1096–1120. doi:10.1080/01621459.1999.10473862
 © 2023 The Author(s). This work is published and licensed by Dove Medical Press Limited. The
full terms of this license are available at https://www.dovepress.com/terms
and incorporate the Creative Commons Attribution
- Non Commercial (unported, 3.0) License.
By accessing the work you hereby accept the Terms. Non-commercial uses of the work are permitted
without any further permission from Dove Medical Press Limited, provided the work is properly
attributed. For permission for commercial use of this work, please see paragraphs 4.2 and 5 of our Terms.
© 2023 The Author(s). This work is published and licensed by Dove Medical Press Limited. The
full terms of this license are available at https://www.dovepress.com/terms
and incorporate the Creative Commons Attribution
- Non Commercial (unported, 3.0) License.
By accessing the work you hereby accept the Terms. Non-commercial uses of the work are permitted
without any further permission from Dove Medical Press Limited, provided the work is properly
attributed. For permission for commercial use of this work, please see paragraphs 4.2 and 5 of our Terms.
Recommended articles
Relationship Between Plasma Aldosterone Concentrations and Non-Alcoholic Fatty Liver Disease Diagnosis in Patients with Hypertension: A Retrospective Cohort Study
Hu J, Cai X, Zhu Q, Heizhati M, Wen W, Luo Q, Hong J, Dang Y, Yang W, Li N
Diabetes, Metabolic Syndrome and Obesity 2023, 16:1625-1636
Published Date: 6 June 2023
Hypertension and Histopathology Severity of Non-Alcoholic Fatty Liver Disease Among Adults with Obesity: A Cross-Sectional Study
Chambergo-Michilot D, Rodrigo-Gallardo PK, Huaman MR, Vasquez-Chavesta AZ, Salinas-Sedo G, Toro-Huamanchumo CJ
Clinical and Experimental Gastroenterology 2023, 16:129-136
Published Date: 14 August 2023