")
Back to Journals » Diabetes, Metabolic Syndrome and Obesity » Volume 14
Association Between Chinese Visceral Adiposity Index and Incident Type 2 Diabetes Mellitus in Japanese Adults
Authors Shang L , Li R, Zhao Y, Sun H , Tang B, Hou Y
Received 1 June 2021
Accepted for publication 3 August 2021
Published 24 August 2021 Volume 2021:14 Pages 3743—3751
DOI https://doi.org/10.2147/DMSO.S322935
Checked for plagiarism Yes
Review by Single anonymous peer review
Peer reviewer comments 2
Editor who approved publication: Dr Konstantinos Tziomalos
Luxiang Shang,1 Rui Li,2 Yang Zhao,3 Huaxin Sun,3 Baopeng Tang,3 Yinglong Hou1
1Department of Cardiology, The First Affiliated Hospital of Shandong First Medical University & Shandong Provincial Qianfoshan Hospital, Shandong Medicine and Health Key Laboratory of Cardiac Electrophysiology and Arrhythmia, Jinan, Shandong, People’s Republic of China; 2Shandong Provincial Center for Disease Control and Prevention, Jinan, Shandong, People’s Republic of China; 3Department of Pacing and Electrophysiology, Xinjiang Key Laboratory of Cardiac Electrophysiology and Remodeling, The First Affiliated Hospital of Xinjiang Medical University, Urumqi, Xinjiang, People’s Republic of China
Correspondence: Yinglong Hou
Department of Cardiology, The First Affiliated Hospital of Shandong First Medical University & Shandong Provincial Qianfoshan Hospital, No. 16766, Jingshi Road, Jinan, Shandong, 250014, People’s Republic of China
Tel +86 531-89269317
Email [email protected]
Background: Obesity is a well-known risk factor for type 2 diabetes mellitus (T2DM). Studies have shown that the Chinese visceral adiposity index (CVAI), a novel visceral adiposity indicator, is positive associated with the risk of T2DM in the Chinese population. This study aimed to investigate the correlation between CVAI and incident T2DM in a Japanese population.
Methods: We performed a secondary analysis of open-access data from a retrospective cohort study. This study included 15,464 participants who received regular medical examinations at Murakami Memorial Hospital. All participants underwent a questionnaire survey, physical examination, and blood biochemical testing at baseline. The main outcome was new-onset T2DM during follow-up. Cox regression analysis and Kaplan–Meier analysis were used to analyze the risk of CVAI on T2DM, and we conducted smooth curve fitting. Receiver operating characteristic (ROC) curve analysis was performed to assess the predictive value of CVAI, body mass index (BMI), and waist circumference (WC) for incident T2DM.
Results: During a median follow-up time of 5.39 years, 373 new-onset T2DM events were observed. Kaplan–Meier curves showed that the incidence of T2DM increased as the CVAI increased (log-rank χ2 = 187.1076 and 129.6067 in males and females, respectively, both P < 0.001). After adjustment for covariates, per 1 increase of CVAI was associated with a 1.0133-fold and 1.0246-fold higher risk of incident T2DM in males and females, respectively (both P < 0.001). Those individuals in the top CVAI quartile group had the highest risk of new-onset T2DM (HR = 3.1568 and 5.8415 in males and females, respectively, both P < 0.05). A nonlinear relationship was identified by the smooth fitting curve between CVAI and T2DM events in both genders. ROC analysis indicated that CVAI had better predictive power than BMI and WC in both genders.
Conclusion: Our results demonstrate that CVAI was significantly associated with an increased risk of new-onset T2DM in Japanese adults.
Keywords: diabetes mellitus, type 2 diabetes mellitus, Chinese visceral adiposity index, obesity, cohort study, Japanese adults
Introduction
Living standard improvements and lifestyle changes have made diabetes mellitus (DM), especially type 2 diabetes (T2DM), one of the most common diseases of public health concern worldwide.1 According to a national, population-based, cross-sectional survey conducted in 2013, the estimated prevalence of DM in Chinese adults was up to 10.9%.2 Similarly, the National Health and Nutrition Examination Survey (NHANES) data showed that T2DM prevalence in the USA increased from 8.8% in 1999/2000–to 11.7% in 2013/2014.3 Moreover, the latest data showed that approximately 1 in every 11 adults worldwide now suffers from DM.4 DM can result in serious complications, such as blindness, kidney failure, and cardiovascular diseases; it has a high disability and mortality rates.5 Therefore, it is crucial to find effective and simple tools to screen high-risk populations for DM and provide them with early intervention and management.
Obesity is a renowned risk factor for T2DM and also a routine-evaluation indicator to identify people at high risk of T2DM in current clinical practice.6,7 Numerous studies have correlated various obesity indices and T2DM. Body mass index (BMI), the simplest and most widely accepted measure of obesity, was associated with an increased T2DM risk in a meta-analysis of Mendelian randomization studies.8 Recent studies have shown a strong correlation between visceral fat obesity indices indexes, including waist circumference (WC), neck circumference (NC), waist-to-hip ratio (WHR), lipid accumulation product (LAP), visceral adiposity index (VAI), and body shape index (ABSI), and the risk of T2DM.9–14 Meanwhile, ectopic organs fat accumulation, such as ectopic fat storage in the pancreas and non-alcoholic fatty liver diseases, were implicated in T2DM onset.15,16
Chinese visceral adiposity index (CVAI) is a newly established index to evaluate visceral fat obesity. It is calculated based on age, BMI, WC, triglycerides (TG), and high-density lipoprotein (HDL).17 It is considered a good marker of cardiometabolic risk and incident hypertension.18,19 Studies have also shown that CVAI has a positive association with T2DM risk in Chinese adults,20–22 and is strongly associated with the prevalence of diabetic complications such as cerebrovascular disease and diabetic kidney disease.23 Secondary data analysis of publicly available data from a retrospective cohort study was performed; the relationship between CVAI and the incidence of T2DM in Japanese adults was investigated in this study to verify the effectiveness of CVAI in Asian populations further.
Materials and Methods
Data Source, Ethical Approval, and Informed Consent
The data analyzed in this study were downloaded from the “Dryad” website (www.datadryad.org).24 Professor Takuro Okamura and colleagues uploaded the data to “Dryad”. They waived the copyright and ownership of the original data, making it available for secondary analysis with a different hypothesis without violating the authors’ rights. They investigated the impact of three obesity phenotypes (obesity, visceral fat obesity, and ectopic fat obesity) on T2DM incidence.25 The study protocol was approved by Murakami Memorial Hospital ethics committee, and all participants provided written informed consent for data collection and usage.25
Study Design and Population
The NAfld in the Gifu Area, Longitudinal Analysis (NAGALA) cohort is a population-based longitudinal study. From May 1994 to December 2016, 20,944 participants who underwent medical examination programs at Murakami Memorial Hospital (Gifu, Japan) were recruited.25 Patients with important data missing, known liver disease, extreme heavy alcohol consumption, medication usage, and diagnosis of T2DM or fasting plasma glucose (FPG) ≥ 6.1 mmol/l at the baseline examination were excluded. Thus, 15,464 participants were included in the original analyses.25 In our present study, the above study subjects were used without further elimination.
Baseline Data Collection and Definitions
The assessment of baseline data collection has been previously described in detail.25 All participants were administered a questionnaire, had physical and blood biochemical examination. Demographic characteristics, including age, sex, and lifestyle, including smoking, drinking, and physical activity, were assessed. Participants were categorized into four groups according to the mean ethanol intake per week: no or minimal alcohol consumption (less than 40 g/week), light (40 to 140 g/week), moderate (140 to 280 g/week), or heavy alcohol consumption (more than 280 g/week).26 Smoking status was classified as never, former, or current smoker based on smoking experience history at baseline.25 Regular physical activity was defined as engaging in any sporting activity more than once weekly.27
Physical examination included the measurement of height, weight, WC, blood pressure, and abdominal ultrasonography. BMI was calculated as weight (kg) divided by height squared (m2). Fatty liver was diagnosed by experienced technicians using abdominal ultrasonography.
Fasting blood samples were collected from all participants. Alanine aminotransferase (ALT), aspartate aminotransferase (AST), gamma-glutamyl transferase (GGT), fasting blood glucose (FBG), glycosylated hemoglobin (HbA1c), total cholesterol (TC), TG, and HDL-c levels were determined by routine enzymatic laboratory methods.
CVAI values were calculated according to the parameters in the downloaded data using the following formula: CVAI = −267.93 + 0.68 * age + 0.03 * BMI + 4.00 * WC + 22.00 * log10TG - 16.32 * HDL (in males); CVAI = −187.32 + 1.71 * age + 4.23 * BMI + 1.12 * WC + 39.76 * log10TG - 11.66 * HDL (in females).17
Follow-Up and Outcome
All participants underwent regular medical examinations at Murakami Memorial Hospital, and 60% of participants were examined once or twice per year as previously described.25 Incident T2DM was defined as the occurrence of at least one of the following conditions during the follow-up period: HbA1c ≥ 6.5%, FBG ≥ 7 mmol/L, or self-reported diagnosis of T2DM.
Statistical Analysis
Data analysis was performed using R software (version 3.6.3) and EmpowerStats (version 2.2). Continuous data were presented as means ± standard deviation (SD) and were compared using the Student’s t-test. Categorical data were presented as percentages of the total in each category and were compared using the Pearson chi-square test. Participants were stratified by CVAI quartiles. Cox regression analysis and Kaplan-Meier analysis were used to analyze CVAI risk in patients with T2DM. The risk was presented as hazard ratio (HR) at 95% confidence interval (95% CI). The nonlinear relationship between CVAI and T2DM events was investigated using a smooth curve fitting. Receiver operating characteristic (ROC) curve analysis was used to determine the predictive value of CVAI, BMI, and WC for incident T2DM. All tests were two-sided, and P-value <0.05 was considered statistically significant.
Results
Baseline Characteristics of the Study Population
Our secondary analysis had 15,464 participants; 8430 (54.51%) males and 7034 (45.49%) females, with an overall mean age of 43.71±8.90 years. The clinical characteristics of the male and female participants are presented in Table 1. There were statistically significant differences in anthropometric indicators, lifestyles, blood pressure, and biochemical indices between males and females. Furthermore, the average CVAI in men was significantly higher than that in women (62.8 ± 38.0 vs 26.9 ± 34.3, P-value < 0.001), males had the two higher quartiles of CVAI while most of the females were in the two lower quartiles. Thus, in the subsequent analyses, male and female participants were divided into respective baseline CVAI quartiles.
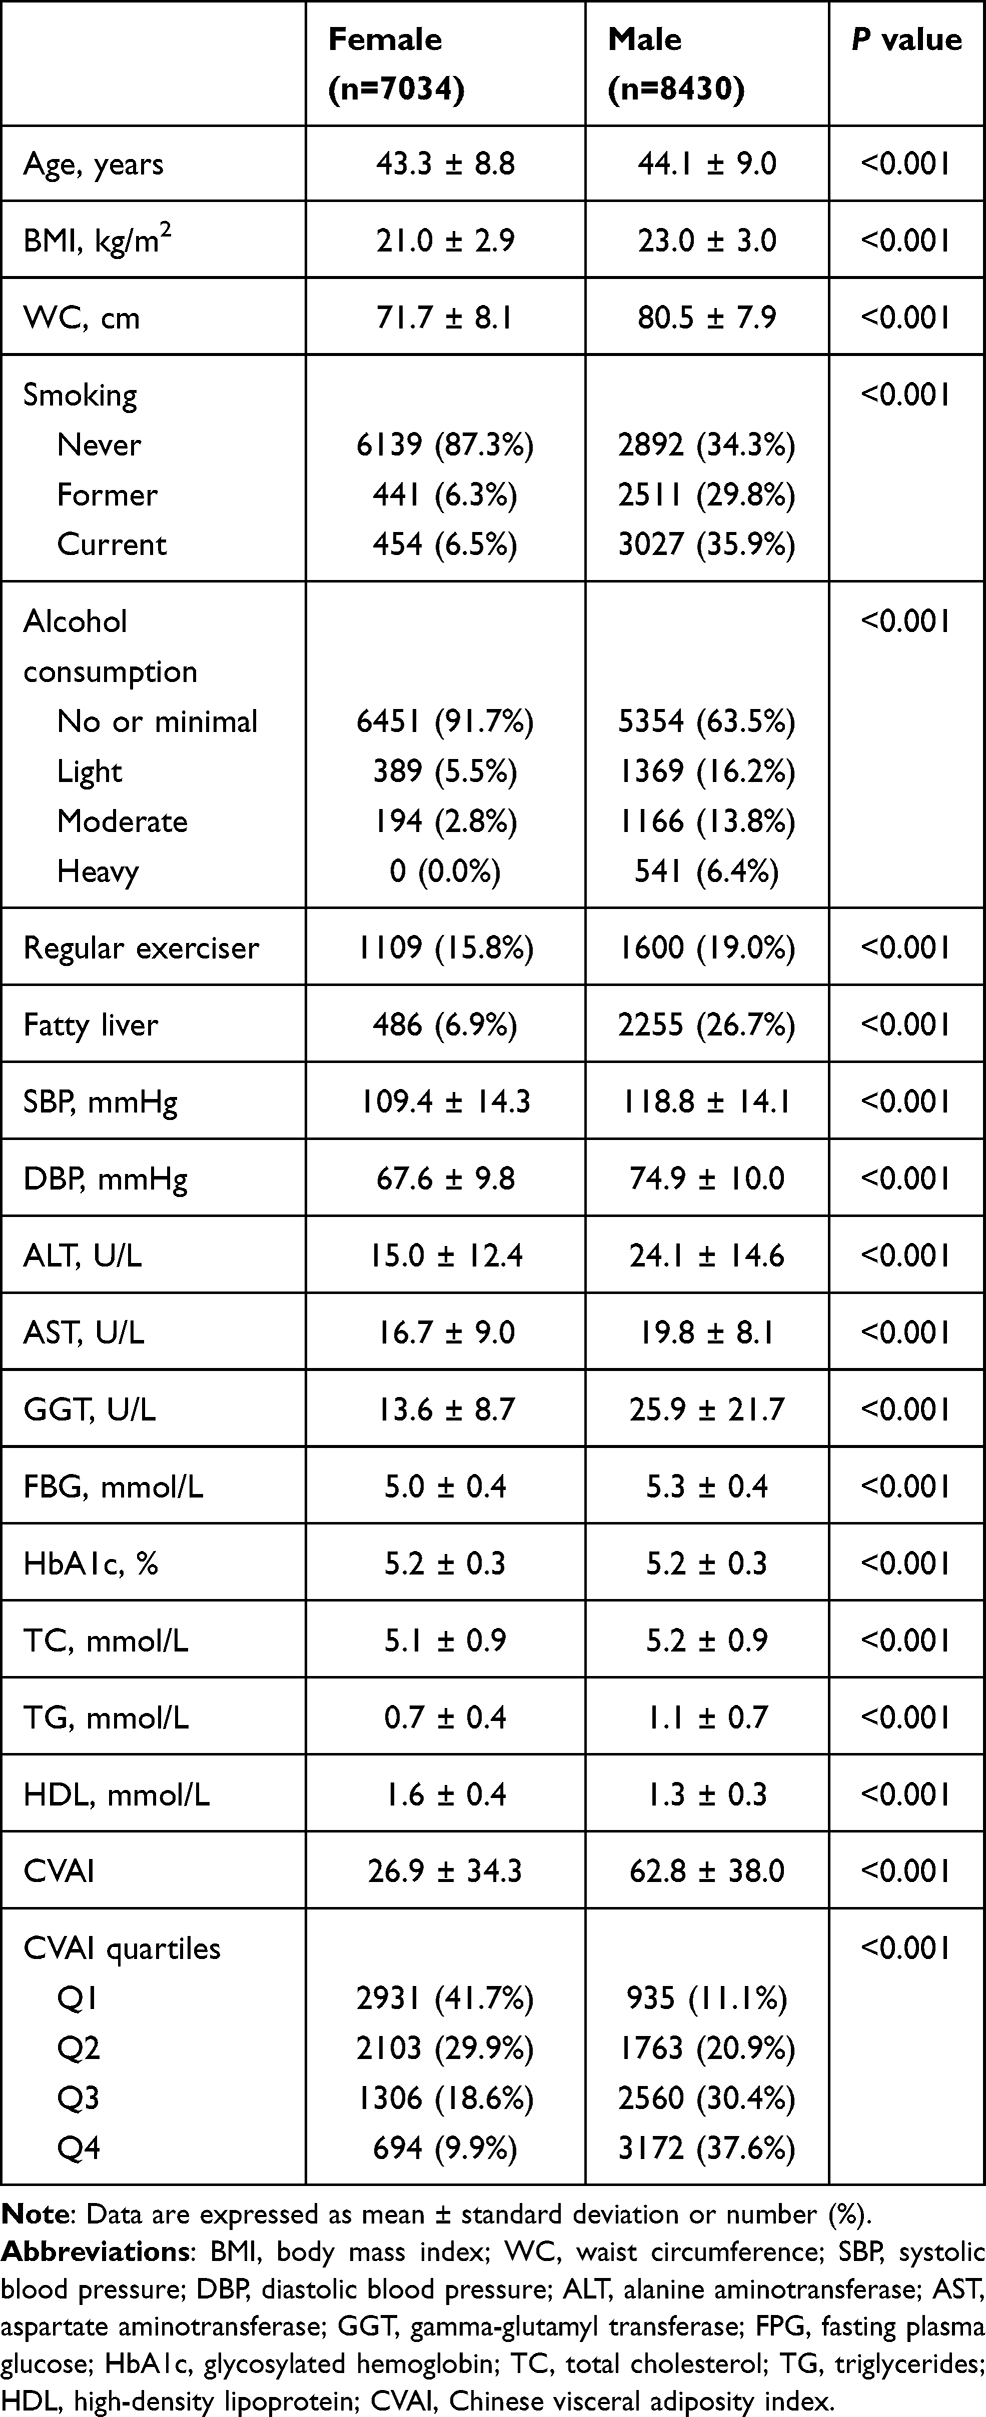 |
Table 1 Baseline Characteristics of Study Population |
Overall, participants in the 4th CVAI quartile group had higher levels of age, BMI, WC, SBP, DBP, ALT, AST, GGT, FBG, HbA1c, TC, and TG, and were more likely to have fatty liver, and had a lower level of HDL (Table 2, all P-values <0.001). With the increasing CVAI quartiles, smoking and heavy alcohol intake were more frequent in men, while no statistically significant difference was observed in women’s smoking habits between the CVAI quartile groups. Additionally, as the CVAI quartiles increased, the proportion of male participants with regular physical activity decreased; however, the opposite trend was found in females.
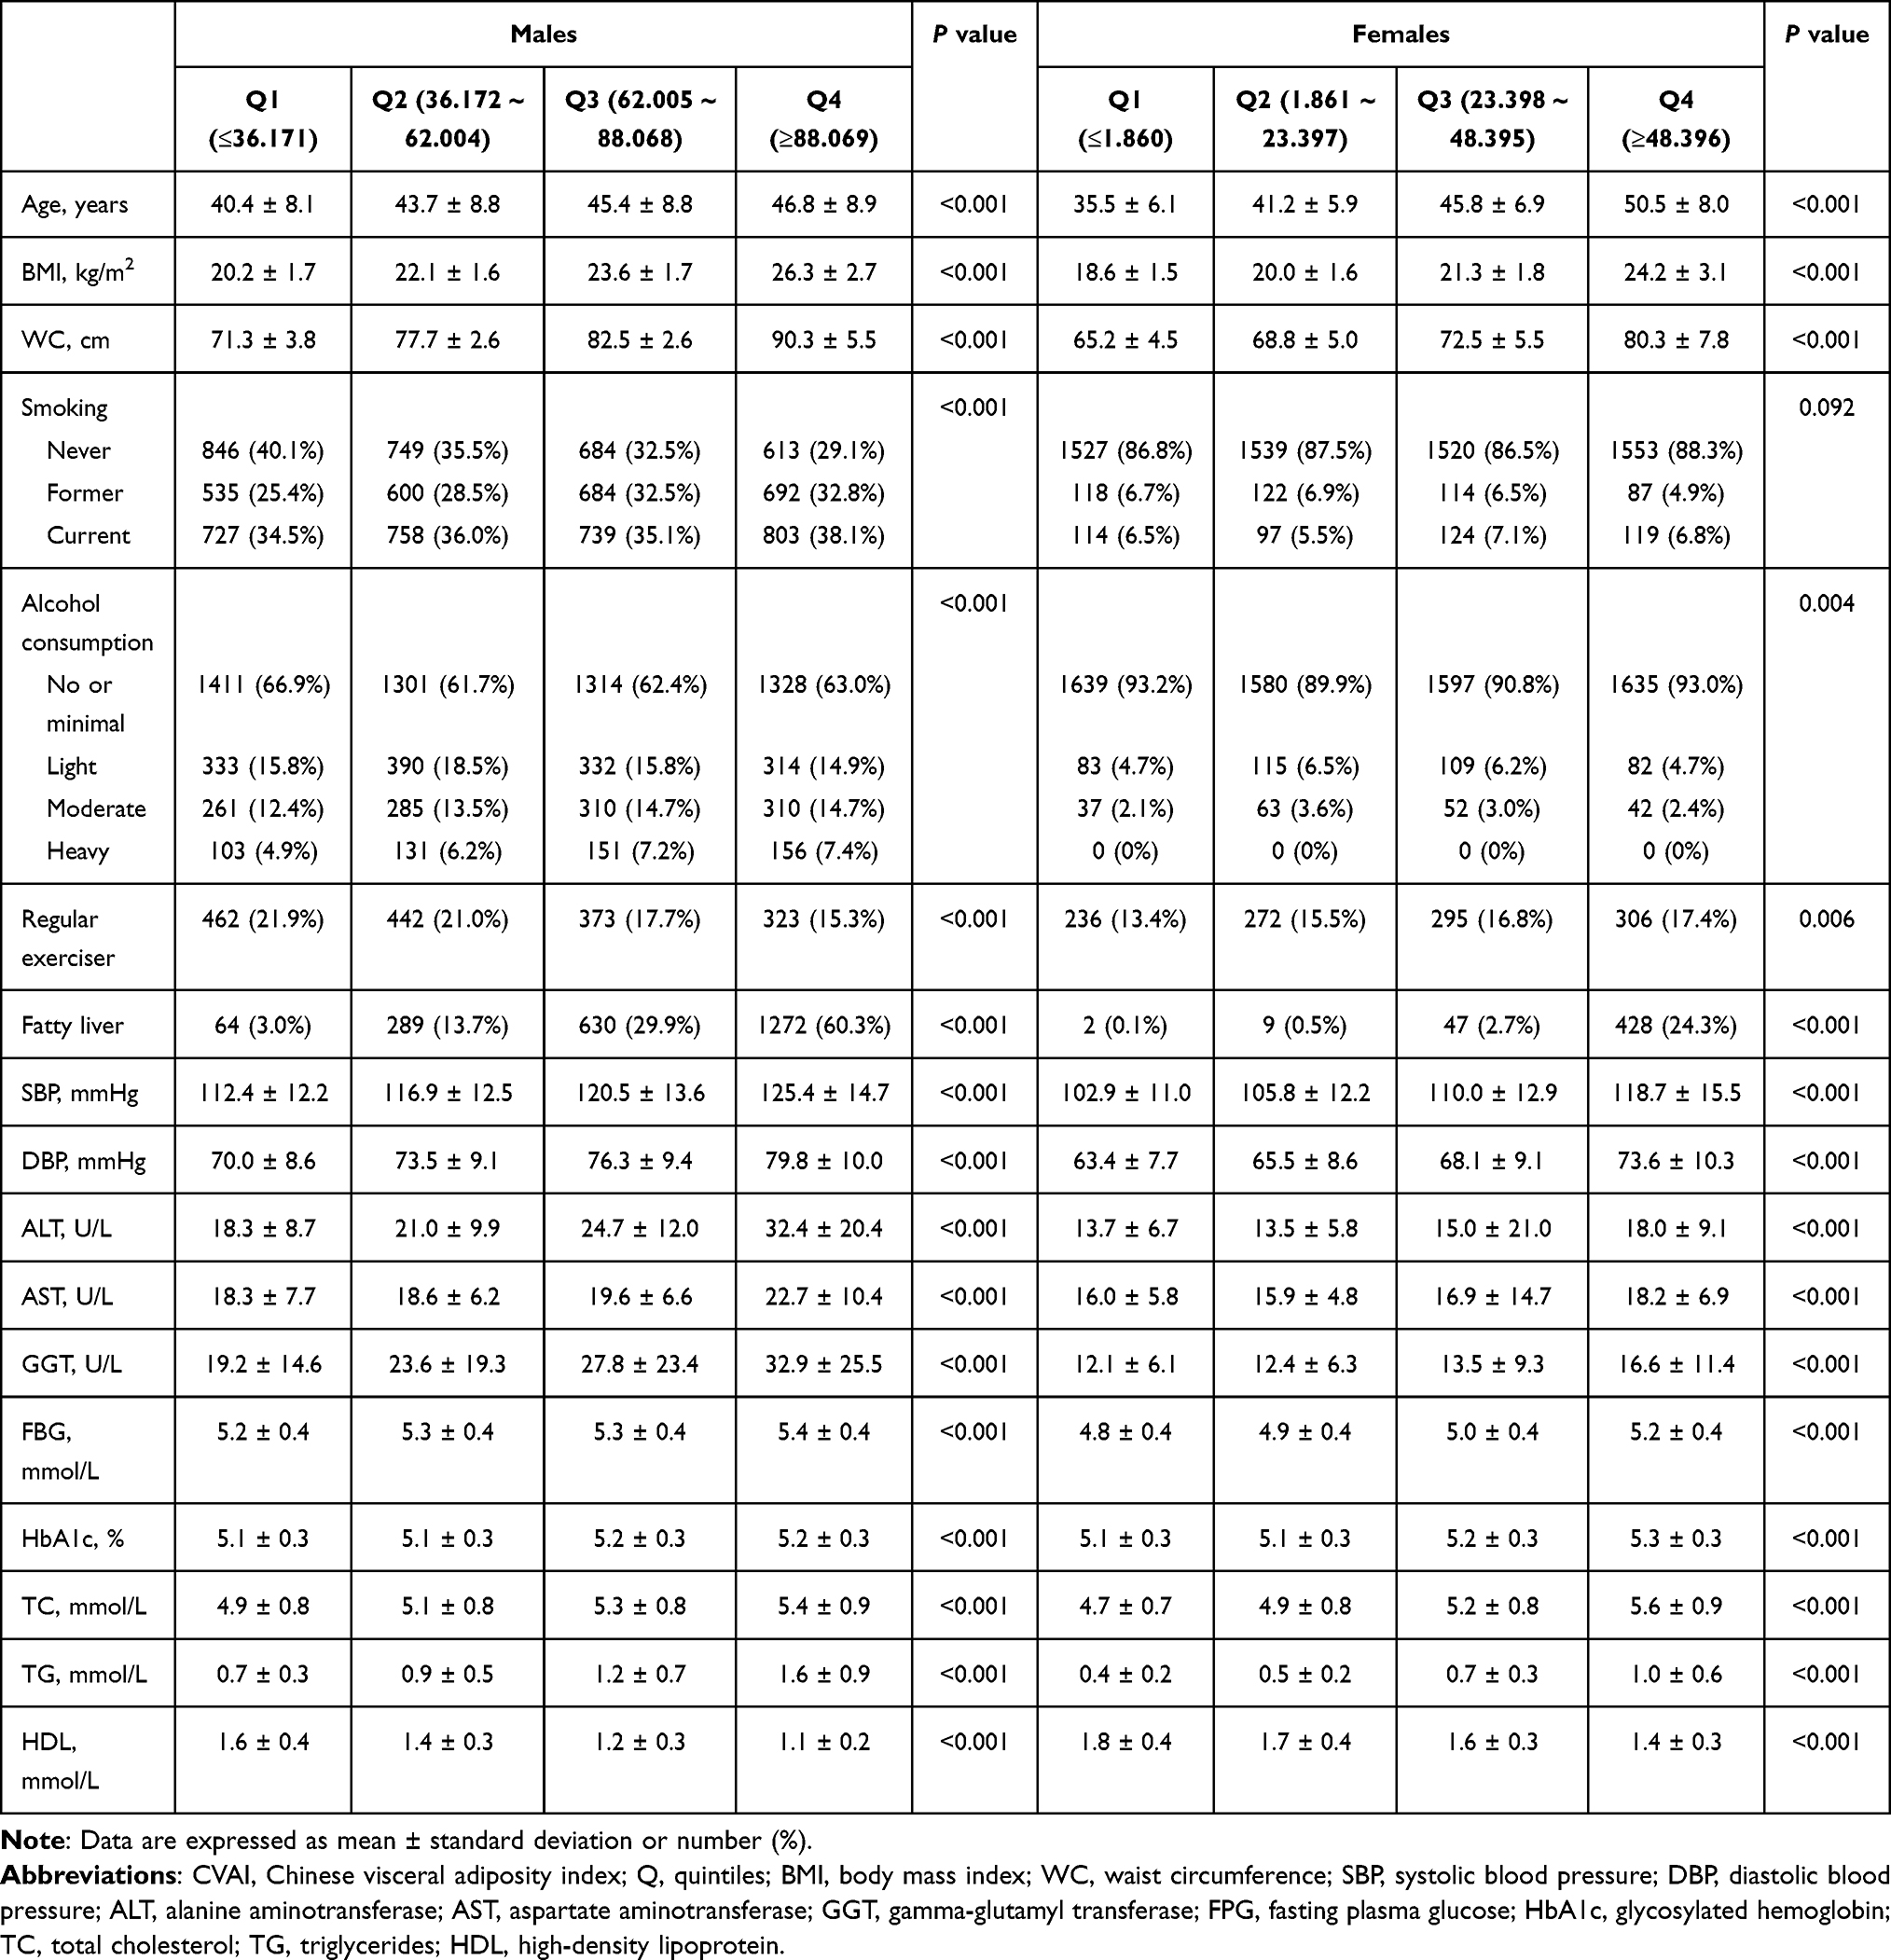 |
Table 2 Baseline Characteristics of Study Population According to Quartiles of CVAI and Gender |
Incidence and Risk of T2DM Stratified by CVAI
During a median follow-up time of 5.39 years, 373 new-onset T2DM events were observed (incidence rate 4.48 per 1000 person-years). As shown in Figure 1A and B, increased T2DM incidence risk was observed with increasing CVAI quartiles in both males and females (log-rank χ2 = 187.1076 and 129.6067, respectively, both P-values: <0.001).
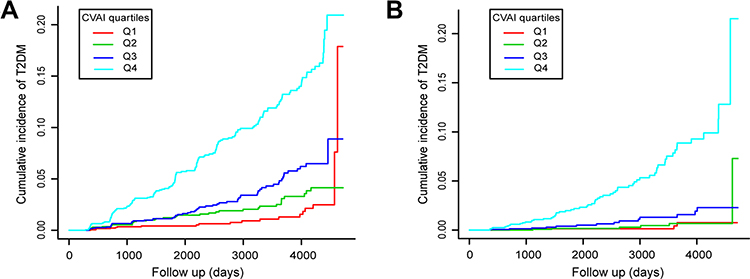 |
Figure 1 Kaplan-Meier plots of incidence rate of T2DM for CVAI quartiles groups during follow-up. (A) In male participants; (B) In female participants. |
Univariate and multivariate Cox regression models were used to evaluate the association between CVAI and new-onset T2DM in males and females (Tables 3 and 4). The higher CVAI levels were significantly associated with incident T2DM in both males and females. An increase of 1 in CVAI was associated with a 1.0133-fold and 1.0246-fold higher risk of incident T2DM in males and females, respectively, after adjusting for age, smoking, alcohol consumption, exercise, and fatty liver (both P- values: <0.001). Being at the top CVAI quartile group remained significantly associated with T2DM after multiple-test correction (HR = 3.1568 and 5.8415 in males and females, respectively, both P-values: <0.05).
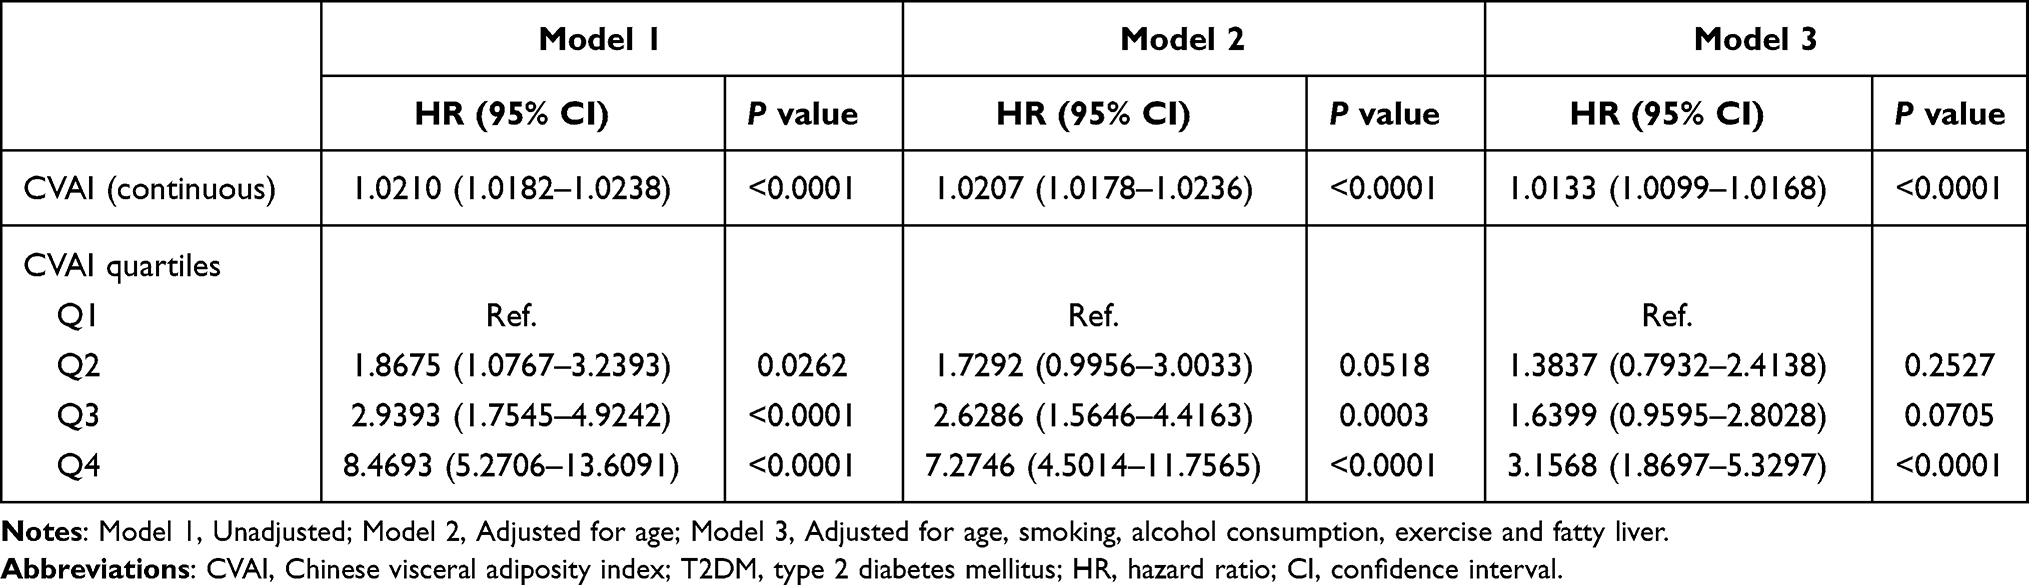 |
Table 3 Correlation Between CVAI and Incident T2DM in Males |
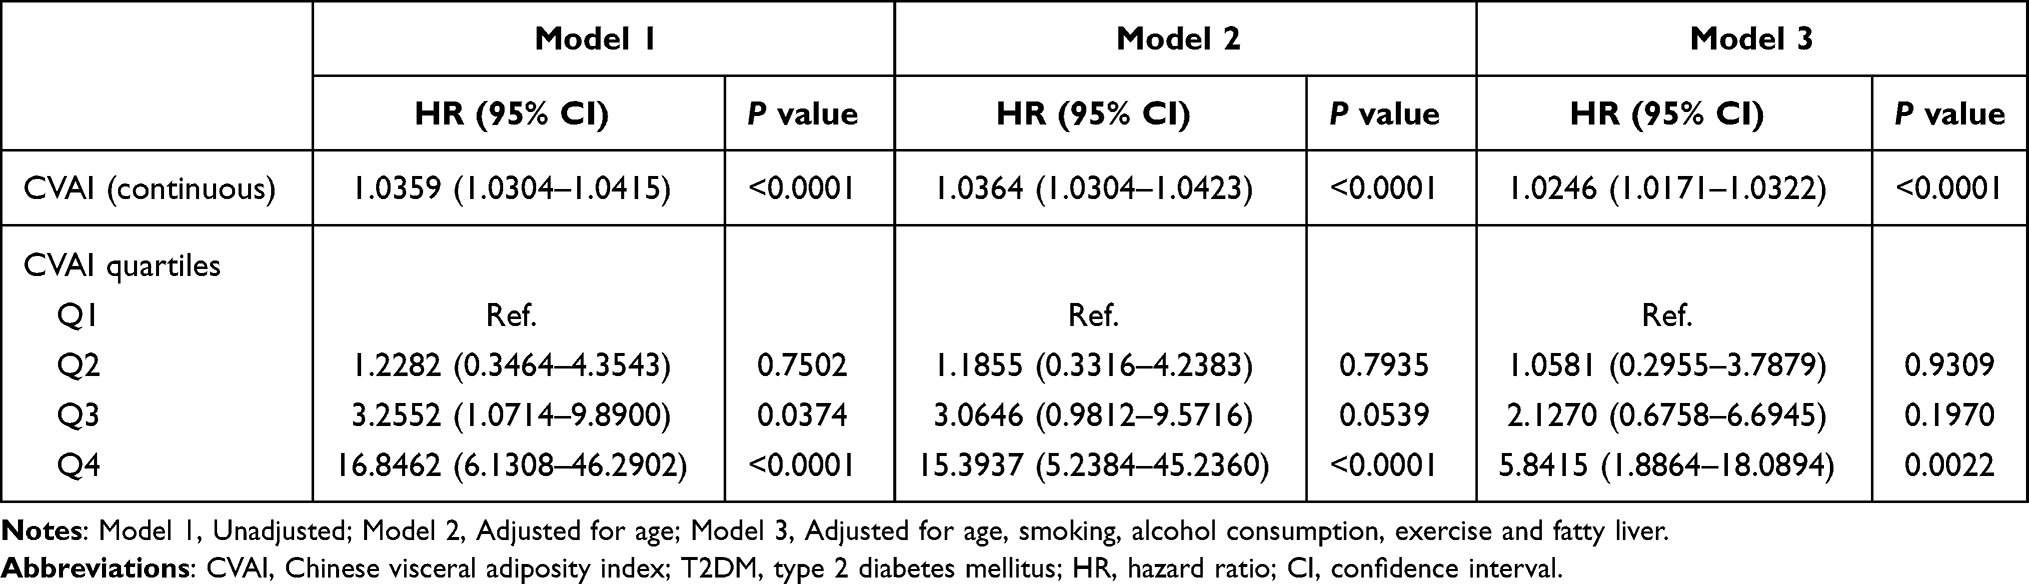 |
Table 4 Correlation Between CVAI and Incident T2DM in Females |
Nonlinear Relationship Exploration Between CVAI and T2DM
A smooth curve fitting analysis was conducted to investigate a nonlinear relationship between CVAI and T2DM risk, as presented in Figure 2. The smooth curve showed the association between CVAI and T2DM events as nonlinear in males and females after adjusting for age, smoking, alcohol consumption, exercise, and fatty liver (P values < 0.05). However, there were no saturation effects or threshold effects in both sexes (P values > 0.05).
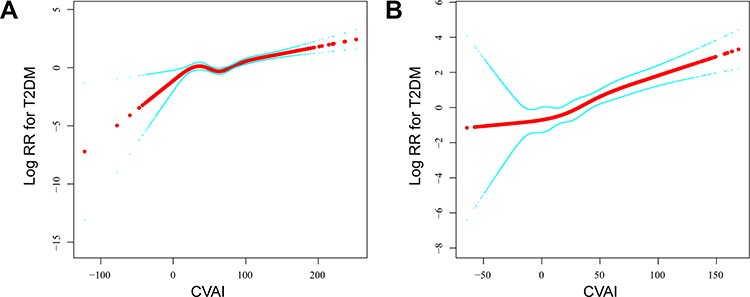 |
Figure 2 The association between CVAI and T2DM events. A nonlinear relationship was observed after adjusting for age, smoking, alcohol consumption, exercise, and fatty liver. (A) In male participants; (B) In female participants. |
Predicting Value of CVAI in Incident T2DM
According to the results of ROC analysis, as shown in Table 5 and Figure 3, the area under the curve (AUC) for CVAI in males and females was 0.7334 (95% CI: 0.7030–0.7638) and 0.8014 (95% CI: 0.7531–0.8497), respectively. CVAI exhibited the largest AUC compared with BMI and WC in both sexes (P-values <0.05).
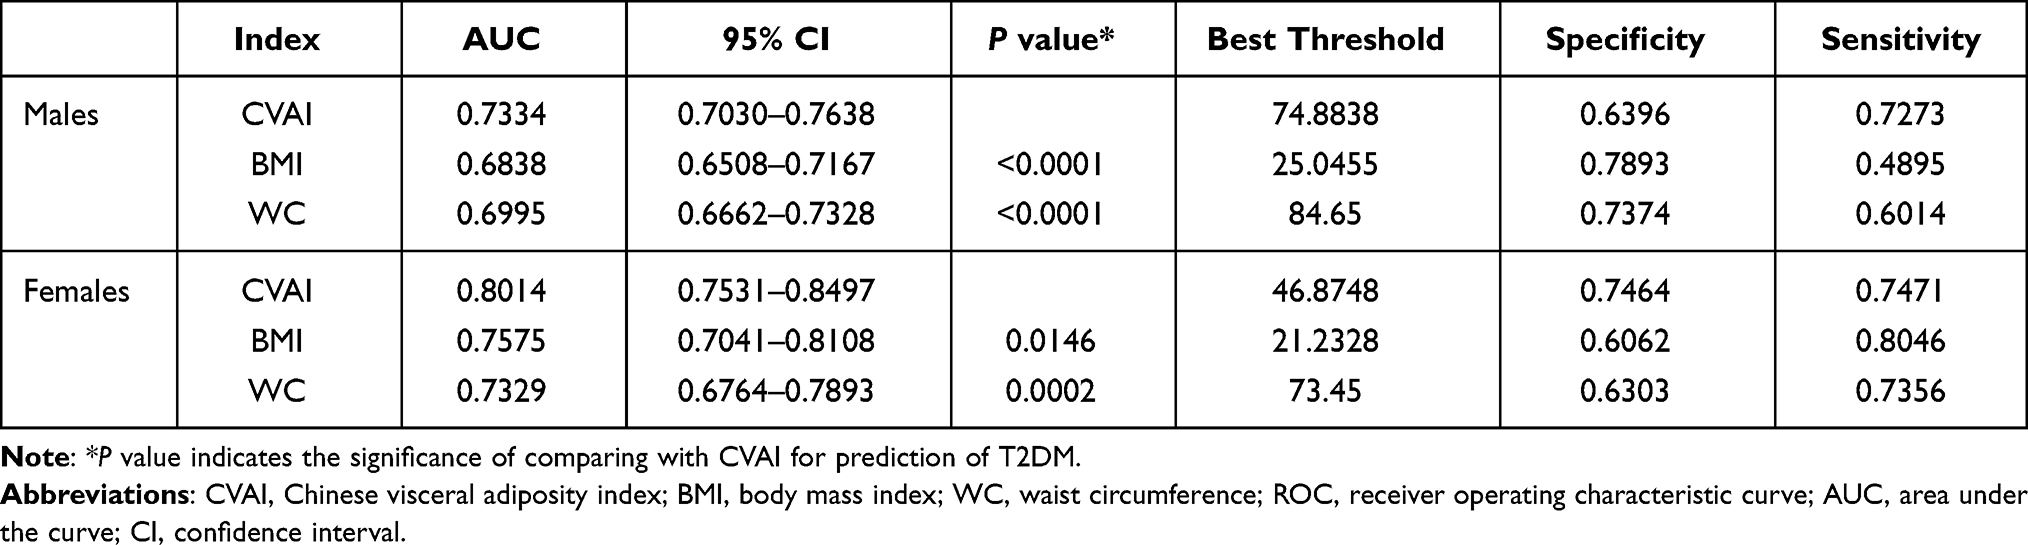 |
Table 5 Predictive Performance of CVAI, BMI, and WC for Incident T2DM |
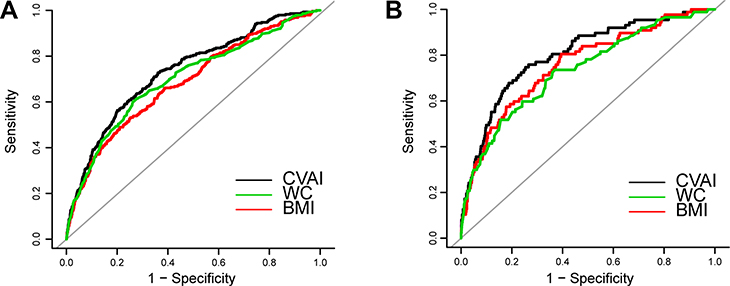 |
Figure 3 Receiver operating characteristic curves of CVAI, BMI, and WC to predict incident T2DM among study population. (A) In male participants; (B) In female participants. |
Discussion
The study revealed that an increase in CVAI was strongly associated with new T2DM onset in Japanese adults. Participants in the highest CVAI quartile had a significantly elevated risk of developing T2DM than those in the lowest quartile in both males and females. Moreover, CVAI might be a better predictor of T2DM than BMI and WC in the Japanese population.
T2DM has become a major public health problem worldwide. Early diagnosis and treatment may be beneficial, such as reducing complications risk and limiting the healthcare burden.28 Therefore, a simple, inexpensive, and practical indicator for evaluating incident T2DM risk is critically needed. Obesity is the most significant key risk factor for T2DM.29 In addition, recent studies have developed and validated new adiposity phenotypes to identify individuals with elevated risk for metabolic diseases, such as DM and cardiovascular diseases. Similar to previous studies,20,21 this study showed that CVAI was significantly associated with T2DM risk and predicted T2DM more than BMI and WC. This might be because CVAI is a comprehensive index that includes age, BMI, WC, and blood lipids; hence, it is better than a single index.
Many previous studies showed that aging, obesity, and dyslipidemia increase T2DM risk.30–32 Recently, a study investigated the effectiveness of cardiometabolic indices to estimate atherosclerotic cardiovascular disease risk in Taiwanese adults. The study found that CVAI was more effective than various cardiometabolic indices, including BMI, WC, VAI, LAP, ABSI, triglyceride-glucose (TyG) index, TyG-BMI, and TyG-WC.33 Thus, CVAI is a better predictor of the state of visceral fat than conventional obesity indicators. Therefore, this study suggests that CVAI is a valuable predictive biomarker for new-onset T2DM.
The study results corroborated previous studies and strengthen the relationship between visceral adiposity index and incident T2DM in a population of Japanese adults. However, the calculated CVAI in Japanese females was much lower than in Chinese populations.19,23 We guessed this would be relative to physical status and circulating lipid levels differences between Chinese and Japanese adults,34 which might have led to the unsuitable CVAI components coefficient in Japanese adults. Furthermore, CVAI did not show a linear association with incident T2DM in male and female Japanese adults. Therefore, CVAI cannot be considered an ideal T2DM predictor in Japanese adults. More comprehensive studies are still required to identify the appropriate parameters of visceral obesity in the Japanese population.
This study’s several limitations should be recognized. First, these secondary analyses are limited by the disclosed data; thus, unpublished or unmeasured confounding variables in the original study could not be fully adjusted. Second, the oral glucose tolerance test was not used in follow-up visits, and this might have underestimated the T2DM incidence rate. Third, the study was unable to evaluate the impact of CVAI changes on incident T2DM, since the calculation of CVAI was not continuous. Further studies are required to support our conclusions.
Conclusion
In summary, CVAI was significantly associated with new-onset T2DM in Japanese adults. However, further studies are still required to identify the appropriate parameters of visceral obesity for predicting T2DM in the Japanese population.
Data Sharing Statement
A publicly available dataset was used in this present study. Data can be accessed at: https://datadryad.org/stash/dataset/doi:10.5061/dryad.8q0p192.
Acknowledgments
We sincerely thank Professor Takuro Okamura and colleagues for providing the original data of their study.
Funding
This study was supported by National Natural Science Foundation of China (No. 81873488).
Disclosure
All authors report no conflicts of interest related to this manuscript.
References
1. Zheng Y, Ley SH, Hu FB. Global aetiology and epidemiology of type 2 diabetes mellitus and its complications. Nat Rev Endocrinol. 2018;14(2):88–98. doi:10.1038/nrendo.2017.151
2. Wang L, Gao P, Zhang M, et al. Prevalence and ethnic pattern of diabetes and prediabetes in China in 2013. JAMA. 2017;317(24):2515–2523. doi:10.1001/jama.2017.7596
3. Caspard H, Jabbour S, Hammar N, Fenici P, Sheehan JJ, Kosiborod M. Recent trends in the prevalence of type 2 diabetes and the association with abdominal obesity lead to growing health disparities in the USA: an analysis of the NHANES surveys from 1999 to 2014. Diabetes Obes Metab. 2018;20(3):667–671. doi:10.1111/dom.13143
4. Weisman A, Fazli GS, Johns A, Booth GL. Evolving trends in the epidemiology, risk factors, and prevention of type 2 diabetes: a review. Can J Cardiol. 2018;34(5):552–564. doi:10.1016/j.cjca.2018.03.002
5. Cole JB, Florez JC. Genetics of diabetes mellitus and diabetes complications. Nat Rev Nephrol. 2020;16(7):377–390. doi:10.1038/s41581-020-0278-5
6. Riobó Serván P. Obesity and diabetes. Nutr Hosp. 2013;28(Suppl 5):138–143.
7. Chobot A, Górowska-Kowolik K, Sokołowska M, Jarosz-Chobot P. Obesity and diabetes-not only a simple link between two epidemics. Diabetes Metab Res Rev. 2018;34(7):e3042. doi:10.1002/dmrr.3042
8. Riaz H, Khan MS, Siddiqi TJ, et al. Association between obesity and cardiovascular outcomes: a systematic review and meta-analysis of mendelian randomization studies. JAMA Netw Open. 2018;1(7):e183788. doi:10.1001/jamanetworkopen.2018.3788
9. Wei J, Liu X, Xue H, Wang Y, Shi Z. Comparisons of visceral adiposity index, body shape index, body mass index and waist circumference and their associations with diabetes mellitus in adults. Nutrients. 2019;11(7):1580. doi:10.3390/nu11071580
10. Ashwell M, Gunn P, Gibson S. Waist-to-height ratio is a better screening tool than waist circumference and BMI for adult cardiometabolic risk factors: systematic review and meta-analysis. Obes Rev. 2012;13(3):275–286. doi:10.1111/j.1467-789X.2011.00952.x
11. Zhao W, Tong JJ, Cao YT, Li JH. A linear relationship between a body shape index and risk of incident type 2 diabetes: a secondary analysis based on a retrospective cohort study in Japan. Diabetes Metab Syndr Obes. 2020;13:2139–2146. doi:10.2147/DMSO.S256031
12. Xu M, Huang M, Qiang D, et al. Hypertriglyceridemic waist phenotype and lipid accumulation product: two comprehensive obese indicators of waist circumference and triglyceride to predict type 2 diabetes mellitus in Chinese population. J Diabetes Res. 2020;2020:9157430. doi:10.1155/2020/9157430
13. Ayundini G, Astrella C, Tahapary D, Soewondo P, Systematic A. Review on the association between lipid accumulation product index and type 2 diabetes mellitus. J ASEAN Fed Endocr Soc. 2019;34(1):16–20.
14. Fan Y, Wang R, Ding L, et al. Waist circumference and its changes are more strongly associated with the risk of type 2 diabetes than body mass index and changes in body weight in Chinese adults. J Nutr. 2020;150(5):1259–1265. doi:10.1093/jn/nxaa014
15. Kim MK, Chun HJ, Park JH, et al. The association between ectopic fat in the pancreas and subclinical atherosclerosis in type 2 diabetes. Diabetes Res Clin Pract. 2014;106(3):590–596. doi:10.1016/j.diabres.2014.09.005
16. Lallukka S, Yki-Järvinen H. Non-alcoholic fatty liver disease and risk of type 2 diabetes. Best Pract Res Clin Endocrinol Metab. 2016;30(3):385–395. doi:10.1016/j.beem.2016.06.006
17. Xia MF, Chen Y, Lin HD, et al. A indicator of visceral adipose dysfunction to evaluate metabolic health in adult Chinese. Sci Rep. 2016;6:38214. doi:10.1038/srep38214
18. Xie X, Li Q, Zhang L, Ren W. Lipid accumulation product, visceral adiposity index, and Chinese visceral adiposity index as markers of cardiometabolic risk in adult growth hormone deficiency patients: a cross-sectional study. Endocr Pract. 2018;24(1):33–39. doi:10.4158/EP-2017-0007
19. Han M, Qie R, Li Q, et al. Chinese visceral adiposity index, a novel indicator of visceral obesity for assessing the risk of incident hypertension in a prospective cohort study. Br J Nutr. 2021;126(4):612–620. doi:10.1017/S0007114520004298
20. Han M, Qin P, Li Q, et al. Chinese visceral adiposity index: a reliable indicator of visceral fat function associated with risk of type 2 diabetes. Diabetes Metab Res Rev. 2021;37(2):e3370. doi:10.1002/dmrr.3370
21. Xia MF, Lin HD, Chen LY, et al. Association of visceral adiposity and its longitudinal increase with the risk of diabetes in Chinese adults: a prospective cohort study. Diabetes Metab Res Rev. 2018;34(7):e3048. doi:10.1002/dmrr.3048
22. Wu J, Gong L, Li Q, et al. A novel visceral adiposity index for prediction of type 2 diabetes and pre-diabetes in Chinese adults: a 5-year prospective study. Sci Rep. 2017;7(1):13784. doi:10.1038/s41598-017-14251-w
23. Wan H, Wang Y, Xiang Q, et al. Associations between abdominal obesity indices and diabetic complications: Chinese visceral adiposity index and neck circumference. Cardiovasc Diabetol. 2020;19(1):118. doi:10.1186/s12933-020-01095-4
24. Okamura T, Hashimoto Y, Hamaguchi M, Ohobra A, Kojima T, Fukui M. Data from: Ectopic fat obesity presents the greatest risk for incident type 2 diabetes: a population-based longitudinal study; 2019. Available from: https://datadryad.org/stash/dataset/doi:10.5061/dryad.8q0p192.
25. Okamura T, Hashimoto Y, Hamaguchi M, Obora A, Kojima T, Fukui M. Ectopic fat obesity presents the greatest risk for incident type 2 diabetes: a population-based longitudinal study. Int J Obes. 2019;43(1):139–148. doi:10.1038/s41366-018-0076-3
26. Hashimoto Y, Hamaguchi M, Kojima T, et al. The modest alcohol consumption reduces the incidence of fatty liver in men: a population-based large-scale cohort study. J Gastroenterol Hepatol. 2015;30(3):546–552. doi:10.1111/jgh.12786
27. Ryu S, Chang Y, Kim DI, Kim WS, Suh BS. Gamma-Glutamyltransferase as a predictor of chronic kidney disease in nonhypertensive and nondiabetic Korean men. Clin Chem. 2007;53(1):71–77. doi:10.1373/clinchem.2006.078980
28. Herman WH, Ye W, Griffin SJ, et al. Early detection and treatment of type 2 diabetes reduce cardiovascular morbidity and mortality: a simulation of the results of the Anglo-Danish-Dutch study of intensive treatment in people with screen-detected diabetes in primary care (ADDITION-Europe). Diabetes Care. 2015;38(8):1449–1455. doi:10.2337/dc14-2459
29. Toplak H, Hoppichler F, Wascher TC, Schindler K, Ludvik B. [Obesity and type 2 diabetes]. Wien Klin Wochenschr. 2016;128(Suppl 2):S196–S200. German. doi:10.1007/s00508-016-0986-9
30. Niswender K. Diabetes and obesity: therapeutic targeting and risk reduction - a complex interplay. Diabetes Obes Metab. 2010;12(4):267–287. doi:10.1111/j.1463-1326.2009.01175.x
31. Athyros VG, Doumas M, Imprialos KP, et al. Diabetes and lipid metabolism. Hormones. 2018;17(1):61–67. doi:10.1007/s42000-018-0014-8
32. Halim M, Halim A. The effects of inflammation, aging and oxidative stress on the pathogenesis of diabetes mellitus (type 2 diabetes). Diabetes Metab Syndr. 2019;13(2):1165–1172. doi:10.1016/j.dsx.2019.01.040
33. Huang YC, Huang JC, Lin CI, et al. Comparison of innovative and traditional cardiometabolic indices in estimating atherosclerotic cardiovascular disease risk in adults. Diagnostics. 2021;11(4):603.
34. Noh JW, Kim J, Yang Y, Park J, Cheon J, Kwon YD. Body mass index and self-rated health in East Asian countries: comparison among South Korea, China, Japan, and Taiwan. PLoS One. 2017;12(8):e0183881. doi:10.1371/journal.pone.0183881
 © 2021 The Author(s). This work is published and licensed by Dove Medical Press Limited. The full terms of this license are available at https://www.dovepress.com/terms.php and incorporate the Creative Commons Attribution - Non Commercial (unported, v3.0) License.
By accessing the work you hereby accept the Terms. Non-commercial uses of the work are permitted without any further permission from Dove Medical Press Limited, provided the work is properly attributed. For permission for commercial use of this work, please see paragraphs 4.2 and 5 of our Terms.
© 2021 The Author(s). This work is published and licensed by Dove Medical Press Limited. The full terms of this license are available at https://www.dovepress.com/terms.php and incorporate the Creative Commons Attribution - Non Commercial (unported, v3.0) License.
By accessing the work you hereby accept the Terms. Non-commercial uses of the work are permitted without any further permission from Dove Medical Press Limited, provided the work is properly attributed. For permission for commercial use of this work, please see paragraphs 4.2 and 5 of our Terms.