")
Back to Journals » International Journal of Chronic Obstructive Pulmonary Disease » Volume 16
Assessment of Ventilatory Heterogeneity in Chronic Obstructive Pulmonary Disease Using the Inspired Sinewave Test
Authors Bruce RM , Phan PA, Rigolli M, Tran MC , Pacpaco E, Rahman NM , Farmery AD
Received 28 May 2020
Accepted for publication 22 September 2020
Published 23 February 2021 Volume 2021:16 Pages 401—413
DOI https://doi.org/10.2147/COPD.S264360
Checked for plagiarism Yes
Review by Single anonymous peer review
Peer reviewer comments 2
Editor who approved publication: Dr Richard Russell
Richard M Bruce,1,2 Phi Anh Phan,2 Marzia Rigolli,3 Minh C Tran,2 Edmund Pacpaco,4 Najib M Rahman,4 Andrew D Farmery2
1Centre for Human and Applied Physiological Sciences, School of Basic and Medical Biosciences, King’s College London, London, UK; 2Nuffield Department of Clinical Neurosciences, University of Oxford, Oxford, UK; 3University of Oxford Centre for Clinical Magnetic Resonance Research, University of Oxford, Oxford, UK; 4Oxford University Hospitals NHS Foundation Trust, Oxford Centre for Respiratory Medicine, Oxford, UK
Correspondence: Richard M Bruce
King’s College London, Shepherd’s House, Guy’s Campus, London, SE1 1UL, UK
Tel +44 20 7848 6324
Email [email protected]
Background: There is marked variability in the symptoms and outcomes of patients with chronic obstructive pulmonary disease (COPD) which are poorly predicted by spirometry/FEV1%pred. Furthermore, as spirometry requires the performance of potentially distressing respiratory manoeuvres which are to some extent user-effort dependent, there is need for non-invasive and simple-to-perform techniques to identify subtypes of COPD which are more closely related to clinically relevant outcomes.
Materials and Methods: The inspired sinewave test (IST) sinusoidally modulates the inspired concentration of a tracer gas (N2O) over successive tidal breaths. A single-compartment tidal-ventilation lung model processes the amplitude/phase of the expired N2O sinewave and estimates cardiopulmonary variables including: effective lung volume and indices of ventilatory heterogeneity (VH; ELV180/FRCpleth and ELV180/ELVpred). 83 COPD patients and 53 healthy controls performed the IST test, standard pulmonary function tests (Spirometry, body plethysmography and the single breath test of carbon monoxide uptake), and symptom severity questionnaires (COPD assessment test, CAT; mMRC dyspnoea-scale, mMRC-DS; Cough+Mucus score; C+M score).
Results: ELV180/FRCpleth and ELV180/ELVpred were significantly lower in patients with COPD vs healthy participants (0.34± 0.11 vs 0.68± 0.14 and 0.7± 0.27 vs 0.98± 0.15, respectively; P< 0.05). Multivariable regression analysis demonstrated that ELV180/FRCpleth was a stronger and independent predictor of CAT, mMRC-DS and C+M score vs FEV1%pred. ELV180/ELVpred was a stronger and independent and better predictor of C+M score vs FEV1%pred. Phenotyping patients, based upon ELV180/ELVpred and FRC%pred, uncovered significant symptomatic differences between groups.
Conclusion: The IST indices of VH were superior and independent predictors of symptom severity vs FEV1%pred and has potential as a non-invasive and simple-to-perform method to stratify patients into subgroups related to clinically relevant features of COPD.
Keywords: COPD, lung function test, nitrous oxide, medical device, ventilatory heterogeneity
Plain Language Summary
There is great need for novel techniques to identify subtypes of chronic obstructive pulmonary disease (COPD) which are closely related with patient outcomes. The inspired sinewave test (IST) can non-invasively measure lung volume, pulmonary blood flow, and estimate how evenly gas is distributed around the lung (ventilatory heterogeneity, VH). We examined whether measures of VH using the IST are associated with specific clinical features of COPD. 83 COPD patients and 53 healthy controls performed the IST test, as well as standard lung function tests and symptom severity questionnaires. The IST test had a very high sensitivity for detecting COPD, and its measurements of VH were a superior and independent predictor of symptom severity vs current standard tests (spirometry). It was also able to stratify patients into phenotypes related to clinically relevant features. The IST has potential as a non-invasive and simple-to-perform method to stratify patients into subgroups related to clinically important outcomes for COPD.
Introduction
In the UK, chronic obstructive pulmonary disease (COPD) accounts for over 1 million bed days and approximately 30,000 deaths each year, and it is the second highest cause of emergency admission.1,2 However, the manifestation of COPD is very variable, where some patients have a faster decline in lung function and are at greater risk of symptom exacerbation than others.3 The definition, diagnosis and management of COPD is fundamentally based upon airflow limitation, as assessed via spirometry/FEV1. However, FEV1 has only a weak relationship with symptom severity, the risk of exacerbation, and patient outcomes.4 Furthermore, as spirometry requires precise and potentially distressing respiratory manoeuvres, whose reproducibility can be poor in elderly and paediatric populations,5–7 there is clear need for simple-to-perform and non-invasive techniques to diagnose and identify subtypes of COPD which are more closely related to clinically relevant outcomes.8
The principal sites of pathophysiology in COPD are the small airways and lung parenchyma.9–11 As the small airways form a vast array of parallel resistors each contributes only a small fraction to total airways resistance, so a significant degree of small airways disease can occur with little effect on FEV1.12 However, the obstruction of small airways and the enlargement of airspaces in emphysema has a greater impact on the distribution of ventilation than it does on total airways resistance, and thus techniques which can measure ventilatory heterogeneity (VH) may be sensitive to the early structural changes which occur in obstructive lung disease.12,13
The inspired sinewave technique (IST) is a non-invasive method to monitor cardio-pulmonary function which only requires passive patient cooperation.14–17 The technique can measure effective lung volume (ELV), dead space (VD), pulmonary blood flow ( ), and indices of VH can be calculated. The aim of the current investigation was to: 1) compare the IST indices of VH with measures obtained from standard pulmonary function tests (PFTs) in patients with COPD and healthy never-smoker participants, and 2) examine whether IST measures are associated with specific clinical features of COPD independent of FEV1.
Materials and Methods
Participants and Ethical Approval
In the study, 83 patients with COPD volunteered for participation (Table 1). Following clinical screening, patients were included if they met the following criteria: >40 years of age, no symptom exacerbation in the previous 8 weeks, >10 pack year smoking history and FEV1/FVC <0.7. Patients with a history of asthma or pulmonary disease other than COPD were excluded. 53 never-smoker healthy participants also volunteered for the study (Table 1). All were defined as healthy by the following criteria: no history of respiratory disease or respiratory symptoms suggestive of disease, and no upper respiratory tract infections in the previous 8 weeks. All participants received written and verbal information regarding the study before providing their written informed consent. The study’s protocol was approved by an NHS ethical committee (16/SC/0057; South Central - Hampshire B Research Ethics Committee) and conforms to the Declaration of Helsinki, 2013.
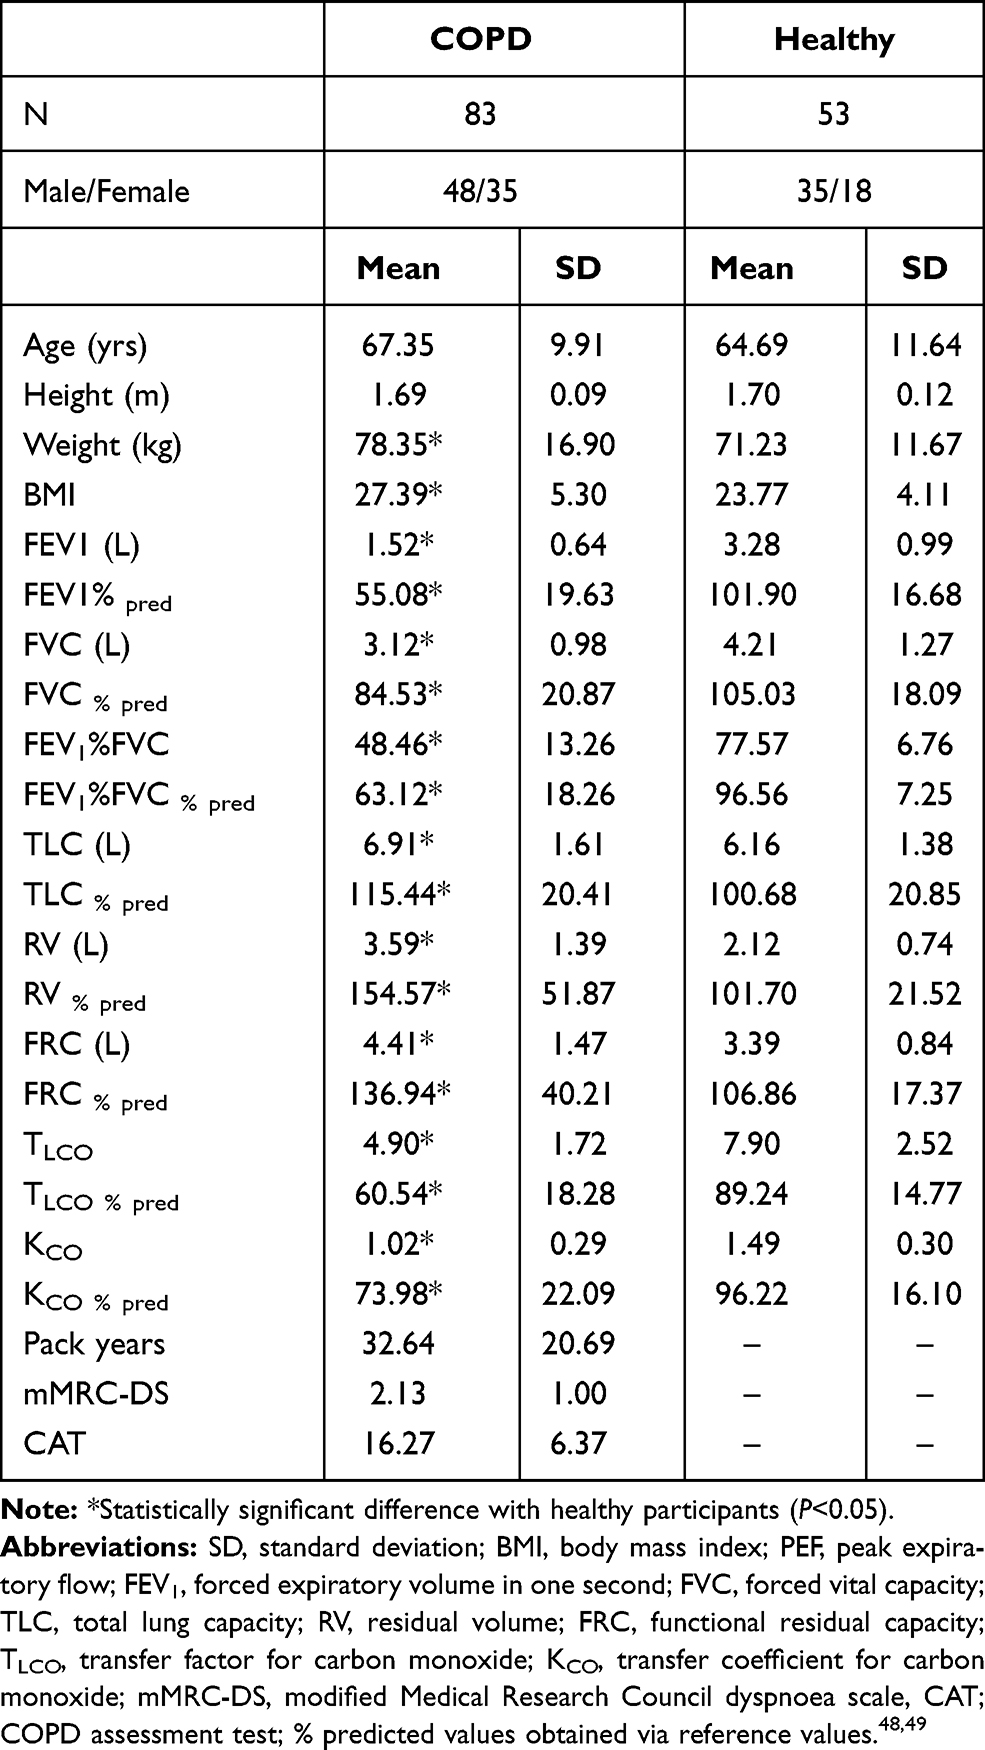 |
Table 1 Participant Characteristics and Pulmonary Function Test Measurements |
Protocol
All procedures were completed within the Respiratory Medicine Department, Oxford University Hospitals NHS Foundation Trust. The study visit day included: a medical history assessment, completion of the COPD assessment test (CAT;18 and modified Medical Research Council dyspnoea scale,19 standard pulmonary function tests (PFTs; spirometry, body plethysmography and the single breath test of carbon monoxide uptake; Jaeger MasterScope Body, Carefusion), and the IST. Using the first two questions of the CAT questionnaire an additional symptom score was produced, aiming to specify cough frequency and phlegm/mucus production (Cough + Mucus (C+M) score). In 21 COPD patients and 13 healthy participants (ie, 25% of each group), chest CT scans were obtained within 3 months of the study visit day. Unenhanced low dose CT scans were performed with a 64-slice scanner (Revolution GSI, GE Healthcare) and the following parameters: 0.625mm slice thickness, 60 mA, 100 kV, 40mm tube collimation, 0.984 beam peach, 0.5sec rotational time. Scans were analysed with Pulmonary Toolkit20 to quantify the whole-lung emphysema extent. This was reported as percentage low attenuation area (%LAA), the percentage area of the whole-lung with attenuation values inferior to −950 Hounsfield units.
IST Test
Details of the IST and device have been detailed elsewhere,16 but in brief: participants breathe quietly through a face mask, which is sealed around the mouth with no leaks. At the start of each inhalation a small quantity of N2O is injected into the inspired air. Over successive breaths, the concentration of inspired N2O oscillates in a sinewave pattern around a set mean (4%) with a predetermined amplitude and period. This results in end-tidal (ie, alveolar) N2O concentrations to also oscillate in a sinewave pattern. All participants performed IST tests consisting of 4 minutes of forcing an inspired N2O sinewave at periods of 180 seconds and 60 seconds.
Single-Compartment Lung Model
The amplitude/phase of the expired sinewave is processed by a single-compartment tidal ventilation lung model which can estimate cardiorespiratory variables such as VA and  . ELV is the sum of VA and airways dead space (VD), as measured via a modified Bohr technique.21 The period of the inspired sinewave used to estimate ELV is signified by the subscript (ie, ELV180 or ELV60). Both modelling and empirical data have demonstrated that ELV180 has the closest agreement with FRCpleth. The IST indices of VH are: 1) ELV180/FRCpleth, 2) ELV180/ELVpred, and 3) ELV60/ELV180; where lower values suggest greater VH and higher values suggest homogeneity. The first two indices rely on the nature of single compartment lung models. ELV is a perfectly predictable function of ventilation, sinewave period, and expired sinewave attenuation, and underestimations in ELV would suggest a degree of VH.22 This is equivalent to multi-breath washout tests, where deviation from a perfectly exponential washout curve suggests a degree of VH. Therefore, greater VH results in larger disparities between ELV180 and: 1) FRCpleth and 2) ELVpred (a prediction of ELV180 based upon healthy participants.16 The third index relies on ELV measurements becoming more dependent on sinewave period with increasing VH. The ELV of a single compartment lung will be the same regardless of the applied period, but with increasing VH measured ELV become increasingly dependent on the period used, appearing to decrease as the period shortens.22 The lung model, estimation steps, and further details of the VH indices including the tests’ repeatability are described elsewhere.14–16
Statistical Analysis
Analysis was conducted using, GraphPad Prism (GraphPad Software inc.), Matlab v2018b (Mathworks, Natick, MA, USA) and a standard statistical package (SPSS, Chicago, IL, USA). Values are means ± standard deviation unless otherwise stated. Comparisons between variables were assessed via Pearson coefficient for correlation tests, Student’s t-test for continuous variables, and one-way ANOVA for categorical variables and, where appropriate, multiple comparison post hoc analysis with Bonferroni correction. Univariable and multivariable linear regression analysis was performed on PFT data, CT scan analysis, and symptom scores with three independent variables: FEV1%pred, ELV180/FRCpleth and ELV180/ELVpred. The statistical significance level was set at p<0.05. R2 and standardised regression coefficients were taken as a measure of association.
Receiver operating characteristic (ROC) curve analysis was performed to assess the diagnostic accuracy of IST indices of VH for the detection of spirometrically defined COPD (FEV1/FVC<0.7; GOLD).23 The area under the curve was calculated, and the cut-off point for each VH index was determined by using Youden’s index (maximal sensitivity + specificity −1). When it became apparent that specificity could be improved by normalising ELV180/FRCpleth for age, a ROC curve for the additional parameter ELV180/FRCpleth %pred was constructed.
Results
Patients with COPD had a significantly lower mean FEV1%pred (55.1±19.6 vs 101.9±16.7), FEV1%FVC (48.5±13.2 vs 77.6±6.7), TLCO%pred (60.5±18.3 vs 89.2±14.77), and ELVpred (1.45±0.53 vs 2.31±0.78); and a significantly higher mean FRC%pred (137±40.2 vs 106.8±17.4) in comparison to healthy participants (Table 1). There was no difference in age and height, but COPD patients had a higher mean BMI (27.4±5.3 vs 23.77± 4.11).
Comparisons with Physiological Measures
Mean ELV180/FRCpleth and ELV180/ELVpred were significantly lower in COPD patients vs healthy participants (0.34±0.11 vs 0.68±0.14 and 0.7±0.27 vs 0.98±0.15, respectively), FRCpleth%pred was significantly higher in COPD (1.37±40.2 vs 106.9±17.4), but there was no difference in ELV60/ELV180 (Figure 1A–D). In COPD patients, there was a significant correlation between ELV180/FRCpleth and FEV1%pred (r = +0.58, P<0.05) and FRCpleth%pred and FEV1%pred (r = −0.47, P<0.05), but no relationship was observed with ELV180/ELVpred and ELV60/ELV180 (Figure 1E–H). Linear regression analysis between ELV180 vs FRCpleth revealed a strong relationship for healthy participants (y=0.74x – 0.19, R2 = 0.64) but a weaker relationship and lower regression coefficient in COPD patients (y=0.19x + 0.59, R2 = 0.28; Figure 3).
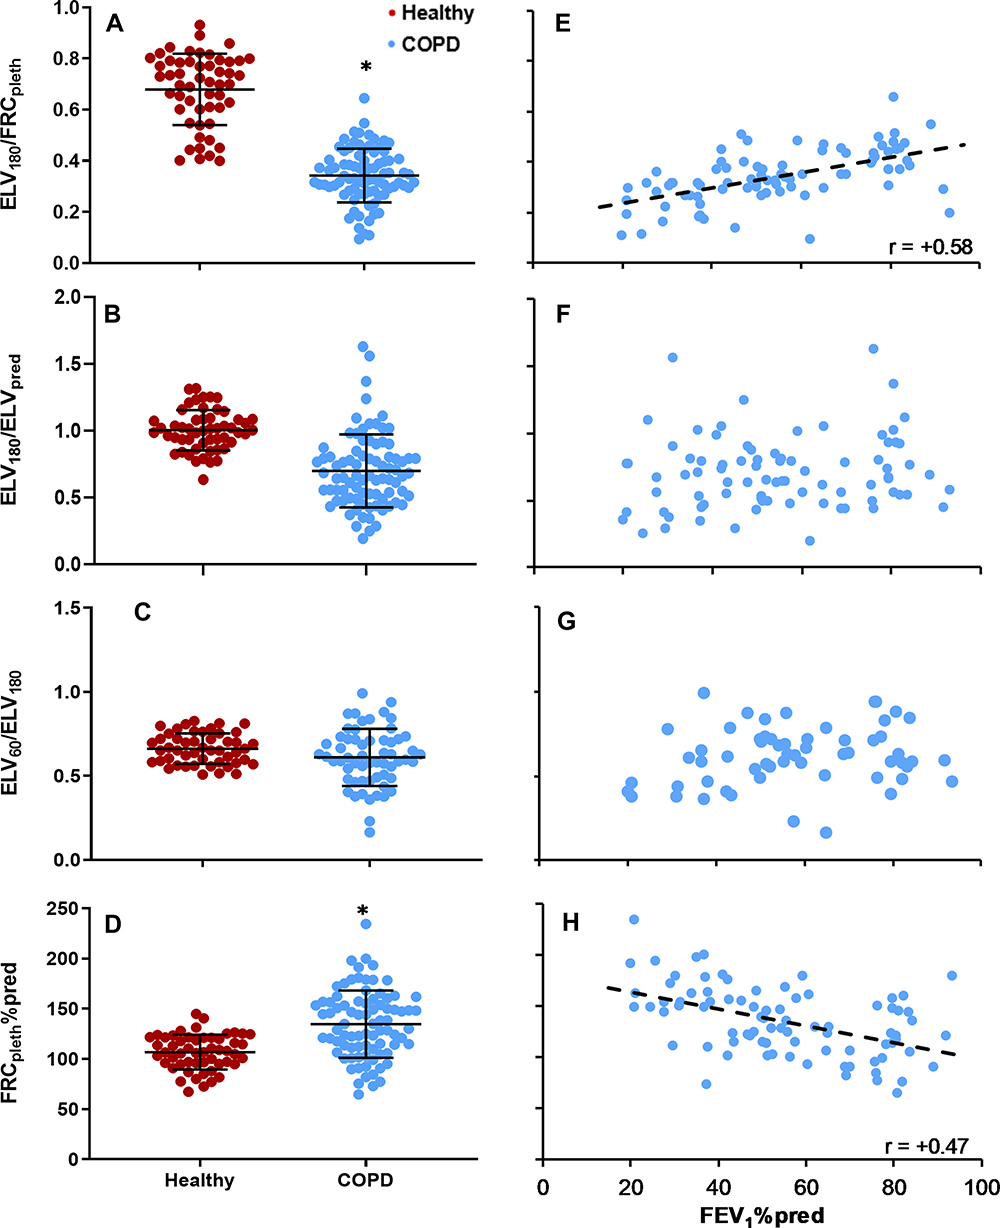 |
Figure 1 (A–D) Comparisons of (A) ELV180/FRCpleth, (B) ELV180/ELVpred, (C) ELV60/ELV180 and (D) FRCpleth%pred in COPD patients (blue) and healthy participants (red). Long horizontal bar = mean; short horizontal bar = standard deviation; *Statistically significant difference (P<0.05). (E–H) scatterplots of (E) ELV180/FRCpleth, (F) ELV180/ELVpred, (G) ELV60/ELV180 and (H) FRCpleth%pred vs FEV1%pred in COPD patients with a linear regression line in D; r = +0.58 (P<0.05). For definitions see Table 1. |
ROC analysis of the predictive value of ELV180/FRCpleth and ELV180/ELVpred for COPD diagnosis is shown in Figure 2. ELV180/FRCpleth (cut-off value <0.51) had as a sensitivity of 0.97 and specificity of 0.81 for COPD diagnosis. However, an ELV180/FRCpleth %pred value, which was based upon previous data from healthy participants16 and normalises values for a given age, increased the specificity (0.98 vs 0.81) and AUC (0.98 vs 0.96) in comparison to ELV180/FRCpleth.
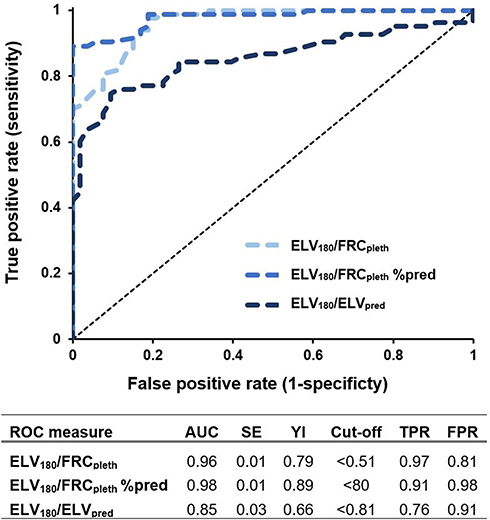 |
Figure 2 Receiver operator characteristic (ROC) curves for ELV180/FRCpleth, ELV180/FRCpleth % pred and ELV180/ELVpred. When it became apparent that specificity could be improved by normalising ELV180/FRCpleth for age, a ROC curve for the additional parameter ELV180/FRCpleth %pred was constructed. Abbreviations: AUC, area under curve; SE, standard Error; YI, Youden’s index (maximal sensitivity+specifity-1). |
There were significant correlations between ELV180/FRCpleth and TLCO%pred, and %LAA (r = +0.51 and −0.50, respectively, P<0.05), and also between ELV180/ELVpred and TLCO%pred, and %LAA (r = +0.41 and −0.37, P<0.05; Figure 4). FRCpleth%pred was also significantly correlated with %LAA (r = −0.33, P<0.05) but not with TLCO%pred (Figure 4).
Comparisons with Symptoms/Clinical Outcomes
Figure 5 shows the relationships between ELV180/FRCpleth and ELV180/ELVpred and the 3 symptom scores. There was a significant correlation between CAT and ELV180/FRCpleth, ELV180/ELVpred and FRCpleth%pred (r = −0.52, −0.36 and +0.36 P<0.05). ELV180/FRCpleth was significantly lower in COPD patients with a mMRC-DS of 2, 3, and 4 vs 0/1, and in those with a score of 4 vs 2/3 (P<0.05). In contrast, ELV180/ELVpred was only significantly lower in patients with a score of 4 vs 0/1, 2, or 3 (P<0.05). FRCpleth%pred was significantly higher in patients with a mMRC-DS of 4 vs 0/1. There was no significant difference in ELV180/FRCpleth or FRCpleth%pred between those with a C+M score of 0–3, 4/5, or ≥6. However, ELV180/ELVpred was significantly lower in those with a score of 4/5 or ≥6 vs 0–3, and in those with a score of ≥6 vs 4/5 (P<0.05).
Classifying patients based upon their ELV180/ELVpred and FRC%pred values (phenotypes I–IV, Figure 6A) uncovered symptomatic differences between groups. Phenotype I displayed significantly lower severity of all symptoms (Figure 6B–D), and phenotype III had a significantly lower CAT score vs phenotype IV (P<0.05). Phenotype II had a significantly lower mean mMRC-DS vs phenotype IV (P<0.05) whereas there was no difference between groups III and IV. However, phenotype III did have a significantly lower C+M score in comparison to groups II and IV. Table 2 shows that ELV180/FRCpleth was an independent and better predictor of the three symptom scores, as well as TLCO%pred, in comparison to FEV1%pred. ELV180/ELVpred was an independent and better predictor of C+M score and TLCO%pred, in comparison to FEV1%pred.
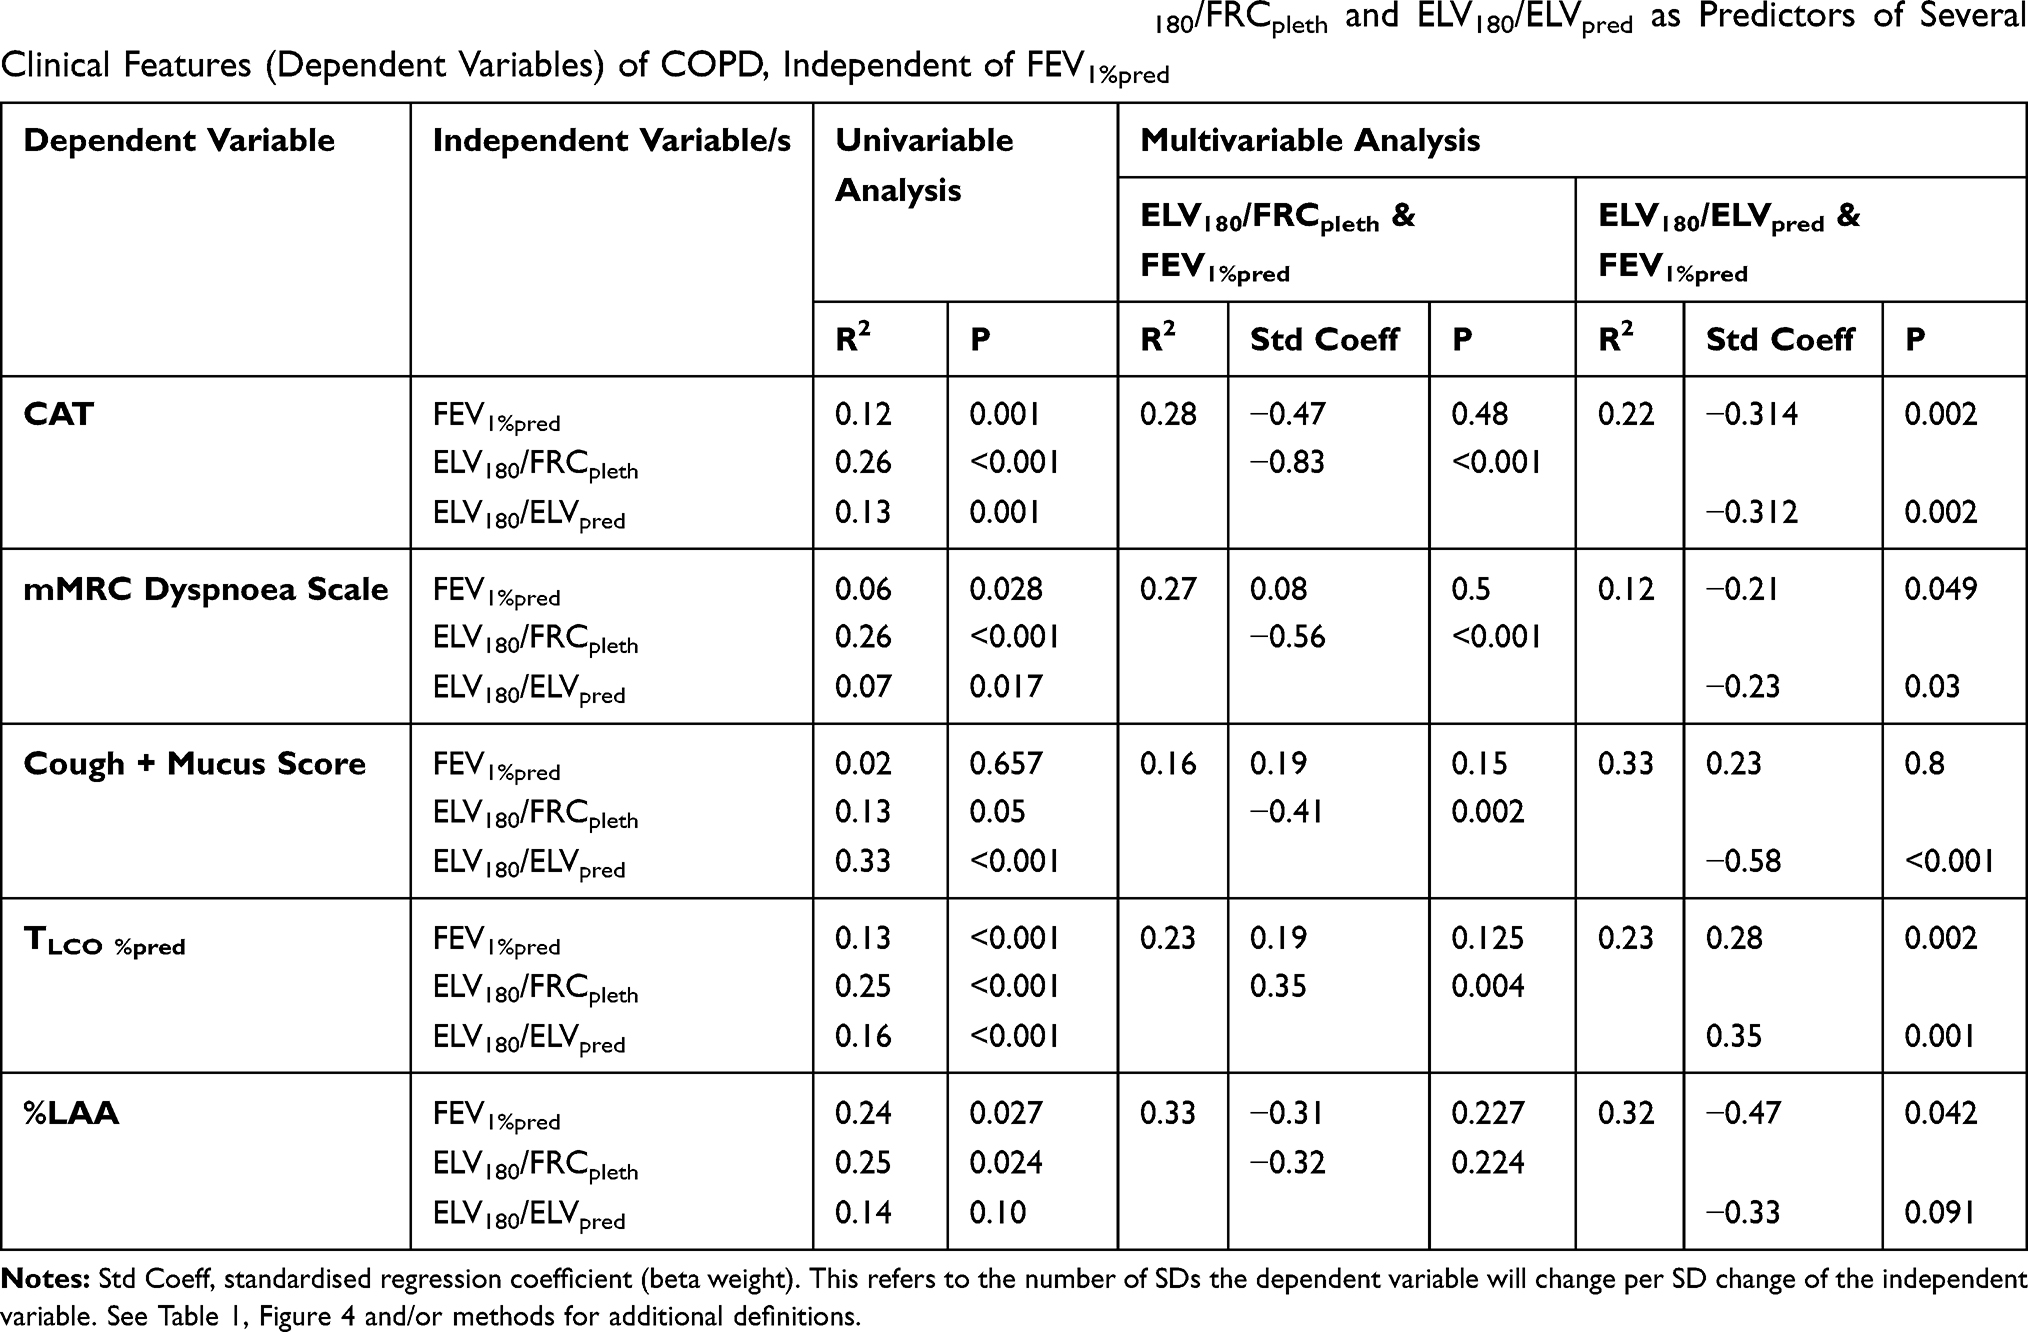 |
Table 2 Univariable and Multivariable Linear Regression Analysis of ELV180/FRCpleth and ELV180/ELVpred as Predictors of Several Clinical Features (Dependent Variables) of COPD, Independent of FEV1%pred |
Discussion
The current study presents a non-invasive and simple-to-perform technique to measure pulmonary function and has demonstrated several novel and clinically relevant findings. We have firstly shown that ELV180/FRCpleth, is significantly different between healthy participants and patients with COPD. This index (with a cut-off of ≤0.51) had a very high sensitivity (0.97) and moderately high specificity (0.81) for identifying spirometrically defined COPD. The relatively low specificity is largely a consequence of the reduction in ELV180/FRCpleth with healthy ageing. Indeed, ≈50% of those >75 years of age had an ELV180/FRCpleth value below the 0.51 cut-off value. This is unsurprising as increases in VH with ageing is well established24 and so must be accounted for. This was achieved by calculating ELV180/FRCpleth%pred, which improved the specificity (0.98 vs 0.81) and AUC (0.98 vs 0.96) in comparison to ELV180/FRCpleth.
ELV60/ELV180 failed to discriminate between health and COPD. This is similar to our previous findings with young and elderly participants, where a detailed discussion of the index has been provided.16 ELV180/ELVpred was significantly different between healthy participants and patients with COPD but displayed a lower AUC (0.85 vs 0.96) and sensitivity (0.76 vs 0.97) in comparison to ELV180/FRCpleth. The poorer sensitivity is likely related to the confounding influence of hyperinflation on measured ELV180. Interestingly however, FRC%pred and ELV180/ELVpred were only poorly related (Figure 6A) suggesting they may be sensitive to different underlying pathophysiology.
We have previously demonstrated that despite observing an increase in FRCpleth by ~0.01L per year of healthy ageing, ELV180 reduces by ~0.01L per year – a likely consequence of increasing VH.16,24 This contrasts with other gas dilution techniques which similarly demonstrate increases in FRC with age.25 This suggests that ELV180 is sensitive to factors other than ‘actual’ lung volume (eg, VH) and so its value may have some independence form FRCpleth. Indeed, it would explain the substantially weaker association between ELV180 and FRCpleth in COPD patients vs healthy participants (Figure 3), as it likely reflects significantly greater patient VH.26 This finding is important as it implies that the relationships in ELV180/FRCpleth (or ELV180/ELVpred) with disease/symptom severity are not simply a reflection of changes in lung volume (eg, hyperinflation) but are dependent on other aspects of lung pathology. Indeed, other evidence from the current study supports this. There was a stronger relationship between ELV180/FRCpleth and (i) FEV1%pred, (ii) TLCO%pred, (iii) %LAA, (iv) CAT score and (v) mMRC dyspnoea score, in comparison to FRCpleth%pred or ELV180/EVLpred alone (Figures 1, 4 and 5). This suggests the measure of ELV180, and its presentation as a ratio of FRCpleth, might provide added useful information.
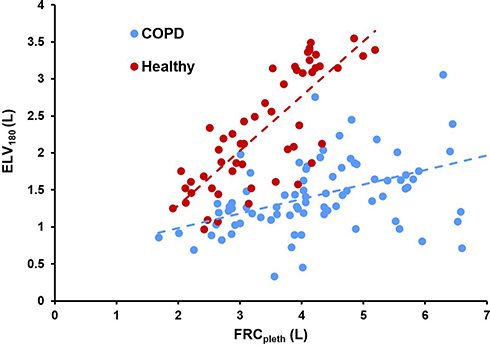 |
Figure 3 Scatterplot of ELV180 (L) vs FRCpleth (L) with linear regression lines. Blue = COPD, Red = COPD. COPD, y = 0.19x + 0.59 (R2 = 0.28); Healthy, y = 0.74x – 0.19 (R2 = 0.64). |
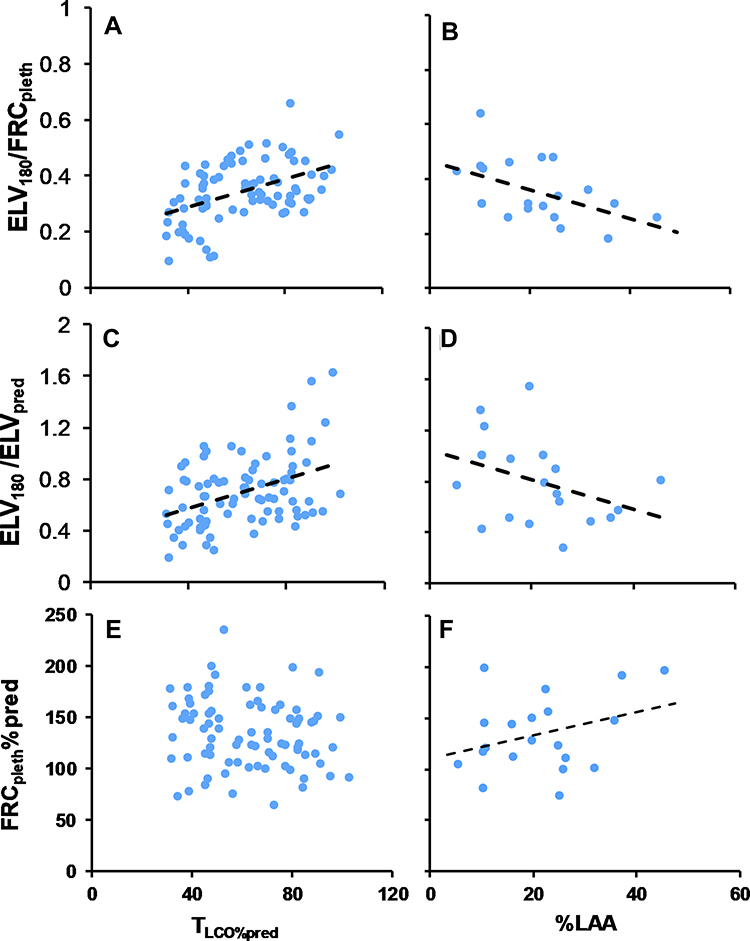 |
Figure 4 Scatterplots of ELV180/FRCpleth (A and B), ELV180/ELVpred (C and D) and FRCpleth%pred (E and F) with TLCO%pred and CT-derived morphological degree of emphysema (%LAA; low-attenuation area less than –950 Hounsfield units). See Table 1 for other definitions. Black linear regression lines are shown in A (r = +0.51), B (r = −0.5), C (r = +0.41), D (r = −0.37), and F (r = +0.33) respectively (P<0.05). |
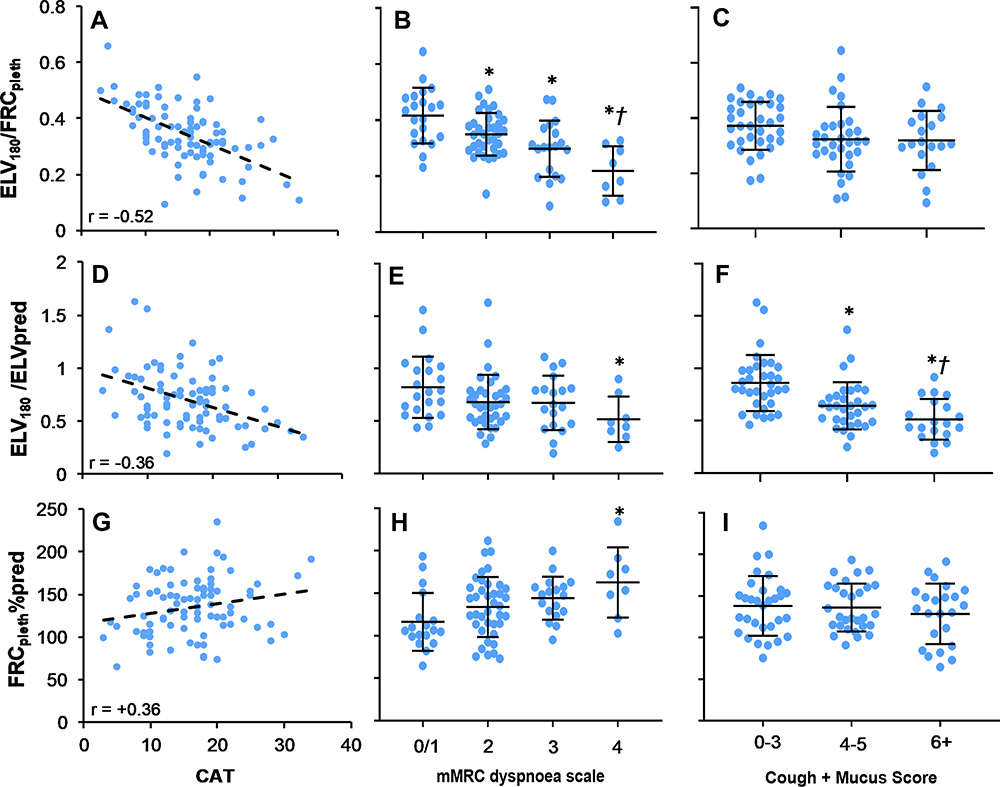 |
Figure 5 Scatterplots of ELV180/FRCpleth, ELV180/ELVpred and FRCpleth%pred with the COPD assessment test (CAT), and dot plots of ELV180/FRCpleth, ELV180/ELVpred and FRCpleth%pred and the modified Medical Research Council (mMRC) dyspnoea scale and a cough + mucus score derived from the first two question of the CAT (see methods for further details). Scatterplots (A, D and G) include a linear regression line, r = −0.52, r = −0.36 and r = +0.36, respectively (P<0.05). *Statistically significant difference (P<0.05) from mMRC Dyspnoea score = 0/1 (B, E and H) or Cough + Mucus score = 0–3 (C, F and I). †Statistical significant difference (P<0.05) from mMRC Dyspnoea score = 2 (B and E) or Cough + Mucus score = 4–5 (C and F). |
For any new clinical tool to be adopted, it must either demonstrate an advantage/s over existing practice or show that it can provide important additional information. In the current study, we have shown that the IST’s diagnostic ability goes beyond simply correlating with the spirometric/FEV1 definition of COPD, as the indices of VH are independent and stronger predictors of several clinically relevant features (Table 2). The closer relationship of ELV180/FRCpleth with TLCO%pred is expected, as reductions in effective lung volume (ELV) will likely be associated with a lower capacity for gas diffusion.27 In addition, the single compartment lung model used to estimate cardio-respiratory variables14,15 will be sensitive to abnormalities in gas exchange.
We have also demonstrated that ELV180/FRCpleth and/or ELV180/ELVpred were independent and superior predictors of symptom severity in comparison to FEV1%pred. Interestingly however, ELV180/FRCpleth and ELV180/ELVpred show varying symptomatic relationships (Figure 5) which may suggest they reflect different phenotypes within the spectrum of COPD.8 As stated above, ELV180 seems to have some independence from FRCpleth (Figure 6A). If patients are categorised by the conventionally accepted threshold of lung hyperinflation (FRCpleth%pred = 120%),28 and also by the lower boundary of normality for ELV180/ELVpred (ie, 2 Z-scores below mean ELV180/ELVpred in healthy participants ≈ 0.7), there is a spread of patients between each of these classifications (‘phenotypes’ I–IV, Figure 6A). Phenotype III and IV are characterised by hyperinflated lungs but have a “normal” or “abnormally low” effective lung volume (ELV180) respectively. In contrast, phenotype II has non-hyperinflated lungs with a low ELV180. Clearly, far fewer patients are classified as phenotype I (non-hyperinflated and “normal” ELV180), and this is where the substantial majority of healthy participants lie (data not shown for clarity).
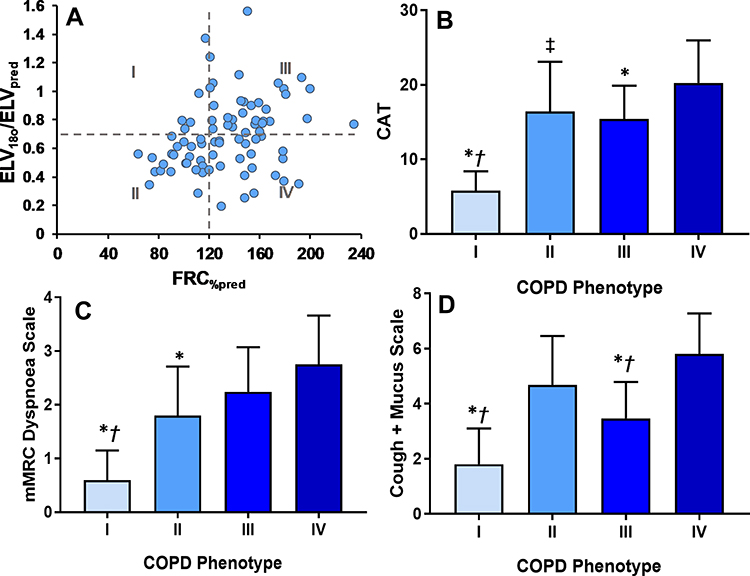 |
Figure 6 (A) Scatterplot of ELV180/ELVpred vs FRC%pred for COPD patients. Patient data has been additionally categorised into quadrants (“COPD phenotype” I–IV) using the conventionally accepted threshold of lung hyperinflation (FRCpleth%pred = 120%),28 and the lower boundary of normality for ELV180/ELVpred (ie, 2 Z-scores below mean ELV180/ELVpred in healthy participants ≈ 0.7)/Quadrant I, FRC%pleth <120% and ELV180/ELVpred ≥ 0.7; II, FRC%pleth <120% and ELV180/ELVpred < 0.7; III, FRC%pleth ≥120% and ELV180/ELVpred ≥ 0.7; IV, FRC%pleth ≥120% and ELV180/ELVpred < 0.7. See Figure 5 and text for further details. (B–D) Bar charts of the mean (±SD) CAT, mMRC Dyspnoea, and Cough + Mucus scores for each phenotype (I–IV). *Statistical significant difference (P<0.05) from COPD phenotype III. †Statistical significant difference (P<0.05) from COPD phenotype II. ‡Near statistical difference (P=0.09) with COPD phenotype IV. |
Figure 6B–D shows the variation in symptom type/severity between these purported phenotypes. Patients within phenotype I had significantly lower symptom severities, whereas phenotype IV displayed the highest severities. Interestingly however, although there was no significant difference in dyspnoea severity between groups III and IV, phenotype II displayed significantly lower dyspnoea values (mMRC-DS). Conversely, phenotype III had a significantly lower cough frequency and/or mucus production in comparison to groups II and IV (C+M scale). However, as this latter finding was produced via an unvalidated approach it should be viewed with caution and, clearly, further work using validated methods is needed.29,30 Interestingly though there was a strong linear association between question 4 of the CAT, which refers to sensations of breathlessness, and an independent and validated measure of dyspnoea (mMRC-DS; r = 0.81, P<0.05), suggesting that analysing CAT questions individually may hold some validity.
The physiological mechanisms underlying these findings require further examination, but there are considerable distinctions in the pathophysiology and molecular processes underlying chronic airways disease vs parenchymal disease which can be reflected in symptom manifestation.31–33 The inflammation, goblet cell metaplasia, and structural remodelling in airways diseases can result in chronic cough, mucus production and inhomogeneous ventilation of lung compartments.12,26,31,34 Under these conditions, the N2O sinewave signal will be inhibited or prevented from entering poorly/non-ventilated regions, and so reduce the measured ELV. In contrast, the N2O signal will likely be able to enter distal regions of emphysematous lungs, but the degradation of elastic parenchymal tissue is a principal cause of lung hyperinflation, and the alterations in pulmonary mechanics are often associated with severe dyspnoea.28
Taken together, this data suggests that in ELV180 may be sensitive to airways disease and provides a good predictor of cough frequency and mucus production. When normalised to FRCpleth however (ELV180/FRCpleth), the measure appears to be a sensitive diagnostic tool for COPD, and is a good predictor of dyspnoea and the general burden of COPD symptoms (as quantified by CAT). Furthermore, patients with an abnormally low ELV180 and high FRCpleth tend to have the most severe symptoms. Parenchymal and airways disease both occur to varying degrees across the spectrum of COPD patients, yet current management guidelines essentially disregard this heterogeneity.33,35 The IST has potential as a simple and non-invasive method to stratify patients into subgroups based upon their “effective” lung volume and hence direct more individualised treatment strategies.36
ELV180/FRCpleth was significantly correlated with the CT-derived morphological degree of emphysema (%LAA), and the strength of association was similar to that of FEV1%pred. Emphysema detected by CT has been previously correlated with gross pathology37 and is associated with important clinical outcomes, including mortality.38 Lung parenchyma destruction has the potential to increase the disparity between ELV180 and FRCpleth. FRCpleth will be necessarily increased by hyperinflation, but ELV180 may also become reduced by inhomogeneous enlargement of airspaces9 and the increase of VH of the most distal acinar lung units – indeed emphysema is known to cause an increase in Sacin39 (see below). Although ELV180/FRCpleth only performed similarly to FEV1%pred, it is worth noting that our current study is restricted to patients with a spirometric definition of COPD. It has long been argued that quantifying VH via washout techniques may be sensitive to early airway changes in smokers, before any measurable proximal airflow limitation.39 As such, techniques such as IST have the potential to provide an earlier diagnosis of COPD (‘GOLD 0ʹ),40 which warrants further work with smokers and assessing the association of IST measures with long-term outcomes.
Single and multiple-breath nitrogen washout (SBNW and MBNW) tests are becoming established clinical methods of assessing VH. These tests involve expelling alveolar nitrogen by inhaling 100% oxygen, and assessing the characterises of the single breath nitrogen expirogram (eg, Phase III slope; SBNW), or the clearance of nitrogen over multiple breaths (MBNW).13 It has been shown that both tests are sensitive to small airways disease in COPD patients and non-obstructed smokers, and have been associated with the severity of respiratory symptoms.26,39,41,42 Given the parallels between techniques, future work should compare the performance of the IST with SBNW/MBNW in health and obstructive disease. Unlike SBNW, which assesses the entire airway, MBNW can probe VH at the acinar (Sacin) and conducting airways (Scond) levels.43 We also aim to develop more complex multicompartmental models that can provide additional information about different regions of the cardiopulmonary system. Unlike MBNW which is limited to assessing airways, the IST has the potential to analyse abnormalities in  . Currently, we are developing a simulation-based optimisation model, using Bayesian optimisation methods,44 to provide further indices of lung heterogeneity using IST data. The concepts of the multi-compartmental lung model have been discussed elsewhere45–47 and we aim for it to examine lung heterogeneity by recovering lognormal distributions of ventilation (
 ) and
) and  fractions and assessing
  mismatching. Initial analysis, using data from the current study, shows the
  and
and  distributions are wider in COPD patients in comparison to healthy controls, and are similar to those demonstrated using other experimental techniques46 (see supplemental material and Figure 1S). This clearly shows the potential for using more complex multi-compartmental models in the assessment of COPD, but further work is required.
Conclusions
The IST is a non-invasive method to monitor cardiopulmonary function which can produce clinically useful indices of VH: ELV180/FRCpleth and ELV180/ELVpleth. ELV180/FRCpleth, has a very high sensitivity for spirometrically defined COPD and its specificity improves if normalised for age. However, the IST’s diagnostic ability goes beyond simply agreeing with FEV1, as the indices of VH are independent and better predictors of several clinically relevant features of COPD including the type/severity of symptoms. Interestingly, ELV180/FRCpleth and ELV180/ELVpleth show varying symptomatic relationships which may suggest they reflect different phenotypes within the spectrum of COPD. The IST has potential as a simple-to-perform method to stratify patients into clinically relevant subgroups based upon their effective lung volume.
Abbreviations
BMI, body mass index; CAT, COPD assessment test; ELV, effective lung volume; FEV1, forced expiratory volume in one second; FRC, functional residual capacity; FVC, forced vital capacity; IST, inspired sinewave test; KCO, transfer coefficient for carbon monoxide; LAA, low attenuation area; mMRC-DS, modified Medical Research Council dyspnoea scale; PEF, peak expiratory flow;  , pulmonary blood flow; RV, residual volume; TLC, total lung capacity; TLCO, transfer factor for carbon monoxide;
  , ventilation; VA, alveolar volume; VD, anatomical dead space; VH, ventilatory heterogeneity.
Acknowledgments
The authors appreciate the time given up by all the participants, and the important technical assistance from Clinical Scientists at Oxford University Hospitals NHS Foundation Trust: Mr Ben Guan, Mr Blake Marsh and Ms Michaela Paish.
Author Contributions
All authors made a significant contribution to the work reported, whether that is in the conception, study design, execution, acquisition of data, analysis and interpretation, or in all these areas; took part in drafting, revising or critically reviewing the article; gave final approval of the version to be published; have agreed on the journal to which the article has been submitted; and agree to be accountable for all aspects of the work.
Funding
This project was funded by Department of Health, National Institute for Health Research (Grant Number: II-LA-0214-20005).
Disclosure
Professor Andrew D Farmery reports a patent EP3122249 issued and Dr Phi Anh Phan reports a patent EP3122249A1 issued. The authors report no other conflicts of interest in this work.
References
1. British Lung foundation. Estimating the economic burden of respiratory illness in the UK; 2017. Available from: www.blf.org.uk/what-we-do/our-research/economic-burden.
2. National Institute for Health and Care Excellence. Chronic obstructive pulmonary disease in adults. Quality Standard 10 (QS10). London: NICE; 2016. Available from: www.nice.org.uk/Guidance/QS10.
3. Vestbo J, Hurd SS, Agustí AG, et al. Global strategy for the diagnosis, management, and prevention of chronic obstructive pulmonary disease. Am J Respir Crit Care Med. 2013;187(4):347–365. doi:10.1164/rccm.201204-0596PP
4. Agusti A, Calverley PM, Celli B, et al. Characterisation of COPD heterogeneity in the ECLIPSE cohort. Respir Res. 2010;11(1):1–14. doi:10.1186/1465-9921-11-122
5. Miller MR, Hankinson J, Brusasco V, et al. Standardisation of spirometry. Eur Respir J. 2005;26(2):319–338. doi:10.1183/09031936.05.00034805
6. Bellia V, Pistelli R, Catalano F, et al. Quality control of spirometry in the elderly. Am J Respir Crit Care Med. 2000;161(4):1094–1100. doi:10.1164/ajrccm.161.4.9810093
7. Beydon N, Davis SD, Lombardi E, et al. An official American Thoracic Society/European Respiratory Society statement: pulmonary function testing in preschool children. Am J Respir Crit Care Med. 2007;175(12):1304–1345. doi:10.1164/rccm.200605-642ST
8. Han MK, Agusti A, Calverley PM, et al. COPD phenotypes: The future of COPD. Am J Respir Crit Care Med. 2010;182.
9. Verbeken EK, Cauberghs M, Mertens I, Clement J, Lauweryns JM, Van de Woestijne KP. The senile lung. Comparison with normal and emphysematous lungs. 1. Structural aspects. Chest. 1992;101(3):793–799. doi:10.1378/chest.101.3.793
10. Hogg JC. Pathophysiology of airflow limitation in chronic obstructive pulmonary disease. Lancet. 2004;364(9435):709–721. doi:10.1016/S0140-6736(04)16900-6
11. McDonough JE, Yuan R, Suzuki M, et al. Small-airway obstruction and emphysema in chronic obstructive pulmonary disease. New Engl J Med. 2011;365(17):1567–1575. doi:10.1056/NEJMoa1106955
12. Cosio M, Ghezzo H, Hogg JC, et al. The relations between structural changes in small airways and pulmonary-function tests. New Engl J Med. 1978;298(23):1277–1281. doi:10.1056/NEJM197806082982303
13. Robinson PD, Latzin P, Verbanck S, et al. Consensus statement for inert gas washout measurement using multiple- and single-breath tests. Eur Respir J. 2013;41(3):507–522. doi:10.1183/09031936.00069712
14. Farmery A. Interrogation of the Cardiopulmonary System with Inspired GasTension Sinusoids. University of London; 2008.
15. Clifton L, Clifton DA, Hahn CEW, Farmery AD. Assessment of lung function using a non-invasive oscillating gas-forcing technique. Respir Physiol Neurobiol. 2013;189(1):174–182. doi:10.1016/j.resp.2013.05.015
16. Bruce RM, Phan PA, Pacpaco E, Rahman NM, Farmery AD. The inspired sine‐wave technique: a novel method to measure lung volume and ventilatory heterogeneity. Exp Physiol. 2018;103:738–747. doi:10.1113/EP086867
17. Bruce RM, Crockett DC, Morgan A, et al. Noninvasive cardiac output monitoring in a porcine model using the inspired sinewave technique: a proof-of-concept study. Br J Anaesth. 2019;123(2):126–134. doi:10.1016/j.bja.2019.02.025
18. Jones PW, Harding G, Berry P, Wiklund I, Chen WH, Kline Leidy N. Development and first validation of the COPD assessment test. Eur Respir J. 2009;34(3):648–654. doi:10.1183/09031936.00102509
19. Mahler DA, Wells CK. Evaluation of clinical methods for rating dyspnea. Chest. 1988;93(3):580–586. doi:10.1378/chest.93.3.580
20. Doel T. Pulmonary Toolkit. Available from: https://github.com/tomdoel/pulmonarytoolkit.
21. Phan PA, Hahn CEW, Farmery AD. A modification of the Bohr method to determine airways deadspace for non-uniform inspired gas tensions. Physiol Meas. 2017;38(7):N107–n117. doi:10.1088/1361-6579/aa70c0
22. Whiteley JP, Gavaghan DJ, Hahn CE. A tidal breathing model of the inert gas sinewave technique for inhomogeneous lungs. Respir Physiol. 2001;124(1):65–83. doi:10.1016/S0034-5687(00)00185-7
23. Vogelmeier CF, Criner GJ, Martinez FJ, et al. Global strategy for the diagnosis, management, and prevention of chronic obstructive lung disease 2017 report. GOLD executive summary. Am J Respir Crit Care Med. 2017;195(5):557–582.
24. Verbanck S, Thompson BR, Schuermans D, et al. Ventilation heterogeneity in the acinar and conductive zones of the normal ageing lung. Thorax. 2012;67(9):789–795. doi:10.1136/thoraxjnl-2011-201484
25. Roberts CM, MacRae KD, Winning AJ, Adams L, Seed WA. Reference values and prediction equations for normal lung function in a non-smoking white urban population. Thorax. 1991;46(9):643–650. doi:10.1136/thx.46.9.643
26. Verbanck S, Schuermans D, Muylem AV, et al. Conductive and acinar lung-zone contributions to ventilation inhomogeneity in COPD. Am J Respir Crit Care Med. 1998;157(5):1573–1577. doi:10.1164/ajrccm.157.5.9710042
27. Graham BL, Brusasco V, Burgos F, et al. 2017 ERS/ATS standards for single-breath carbon monoxide uptake in the lung. Eur Respir J. 2017;49(1). doi:10.1183/13993003.00016-2016.
28. O’Donnell DE, Laveneziana P. Physiology and consequences of lung hyperinflation in COPD. Eur Respir Rev. 2006;15(100):61–67. doi:10.1183/09059180.00010002
29. Birring SS, Prudon B, Carr AJ, Singh SJ, Morgan MD, Pavord ID. Development of a symptom specific health status measure for patients with chronic cough: Leicester Cough Questionnaire (LCQ). Thorax. 2003;58(4):339–343. doi:10.1136/thorax.58.4.339
30. Birring SS, Fleming T, Matos S, Raj AA, Evans DH, Pavord ID. The Leicester cough monitor: preliminary validation of an automated cough detection system in chronic cough. Eur Respir J. 2008;31(5):1013–1018. doi:10.1183/09031936.00057407
31. Kim V, Criner GJ. Chronic bronchitis and chronic obstructive pulmonary disease. Am J Respir Crit Care Med. 2013;187(3):228–237. doi:10.1164/rccm.201210-1843CI
32. Gosselink JV, Hayashi S, Elliott WM, et al. Differential expression of tissue repair genes in the pathogenesis of chronic obstructive pulmonary disease. Am J Respir Crit Care Med. 2010;181(12):1329–1335. doi:10.1164/rccm.200812-1902OC
33. Celli BR, MacNee W, Agusti A, et al. Standards for the diagnosis and treatment of patients with COPD: a summary of the ATS/ERS position paper. Eur Respir J. 2004;23(6):932–946. doi:10.1183/09031936.04.00014304
34. Horsley A. Lung clearance index in the assessment of airways disease. Respir Med. 2009;103(6):793–799. doi:10.1016/j.rmed.2009.01.025
35. Qaseem A, Wilt TJ, Weinberger SE, et al. Diagnosis and management of stable chronic obstructive pulmonary disease: a clinical practice guideline update from the American College of Physicians, American College of Chest Physicians, American Thoracic Society, and European Respiratory Society. Ann Intern Med. 2011;155(3):179–191. doi:10.7326/0003-4819-155-3-201108020-00008
36. Macklem PT. Therapeutic implications of the pathophysiology of COPD. Eur Respir J. 2010;35:676–680. doi:10.1183/09031936.00120609
37. Bergin C, Müller N, Nichols DM, et al. The diagnosis of emphysema. Am Rev Respir Dis. 1986;133(4):541–546.
38. Zulueta JJ, Wisnivesky JP, Henschke CI, et al. Emphysema scores predict death from COPD and lung cancer. Chest. 2012;141(5):1216–1223. doi:10.1378/chest.11-0101
39. Verbanck S, Schuermans D, Meysman M, Paiva M, Vincken W. Noninvasive assessment of airway alterations in smokers: the small airways revisited. Am J Respir Crit Care Med. 2004;170(4):414–419. doi:10.1164/rccm.200401-037OC
40. Vestbo J, Lange P. Can GOLD Stage 0 provide information of prognostic value in chronic obstructive pulmonary disease? Am J Respir Crit Care Med. 2002;166(3):329–332. doi:10.1164/rccm.2112048
41. Boeck L, Gensmer A, Nyilas S, et al. Single-breath washout tests to assess small airway disease in COPD. Chest. 2016;150(5):1091–1100. doi:10.1016/j.chest.2016.05.019
42. Bell AS, Lawrence PJ, Singh D, Horsley A. Feasibility and challenges of using multiple breath washout in COPD. Int J Chron Obstruct Pulmon Dis. 2018;13:2113–2119. doi:10.2147/COPD.S164285
43. Verbanck S, Schuermans D, Van muylem A, Paiva M, Noppen M, Vincken W. Ventilation distribution during histamine provocation. J Appl Physiol. 1997;83(6):1907–1916. doi:10.1152/jappl.1997.83.6.1907
44. Nguyen V. Bayesian optimization for accelerating hyper-parameter tuning.
45. Harrison C. Methods for Determining Lung Function from Tracer Gas Concentrations. University of Oxford; 2016.
46. Mountain JE, Santer P, O’Neill DP, et al. Potential for noninvasive assessment of lung inhomogeneity using highly precise, highly time-resolved measurements of gas exchange. J Appl Physiol. 2018;124(3):615–631. doi:10.1152/japplphysiol.00745.2017
47. Tran M, Crockett D, Phan PA, Payne S, Farmery A A tidal lung simulation to quantify lung heterogeneity with the Inspired Sinewave test.
48. Quanjer PH, Tammeling GJ, Cotes JE, Pedersen OF, Peslin R, Yernault J-C. Lung volumes and forced ventilatory flows. Eur Respir J. 1993;6(Suppl 16):5–40. doi:10.1183/09041950.005s1693
49. Quanjer PH, Stanojevic S, Cole TJ, et al. Multi-ethnic reference values for spirometry for the 3–95 year age range: the global lung function 2012 equations. Eur Respir J. 2012;40:1324–1343. doi:10.1183/09031936.00080312
 © 2021 The Author(s). This work is published and licensed by Dove Medical Press Limited. The full terms of this license are available at https://www.dovepress.com/terms.php and incorporate the Creative Commons Attribution - Non Commercial (unported, v3.0) License.
By accessing the work you hereby accept the Terms. Non-commercial uses of the work are permitted without any further permission from Dove Medical Press Limited, provided the work is properly attributed. For permission for commercial use of this work, please see paragraphs 4.2 and 5 of our Terms.
© 2021 The Author(s). This work is published and licensed by Dove Medical Press Limited. The full terms of this license are available at https://www.dovepress.com/terms.php and incorporate the Creative Commons Attribution - Non Commercial (unported, v3.0) License.
By accessing the work you hereby accept the Terms. Non-commercial uses of the work are permitted without any further permission from Dove Medical Press Limited, provided the work is properly attributed. For permission for commercial use of this work, please see paragraphs 4.2 and 5 of our Terms.