")
Back to Journals » Journal of Pain Research » Volume 17
Assessment of the Effects of Sphingosine Kinase 1/Sphingosine-1-Phosphate on Microangiogenesis at Rat Myofascial Trigger Points Using Contrast-Enhanced Ultrasonography
Authors Fang X, Yin Y, Lun H, Liu Y, Zhu S
Received 25 August 2023
Accepted for publication 28 January 2024
Published 12 February 2024 Volume 2024:17 Pages 609—621
DOI https://doi.org/10.2147/JPR.S437111
Checked for plagiarism Yes
Review by Single anonymous peer review
Peer reviewer comments 3
Editor who approved publication: Dr Michael A Ueberall
Xin Fang,1 Yalong Yin,2 Haimei Lun,3 Yaoli Liu,1 Shangyong Zhu1
1Department of Medical Ultrasound, First Affiliated Hospital of Guangxi Medical University, Nanning, Guangxi, People’s Republic of China; 2Department of Traditional Chinese Medicine, First Affiliated Hospital of Guangxi Medical University, Nanning, Guangxi, People’s Republic of China; 3Department of Ultrasound, People’s Hospital of Guangxi Zhuang Autonomous Region, Nanning, Guangxi, People’s Republic of China
Correspondence: Shangyong Zhu, Department of Medical Ultrasound, First Affiliated Hospital of Guangxi Medical University, No. 6 Shuangyong Road, Nanning, Guangxi, 530021, People’s Republic of China, Email [email protected]
Purpose: Few studies have assessed the effects of sphingosine kinase 1/sphingosine-1-phosphate (SPHK1/S1P) on microangiogenesis at rat myofascial trigger points (MTrPs) using contrast-enhanced ultrasonography (CEUS). This study aimed to address these deficiencies. Here, we investigated the effects of SPHK1/S1P on MTrP microangiogenesis and the value of CEUS in evaluating these effects.
Methods: Forty Sprague‒Dawley rats were subdivided into two groups: control and MTrP groups. MTrPs were established by 8 weeks of the strike procedure combined with eccentric motion and 4 weeks of recovery. All rats were euthanized after having undergone CEUS with an overdose of pentobarbital sodium. MTrP and control tissue samples were removed for haematoxylin and eosin (H&E) staining and transmission electron microscopy (TEM) imaging. The tissue was dehydrated, cleared, and embedded before sectioning. The sections were then incubated overnight at 4°C, and immunohistochemistry was carried out with primary antibodies including rabbit anti-CD31, rabbit anti-SPHK1and rabbit anti-S1PR1.
Results: MTrP rats exhibited spontaneous electrical activity (SEA) and a local twitch response (LTR) during electromyography (EMG) examination. The CEUS time-intensity curves (TICs) showed that the perfusion intensity in the MTrPs and surrounding tissue area was increased, with faster perfusion than in normal sites, while the TICs in the control group slowly increased and then slowly decreased. The correlation coefficient between the microvessel density (MVD) and sphingosine 1-phosphate receptor 1 (S1PR1) was 0.716 (p < 0.01). Spearman correlation analysis revealed that Spearman’s rho (ρ) values between the MVD and peak intensity (PI), between the MVD and area under the curve (AUC), and between the MVD and SPHK1 were > 0.5 (p < 0.05), > 0.7 (p < 0.01), and > 0.7 (p < 0.01), respectively.
Conclusion: CEUS is valuable for detecting microangiogenesis within MTrPs, and SPHK1/S1P plays an important role in promoting MTrP tissue microangiogenesis.
Keywords: ultrasound, myofascial pain syndrome, diagnosis, angiogenesis
Introduction
Myofascial trigger points (MTrPs) are easily irritated points in skeletal muscle whose palpation reveals highly sensitive nodules in tension belts. Their activation commonly leads to clinical symptoms such as tenderness, referred pain, local muscle twitching, motor dysfunction, and autonomic symptoms. The energy crisis theory states that the complex pathological mechanism underlying MTrP formation involves a combination of multiple factors, including ischaemia and hypoxia, inflammation sensitization, and motor endplate functional abnormalities.1
Skeletal muscle injury following blood vessel injury results in ischaemia and hypoxia, and under these conditions, macrophages, T cells, astrocytes, and smooth muscle cells can secrete vascular endothelial growth factor (VEGF).2,3 This compound is considered to play an important role in angiogenesis, during which endothelial cells grow, migrate, and eventually form tubes and capillaries.4 Recent studies have shown that VEGF levels are greater in individuals with active MTrPs than in normal control individuals.5,6 Sphingosine kinase 1 (SPHK1) is one of a small number of important kinases that regulate sphingolipid metabolism in the body. Studies have shown that VEGF can activate the SPHK1 pathway to induce endothelial cell proliferation, angiogenesis, repair, and other processes through the mediation of protein kinase C.7 Other studies have shown that hypoxia can directly increase the expression level of the SPHK1 protein in tumour cells, thus affecting their proliferation, migration and invasion.8 However, under hypoxic conditions, SPHK1 can activate the Akt/GSK3b signalling pathway through sphingosine-1-phosphate/sphingosine 1-phosphate receptor 2 (S1P/S1PR2), regulating the level and activity of hypoxia-inducible factor-1α (HIF-1α) and cell survival, thus affecting the structure of the neovasculum.9
Notably, various biological effects of SPHK1 are realized mainly through its catalytic product S1P, an extremely important signalling molecule involved in cell growth and metabolism. It is both a second messenger molecule involved in intracellular signal transduction and a ligand of 5 G protein-coupled receptors outside the cell. S1P activates different signalling pathways by binding to receptors on the cell surface, thus participating in the regulation of various physiological and pathological processes in cells.10 S1P can bind to sphingosine 1-phosphate receptors (S1PRs) specifically to regulate various physiological processes in cells. Sphingosine 1-phosphate receptor 1 (S1PR1) is widely expressed in the lung, liver, heart, kidney, skeletal muscle and other tissues;11,12 by binding to it, S1P mainly stimulates endothelial cell proliferation, survival, migration and capillary lumen formation, thus promoting angiogenesis. Previous studies have confirmed that the SPHK1/S1P pathway plays an important role in angiogenesis, including endothelial cell proliferation, migration, survival, capillary formation and neovascularization.13,14 Inhibition of SPHK1 in renal vascular endothelial cells significantly reduces angiogenesis in vivo.15 S1P can inhibit the expression of miR-16-5p in rheumatoid arthritis through the c-Src/FAK signalling pathway, increase the generation of VEGF in osteoblasts, and promote endothelial progenitor cell angiogenesis.16
Contrast-enhanced ultrasonography (CEUS) has been shown to outperform conventional ultrasound in performing qualitative diagnoses, particularly via the time-intensity curves (TICs) obtained through CEUS, which can provide indirect information on blood flow in lesions with different microcirculation perfusion states. The peak intensity (PI) refers to the signal intensity of the contrast agent in the region of interest (ROI) and reflects the maximum dose of the contrast agent in the region. The PI is proportional to the average blood volume in the ROI and is strongly correlated with the perfusion of the tissue. When the ultrasound instrument and the dose of contrast agent are held constant, the area under the time-intensity curve (AUC) is affected by the blood flow velocity and the volume of blood distributed. By applying the TIC, quantified analyses of the PI and AUC, as well as contrast agent arrival time (AT), time to peak (TTP), mean transit time (MTT) and other parameters can be used to accurately measure the blood flow status of the lesion and objectively reflect the degree of neovascularization within.
However, there are no relevant studies on the use of CEUS for evaluating angiogenesis in MTrPs or the corresponding role, if any, of SPHK1/S1PR1. Therefore, this study focused on assessing the effects of SPHK1/S1P on microangiogenesis at rat MTrPs using CEUS.
Materials and Methods
Compliance with Ethical Standards
All institutional and national guidelines for the care and use of laboratory animals were followed. This study was approved by the Animal Ethics Committee of Guangxi Medical University (Reference number: 202203003).
Experimental Animals and Modelling
Forty healthy male specific pathogen-free Sprague‒Dawley rats (calculated according to preliminary experimental results) with a body mass of 250–280 g were obtained from the Animal Experiment Center of Guangxi Medical University [Certificate of Conformity: SCXK Gui2009-0002]. Three animals were placed in each cage and fed freely. The feeding environment was maintained under a 12 h day/night cycle, with a temperature ranging from 24°C to 26°C and a humidity ranging from 50% to 70%. After 1 week of adaptive feeding, the 40 rats were randomly divided into a control group (n = 10) and an MTrP group (n = 30). The 30 rats in the MTrP group were subjected to blunt strikes of the right vastus medialis muscle using a 1200 g stick freely dropped from a height of 20 cm with a kinetic energy of 2.352 J. And all injured rats underwent 90 minutes of eccentric exercise on a treadmill (SA101B, Jiangsu Saiangsi Biological Technology Co., Ltd., Nanjing, China) at a −16° downhill angle and speed of 16 m/min on the second day. This procedure lasted for 8 weeks as detailed described by Huang.17
Electromyography (EMG)
An EMG device (Keypoint9033A07, Dendi EMG, Denmark, 20 Hz-10,000 Hz) with a sensitivity of 0.2 mv/grid and a scanning speed of 10 or 200 ms/grid was used in this study. The rats were anaesthetized by inhalation of isoflurane (induction concentration 4%, maintenance concentration 2%) and fixed in the supine position with a special fixer. The right lower limbs of the rats were shaved, and the muscle tension belts or contraction nodules at the modelling site were identified by palpation. A ground wire was fixed, and a needle electrode was inserted into the tension belts. If a local twitch response (LTR) was observed, the site was marked, and the electrode was made indwelling; another needle was then inserted 3–5 mm away from the side as a reference electrode. The electrode was connected to the EMG device to record spontaneous electrical activity (SEA) in the resting state for 2 min. In the control group, the electromyogram waveform of the middle of the right vastus medialis muscle was recorded. All the above operations were performed by an EMG physician with 8 years of experience.
CEUS Processing
For rats in the MTrP group, an MTrP was defined as a hypertension belt or contracture nodule that, after identification with palpation, produced an LTR and high-frequency SEA on EMG under resting conditions.18 In the evaluation of the MTrP, a total of 10 rats for whom muscle hypertension belts were not palpated or who had no SEA were excluded. During modelling, 5 rats were excluded due to excessive anaesthesia or fracture. The remaining 25 rats (MTrP group: n=15; control group: n=10) underwent CEUS using a Mindray ResonaI9 clinical ultrasound (US) system (Mindray Bio-Medical Electronics Co., Ltd., Shenzhen, China) with a linear array transducer (L9-3s) probe (3.6–9.0 MHz). After intraperitoneal anaesthesia with sodium pentobarbital (50 mg/kg body weight), the rats were placed in the supine position, and the MTrPs in the right vastus medialis muscle were palpated and marked by rehabilitation physicians with extensive palpation experience. The control rats were also labelled at the same position. On greyscale ultrasound, the femur was used as a marker for identifying the MTrP, and the probe was gently moved without pressure to obtain a two-dimensional sonogram. Meanwhile, a professional doctor performed left saphenous vein catheterization. The CEUS imaging mode was turned on, and the imaging area was set. Five millilitres of normal saline were injected into a SonoVue (Bracco SpA, Milan, Italy) vial, and the bottle was shaken vigorously until the lyophilized powder was completely dispersed. The agent contains sulfur hexafluoride microbubbles, which enhance ultrasound images by reflecting ultrasound waves differently than the surrounding tissues. For the selection of contrast agent dosage, sulfur hexafluoride microbubble suspensions were extracted at a dose of 0.05–0.1 mL/100 g,19 injected rapidly through the saphenous vein catheter of the rat and then washed with normal saline. The contrast timer was then started. The contrast perfusion process was observed in real time, and the images were saved for offline analysis. The following CEUS parameters were recorded: basal intensity (BI), goodness of fit (GOF), ascending slope (AS), descending slope (DS), AT, TTP, PI, MTT and AUC. All CEUS examinations were performed by one doctor to maintain as constant and standardized a speed of bolus injection as possible, and the data were collected by two senior doctors separately, each of whom performed the analyses three times. After the repeated tests, a single injection of 0.3 mL of contrast agent yielded the best image quality, the clearest diffusion and regression of the contrast agent on the surface of the femur, and the most reasonable TIC data. Thus, the dose of contrast agent was determined to be 0.3 mL/time; the agent was then injected through the saphenous vein, and the tube was quickly rinsed with normal saline after injection. This procedure ensured that the MTrPs in the rats can be visualized and assessed using CEUS. The meticulous steps, from rat selection to optimal dosage determination, were designed to ensure accuracy, repeatability, and safety in the process.
Haematoxylin and Eosin (H&E)
All rats were euthanized after CEUS with an overdose of pentobarbital sodium. The MTrP and control tissue samples were removed, fixed in 4% paraformaldehyde solution, dehydrated in gradient ethanol, and embedded in paraffin to produce 3–5 μm pathological sections. The specimens were stained with H&E and observed under a light microscope (Nikon, Japan, Eclipse Ci-L) to analyse and evaluate histological changes.
Transmission Electron Microscopy (TEM)
At the end of the experiment, the rats were anaesthetized, perfused and fixed, and the tissue was trimmed into 1 mm×2 mm×3 mm tissue blocks with a surgical blade on ice.20 The tissue blocks were then prefixed (2.5% glutaraldehyde for 4 h) and fixed (1% osmic acid buffer for 2 h). After fixation, the tissue sections were dehydrated, embedded, subjected to ultrathin slicing, and stained. Finally, the sections were observed under a transmission electron microscope (HITACHI, Japan, HT7800/HT7700). The observation area was first determined under a low magnification field (×2500), and then the ultrastructure was observed under a high magnification field (×7000, ×15,000), including the arrangement of muscle fibres and the size, distribution, and morphological changes in the mitochondria.
Microvessel Density (MVD) Assay
Serial sections of paraffin-embedded vastus medialis muscle tissue (4 mm) were dewaxed. CD31 staining of sections with rabbit anti-CD31 primary antibody (1:500; cat # 28083-1-AP; Proteintech, China) was performed to calculate the MVD to evaluate neovascularization and blood supply. The sections were incubated overnight at 4°C. Phosphate-buffered saline (PBS) (pH 7.4) in place of the primary antibody was used as a negative control. The sections were then incubated with secondary antibody for 25 min at 37°C and stained with diaminobenzidine and haematoxylin. Three fields (×40) were randomly selected as described previously21 from each immunohistochemically CD31-staining slice, and the number of microvessels in each field was counted. The mean values were calculated by Image-Pro Plus analysis software.
Immunohistochemistry
The tissue was dehydrated, cleared, and embedded before sectioning. The sections were then incubated overnight at 4°C, and immunohistochemistry was carried out as previously described22 with primary antibodies including rabbit anti-SPHK1 (1:400, cat # 10670-1-AP, Proteintech, China) and rabbit anti-S1PR1 (1:150, cat # 55133-1-AP, Proteintech, China). After washing with PBS twice, the sections were incubated at room temperature for 2 h with secondary antibodies. Visualization was performed with a DAB-substrate chromogen system. Brown staining in the cytoplasm was considered to indicate expression of the SPHK1/S1PR1 protein. Five fields were taken for each sample, and the mean optical density (IOD/area) values were analysed by the Image-Pro Plus 6.0 (Media Cybernetics, Inc., Rockville, MD, USA) image analysis system.
Statistical Analysis
All the data are expressed as the mean (95% confidence interval (CI) of the mean) or median (interquartile range, IQR). Independent-sample t-tests were performed to assess the differences between groups, and Mann‒Whitney U-tests were performed to assess differences for variables with a nonnormal distribution. The correlations between the MVD and MTT and between the MVD and S1PR1 expression levels were determined by calculating Pearson’s linear correlation coefficients. Spearman’s rank correlation analysis was employed to assess the associations between CEUS parameters (including TTP, PI, and AUC) and MVD and between the MVD and SPHK1 expression levels. For all tests used, p < 0.05 indicated statistical significance. Statistical analysis was performed using SPSS 23.0 software (USA), and the data were plotted using GraphPad Prism (USA).
Results
Modelling and Sampling
Compared with those in the control group, the rats in the MTrP group exhibited brushing and licking behaviours in the inner thigh area and a slightly yellow colour to their hair and were more easily irritated or attacked when grasping. The muscles and fascia of the vastus medialis muscle of the thighs of the rats were dark red and pale and were arranged in a disorderly manner with obvious adhesion, and obvious muscle tension belts or contractional nodules could be palpated. During sampling, the muscle and fascia of the inner thigh of the control rats were smooth, continuous, and bright red or light red, and the muscle tension belts could not be palpated.
EMG Results
Electromyographic signals were obtained from the rats after modelling. The results showed that the control rats mainly exhibited repeated, low-amplitude endplate noise. In addition to the increased frequency of endplate spikes, there was more abnormal SEA, such as fibrillation potentials, in the MTrP group (Figure 1).
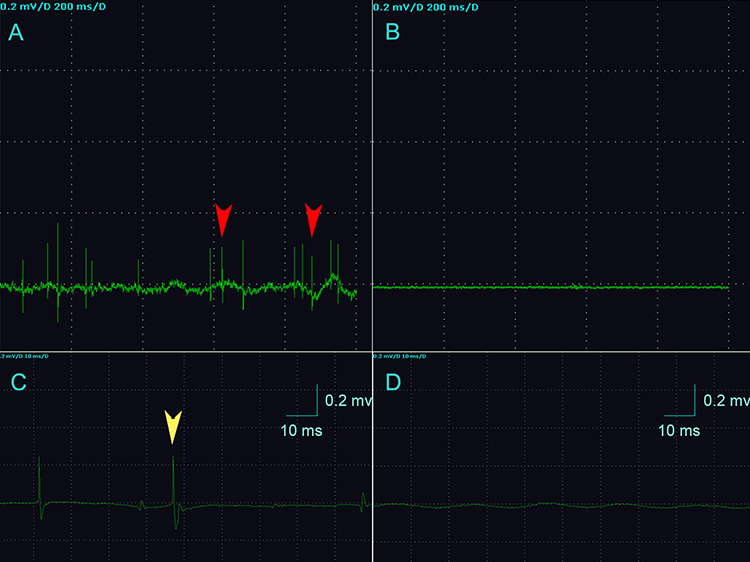 |
Figure 1 Electromyographic recordings of the two groups. (A) The MTrP group rats show abnormal SEA during EMG (red arrows). (B) The EMG waveform of rats in the control group was approximately a straight line. (C) The yellow arrow indicates the fibrillation potential as and represents the initial positive and negative biphasic waves. (D) The control group shows normal spontaneous potentials (endplate noise). (A and B) The sensitivity of the EMG device is 0.2 mv/grid, and the scanning speed is 200 ms/grid. (C and D) The sensitivity of the EMG device is 0.2 mv/grid, and the scanning speed is 10 ms/grid. n=15 rats in the MTrP group and n=10 rats in the control group. |
CEUS Results
Of the 15 rats in the MTrP group, only 5 had clear trigger points on two-dimensional ultrasound (2D-US); these rats exhibited greater ultrasound elasticity and richer blood flow in the modelling area or adjacent area than did the control group. The modelling area with the maximum ultrasound elasticity was basically consistent with the area of abnormal SEA found by EMG. We performed CEUS on the modelling area and adjacent areas of the rats with unclear trigger points on 2D-US. The TICs of different vascular structures and different microcirculation perfusion states showed different enhancement patterns within the lesions. In the MTrP group, perfusion of contrast agent was first observed at the femoral neck, after which it quickly perfused into the trigger point area and the surrounding area. The contrast agent concentration gradually decreased after the peak value was reached. In general, the TIC curve of the control group showed a slow upwards trend followed by a slow downwards trend. The perfusion intensity at the trigger point and the surrounding tissue area in the MTrP group increased (trigger point PI 30.91±4.29 versus normal site PI 21.01±2.27; p <0.0001). The distribution of microbubbles was uneven, and the TIC curve increased rapidly, followed by a gradual decrease. This imaging pattern suggested that neovascularization gradually increases during the development of myofascial trigger points, as indicated by a change in blood flow with the rich blood supply. For the MTrP group, the TTP, AUC and MTT were 42.02±5.73, 2871.52±498.37 and 134.61±16.11, respectively, which were greater than those of the control group (30.05±6.06, 1655.93±203.89 and 108.81±17.90, respectively). GOF, AS, DS and AT did not significantly differ between the groups (p > 0.05) (Figure 2).
 |
Figure 2 CEUS results. (A) The trigger point area as indicated is traced. (B and C) CEUS procedure and presentation of the raw data. The rose-red lines mark the area of the trigger point, the yellow lines mark the tissue surrounding the trigger point, and the blue lines mark the adjacent normal control tissue. (D–K) Comparisons of CEUS parameters between the MTrP group and the control group. ***Compared to the MTrP group, p <0.001; ****p <0.0001; ns, p >0.05. The data were analysed by the two-sided Mann‒Whitney U-test, and the results are shown as the median (IQR). The data were analysed by the independent-sample t-test, and the results are shown as the mean (95% CI of the mean); repetitions=3 (that is, the calculation was repeated three times). |
Differences in Pathological Morphology and Ultrastructures Between the Control Group and the MTrP Group
Microscopic views of H&E-stained muscle fibres from the two groups (400×) were produced. In the MTrP group, multiple enlarged and round muscle cells of different sizes were observed on cross-section and oblique section, and relatively small round or oval muscle cells were mostly found around the enlarged muscle cells. There were different degrees of inflammatory cell infiltration and nuclear migration, and the nucleus was moved to the inner or central region of the cells. In longitudinal sections, the muscle fibres were of different thicknesses and arranged in a disorderly manner. There were large adhesion areas at the contracture nodules, accompanied by a large amount of inflammatory cell infiltration. In the control group, the muscle cells were mostly regular polygons that were uniform in size and were arranged neatly and regularly on the cross- and oblique sections. Multiple nuclei could be observed at the edge of each cell. In longitudinal sections, the muscle fibres are arranged closely and regularly and are uniform in thickness, and the nuclei are mostly distributed under the sarcolemma (Figure 3A–F).
 |
Figure 3 H&E and TEM results. (A–C) In the MTrP group, longitudinal sections show a contracture nodule with lymphocyte aggregation (red arrows), and the cross-sectional view shows nuclear fragmentation (grey arrow) and neovascularization (green arrow). Oblique sections show that the muscle cells are differently sized, the intermuscular space is widened, and the muscle cells are disorganized. (D–F) In the control group, the muscle fibres are orderly arranged and uniformly sized. (G–I) In the MTrP group, the sarcomeres are compressed and tortuous (yellow arrow), the muscle fibres are broken, the sarcomeres are shortened (black arrow), and vacuolar degeneration of the mitochondria is observed in the lesion area (white arrow). (J–L) In the control group, the sarcomeres are uniform in length, and the mitochondrial morphology and structure are normal. |
Transmission electron microscopy (TEM) images of muscle fibres from the two groups (2500×, 7000×, and 15,000×) were also generated. In the MTrP group, the sarcomeres were shortened, and the Z-lines were distorted and broken. The mitochondria near the Z-line were deformed, the double-membrane structure was blurred, and the cytoplasm was oedematous. In the control group, the sarcomeres were uniform in length, the Z-lines were clear and continuous, the mitochondrial morphology and structure between the myofibrils near the Z-lines were normal, and the bilayer membrane structure could be clearly observed (Figure 3G–L).
MVD Detection
As shown in Figure 4, the MVD was greater in the MTrP group (117.33±16.74) than in the control group (83.20 ±13.61), as observed under ×40 optical magnification. In addition, compared with those in the control group, the blood vessels in the MTrP group were disorganized, twisted, and accompanied by new capillary branches.
 |
Figure 4 Immunohistochemistry results. (A and B) The cytoplasm of vascular endothelial cells in the vastus medialis muscles of the rats was stained brownish-yellow with an antibody against the CD31 protein. The contraction nodules in the MTrP group contained more brown, positive particles (black arrows) compared with those in the control group. (C and D) The SPHK1 expression in the MTrP group were greater than those in the control group (black arrows). (E and F) The S1PR1 expression in the MTrP group were greater than those in the control group (black arrows). (G–I) Showing MVD, SPHK1 and S1PR1 expression levels between groups. *Compared to the MTrP group, p < 0.05; ***p < 0.001; ****p < 0.0001. The data were analysed by the independent-sample t-test, except for SPHK1, for which the two-sided Mann‒Whitney U-test was used; repetitions=3. |
Comparison of SPHK1 and S1PR1 Expression Between the Control Group and the MTrP Group
SPHK1 and S1PR1 in the tissue were stained yellow‒brown. The mean optical densities of SPHK1 and S1PR1 in the MTrP group (0.186±0.012 and 0.232±0.022, respectively) were greater than those in the control group (0.168 ± 0.005 and 0.213±0.015, respectively) (p <0.05) (Figure 4).
Pearson’s Correlation Analysis of the MVD with the CEUS Perfusion Parameters and S1PR1 Expression Level in the MTrP Group
In the MTrP group, linear correlation analyses were performed between the MVD and MTT and between the MVD and S1PR1 expression level. The correlation coefficient between the MVD and S1PR1 expression level was 0.716, while no significant correlation was observed between the MVD and MTT (p >0.05; Table 1).
 |
Table 1 Pearson’s Correlation Analysis of the MVD with the CEUS Perfusion Parameters and S1PR1 Expression Level in the MTrP Group |
Spearman Correlation Analysis of the MVD with the CEUS Perfusion Parameters and SPHK1 Expression Level in the MTrP Group
Spearman correlation analysis yielded Spearman’s ρ values between the MVD and PI, between the MVD and AUC, and between the MVD and SPHK1 of > 0.5 (p < 0.05), > 0.7 (p < 0.01), and > 0.7 (p < 0.01), respectively. A significant correlation between the MVD and TTP was not observed (p > 0.05; Table 2).
 |
Table 2 Spearman Correlation Analysis of the MVD with the CEUS Perfusion Parameters and SPHK1 Expression Level in the MTrP Group |
Discussion
The series of symptoms caused by MTrPs is commonly referred to as myofascial pain syndrome (MPS). Despite the high prevalence of this condition,23,24 the pathophysiological mechanism underlying the formation of MTrPs remains unclear. We agree with Shah and Gilliams, who concluded that “the pathophysiology is only beginning to be understood due to its enormous complexity”,25 and thus there is a need to continue attempting to truly advance the understanding of the pathophysiology underlying MTrP formation.
In the present study, H&E staining revealed neovascularization around the MTrPs in most rats, and the microvessel density was greater in the MTrP group than in the control group. This finding is consistent with the previous findings of Sikdar on MTrPs. Sikdar performed colour Doppler and dual Doppler examinations of the upper trapezius muscle and showed obvious blood vessels in 27 of 33 sites containing MTrPs; further colour Doppler flow imaging (CDFI) showed that large blood vessels directly passed through a trigger point.26 Increased levels of proinflammatory mediators and other neuropeptides near active (A-)MTrPs have been shown to correlate with vasodilatational and angiogenic effects, and an increase in the volume of A-MTrP vascular compartments has been found via computational modelling.27,28 In this study, the PI and AUC in the MTrP group were greater than those in the control group (p <0.001). According to the perfusion characteristics of CEUS, we hypothesized that self-repair of the injured area occurred and that many new capillaries appeared around the lesion area, providing nutrients for the injured muscle cells. Therefore, microcirculation perfusion was more common in the MTrP tissue than in the normal control tissue. The reason for this perfusion feature may also be that ischaemia and hypoxia resulting from muscle injury lead to reactive hyperaemia and vasodilatation in the arteries supplying the lesion area, which eventually leads to an increase in the peak intensity of perfusion in the MTrP area. In addition, the production of large amounts of granulation tissue during the repair of inflammatory injury can also lead to enhanced perfusion. Interestingly, the lesion TTP was 42.02±5.73 s, which was longer than that of the normal tissue (30.05±6.06 s; p <0.001) (Figure 2). We hypothesized that despite an increase in MTrP neovascularization, the new vessels were immature, demonstrating thin tube walls and poor elasticity, so the MTrP and surrounding tissue maintained a slow blood flow velocity (longer TTP). Interestingly, we also found that the tissue surrounding the MTrPs seemingly exhibited greater basal and peak intensities than did the lesion area. According to this CEUS imaging pattern, we suspected that the blood supply around the lesion may be more abundant. Similarly, in 1990, Bruckle observed hyperperfusion outside and hypoperfusion (relatively) within the MTrP.29 In the present study, the PI and AUC were positively correlated with the MVD of the MTrP tissue, indicating that these parameters indirectly indicate changes in the internal microvascular system and reflect neovascularization at the MTrP. Collectively, the above findings show that MTrPs are angiogenesis-dependent chronic muscle inflammatory lesions and that microangiogenesis within MTrPs can be indirectly inferred via quantitative CEUS parameter analysis. In the Liang et al study, the CEUS results revealed statistically significant differences in the PI, MTT, and AUC between the focal area and adjacent areas of the MTrP, indicating that the blood supply to the MTrP was greater than that to the adjacent area.30 The current study complements the above studies. In this study, we not only specifically discussed the differences between the CEUS pattern of MTrPs and that of normal muscle tissue but also explored the biomarkers involved in angiogenesis in MTrPs.
SPHK can regulate vascular relaxation, contraction, regeneration and repair through multiple signalling pathways, such as the VEGF, RAS/ERK and SPK1/SIP-SIRT1 pathways, to avoid stress injury to vascular endothelial cells and maintain the normal physiological function of blood vessels.31–33 The increase in the expression of SPHK1/S1PR1 in the MTrP group suggested that SPHK1/S1P plays an important role in the angiogenesis and repair of MTrPs, the mechanism of which may be related to the regulation of angiogenesis. Experimental studies have confirmed that the overexpression of SPHK can significantly increase vascular richness around tumours in mice.34 The SPHK/S1P signalling pathway can promote liver fibrosis-related angiogenesis.35 The SPHK/S1P signalling pathway can promote the development of breast cancer by stimulating angiogenesis and lymphangiogenesis.36 In this study, Pearson’s and Spearman correlation analyses revealed positive correlations between the MVD and SPHK1 and between the MVD and S1PR1. These results indicated that SPHK1/S1P promote angiogenesis in MTrP tissue and increase the MVD in the MTrP area. Studies have shown that S1P can promote cell proliferation, increase the number of adhesion molecules and augment TGF-β expression by binding to receptors in vivo.37,38 Our previous study39 confirmed that the TGFβ1-Smad pathway is involved in fibrosis in MTrPs. Recent studies have shown that S1P is also a cofactor in the physiological regulation of the tumour necrosis factor (TNF) receptor-associated factor 2 (TRAF2) E3 ubiquitin ligase complex. S1P can regulate the TNF-α and NF-κB signalling pathways through TRAF2, thereby participating in a series of inflammatory responses.40 The inflammatory response and injury repair coexist, and the development of MTrPs is accompanied by a high expression of inflammatory factors.41,42 The unknown role of SPHK1/S1P, however, in the occurrence and development of MTrPs will continue to be explored.
In this study, a new approach was adopted to perform saphenous vein catheterization for CEUS examination over traditional contrast agent injection through the tail vein. We found that the effect of tail vein injection was suboptimal, which may be closely related to the lack of blood supply to the muscle.
Conclusion
The formation of MTrPs can be considered a chronic muscle inflammatory disease that is dependent on angiogenesis. Studies have shown that when the body experiences ischaemic or vascular injury, SPHK1/S1PR1 can prevent stress injury to vascular endothelial cells by inducing angiogenesis, regulating vascular contraction, and improving the stress tolerance of vascular endothelial cells, maintaining the integrity of blood vessels. CEUS can quantitatively and indirectly predict angiogenesis in MTrPs. In the future, the complex mechanism of MTrP formation will be verified by relevant experiments. Seq-RNA transcriptomics of the MTrP group and control group will be performed to explore whether SPHK1/S1P is significantly differentially expressed between the groups and to determine the degree of enrichment in important pathways.
Funding
This research received no specific grant from any funding agency in the public, commercial, or not-for-profit sectors.
Disclosure
The authors report no conflicts of interest in this work.
References
1. Simons DG. Review of enigmatic MTrPs as a common cause of enigmatic musculoskeletal pain and dysfunction. J Electromyogr Kinesiol. 2004;14(1):95–107. doi:10.1016/j.jelekin.2003.09.018
2. Qazi Y, Maddula S, Ambati BK. Mediators of ocular angiogenesis. J Genetics. 2009;88(4):495–515. doi:10.1007/s12041-009-0068-0
3. McClung JM, McCord TJ, Keum S, et al. Skeletal muscle-specific genetic determinants contribute to the differential strain-dependent effects of hindlimb ischemia in mice. Am J Pathol. 2012;180(5):2156–2169. doi:10.1016/j.ajpath.2012.01.032
4. Prior BM, Yang HT, Terjung RL. What makes vessels grow with exercise training? J Appl Physiol. 2004;97(3):1119–1128. doi:10.1152/japplphysiol.00035.2004
5. Grosman-Rimon L, Parkinson W, Upadhye S, et al. Circulating biomarkers in acute myofascial pain: a case-control study. Medicine. 2016;95(37):e4650. doi:10.1097/MD.0000000000004650
6. Jiang F, Yu S, Su H, Zhu S. Assessment of the effects of ischaemia/ hypoxia on angiogenesis in rat myofascial trigger points using colour Doppler flow imaging. PeerJ. 2020;8:e10481. doi:10.7717/peerj.10481
7. Gairhe S, Joshi SR, Bastola MM, et al. Sphingosine-1-phosphate is involved in the occlusive arteriopathy of pulmonary arterial hypertension. Pulm Circ. 2016;6(3):369–380. doi:10.1086/687766
8. Schneider G. S1P Signaling in the Tumor Microenvironment. Adv Exp Med Biol. 2020;1223:129–153.
9. Lee SO, Kim JS, Lee MS, Lee HJ. Anti-cancer effect of pristimerin by inhibition of HIF-1α involves the SPHK-1 pathway in hypoxic prostate cancer cells. BMC Cancer. 2016;16(1):701. doi:10.1186/s12885-016-2730-2
10. Kunkel GT, Maceyka M, Milstien S, Spiegel S. Targeting the sphingosine-1-phosphate axis in cancer, inflammation and beyond. Nat Rev Drug Discov. 2013;12(9):688–702. doi:10.1038/nrd4099
11. Patmanathan SN, Wang W, Yap LF, Herr DR, Paterson IC. Mechanisms of sphingosine 1-phosphate receptor signalling in cancer. Cell Signalling. 2017;34:66–75. doi:10.1016/j.cellsig.2017.03.002
12. Motyl J, Strosznajder JB. Sphingosine kinase 1/sphingosine-1-phosphate receptors dependent signalling in neurodegenerative diseases. The promising target for neuroprotection in Parkinson’s disease. Pharmacol Rep. 2018;70(5):1010–1014. doi:10.1016/j.pharep.2018.05.002
13. Dai L, Liu Y, Xie L, Wu X, Qiu L, Di W. Sphingosine kinase 1/sphingosine-1-phosphate (S1P)/S1P receptor axis is involved in ovarian cancer angiogenesis. Oncotarget. 2017;8(43):74947–74961. doi:10.18632/oncotarget.20471
14. Wang Y, Wu H, Deng R, et al. Geniposide downregulates the VEGF/SphK1/S1P pathway and alleviates angiogenesis in rheumatoid arthritis in vivo and in vitro. Phytother Res. 2021;35(8):4347–4362. doi:10.1002/ptr.7130
15. Mannam VK, Lewis RE, Cruse JM. The fate of renal allografts hinges on responses of the microvascular endothelium. Exp Mol Pathol. 2013;94(2):398–411. doi:10.1016/j.yexmp.2012.06.002
16. Huang CC, Tseng TT, Liu SC, et al. S1P increases VEGF production in osteoblasts and facilitates endothelial progenitor cell angiogenesis by inhibiting miR-16-5p expression via the c-Src/FAK signaling pathway in rheumatoid arthritis. Cells. 2021;10(8):2168.
17. Huang QM, Ye G, Zhao ZY, Lv JJ, Tang L. Myoelectrical activity and muscle morphology in a rat model of myofascial trigger points induced by blunt trauma to the vastus medialis. Acupuncture Med. 2013;31(1):65–73. doi:10.1136/acupmed-2012-010129
18. Liu QG, Liu L, Huang QM, Nguyen TT, Ma YT, Zhao JM. Decreased spontaneous electrical activity and acetylcholine at myofascial trigger spots after dry needling treatment: a Pilot Study. Evid Based Complement Alternat Med. 2017;2017:3938191. doi:10.1155/2017/3938191
19. Chen YY, Wu XS, Tian YY, Zhao P, Sun SW, Yang CB. Evaluation of femoral head perfusion by contrast-enhanced ultrasound in a rabbit model of steroid-induced osteonecrosis. J Ultrasound Med. 2020;39(5):987–995. doi:10.1002/jum.15184
20. Broskey NT, Daraspe J, Humbel BM, Amati F. Skeletal muscle mitochondrial and lipid droplet content assessed with standardized grid sizes for stereology. J Appl Physiol. 2013;115(5):765–770. doi:10.1152/japplphysiol.00063.2013
21. Chen F, Gong YX, Xiao JJ, Jiang NH, Chen LM, Sui L. Construction and evaluation of intrauterine adhesion model in rats by different methods of mechanical injury. Arch Gynecol Obstetrics. 2023;308(1):281–290. doi:10.1007/s00404-023-06926-9
22. Wang Y, Wu H, Gui BJ, et al. Geniposide alleviates VEGF-induced angiogenesis by inhibiting VEGFR2/PKC/ERK1/2-mediated SphK1 translocation. Phytomedicine. 2022;100:154068. doi:10.1016/j.phymed.2022.154068
23. Gerwin RD. Classification, epidemiology, and natural history of myofascial pain syndrome. Curr Pain Headache Rep. 2001;5(5):412–420. doi:10.1007/s11916-001-0052-8
24. Fishbain DA, Goldberg M, Meagher RB, Steele R, Rosomoff H. Male and female chronic pain patients categorized by DSM-III psychiatric diagnostic criteria. Pain. 1986;26(2):181–197. doi:10.1016/0304-3959(86)90074-6
25. Shah JP, Gilliams EA. Uncovering the biochemical milieu of myofascial trigger points using in vivo microdialysis: an application of muscle pain concepts to myofascial pain syndrome. J Bodywork Move Therap. 2008;12(4):371–384. doi:10.1016/j.jbmt.2008.06.006
26. Sikdar S, Shah JP, Gebreab T, et al. Novel applications of ultrasound technology to visualize and characterize myofascial trigger points and surrounding soft tissue. Arch Phys Med Rehabil. 2009;90(11):1829–1838. doi:10.1016/j.apmr.2009.04.015
27. Shah JP, Danoff JV, Desai MJ, et al. Biochemicals associated with pain and inflammation are elevated in sites near to and remote from active myofascial trigger points. Arch Phys Med Rehabil. 2008;89(1):16–23. doi:10.1016/j.apmr.2007.10.018
28. Sikdar S, Ortiz R, Gebreab T, Gerber LH, Shah JP Understanding the vascular environment of myofascial trigger points using ultrasonic imaging and computational modeling.
29. Brückle W, Suckfüll M, Fleckenstein W, Weiss C, Müller W. Gewebe-pO2-Messung in der verspannten Rückenmuskulatur (m. erector spinae) [Tissue pO2 measurement in taut back musculature (m. erector spinae)]. Zeitschrift fur Rheumatologie. 1990;49(4):208–216. German.
30. Liang XN, Guo RJ, Li S. New application of multimodal ultrasound imaging for identification of myofascial trigger points in the trapezius muscle. Ann Palliat Med. 2021;10(9):9784–9791. doi:10.21037/apm-21-2103
31. Lee H, Lee JK, Park MH, et al. Pathological roles of the VEGF/SphK pathway in Niemann-Pick type C neurons. Nat Commun. 2014;5:5514. doi:10.1038/ncomms6514
32. Usatyuk PV, He D, Bindokas V, et al. Photolysis of caged sphingosine-1-phosphate induces barrier enhancement and intracellular activation of lung endothelial cell signaling pathways. Am J Physiol Lung Cell Mol Physiol. 2011;300(6):L840–L850. doi:10.1152/ajplung.00404.2010
33. Grbčić P, Tomljanović I, Klobučar M, Kraljević Pavelić S, Lučin K, Sedić M. Dual sphingosine kinase inhibitor SKI-II enhances sensitivity to 5-fluorouracil in hepatocellular carcinoma cells via suppression of osteopontin and FAK/IGF-1R signalling. Biochem Biophys Res Commun. 2017;487(4):782–788. doi:10.1016/j.bbrc.2017.04.100
34. Bazzazi H, Popel AS. Computational investigation of sphingosine kinase 1 (SphK1) and calcium dependent ERK1/2 activation downstream of VEGFR2 in endothelial cells. PLOS Comput Biol. 2017;13(2):e1005332. doi:10.1371/journal.pcbi.1005332
35. Yang L, Yue S, Yang L, et al. Sphingosine kinase/sphingosine 1-phosphate (S1P)/S1P receptor axis is involved in liver fibrosis-associated angiogenesis. J Hepatol. 2013;59(1):114–123. doi:10.1016/j.jhep.2013.02.021
36. Nagahashi M, Kim EY, Yamada A, et al. Spns2, a transporter of phosphorylated sphingoid bases, regulates their blood and lymph levels, and the lymphatic network. FASEB J. 2013;27(3):1001–1011. doi:10.1096/fj.12-219618
37. Wang J, Feng W, Li F, et al. SphK1/S1P mediates TGF-β1-induced proliferation of pulmonary artery smooth muscle cells and its potential mechanisms. Pulm Circ. 2019;9(1):2045894018816977. doi:10.1177/2045894018816977
38. Liu X, Hong Q, Wang Z, Yu Y, Zou X, Xu L. Transforming growth factor-β-sphingosine kinase 1/S1P signaling upregulates microRNA-21 to promote fibrosis in renal tubular epithelial cells. Exp Biol Med. 2016;241(3):265–272. doi:10.1177/1535370215605586
39. Fang X, Yin Y, Lun H, Su S, Zhu S. Assessment of the effects of transforming growth factor beta1 (TGF-β1)-Smad2/3 on fibrosis in rat myofascial trigger points using point shear wave elastography. PeerJ. 2023;11:e16588.
40. Blanchard O, Stepanovska B, Starck M, et al. Downregulation of the S1P Transporter Spinster Homology Protein 2 (Spns2) exerts an anti-fibrotic and anti-inflammatory effect in human renal proximal tubular epithelial cells. Int J Mol Sci. 2018;19(5). doi:10.3390/ijms19051498
41. Shakouri SK, Dolatkhah N, Omidbakhsh S, Pishgahi A, Hashemian M. Serum inflammatory and oxidative stress biomarkers levels are associated with pain intensity, pressure pain threshold and quality of life in myofascial pain syndrome. BMC Res Notes. 2020;13(1):510. doi:10.1186/s13104-020-05352-3
42. Yu S, Su H, Lu J, Zhao F, Jiang F. Combined T2 mapping and diffusion tensor imaging: a sensitive tool to assess myofascial trigger points in a rat model. J Pain Res. 2021;14:1721–1731. doi:10.2147/JPR.S313966
 © 2024 The Author(s). This work is published and licensed by Dove Medical Press Limited. The full terms of this license are available at https://www.dovepress.com/terms.php and incorporate the Creative Commons Attribution - Non Commercial (unported, v3.0) License.
By accessing the work you hereby accept the Terms. Non-commercial uses of the work are permitted without any further permission from Dove Medical Press Limited, provided the work is properly attributed. For permission for commercial use of this work, please see paragraphs 4.2 and 5 of our Terms.
© 2024 The Author(s). This work is published and licensed by Dove Medical Press Limited. The full terms of this license are available at https://www.dovepress.com/terms.php and incorporate the Creative Commons Attribution - Non Commercial (unported, v3.0) License.
By accessing the work you hereby accept the Terms. Non-commercial uses of the work are permitted without any further permission from Dove Medical Press Limited, provided the work is properly attributed. For permission for commercial use of this work, please see paragraphs 4.2 and 5 of our Terms.