Back to Journals » Journal of Inflammation Research » Volume 15
Assessing the Global Impact on the Mouse Kidney After Traumatic Brain Injury: A Transcriptomic Study
Authors Chan WH ![]() , Hsu YJ, Cheng CP, Chou KN, Chen CL, Huang SM
, Hsu YJ, Cheng CP, Chou KN, Chen CL, Huang SM ![]() , Kan WC, Chiu YL
, Kan WC, Chiu YL ![]()
Received 26 May 2022
Accepted for publication 19 August 2022
Published 24 August 2022 Volume 2022:15 Pages 4833—4851
DOI https://doi.org/10.2147/JIR.S375088
Checked for plagiarism Yes
Review by Single anonymous peer review
Peer reviewer comments 2
Editor who approved publication: Professor Ning Quan
Wei-Hung Chan,1,2 Yu-Juei Hsu,3 Chiao-Pei Cheng,1 Kuan-Nien Chou,2,4 Chin-Li Chen,5 Shih-Ming Huang,6 Wei-Chih Kan,7,8,* Yi-Lin Chiu6,*
1Department of Anesthesiology, Tri-Service General Hospital, National Defense Medical Center, Taipei City, Taiwan, Republic of China; 2Graduate Institute of Medical Sciences, National Defense Medical Center, Taipei City, Taiwan, Republic of China; 3Division of Nephrology, Department of Medicine, Tri-Service General Hospital, National Defense Medical Center, Taipei City, Taiwan, Republic of China; 4Department of Neurosurgery, Tri-Service General Hospital, National Defense Medical Center, Taipei City, Taiwan, Republic of China; 5Division of Urology, Department of Surgery, Tri-Service General Hospital, National Defense Medical Center, Taipei City, Taiwan, Republic of China; 6Department of Biochemistry, National Defense Medical Center, Taipei City, Taiwan, Republic of China; 7Department of Nephrology, Department of Internal Medicine, Chi-Mei Medical Center, Tainan City, Taiwan, Republic of China; 8Department of Biological Science and Technology, Chung Hwa University of Medical Technology, Tainan City, Taiwan, Republic of China
*These authors contributed equally to this work
Correspondence: Yi-Lin Chiu, Department of Biochemistry, National Defense Medical Center, Rm. 7323, 7F, No. 161, Sec. 6, Minquan E. Road, Neihu Dist, Taipei City, 114201, Taiwan, Republic of China, Tel +886 02 87923100#18828, Fax +886 02 87910776, Email [email protected]
Purpose: In this study, we use animal models combined with bioinformatics strategies to investigate the potential changes in overall renal transcriptional expression after traumatic brain injury.
Methods: Microarray analysis was performed after kidney acquisition using unilateral controlled cortical impact as the primary mouse TBI model. Multi-oriented gene set enrichment analysis was performed for differentially expressed genes.
Results: The results showed that TBI affected the gene set associated with mitochondria function in kidney cells, and a negative enrichment of gene sets associated with immune cell migration and epidermal development was also observed. Analysis of the disease phenotype gene set revealed that differential expression of mitochondria-related genes was associated with lactate metabolism. Alternatively, activation and adhesion of immune cells associated with the complement system may promote autoinflammation in kidney tissue. The simulated immune cell infiltration analysis showed an increase in the proportion of activated memory CD4 T cells and a decrease in the proportion of resting memory CD4 T cells, suggesting that activated memory CD4 T cell infiltration may be involved in the inflammation of renal tissue and cause damage to renal cells, such as principal cells, mesangial cells and loops of Henle cells.
Conclusion: This study is the first to reveal the effects of brain trauma on the kidney. TBI may affect the expression of mitochondria function-related gene sets in renal cells by increasing lactate. It may also affect renal mesangial cells by inducing increased infiltration of immune cells through mechanisms related to complement system activation or autoimmune antibodies.
Keywords: traumatic brain injury, nephropathy, complement system, lactate metabolism, immune cell infiltration
Introduction
Traumatic brain injury (TBI) is an acquired brain injury caused by direct damage to the brain from external mechanical forces and is one of the most common causes of death and disability in healthy adults, resulting in significant medical financial costs to individuals and society.1,2 TBI not only has acute and chronic neurological consequences but also leads to non-neurological complications.3 Traditionally, the study of extracranial organ dysfunction after severe TBI has been based on individual organ systems. However, many studies have shown that multisystem organ dysfunction after TBI is common and may have similar mechanisms and pathophysiological features to single organ system dysfunction.
In particular, acute kidney injury (AKI) is thought to be potentially associated with TBI, and the concomitant occurrence of AKI is thought to be associated with causing unfavorable outcomes in TBI patients.3–7 Studies have previously found that the incidence of AKI after TBI is approximately 10–20%.5–8 Although elevated serum creatinine and decreased urine output are criteria for the diagnosis of AKI in TBI, patients who do not meet these criteria may be at risk of developing subclinical AKI due to acute tubular injury or other possible mechanisms.3 In addition to using RIFLE, AKIN and KDIGO criteria for AKI diagnosis, biomarkers such as neutrophil gelatinase-associated lipocalin (NGAL), cystatin C, and serum lactate have been evaluated as screening tools for predicting AKI in critically ill patients including those with TBI.9–11 Different mRNA expression profiles may also facilitate to identify potential biomarkers associated with AKI with specific causes.12–14 However, the mechanism of how TBI is associated with AKI still needs to be elucidated.
Trauma-related excess blood loss may result in glomerular hypoperfusion and subsequent kidney injury. However, in profound hypoperfusion situation such as out of hospital cardiac arrest (OHCA), the incidence of AKI is only about 8.7%.15 Besides, most the TBI patients are younger and have normal pre-existing renal function compared with OHCA patients.16 This implied that hypoperfusion is not the only risk factor of AKI after TBI. Several medications for TBI, including mannitol for intracranial pressure (ICP) control,17 non-steroidal for analgesia, and radiocontrast agent for diagnosis, may also contribute to AKI.
Intracranial inflammatory responses in the injured brain may be responsible for neurological sequelae and lead to systemic inflammatory responses that may result in multiple organ dysfunction syndrome (MODS) and death.18,19 Exploring the linkage of immune responses and elucidating cellular and molecular interactions and biochemical pathways is important for both potential diagnostic biomarkers and therapeutic strategies for AKI. In this study, we used an animal model combined with a bioinformatics analysis strategy to elucidate the potential changes in the kidney after suffering TBI.
Materials and Methods
Traumatic Brain Injury Animal Model
We used unilateral controlled cortical impact as the primary TBI model. The heads of adult C57BL/6 male mice (7 weeks old) were fixed in a stereotaxic frame. Mice were anesthetized with isoflurane (4% induction and 2% maintenance),20 topical anesthetic was applied to the surgical site to minimize discomfort. Mice were placed on a warming pad at 37°C to maintain temperature during surgery and monitored with a rectal probe. Toe pinch method was used to confirm the depth of anesthesia. After retraction of the scalp, a burr drill was used to perform a 4-mm diameter circular craniotomy on the right parietal temporal cortex.20 A 3.0 mm diameter impactor tip with a speed of 4 m/s, a dwell time of 100 ms, and a deformation depth of 1 mm were used at 2.5 mm posterior to fontanelle and 2.0 mm right of midline (TBI group, n = 5). The sham group (n = 4) underwent the same craniotomy but without cortical impact. Warm saline (0.1 mL/10 g) was administered after the TBI operation to rehydrate the animals and the warming pad was used to maintain their body temperature. Animals were weighed and evaluated for behavioral testing 24 hours after the surgery. Modified neurologic severity scoring (mNSS) was performed based on the study of Li et al21 and behavioral change was assessed by the contralateral swing method.22,23 All mice were sacrificed using euthanasia methods. The mice were anesthetized with 4% isoflurane in an induction chamber. After the confirmation of unconsciousness and respiratory cessation, exsanguination of the mice via cardiac puncture and perfused with PBS were performed. Urine sample was collected by bladder puncture simultaneously. The kidneys were initially minced and placed in 2-mL tissue homogenizing mix tubes containing 3 mm Zirconium Oxide beads and TRIzol reagent (ThermoFisher Scientific Inc., MA, USA). The samples were stored at −80°C in an ultra-low temperature freezer before further procedure. The tissue homogenizer (Lawson, Ningbo, China) was set at 55 Hz for 30 seconds and 2 cycles were performed to homogenize the kidney tissue fragments. All procedures were approved by the Laboratory Animal Center of National Defense Medical Center, where they have been granted a full accreditation from the Association for Assessment and Accreditation of Laboratory Animal Care International (AAALAC). Urine, blood, and kidney tissue collection were performed under approved protocols. Urine and blood cytokine concentrations (pg/mL) were quantified by the Cytometric Bead Array Flex Set system (BD Biosciences, San Jose, CA, USA).
Reverse Transcription-Polymerase Chain Reaction (RT-PCR)
Total RNA of the mouse kidney was isolated using the TRIZol reagent. The OneStep RT-PCR Kit (QIAGEN, CA, USA) was used for RT-PCR and reactions were run on a GeneAmp PCR system 9700 (Applied Biosystems, NJ, USA). The following primers were used for RT-PCR as shown in Table 1.
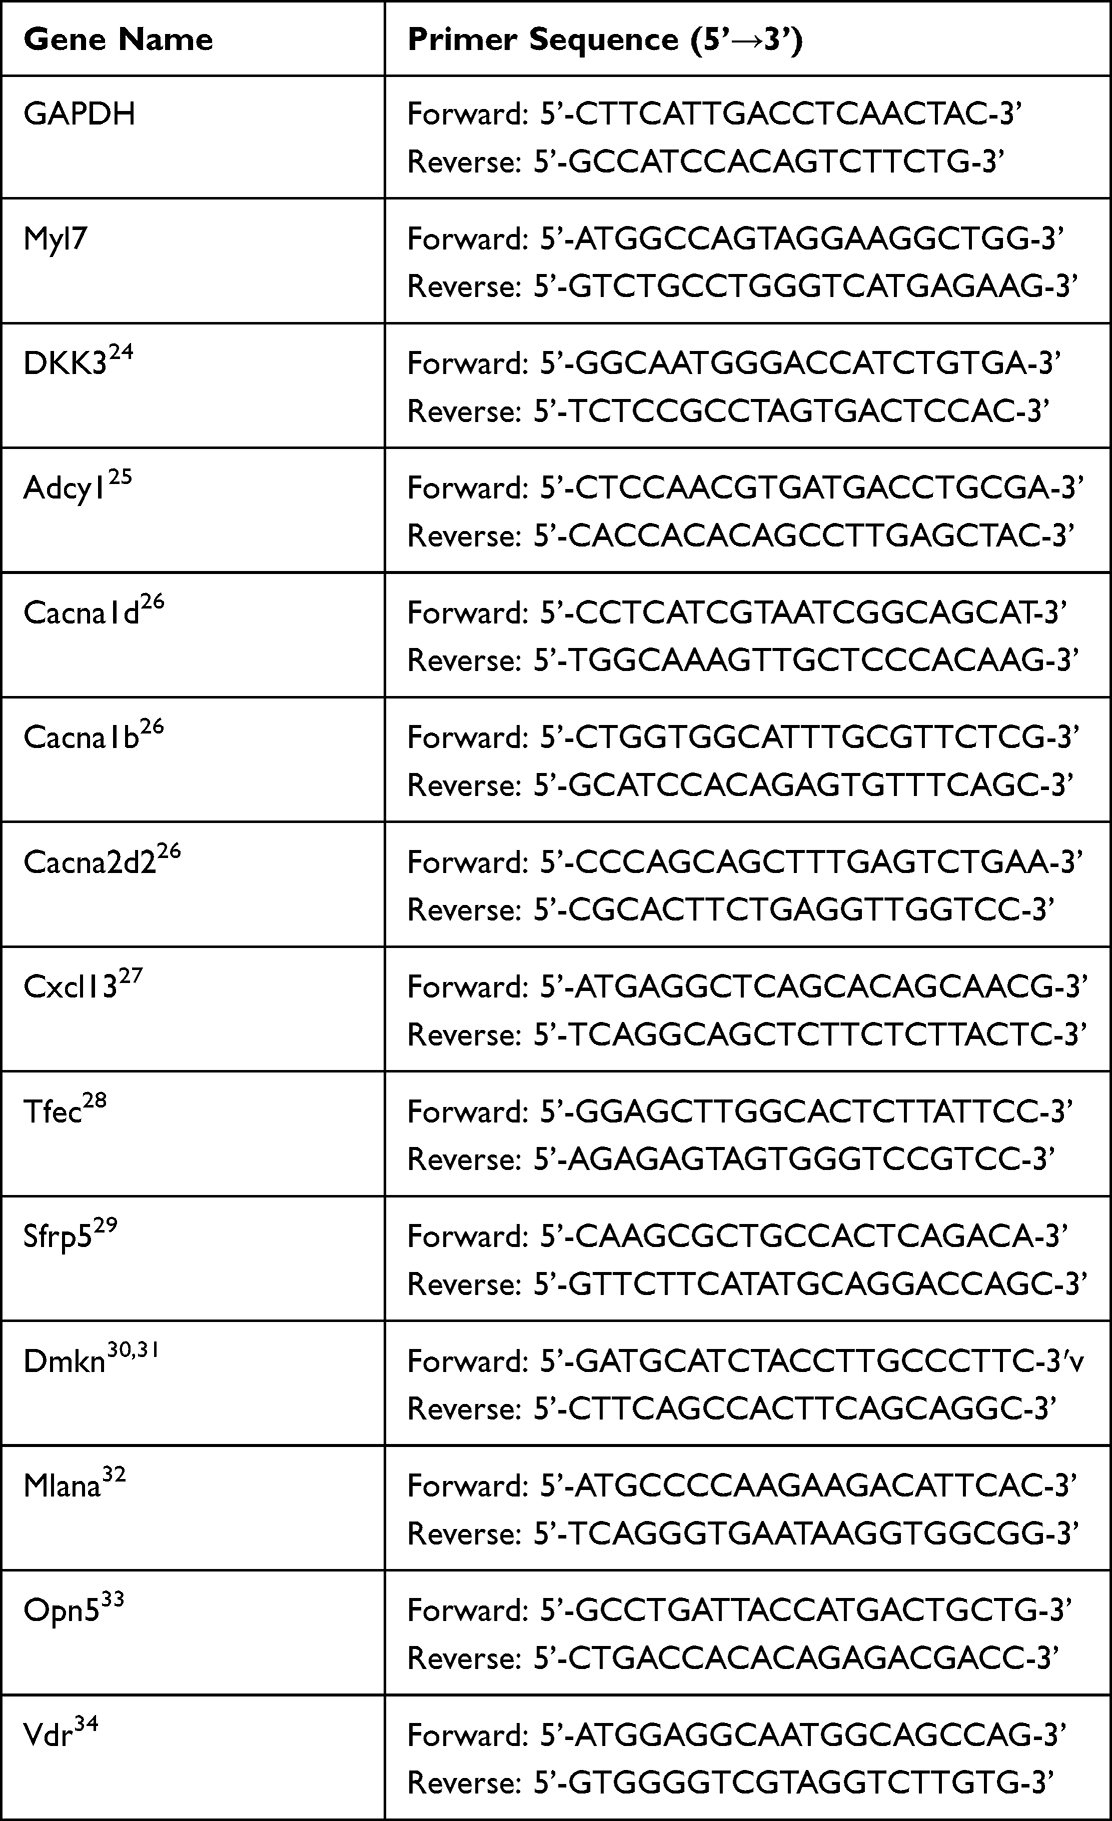 |
Table 1 Primers Used for RT-PCR |
mRNA Expression Profiling
Mouse kidney tissues were pre-treated and total RNA was extracted with TRIzol RNA isolation reagent according to the manufacturer’s instructions. Total RNA from various mouse kidney tissues were sent to Phalanx Biotech Group (Hsinchu, Taiwan) for gene expression profiling services by HOA OneArray method and HmiOA v5. The amount and purity of RNA was assessed by NanoDrop ND-1000 (ThermoFisher Scientific Inc., MA, USA). The passing criteria for absorbance ratio were determined as A260/A280 ≥ 1.8 and A260/A230 ≥ 1.5, indicating acceptable RNA purity. RNA integrity number (RIN) values were determined using the Agilent RNA 6000 Nano assay (Agilent Technologies, Waldbronn, Germany) to determine the integrity of the RNA. The passing standard for RIN values was determined to be ≥6, indicating acceptable RNA integrity. gDNA contamination was assessed using gel electrophoresis. Data analysis was processed by the Rosetta Resolver® system (Rosetta Biosoftware). The majority of various databases are built on human gene symbol-based gene-set only. In order to increase the interpretability of mouse samples for analysis and to evaluate the association with human diseases, we pre-converted mouse genes to homologous human gene symbols using the Collapse Dataset tool provided by GSEA software with “Mouse Gene Symbol Remapping Human Orthologs MSigDB.v7.5.chip”.35 Subsequent analyses were carried out using the homologous human gene symbol for comparison and analysis in each package in R (version 4.1.3).
GSE131179 Gene Expression Profiling
The GSE131179 database is provided by Verma et al in the National Center for Biotechnology Information Gene Expression Omnibus (NCBI GEO) Database and has published literatures discussing acute T-cell mediated rejection (ACR) of human kidney allografts.36,37 There are 34 samples in the GSE131179 database, including 16 ACR kidney samples and 18 Normal/Non-specific kidney samples. The raw data were downloaded and processed using GEOquery,38 and grouped with the authors’ annotations for subsequent analysis.
Differential Expression Analysis and Enrichment Analysis
Analyses were performed using RStudio version 2022.02.0 Build 443 and R version 4.1.3. Differentially expressed genes (DEGs) between each group were analyzed using the EdgeR (empirical analysis of digital gene expression in R) package.39 Please refer to Supplementary Table 1 for the detailed raw data comparing TBI kidney to sham group. We used the Benjamin-Hochberg procedure to adjust all enriched p-values to assess statistical significance. Genes were considered to be differentially expressed when they had a |fold change| ≥2 and a false discovery rate (FDR) <0.001. To fully represent the biological processes of renal tissue most affected by TBI, we performed multi-facet differential gene expression analyses and gene-set enrichment analyses.35 For the MAplot, we used the ggmaplot function of the ggpubr package for plotting. Genes were sorted by FDR and fold change values, and we labeled the top 50 genes with the smallest FDR on the plot. For g:profiler analysis, the list of up-regulated and down-regulated genes was entered into the g:profiler web page, and the datasets were checked for Gene Ontology Biological Processing (GOBP), Gene Ontology Molecular Function (GOMF), Gene Ontology Cellular Component (GOCC), Reactome pathway (REAC) and Human phenotype ontology (HP), and analyzed with the default options.40 The top 10 gene-sets in each dataset were filtered by FDR for up- and down-regulated DEGs, respectively. For over-representation analysis (ORA), DEG screening was performed with |fold change| ≥2 and false discovery rate (FDR) <0.001, then using the clusterProfiler R package cnetplot and heatplot functions to produce plots.41 For the Enrichment map, we used the Enrichment map app (version 3.3.4) from Cytoscape 3.9.1 for the plotting.42,43 The “c5.go.bp.v7.5.1.symbols.gmt” file was downloaded from MSigDB for GOBP enrichment analysis.35 Filter was set to “FDR cutoff < 0.05”, “Edge cutoff > 0.375”. We use AutoAnnotate 1.3.5 to annotate the clusters and delete the clusters with Node number less than 2. For SigCom LINCS analysis, we follow the instructions of the web tool to enter the list of up- and down-regulated genes and select the signature that provides 431 Datasets for scoring.44 The top 30 results were ranked by the sum of Z scores [Z score (up) + Z score (down)]. For enriched gene-set comparison, the compareCluster function in clusterProfiler was used and the enrichKEGG, enrichWP and enrichDO functions were employed to analyze the enrichment scores and p-values for each gene set.41 For GSEA and Ridge plot, we searched for kidney-specific single-cell biomarkers in PanglaoDB and made a gmt file (detailed gene list please referred to Supplementary Table 2),45 and used the gseaplot2 and ridgeplot functions in enrichplot package (v1.16.1) to plot the graphs, respectively.46 CIBERSORT-X was used to evaluate cell abundance and cell type-specific gene expression patterns from a large number of tissue transcriptomic profiles.47 We followed the web instructions to input microarray data for immune cell infiltration analysis.
Results
Execution and Verification of TBI Animal Models
In this study, we established an animal model of TBI with unilateral controlled cortical impact and performed behavioral pattern analysis 24 hours after the surgery, following which the animals were sacrificed and the kidneys were exteriorized for total RNA extraction. The differences in renal whole-gene transcription expression between the TBI and sham groups of mice were analyzed by microarray method, and the corresponding procedure is shown in Figure 1A. Twenty-four hours after the surgery, the mice in the TBI group showed significant weight loss (Figure 1B) and a substantial increase in mNSS (Figure 1C), as well as a significant increase in the percentage of contralateral swing (Figure 1D). When blood and urine were analyzed for inflammation-related cytokine concentrations, no significant differences were observed in blood. In urine, an increase in IFN-γ and TNF-α was observed (Figure 1E), although it was not significant due to the limitation of the amount of samples collected from animals. In addition, we extracted renal total RNA for RT-PCR and evaluated it against several genes identified in the literature as being associated with renal injury or function (Figure 1F). The results showed significant changes in the mRNA expression of DKK3, Tfec, and Vdr, three biomarkers associated with kidney injury.28,34,48 With these results, we confirmed that the execution of TBI caused significant physiological effects in mice kidney and resulted in a slight increase in inflammatory cytokines in the urine.
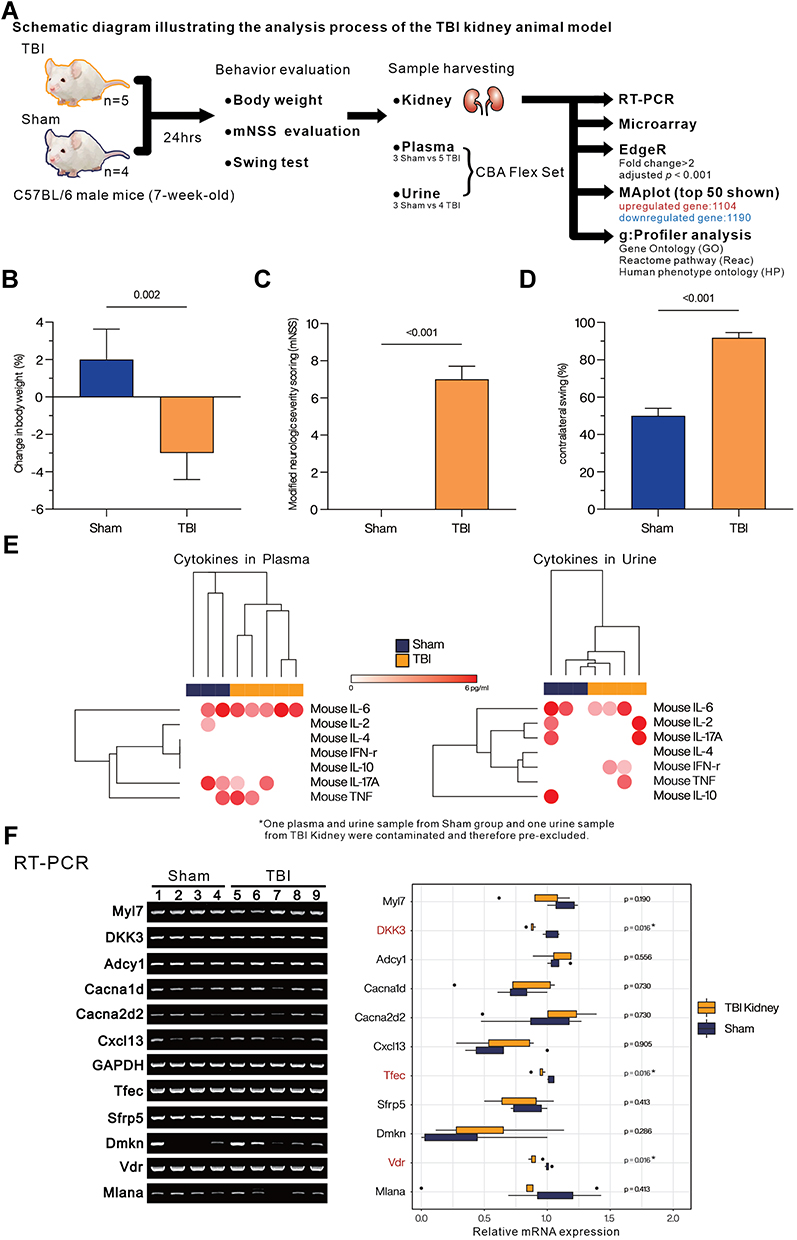 |
Figure 1 Assessment of the overall effect of TBI on mice. (A) The overall experimental design and analysis process. (B) Assessment of the degree of weight change (%). (C) Evaluation of modified neurological severity scoring (mNSS). (D) Comparison of contralateral swing (%). (E) The heatmap with hierarchical cluster analysis (Euclidean distance) presents the concentration (pg/mL) of IFN-γ, TNF-α, IL-2, IL-4, IL-6, IL-10, and IL-17A in plasma and urine from Sham or TBI group mice by cytomeric bead array (CBA). (F) Evaluating the expression of biomarkers related to kidney function and injury by RT-PCR. Boxplot represents the quantified mRNA expression level (by ImageJ v1.53s), of kidney related biomarkers. Student’s t-test was used to analyze the statistical significance of differences between groups, and p < 0.05 was considered a significant difference. *p < 0.05. |
Over-Representation Analysis Reveals That TBI Causes Abnormalities in the Acid-Base Homeostasis and Mitochondria Function in the Kidney of Mice
The microarray results were analyzed by EdgeR and the distribution of differentially expressed genes was presented by MA plot. Among them, 1104 genes were significantly up-regulated, and 1190 were significantly down-regulated with the following screening criteria: |Fold change| > 2, FDR < 0.001 (Figure 2A). In addition, the distribution of differentially expressed genes was presented in the heatmap with hierarchical clustering (Figure 2B). Up- and down-regulated differentially expressed genes were entered into g:profiler. Gene Ontology Biological processing (GOBP), Gene Ontology Molecular function (GOMF), Gene Ontology Cellular Component (GOCC), Reactome pathway (REAC), and Human Phenotype Ontology (HP) were used for Over-representation analysis (Figure 3). Among the down-regulated differentially expressed genes, gene sets in GOBP and GOMF were significantly enriched mainly in relation to cell migration ability. Similarly, GOCC showed that differentially expressed genes were predominantly located at the pericellular membrane, suggesting a slowed migration or infiltration of specific cells in the kidney. In REAC, the Interleukin-4 and Interleukin-13 signaling gene sets were significantly enriched, suggesting a potential change in the regulation of immune-related responses. Among the up-regulated differentially expressed genes, gene sets in GOBP and GOMF were enriched considerably in oxidative phosphorylation and mitochondria-related functions. GOCC showed that differentially expressed genes were mainly located in mitochondria. REAC also suggested an increased enrichment of respiratory electron transport-related gene sets. HP showed significant enrichment of several gene sets associated with kidney-related diseases, such as acidosis, abnormality of acid-base homeostasis, lactic acidosis and increased serum lactate, as well as gene sets associated with mitochondria abnormalities.
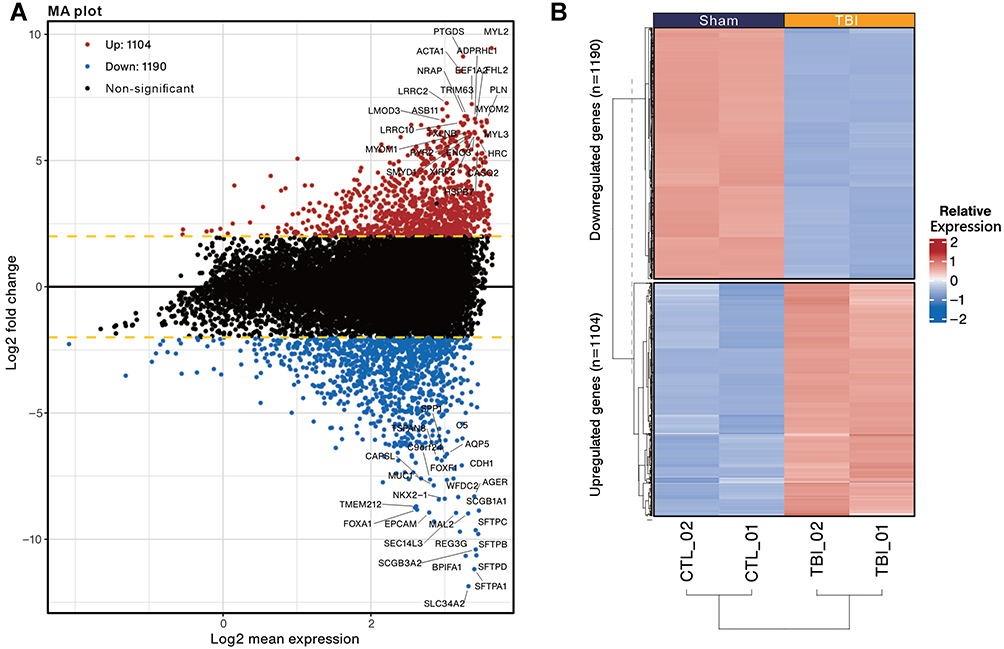 |
Figure 2 MA plot and Heatmap present the distribution of differentially expressed genes identified in the kidneys of TBI and Sham mice. (A) MA plot represents single gene responses, plotted as log2 mean expression (x-axis) and log2 fold change (y-axis), with the filtering criteria of fold change > 2 (FDR < 0.001), negative fold change representing down-regulated genes in TBI (Blue) and positive fold change representing up-regulated genes (Red). The top 50 genes with the smallest FDR are marked on the MAplot. (B) Differentially expressed genes are presented in the heatmap with hierarchical clustering (determined by Euclidean distance). Gene expression values are converted to Z-scores for visualization. |
 |
Figure 3 Functional enrichment analysis of up- and down-regulated differentially expressed genes between the kidney and Sham groups in TBI mice using g:Profiler. The analysis was performed in g:Profiler with the selection of GO:BP, GO:MF, GO:CC, Reactome (REAC) and Human Phenotype ontology (HP) databases and grouped by the color of the source database used, with the x-axis showing the negative decimal logarithmic scale values of adjusted p-value. Highlighted dots indicate the ratio of enrichment containing 10 to 80%. Highlighted dots indicate the percentage (%) of differentially expressed genes contained in individual gene sets. Gene-sets associated with kidney diseases in HP database were red-colored. |
We further performed the Complex Network Analysis (CNET plot) with the ClusterProfiler 4.0 to present the differentially expressed genes in HP gene sets associated with nephropathy. Figure 4A shows the top five HPO gene sets with the lowest P-value, namely, mitochondrial disease, creatine phosphokinase serum increased, increased CSF lactate, Acidosis, and Increased serum lactate. Figure 4B presents the expression of the genes contained in each gene set, showing an up-regulation trend for most of the genes (red). Figure 4C shows the overall distribution of gene sets and accessory genes. In addition, Heatplot showed the expression of five HPO gene sets and their accessory genes (Figure 4D), which showed a significant upregulation of gene families related to mitochondria function, including COQ family, NDUF family, and SLC25A family.49–51
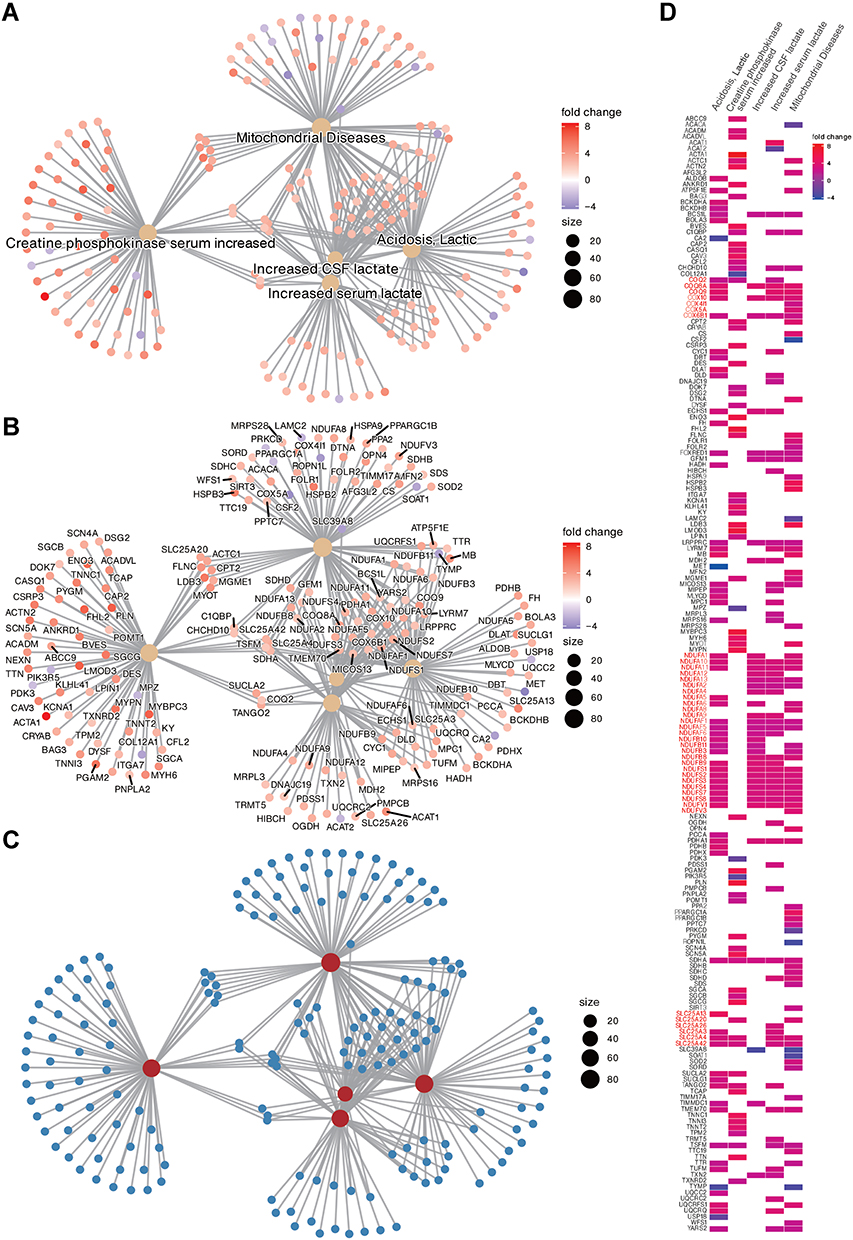 |
Figure 4 The top 5 Human phenotype ontology gene sets associated with differentially expressed genes are presented in ClusterProfiler Gene-Concept Network (CNET). The gene set names are presented in (A); the genes associated with each gene set are presented in (B); the overall distribution is presented in (C); and the co-expression of all genes associated with the top 5 gene sets is presented in Heat plot (D). Commonly enriched gene families are presented in red text. The fold change colour bar represents the degree of up-regulation (positive) or down-regulation (negative) of individual genes in the TBI. Size represents the number of genes contained in the gene-set. |
Enrichment Map Shows Negative Enrichment of Immune Cell Migration-Related Genes and Epithelial Morphogenesis Development
We used GSEA software combined with GOBP database to comprehensively analyze TBI kidney or Sham group enrichment gene sets and visualized the association and clustering of GOBP gene sets with Enrichment map in Cytoscape (FDR < 0.05) (Figure 5). The results showed negative enrichment with the largest cluster (274 nodes) with immune cell migration, followed by epithelial morphogenesis development (61 nodes). Potassium ion action (48 nodes) and mitochondrial respiratory chain (35 nodes) were both positively enriched, which is consistent with the results of ORA analysis.
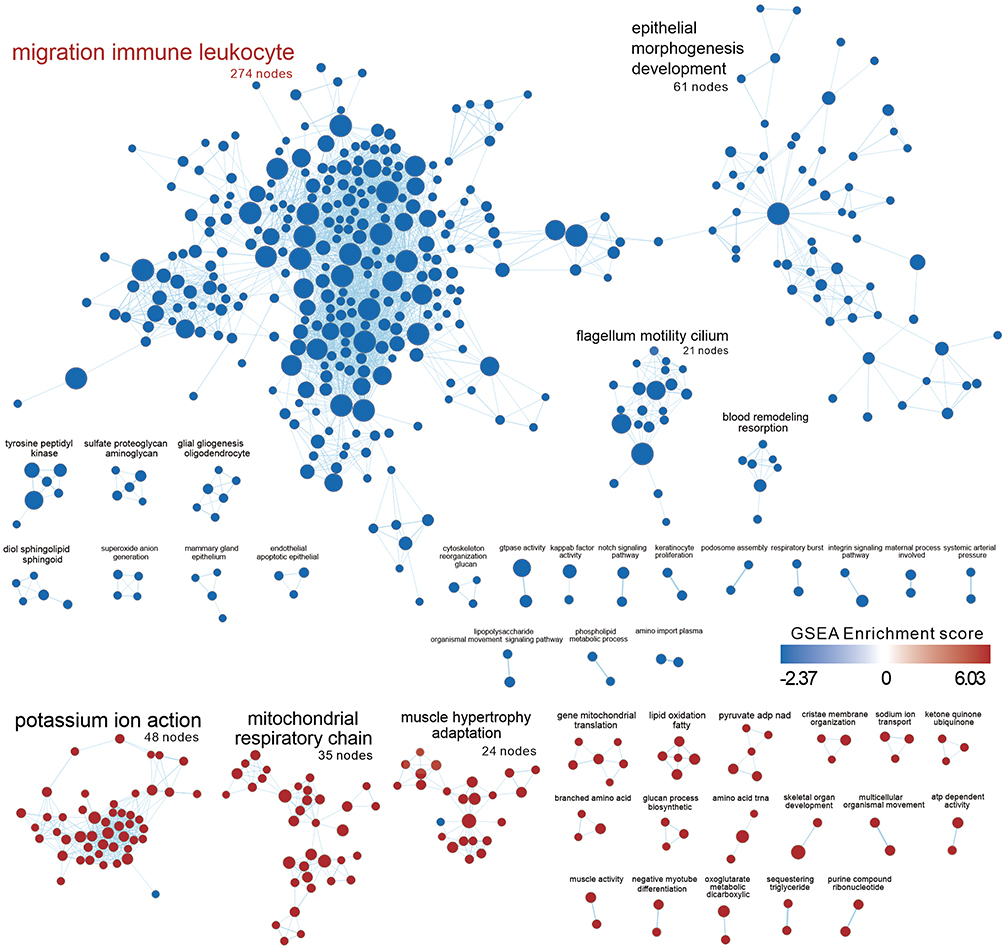 |
Figure 5 Enrichment map presents the distribution and enrichment of GOBP gene sets in TBI Kidney compared to Sham group. Each circle represents a gene set, and the size of the circle represents the number of genes contained in the gene-set. The color of the circle represents the GSEA score, red means the gene-set is positively enriched, blue means negative enrichment. The edges between nodes represent the similarity between gene-sets. Pre-screened clusters with more than 2 nodes are labeled with AutoAnnotate app v1.3 in Cytoscap 3.9.1, and the font size reflects the number of nodes contained in each cluster. Clusters are arranged according to the number of clustered nodes. The largest node in the figure were red-colored. |
TBI Causes Differential Expression of Genes in the Mouse Kidney Similar to the Acute T-Cell Mediated Rejection Response in the Human Transplanted Kidney
To understand the potential impact of TBI on the kidneys, we used SigComLINCS to compare the correlation of differentially expressed genes with other disease datasets (Figure 6). Among the top 30 significantly related databases, the GSE131179 database was the most relevant for kidney disease, presenting a set of differentially expressed genes for acute T-cell mediated rejection (ACR) in human transplanted kidneys, suggesting that TBI may be associated with damage caused by T-cell accumulation and may attack on kidney tissue.
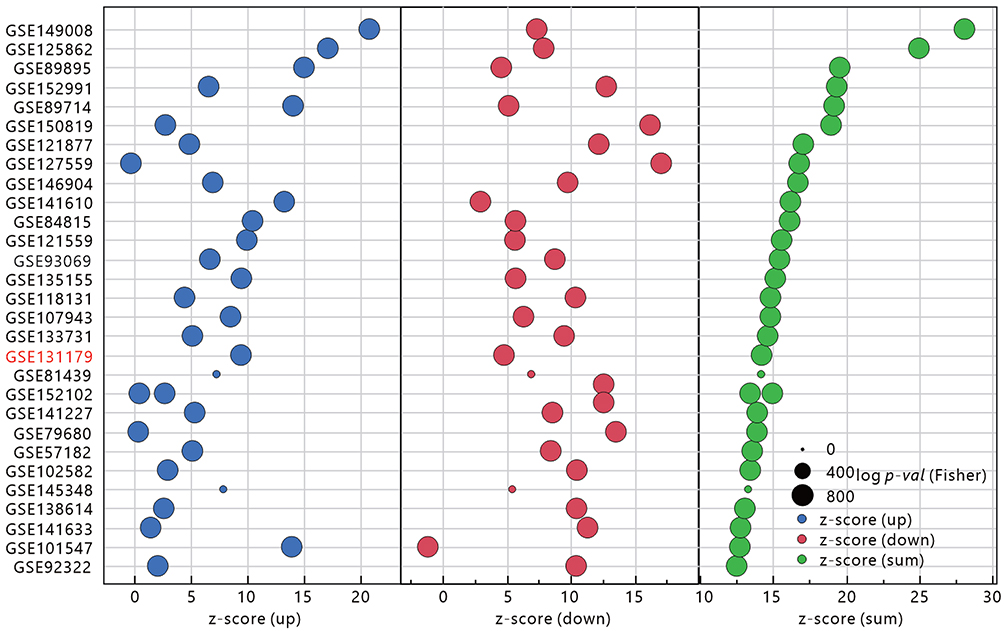 |
Figure 6 Similarity of comparing the up- and down-regulated gene sets in the TBI Kidney to other GEO databases as assessed by SigCom LINCS. The size of the points represents the negative decimal logarithmic scale values of adjusted p-value. Data sets are sorted by z-score (sum). Database associated with kidney diseases was marked as red text. |
To evaluate the similarities and differences between the two databases, we used the “compareCluster” function of ClusterProfiler to evaluate the commonly enriched gene sets in KEGG, WIKIPATH and Disease Ontology (Figure 7). Analysis of the KEGG database revealed the presence of significant Hematopoietic cell lineage in ACR kidneys, significant activation of inflammation-associated cytokine associated pathways, and enrichment of multiple immune rejection-associated gene sets. The predominant enrichment of multiple metabolic pathways in TBI kidneys, particularly mitochondria-related metabolism, is consistent with previous observations. Interestingly, the common denominator is the enrichment of hematopoietic cell lineage and cell adhesion molecules, suggesting the infiltration and adhesion of immune cells in the kidney tissue. The results of the WIKIPATH analysis showed that the ACR kidney was enriched for the activation of numerous immune cell-related signaling pathways, while the TBI kidney was still enriched for metabolic pathways. The commonality between the two immune-related gene sets is the complement system and genes associated with the development of rheumatoid arthritis, suggesting that the complement system may be involved in the infiltration of immune cells in the kidney tissue causing autoinflammation. Disease ontology analysis showed that the common denominator in a set of genes related to the urological system is the autoimmune disease of the urogenital tract, suggesting that TBI may cause the immune system to attack the autologous kidney cells and damage the kidney tissue.
 |
Figure 7 Comparison of the gene set commonality between TBI Kidney and ACR Kidney in GSE131179 using the CompareCluster function in Cluster profiler. The gene sets that are enriched by the two datasets are marked in red. The size of the dot represents the proportion of differential expressed genes in the gene set, and the color of the dot represents the adjusted p- value. |
Simulated Immune Cell Infiltration Analysis Showed That the Proportion of Activated CD4 Memory T Cells Was Significantly Increased in TBI Kidney or ACR
To compare the similarity of immune cell population infiltration in TBI Kidney and ACR Kidney, we analyzed the distribution of 22 immune cells in TBI Kidney or ACR Kidney using the CIBERSORT-x method (Figure 8). In ACR Kidney, the proportion of T cell CD4 memory resting was significantly decreased and the proportion of T cell CD4 memory activated was significantly increased compared to the control group. Similarly, in TBI Kidney, the proportion of T cell CD4 memory resting decreased significantly compared to mock, while the proportion of T cell CD4 memory activated increased significantly. The results of this analysis suggest that the increased infiltration of activated CD4 memory T cells in TBI kidneys may be related to the renal effects of TBI.
 |
Figure 8 Simulated infiltration ratio of 22 immune cells evaluated by CIBERSORT-X. The different immune cell types were ranked in descending order according to the infiltration ratio of ACR or TBI. The Highest Density Region (HDR) boxplot was used to present the main areas of infiltration distribution. T cell CD4 memory resting or activated infiltration is marked as red text. Student’s t-test was used to analyze the significance of the differences between ACR/Control or TBI/Sham. ***P < 0.001. |
GSEA Analysis Based on Multiple Renal Cell Gene Sets Showed That ACR Kidney and TBI Kidney Have Different Populations of Damaged Cells
Finally, to understand whether TBI affects specific cells in the kidney tissue, we performed simultaneous analysis using a set of nine kidney cell biomarker genes obtained from the PangLao single-cell database (Figure 9). The results showed that in TBI kidney, principal cells (FDR < 0.001) were most significantly affected, followed by Mesangial cells (FDR = 0.0362) and Loops of Henle cells (FDR = 0.0386). In ACR kidney, proximal tubule cells were most significantly affected (FDR < 0.001). The related GSEA score distribution is presented by Ridge plot.
 |
Figure 9 Distribution of 10 kidney cell biomarker gene sets in TBI/Sham or ACR/Normal presented by GSEA and Ridgeplot. GSEA presents the arrangement of each kidney-specific cell biomarker in TBI Kidney/Sham or ACR kidney/Control. False discovery rate (FDR, or q-value) less than 0.05 is marked in red. Ridge plots depict the overall distribution of genes in corresponding gene-set, with negative value representing decreased gene expression within TBI or ACR. |
Discussion
In this study, we evaluated the potential impact of TBI on mouse kidneys from a transcriptional perspective, basing on the classical TBI model. The results showed that TBI affected the gene set associated with mitochondria function in kidney cells, and a negative enrichment of gene sets associated with immune cell migration and epidermal development was also observed. Analysis of the disease phenotype gene set revealed that differential expression of mitochondria-related genes was associated with lactate metabolism. Alternatively, activation and adhesion of immune cells associated with the complement system may promote autoinflammation in kidney tissue. The simulated immune cell infiltration analysis showed an increase in the proportion of activated memory CD4 T cells and a decrease in the proportion of resting memory CD4 T cells, suggesting that activated memory CD4 T cell infiltration may be involved in the inflammation of renal tissue and cause damage to renal cells, such as principal cells, Mesangial cells and Loops of Henle cells.
Increased intracranial pressure (ICP) is common after TBI and may result in autonomic dysregulation, such as sympathetic hyperactivity.52,53 The increase in visceral sympathetic nervous system activity impairs glomerular perfusion and the sustained hypertension also leads to red cell fragmentation and thrombi formation in the glomeruli,16 which contribute to AKI. Disrupted hemodynamics after TBI impaired oxygen delivery and led to hypoxic renal tubules.53,54 It contributed to mitochondrial dysfunction and altered kidney metabolism with decreased fatty acid oxidation and increased lactic acid generation.54
Elevated extracellular lactate concentrations and lactate/pyruvate ratios are well recognized in patients with TBI.55 Current research suggests that the increase in lactate contributes to the astrocyte-neuron lactate shuttle hypothesis.56–58 High extracellular levels of lactic acid accumulate when the neurons are severely damaged and unable to use the lactic acid produced by astrocytes from glucose, which means a decoupling of neuronal and glial metabolism.58,59 Under normal physiological conditions, excess lactic acid is removed by the liver and a small portion is metabolized and reabsorbed by the kidneys. The increase in lactate caused by TBI may contribute to the mechanism of increased renal metabolism of lactate, which may account for the significant increase in mitochondria function-related genes we observed in renal tissues of TBI animal models.60
On the other hand, TBI promotes microglia activation and expression of various complement receptors, including C1q and C3 lysis products.61 As an important participant in secondary injuries, the complementary system may have an impact on other parts of the body.62 There is also growing experimental evidence that complement activation contributes to the pathogenesis of AKI.63–65 Complementary suppressive therapy may be an effective strategy to mitigate or prevent AKI and its complications.65 Activation of the complementary system will impact the renal filtration barrier, affecting the glomerular, tubular interstitial and/or vascular systems and causing renal injury.63,66 In particular, mesangial cell damage induced by activation of the complement system has been reported for many years.67,68 Mesangial cells are specialized kidney stromal cells that play an important role for the response to kidney injury and maintaining glomerular homeostasis.69 Mesangial cells and neighboring stromal cells also participate in developmental, immunity, inflammation,70 and regeneration processes. Previous studies showed that genetic defects in mesangial cells resulted in small kidneys as a consequence of impaired glomeruli formation.71,72 Mesangial cells might have phagocytic function to clear proteins that get lodged in the glomerular filter.73 Mesangial cells could function as sentinel cells, reacting quickly to innate immune stimuli or to tissue injury by modulating extracellular matrix (ECM) components and by producing chemokines to direct immune cell recruitment.69 The impairment of crosstalk between mesangial cells and the immune system may result in dysregulated immune response and glomerular diseases.74 Previous study showed that combined mesangial deposition of IgA and IgG aggravates renal inflammation in Wistar rats75 and is associated with more severe clinical features (more proteinuria and capillary wall IgA deposits) in patients with IgA nephropathy, which is the most common glomerulonephritis and is the principal cause of chronic kidney disease (CKD).76 Similarly, TBI may induce an increase in serum IgG,77 which filters and accumulates in the glomerulus,78 further causing an immune response of TH1 cells to glomerular tissue.79–82 It suggested that TBI-related kidney injury may share some common immune-related pathological pathways with IgA nephropathy, such as complement activation.75 Besides, immune complexes deposited in the kidney can alter the structure and function of resident renal cells and promote immune cell adhesion and increased infiltration.83 Among these, T cells are thought to play an important role in kidney damage.84,85 Mesangial cells may also be involved in the activation of CD4 TH1 cells to promote inflammation in kidney tissues.86 Correspondingly, the RT-PCR analysis of several immune-related genes in the kidney between the TBI and sham groups showed significant differences in Dickkopf-related protein 3 (DKK3), Tfec, and Vitamin D receptor (Vdr) (Figure 1F). DKK3 is a secreted glycoprotein which is associated with renal tubular atrophy48 and AKI.24 However, DDK3 may prevent idiopathic membranous nephropathy by affecting T cell polarization and decreasing IFNγ expression.48 Tfec is the mouse transcription factor EC, which can be induced upon stimulation with the Th2 cytokines, such as IL-4 and IL-13.87 IL-4 participates in an alternative pathway of macrophage activation that tunes inflammatory responses, scavenges debris and promotes tissue repair.88 The activation of Vdr is associated with the suppression of RAS activation, restoring mitochondrial function,89 the suppression of autoimmunity90 which is involved in the protection against renal injury in kidney diseases.34
Clinically, early elevated serum lactate levels in TBI patients are associated with AKI. Lactate is valuable for clinicians to assess the likelihood of AKI in patients with TBI.6 However, whether the lactate-related metabolic gene set was enriched directly due to TBI or due to damage to renal cells by TBI through complement system activation or IgG-mediated autoimmune response could not be determined in this study. It is certain that the significant enrichment of inflammation-related gene sets in the transcriptional expression profile of renal tissues after TBI caused by the autoimmune response may be related to the increased accumulation of antibodies or complements in glomerular filtration that promotes the attack of immune cells including TH1 cells. This phenomenon may explain the association of acute renal tubular injury with severe traumatic brain injury.91 Compared to human ACR kidneys, activated CD4 memory T cell infiltration was also observed in the kidneys after TBI.92 Nevertheless, in the analysis of kidney-specific cells, we observed that proximal tube cells were the most severely affected in ACR kidneys, echoing the histological observations.93 This suggests that although activated CD4 memory T cells are involved in renal injury, active rejection or passive deposition of antibodies and complement may be the cause of renal cell injury at different sites.94
Conclusion
In summary, this study reveals for the first time that brain trauma has direct impacts on the kidney, mainly through lactate metabolism-related mechanisms that impact the expression of mitochondria-associated gene sets in renal cells, and possibly through complement system activation or autoimmune antibody-related mechanisms that induce increased infiltration of immune cells into renal mesangial cells (Figure 10).
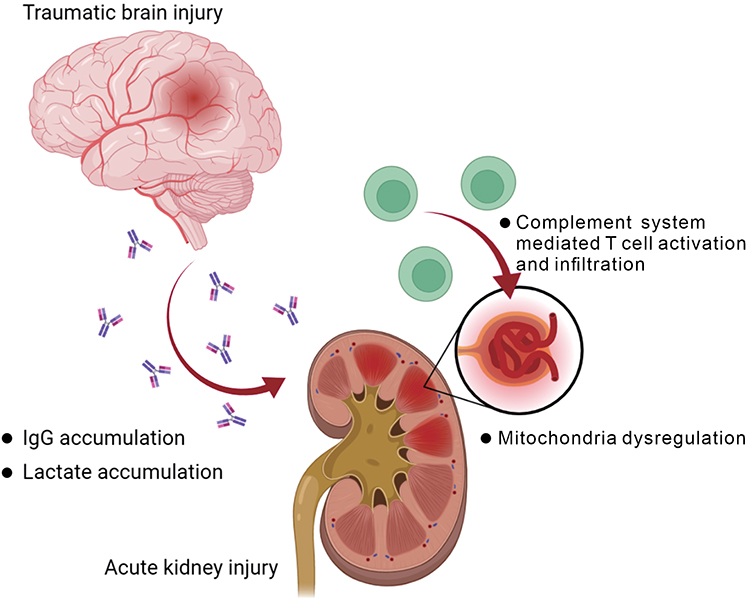 |
Figure 10 Summary of the postulated impact on kidney after traumatic brain injury. The graph was created with BioRender.com. |
Acknowledgments
This work was supported by grants from Chi-Mei Medical Center [CMNDMC11005 to Y.-L. Chiu and Wei-Chih Kan], Ministry of National Defense-Medical Affairs Bureau [MND-MAB-D-111071 to Y.-L. Chiu, MND-MAB-104-46 to Y.-J. Hsu], Tri-Service General Hospital [TSGH-D-111104 to W.-H. Chan, TSGH-E-110116 to C.-P. Cheng], and National Science and Technology Council, Taiwan (R.O.C.) [NSTC-111-2314-B-016 −019-MY3 to Y.-L. Chiu].
Disclosure
The authors report no conflicts of interest in this work.
References
1. Leibson CL, Brown AW, Hall Long K, et al. Medical care costs associated with traumatic brain injury over the full spectrum of disease: a controlled population-based study. J Neurotrauma. 2012;29(11):2038–2049. doi:10.1089/neu.2010.1713
2. Shi J, Xiang H, Wheeler K, et al. Costs, mortality likelihood and outcomes of hospitalized US children with traumatic brain injuries. Brain Inj. 2009;23(7):602–611. doi:10.1080/02699050903014907
3. Corral L, Javierre CF, Ventura JL, Marcos P, Herrero JI, Mañez R. Impact of non-neurological complications in severe traumatic brain injury outcome. Crit Care. 2012;16(2):R44. doi:10.1186/cc11243
4. Moore EM, Bellomo R, Nichol A, Harley N, Macisaac C, Cooper DJ. The incidence of acute kidney injury in patients with traumatic brain injury. Ren Fail. 2010;32(9):1060–1065. doi:10.3109/0886022X.2010.510234
5. Wang R, Zhang J, Xu J, He M, Xu J. Incidence and burden of acute kidney injury among traumatic brain-injury patients. Risk Manag Healthc Policy. 2021;14:4571–4580. doi:10.2147/RMHP.S335150
6. Wang R, Wang S, Zhang J, He M, Xu J. Serum lactate level in early stage is associated with acute kidney injury in traumatic brain injury patients. Front Surg. 2021;8:761166. doi:10.3389/fsurg.2021.761166
7. Robba C, Banzato E, Rebora P, et al. Acute kidney injury in traumatic brain injury patients: results from the collaborative European NeuroTrauma Effectiveness Research in Traumatic Brain Injury Study. Crit Care Med. 2021;49(1):112–126. doi:10.1097/ccm.0000000000004673
8. Li N, Zhao W-G, Zhang W-F. Acute Kidney Injury in Patients with Severe Traumatic Brain Injury: implementation of the Acute Kidney Injury Network Stage System. Neurocrit Care. 2011;14(3):377–381. doi:10.1007/s12028-011-9511-1
9. Luo X, Jiang L, Du B, et al. A comparison of different diagnostic criteria of acute kidney injury in critically ill patients. Critical Care. 2014;18(4):R144. doi:10.1186/cc13977
10. Teo SH, Endre ZH. Biomarkers in acute kidney injury (AKI). Best Pract Res Clin Anaesthesiol. 2017;31(3):331–344. doi:10.1016/j.bpa.2017.10.003
11. Wang R, Wang S, Zhang J, He M, Xu J. Serum lactate level in early stage is associated with acute kidney injury in traumatic brain injury patients. Frontiers in Surgery. 2022;8. doi:10.3389/fsurg.2021.761166
12. Bi H, Zhang M, Wang J, Long G. The mRNA landscape profiling reveals potential biomarkers associated with acute kidney injury AKI after kidney transplantation. PeerJ. 2020;8:e10441. doi:10.7717/peerj.10441
13. Lin Q, Li S, Jiang N, et al. Inhibiting NLRP3 inflammasome attenuates apoptosis in contrast-induced acute kidney injury through the upregulation of HIF1A and BNIP3-mediated mitophagy. Autophagy. 2021;17(10):2975–2990. doi:10.1080/15548627.2020.1848971
14. Tan C, Gu J, Li T, et al. Inhibition of aerobic glycolysis alleviates sepsis‑induced acute kidney injury by promoting lactate/Sirtuin 3/AMPK‑regulated autophagy. Int J Mol Med. 2021;47(3):Mar. doi:10.3892/ijmm.2021.4852
15. Yanta J, Guyette FX, Doshi AA, Callaway CW, Rittenberger JC. Renal dysfunction is common following resuscitation from out-of-hospital cardiac arrest. Resuscitation. 2013;84(10):1371–1374. doi:10.1016/j.resuscitation.2013.03.037
16. Nongnuch A, Panorchan K, Davenport A. Brain-kidney crosstalk. Crit Care. 2014;18(3):225. doi:10.1186/cc13907
17. Lin S-Y, Tang S-C, Tsai L-K, et al. Incidence and risk factors for acute kidney injury following mannitol infusion in patients with acute stroke: a Retrospective Cohort Study. Medicine. 2015;94(47):e2032–e2032. doi:10.1097/MD.0000000000002032
18. Schmidt OI, Heyde CE, Ertel W, Stahel PF. Closed head injury–an inflammatory disease? Brain Res Brain Res Rev. 2005;48(2):388–399. doi:10.1016/j.brainresrev.2004.12.028
19. Lu J, Goh SJ, Tng PY, Deng YY, Ling EA, Moochhala S. Systemic inflammatory response following acute traumatic brain injury. Front Biosci. 2009;14(10):3795–3813. doi:10.2741/3489
20. Chen Y, Mao H, Yang KH, Abel T, Meaney DF. A modified controlled cortical impact technique to model mild traumatic brain injury mechanics in mice. Front Neurol. 2014;5. doi:10.3389/fneur.2014.00100
21. Li Y, Chopp M, Chen J, et al. Intrastriatal transplantation of bone marrow nonhematopoietic cells improves functional recovery after stroke in adult mice. J Cereb Blood Flow Metab. 2000;20(9):1311–1319. doi:10.1097/00004647-200009000-00006
22. Borlongan CV, Sanberg PR. Elevated body swing test: a new behavioral parameter for rats with 6-hydroxydopamine-induced hemiparkinsonism. J Neurosci. 1995;15(7 Pt 2):5372–5378. doi:10.1523/jneurosci.15-07-05372.1995
23. Ingberg E, Gudjonsdottir J, Theodorsson E, Theodorsson A, Ström JO. Elevated body swing test after focal cerebral ischemia in rodents: methodological considerations. BMC Neurosci. 2015;16(1):50. doi:10.1186/s12868-015-0189-8
24. Zhu X, Li W, Li H. miR-214 ameliorates acute kidney injury via targeting DKK3 and activating of Wnt/β-catenin signaling pathway. Biol Res. 2018;51(1):31. doi:10.1186/s40659-018-0179-2
25. Xiao Z, He L, Takemoto M, et al. Glomerular podocytes express type 1 adenylate cyclase: inactivation results in susceptibility to proteinuria. Nephron Exp Nephrol. 2011;118(3):e39–48. doi:10.1159/000320382
26. Hayashi K, Wakino S, Sugano N, Ozawa Y, Homma K, Saruta T. Ca2+ channel subtypes and pharmacology in the kidney. Circ Res. 2007;100(3):342–353. doi:10.1161/01.RES.0000256155.31133.49
27. Zhou H, Lu H, Sun L, et al. Diagnostic biomarkers and immune infiltration in patients with T cell-mediated rejection after kidney transplantation. Front Immunol. 2021;12:774321. doi:10.3389/fimmu.2021.774321
28. Bruschi SA, Lindsay JG, Crabb JW. Mitochondrial stress protein recognition of inactivated dehydrogenases during mammalian cell death. Proc Natl Acad Sci U S A. 1998;95(23):13413–13418. doi:10.1073/pnas.95.23.13413
29. Deng D, Han X, Diao Z, Liu W. Secreted frizzled-related protein 5 ameliorates vascular calcification in a rat model of chronic kidney disease through the Wnt/beta-Catenin pathway. Kidney Blood Press Res. 2021;46(6):758–767. doi:10.1159/000517095
30. Teng L, Zhang Y, Ye L, et al. Donor-derived hypouricemia in irrelevant recipients caused by kidney transplantation. Ann Transl Med. 2020;8(6):330. doi:10.21037/atm.2020.02.140
31. Chen L, Chou CL, Knepper MA. A comprehensive map of mRNAs and Their Isoforms across All 14 renal tubule segments of mouse. J Am Soc Nephrol. 2021;32:897–912. doi:10.1681/ASN.2020101406
32. Jungbluth AA, Iversen K, Coplan K, et al. Expression of melanocyte-associated markers gp-100 and Melan-A/MART-1 in angiomyolipomas. An immunohistochemical and rt-PCR analysis. Virchows Arch. 1999;434(5):429–435. doi:10.1007/s004280050362
33. Lan Y, Zeng W, Dong X, Opsin LH. 5 is a key regulator of ultraviolet radiation-induced melanogenesis in human epidermal melanocytes. Br J Dermatol. 2021;185(2):391–404. doi:10.1111/bjd.19797
34. Yang S, Li A, Wang J, et al. Vitamin D receptor: a novel therapeutic target for kidney diseases. Curr Med Chem. 2018;25(27):3256–3271. doi:10.2174/0929867325666180214122352
35. Subramanian A, Tamayo P, Mootha VK, et al. Gene set enrichment analysis: a knowledge-based approach for interpreting genome-wide expression profiles. Proc Natl Acad Sci U S A. 2005;102(43):15545–15550. doi:10.1073/pnas.0506580102
36. Verma A, Muthukumar T, Yang H, et al. Urinary cell transcriptomics and acute rejection in human kidney allografts. JCI Insight. 2020;5(4). doi:10.1172/jci.insight.131552
37. Mueller FB, Yang H, Lubetzky M, et al. Landscape of innate immune system transcriptome and acute T cell-mediated rejection of human kidney allografts. JCI Insight. 2019;4(13). doi:10.1172/jci.insight.128014
38. Davis S, Meltzer PS. GEOquery: a bridge between the Gene Expression Omnibus (GEO) and BioConductor. Bioinformatics. 2007;23(14):1846–1847. doi:10.1093/bioinformatics/btm254
39. Robinson MD, McCarthy DJ, Smyth GK. edgeR: a Bioconductor package for differential expression analysis of digital gene expression data. Bioinformatics. 2010;26(1):139–140. doi:10.1093/bioinformatics/btp616
40. Reimand J, Kull M, Peterson H, Hansen J, Vilo J. g:Profiler–a web-based toolset for functional profiling of gene lists from large-scale experiments. Nucleic Acids Res. 2007;35:W193–200. doi:10.1093/nar/gkm226
41. Wu T, Hu E, Xu S, et al. clusterProfiler 4.0: a universal enrichment tool for interpreting omics data. Innovation. 2021;2(3):100141. doi:10.1016/j.xinn.2021.100141
42. Shannon P, Markiel A, Ozier O, et al. Cytoscape: a software environment for integrated models of biomolecular interaction networks. Genome Res. 2003;13(11):2498–2504. doi:10.1101/gr.1239303
43. Merico D, Isserlin R, Stueker O, Emili A, Bader GD. Enrichment map: a network-based method for gene-set enrichment visualization and interpretation. PLoS One. 2010;5(11):e13984. doi:10.1371/journal.pone.0013984
44. Evangelista JE, Clarke DJB, Xie Z, et al. SigCom LINCS: data and metadata search engine for a million gene expression signatures. Nucleic Acids Res. 2022;50:W697–W709. doi:10.1093/nar/gkac328
45. Franzen O, Gan LM, Bjorkegren JLM. PanglaoDB: a web server for exploration of mouse and human single-cell RNA sequencing data. Database (Oxford). 2019;2019. doi:10.1093/database/baz046
46. Wu T, E Hu, S Xu S, et al. clusterProfiler 4.0: A universal enrichment tool for interpreting omics data. The Innovation. 2021;2(3):100141. doi:10.1016/j.xinn.2021.100141
47. Steen CB, Liu CL, Alizadeh AA, Newman AM. Profiling Cell Type Abundance and Expression in Bulk Tissues with CIBERSORTx. Methods Mol Biol. 2020;2117:135–157. doi:10.1007/978-1-0716-0301-7_7
48. Fang X, Hu J, Chen Y, Shen W, Ke B. Dickkopf-3: current knowledge in kidney diseases. Front Physiol. 2020;11:533344. doi:10.3389/fphys.2020.533344
49. Alcazar-Fabra M, Navas P, Brea-Calvo G. Coenzyme Q biosynthesis and its role in the respiratory chain structure. Biochim Biophys Acta. 2016;1857(8):1073–1078. doi:10.1016/j.bbabio.2016.03.010
50. Fukui H, Moraes CT. The mitochondrial impairment, oxidative stress and neurodegeneration connection: reality or just an attractive hypothesis? Trends Neurosci. 2008;31(5):251–256. doi:10.1016/j.tins.2008.02.008
51. Ruprecht JJ, Kunji ERS. The SLC25 Mitochondrial Carrier Family: structure and Mechanism. Trends Biochem Sci. 2020;45(3):244–258. doi:10.1016/j.tibs.2019.11.001
52. Masuda T, Sato K, Yamamoto S, et al. Sympathetic nervous activity and myocardial damage immediately after subarachnoid hemorrhage in a unique animal model. Stroke. 2002;33(6):1671–1676. doi:10.1161/01.str.0000016327.74392.02
53. Khalid F, Yang GL, McGuire JL, et al. Autonomic dysfunction following traumatic brain injury: translational insights. Neurosurgical Focus FOC. 2019;47(5):E8. doi:10.3171/2019.8.Focus19517
54. Gewin LS. Sugar or Fat? Renal tubular metabolism reviewed in health and disease. Nutrients. 2021;13(5):1580. doi:10.3390/nu13051580
55. Carpenter KL, Jalloh I, Hutchinson PJ. Glycolysis and the significance of lactate in traumatic brain injury. Front Neurosci. 2015;9:112. doi:10.3389/fnins.2015.00112
56. Schurr A, Payne RS. Lactate, not pyruvate, is neuronal aerobic glycolysis end product: an in vitro electrophysiological study. Neuroscience. 2007;147(3):613–619. doi:10.1016/j.neuroscience.2007.05.002
57. Schurr A. Lactate: the ultimate cerebral oxidative energy substrate? J Cereb Blood Flow Metab. 2006;26(1):142–152. doi:10.1038/sj.jcbfm.9600174
58. Pellerin L, Pellegri G, Bittar PG, et al. Evidence supporting the existence of an activity-dependent astrocyte-neuron lactate shuttle. Dev Neurosci. 1998;20(4–5):291–299. doi:10.1159/000017324
59. Hashimoto T, Hussien R, Cho HS, Kaufer D, Brooks GA. Evidence for the mitochondrial lactate oxidation complex in rat neurons: demonstration of an essential component of brain lactate shuttles. PLoS One. 2008;3(8):e2915. doi:10.1371/journal.pone.0002915
60. Glancy B, Kane DA, Kavazis AN, Goodwin ML, Willis WT, Gladden LB. Mitochondrial lactate metabolism: history and implications for exercise and disease. J Physiol. 2021;599(3):863–888. doi:10.1113/JP278930
61. Fumagalli S, Perego C, Pischiutta F, Zanier ER, De Simoni MG. The ischemic environment drives microglia and macrophage function. Front Neurol. 2015;6:81. doi:10.3389/fneur.2015.00081
62. Qiao F, Atkinson C, Kindy MS, et al. The alternative and terminal pathways of complement mediate post-traumatic spinal cord inflammation and injury. Am J Pathol. 2010;177(6):3061–3070. doi:10.2353/ajpath.2010.100158
63. Thurman JM, Lucia MS, Ljubanovic D, Holers VM. Acute tubular necrosis is characterized by activation of the alternative pathway of complement. Kidney Int. 2005;67(2):524–530. doi:10.1111/j.1523-1755.2005.67109.x
64. Thurman JM, Ljubanovic D, Edelstein CL, Gilkeson GS, Holers VM. Lack of a functional alternative complement pathway ameliorates ischemic acute renal failure in mice. J Immunol. 2003;170(3):1517–1523. doi:10.4049/jimmunol.170.3.1517
65. McCullough JW, Renner B, Thurman JM. The role of the complement system in acute kidney injury. Semin Nephrol. 2013;33(6):543–556. doi:10.1016/j.semnephrol.2013.08.005
66. Ma R, Cui Z, Hu SY, et al. The alternative pathway of complement activation may be involved in the renal damage of human anti-glomerular basement membrane disease. PLoS One. 2014;9(3):e91250. doi:10.1371/journal.pone.0091250
67. Yamamoto T, Wilson CB. Complement dependence of antibody-induced mesangial cell injury in the rat. J Immunol. 1987;138(11):3758–3765.
68. Hansch GM. The role of complement in mesangial cell damage. Nephrol Dial Transplant. 1993;8(1):4–5. doi:10.1093/oxfordjournals.ndt.a092269
69. Avraham S, Korin B, Chung JJ, Oxburgh L, Shaw AS. The Mesangial cell - The glomerular stromal cell. Nat Rev Nephrol. 2021;17(12):855–864. doi:10.1038/s41581-021-00474-8
70. Nowarski R, Jackson R, Flavell RA. The stromal intervention: regulation of immunity and inflammation at the Epithelial-Mesenchymal Barrier. Cell. 2017;168(3):362–375. doi:10.1016/j.cell.2016.11.040
71. Grigorieva IV, Oszwald A, Grigorieva EF, et al. A novel role for GATA3 in mesangial cells in glomerular development and injury. J Am Soc Nephrol. 2019;30(9):1641–1658. doi:10.1681/asn.2018111143
72. Nelson T, Velazquez H, Troiano N, Fretz JA. Early B cell factor 1 (EBF1) regulates glomerular development by controlling mesangial maturation and consequently COX-2 expression. J Am Soc Nephrol. 2019;30(9):1559–1572. doi:10.1681/asn.2018070699
73. Baud L, Hagege J, Sraer J, Rondeau E, Perez J, Ardaillou R. Reactive oxygen production by cultured rat glomerular mesangial cells during phagocytosis is associated with stimulation of lipoxygenase activity. J Exp Med. 1983;158(6):1836–1852. doi:10.1084/jem.158.6.1836
74. Chung JJ, Goldstein L, Chen YJ, et al. Single-cell transcriptome profiling of the kidney glomerulus identifies key cell types and reactions to injury. J Am Soc Nephrol. 2020;31(10):2341–2354. doi:10.1681/asn.2020020220
75. van Dixhoorn MG, Sato T, Muizert Y, van Gijlswijk-Janssen DJ, De Heer E, Daha MR. Combined glomerular deposition of polymeric rat IgA and IgG aggravates renal inflammation. Kidney Int. 2000;58(1):90–99. doi:10.1046/j.1523-1755.2000.00144.x
76. Wada Y, Ogata H, Takeshige Y, et al. Clinical significance of IgG deposition in the glomerular mesangial area in patients with IgA nephropathy. Clin Exp Nephrol. 2013;17(1):73–82. doi:10.1007/s10157-012-0660-0
77. Zhang Z, Zoltewicz JS, Mondello S, et al. Human traumatic brain injury induces autoantibody response against glial fibrillary acidic protein and its breakdown products. PLoS One. 2014;9(3):e92698. doi:10.1371/journal.pone.0092698
78. Ehrenstein MR, Katz DR, Griffiths MH, et al. Human IgG anti-DNA antibodies deposit in kidneys and induce proteinuria in SCID mice. Kidney Int. 1995;48(3):705–711. doi:10.1038/ki.1995.341
79. Holdsworth SR, Kitching AR, Tipping PG. Th1 and Th2 T helper cell subsets affect patterns of injury and outcomes in glomerulonephritis. Kidney Int. 1999;55(4):1198–1216. doi:10.1046/j.1523-1755.1999.00369.x
80. Roberts JL, Wyatt RJ, Schwartz MM, Lewis EJ. Differential characteristics of immune-bound antibodies in diffuse proliferative and membranous forms of lupus glomerulonephritis. Clin Immunol Immunopathol. 1983;29(2):223–241. doi:10.1016/0090-1229(83)90026-0
81. Imai H, Hamai K, Komatsuda A, Ohtani H, Miura AB. IgG subclasses in patients with membranoproliferative glomerulonephritis, membranous nephropathy, and lupus nephritis. Kidney Int. 1997;51(1):270–276. doi:10.1038/ki.1997.32
82. Doi T, Mayumi M, Kanatsu K, Suehiro F, Hamashima Y. Distribution of IgG subclasses in membranous nephropathy. Clin Exp Immunol. 1984;58(1):57–62.
83. Suarez-Fueyo A, Bradley SJ, Klatzmann D, Tsokos GC. T cells and autoimmune kidney disease. Nat Rev Nephrol. 2017;13(6):329–343. doi:10.1038/nrneph.2017.34
84. Tipping PG, Kitching AR. Glomerulonephritis, Th1 and Th2: what’s new? Clin Exp Immunol. 2005;142(2):207–215. doi:10.1111/j.1365-2249.2005.02842.x
85. Rabb H, Daniels F, O’Donnell M, et al. Pathophysiological role of T lymphocytes in renal ischemia-reperfusion injury in mice. Am J Physiol Renal Physiol. 2000;279(3):F525–31. doi:10.1152/ajprenal.2000.279.3.F525
86. Yu H, Cui S, Mei Y, et al. Mesangial cells exhibit features of antigen-presenting cells and activate CD4+ T cell responses. J Immunol Res. 2019;2019:2121849. doi:10.1155/2019/2121849
87. Rehli M, Sulzbacher S, Pape S, et al. Transcription factor Tfec contributes to the IL-4-inducible expression of a small group of genes in mouse macrophages including the granulocyte colony-stimulating factor receptor. J Immunol Res. 2005;174(11):7111–7122. doi:10.4049/jimmunol.174.11.7111
88. Gordon S. Alternative activation of macrophages. Nat Rev Immunol. 2003;3(1):23–35. doi:10.1038/nri978
89. García IM, Altamirano L, Mazzei L, et al. Role of mitochondria in paricalcitol-mediated cytoprotection during obstructive nephropathy. Am J Physiol Renal Physiol. 2012;302(12):F1595–605. doi:10.1152/ajprenal.00617.2011
90. Dankers W, Colin EM, van Hamburg JP, Lubberts E. Vitamin D in autoimmunity: molecular mechanisms and therapeutic potential. Front Immunol. 2016;7:697. doi:10.3389/fimmu.2016.00697
91. Civiletti F, Assenzio B, Mazzeo AT, et al. Acute tubular injury is associated with severe traumatic brain injury: in vitro study on human tubular epithelial cells. Sci Rep. 2019;9(1):6090. doi:10.1038/s41598-019-42147-4
92. Salcido-Ochoa F, Hue SS, Peng S, et al. Histopathological analysis of infiltrating T cell subsets in acute T cell-mediated rejection in the kidney transplant. World J Transplant. 2017;7(4):222–234. doi:10.5500/wjt.v7.i4.222
93. Jeong HJ. Diagnosis of renal transplant rejection: Banff classification and beyond. Kidney Research and Clinical Practice. 2020;39(1):17–31. doi:10.23876/j.krcp.20.003
94. Davis S, Cooper JE. Acute antibody-mediated rejection in kidney transplant recipients. Transplant Rev. 2017;31(1):47–54. doi:10.1016/j.trre.2016.10.004
 © 2022 The Author(s). This work is published and licensed by Dove Medical Press Limited. The
full terms of this license are available at https://www.dovepress.com/terms
and incorporate the Creative Commons Attribution
- Non Commercial (unported, 3.0) License.
By accessing the work you hereby accept the Terms. Non-commercial uses of the work are permitted
without any further permission from Dove Medical Press Limited, provided the work is properly
attributed. For permission for commercial use of this work, please see paragraphs 4.2 and 5 of our Terms.
© 2022 The Author(s). This work is published and licensed by Dove Medical Press Limited. The
full terms of this license are available at https://www.dovepress.com/terms
and incorporate the Creative Commons Attribution
- Non Commercial (unported, 3.0) License.
By accessing the work you hereby accept the Terms. Non-commercial uses of the work are permitted
without any further permission from Dove Medical Press Limited, provided the work is properly
attributed. For permission for commercial use of this work, please see paragraphs 4.2 and 5 of our Terms.