Back to Journals » Eye and Brain » Volume 18
Assessing Retinal Thickness and Associations with Cognitive Function in Women with History of Preeclampsia
Authors Ibarra AJ ![]() , Phan BN, Silverstein SM
, Phan BN, Silverstein SM ![]() , Chhablani J, Snyder V, Rossi EA, Butters MA, Catov JM
, Chhablani J, Snyder V, Rossi EA, Butters MA, Catov JM
Received 7 June 2025
Accepted for publication 6 December 2025
Published 12 January 2026 Volume 2026:18 542082
DOI https://doi.org/10.2147/EB.S542082
Checked for plagiarism Yes
Review by Single anonymous peer review
Peer reviewer comments 2
Editor who approved publication: Professor C. Edward Dixon
Andrea J Ibarra,1 BaDoi N Phan,2 Steven M Silverstein,3 Jay Chhablani,4 Valerie Snyder,4 Ethan A Rossi,4 Meryl A Butters,5 Janet M Catov6– 8
1Department of Anesthesiology, Perioperative and Pain Medicine, Stanford University, Stanford, CA, USA; 2Medical Scientist Training Program, University of Pittsburgh, Pittsburgh, PA, USA; 3Departments of Psychiatry, Neuroscience, and Ophthalmology, University of Rochester Medical Center, Rochester, NY, USA; 4Department of Ophthalmology, University of Pittsburgh, Pittsburgh, PA, USA; 5Department of Psychiatry, University of Pittsburgh, Pittsburgh, PA, USA; 6Department of Obstetrics, Gynecology and Reproductive Sciences, University of Pittsburgh, Pittsburgh, PA, USA; 7Magee-Womens Research Institute, University of Pittsburgh, Pittsburgh, PA, USA; 8Department of Epidemiology, University of Pittsburgh, Pittsburgh, PA, USA
Correspondence: Andrea J Ibarra, Department of Anesthesiology, Perioperative and Pain Medicine, Stanford University, 300 Pasteur Drive, Room H3580 MC 5640, Stanford, CA, 94305, USA, Email [email protected]
Purpose: Women with preeclampsia are at risk of developing cognitive changes and dementia later in life. The retina – an extension of the brain – may provide insight about structural changes associated with preeclampsia and serve as a biomarker of long-term neural and vascular consequences. Our goal was to compare retinal thickness measurements between women with and without history of preeclampsia, and to determine associations with cognitive performance.
Patients and Methods: This prospective cohort study recruited preeclampsia (N=17) and normotensive (N=18) women 10– 15 years after delivery. We assessed retinal thickness using spectral-domain optical coherence tomography (SD-OCT). Principal component analysis was used to detect retinal regional patterns. Cognitive performance was evaluated to assess memory (Wechsler Memory immediate and delayed), working memory-Letter-Number Sequencing, information processing speed (Digit Symbol, Stroop Word and Color) and executive (WAIS similarities, matrix reasoning, and Stroop interference) domains. Regression models estimated associations between retina measurements, preeclampsia history and cognitive performance.
Results: Using the standard early treatment diabetic retinopathy study grid, compared to normotensive, preeclampsia women had thinner outer retina subfields. Similarly, two out of three principal components suggested different patterns of retinal changes at the outer vs central region. The thinner inner nasal and superior quadrants were associated with lower scores on the executive function domain – Stroop Color test (β=12.2, p= 0.032; β=12.9, p= 0.037, respectively). In the memory domain, Letter-Number sequencing test, preE history significantly altered the relationship with the maximum fovea central subfield (β=− 17.3, p= 0.013).
Conclusion: Our study provides a novel, integrated assessment of preeclampsia by simultaneously evaluating retina and cognitive markers. Retinal imaging 10– 15 years after delivery in women with a history of preeclampsia showed a decreased thickness in the outer region of the retina. Selective vulnerability of peripheral retinal regions to persistent microvascular changes after preeclampsia may reflect broader central nervous system changes associated with impairments in information processing speed, executive functioning and working memory.
Keywords: preeclampsia, OCT, retina, cognition
Introduction
Preeclampsia (preE) affects 5–8% of pregnancies worldwide and increases the risk of cerebrovascular disease, immediate and long-term cognitive impairment.1–4 Despite its significant impact, evaluating neurovascular changes after preE remains challenging due to limited accessibility of brain tissue through conventional neuroimaging. Understanding these persistent changes is crucial for developing targeted interventions and preventive strategies. The retina – an extension of the central nervous system that shares embryological origins, vascular characteristics, and blood-brain barrier properties with the brain – offers a unique window into neurovascular health. This anatomical relationship has gained increased attention as studies show that retinal thinning correlates with cognitive impairment severity in Alzheimer’s disease (AD), neurodegenerative and neuropsychiatric conditions and in the general population.5–7 While 30–40% of preE patients experience visual disturbances affecting multiple structures (retina, optic nerve, occipital cortex),8,9 few studies have examined long-term retinal changes after preE resolution.
Optical coherence tomography (OCT) provides high-resolution cross-sectional retinal images that may reveal insights about brain pathology. This non-invasive, high-resolution, and cost-effective technique has shown promise in detecting preE-related changes, with recent studies reporting lower choroidal thickness in preE patients.10,11 For example, prior studies comparing preE and normotensive pregnancies found correlations between peripartum choroidal thickness and disease severity.12–14 Although prior research evaluated peripartum choroidal thickness, macular thickness has not been examined in association with cognitive effects among preeclampsia survivors. The relationship between retinal structure and cognitive function years after delivery remains unexplored. Newer studies portend that preE-related microvascular dysfunction15,16 may persist even postpartum; this permits the assessment of long-term retinal alterations.17,18
We aimed to identify sectors of the retina that may be impaired among those with prior preE and correlate these results with cognitive performance. Our goal was to characterize distinct retinal phenotypes of women with history of preE at 10–15 years post-partum.
Materials and Methods
Study Design and Population
This single center prospective cohort study was approved by the University of Pittsburgh Institutional Review Board (STUDY20100076) and followed all STROBE guidelines.19 We sent recruitment letters to the participants from our prior study.20 All procedures complied with the Declaration of Helsinki. Written informed consent was obtained from all participants after the explanation of the study procedures. Sample size was based on availability of previously recruited participants rather than on-a priori power calculation. We recruited 35 women who delivered at Magee-Womens Hospital between 2008 and 2009 and performed retinal and cognitive assessments between 2019 and 2022 (mean time 12.31 years). Baseline demographics and characteristics were collected from the electronic medical records including placental maternal vascular malformation (MVM) – an indicator of maternal placental vascular damage,20 obtained from the placenta pathology report. Additional data (eg LDL, current hypertension) were collected at the study visit that occurred 10–15 years after delivery.
We included women with and without a prior diagnosis of preE, refractive error between −6D and +2D, and best corrected visual acuity of at least 20/40 (with and without correction). We defined preE using the most recent American College of Obstetricians and Gynecologists (ACOG) guidelines21 as blood pressure ≥140/90 mmHg with proteinuria or evidence of end-organ dysfunction or severe hypertension ≥160/110 mmHg. We excluded participants who were pregnant or within 6 months postpartum, those with glaucoma or glaucoma susceptibility, retinopathy (diabetic/hypertensive), prior adverse reactions to mydriatics, active eye conditions, visual acuity exceeding logMAR 1, or asthma (due to phenylephrine administration). We lack specific follow-up assessments; therefore, future studies should monitor progression of retinal and cognitive outcomes in preE survivors.
Cognition Outcomes
Eligible participants underwent cognitive assessments designed to assess executive function, memory (short term, long term and working) and information processing speed. Our cognition assessments included Wechsler Memory Scale III (immediate and delayed), WAIS III Digit-Symbol Coding, Stroop Color and Word, WAIS III Similarities, WAIS Matrix Reasoning and WAIS Letter-Number Sequencing. Cognitive assessments were administered by trained raters overseen by neuropsychologist (M.B). Z-scores of individual assessments were computed as previously reported.2 A higher score represents better cognition.
Retina Measurements
Ophthalmic examination was performed where we asked the participants to read letters on a chart. The Early Treatment Diabetic Retinopathy Study (ETDRS) eye chart was used to test visual acuity, with or without correction depending on the participant’s needs. If corrective lenses were worn on a regular basis for distance vision, then the participant’s vision was assessed using their customary form of correction (glasses or contacts). Participants with vision worse than 20/40 were tested again using the pinhole method. We administered one drop each of tropicamide 1% and phenylephrine (2.5%) for mydriasis and cycloplegia. Risk of acute angle closure was assessed using a penlight prior to dilation. All participants underwent retinal imaging using several FDA clinical imaging modalities including color fundus photography, scanning laser ophthalmoscopy (SLO) and spectral-domain optical coherence tomography (SD-OCT).
All retinal images were obtained by the same highly experienced retinal ophthalmic photographer (VS) to ensure consistent image quality for every participant. Color fundus photographs (50° field of view) were obtained (Topcon TRC 50DX) on both eyes of all participants. SLO images were obtained with infrared illumination, followed by SD-OCT (Spectralis HRA + OCT, Heidelberg Engineering GmbH, Heidelberg, Germany). Fovea-centered vertical and horizontal b-scans were obtained on both eyes followed by a volumetric scan with the following parameters: 30°×20° (9.6×6.4mm) field of view; 49 b-scans at a separation of 133 μm between b-scan; ART: 100; acquisition software version 6.10.7.0. Retinal measurements from the SD-OCT scans were made using the internal software to the Spectralis system (HEYEX, Heidelberg Engineering GmbH, Heidelberg, Germany).
Retinal thickness was assessed at 9 sectors across the macula using the ETDRS grid nasal outer (N2), superior outer (S2), temporal outer (T2), and inferior outer (I2); nasal inner (N1), superior inner (S1), temporal inner (T1), and inferior inner (I2); and Fovea central subfield (FCS) defined as the average thickness off the central area of the ETDRS grid22 and 2 calculated subfields (defined as sectors >3mm from foveal center) outer (S2, N2. I2 and T2) and inner (S1, N1. I1 and T1) from both eyes. Other measurements included Foveal center point (FCP) defined as the mean thickness of the center point,22 total retinal volume, and maximum value of FCS (FCS max) (Figure 1A and B).
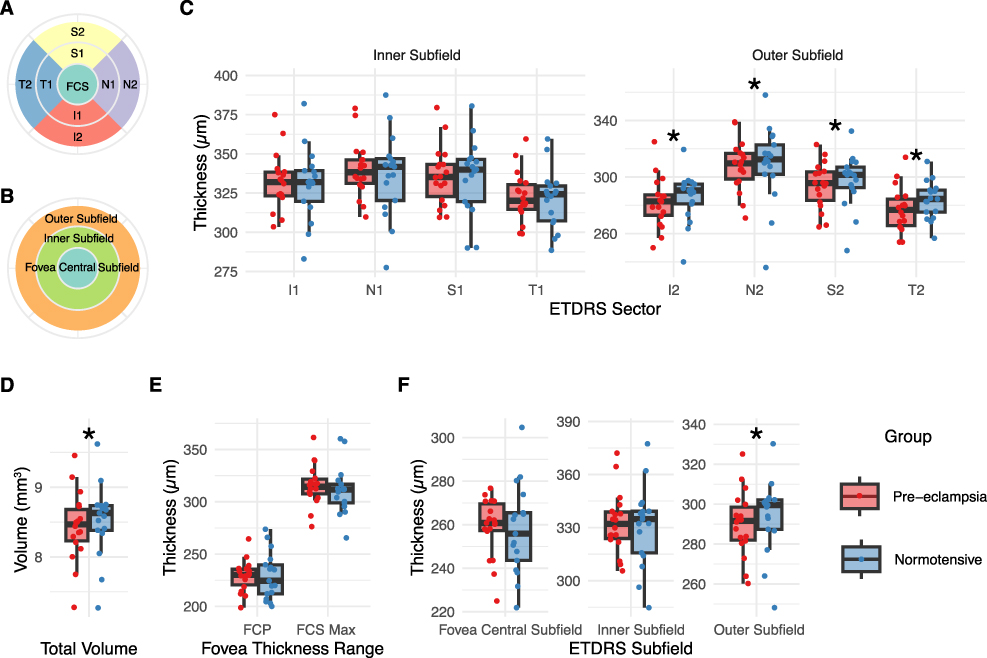 |
Figure 1 Retinal Thickness Measurements in Preeclamptic and Normotensive Women. (A) Diagram showing the 9 standard ETDRS sectors (B) Diagram of ETDRS retinal subfields (C) ETDRS sector measurements comparing individual retinal regions between groups. (D) Total retinal volume comparison reported in cubic millimeters (mm3). (E) Foveal thickness range measurements (F) Averaged measurements by retinal subfields (foveal central subfield, inner, and outer). Data presented as mean ± SD with individual data points. *P < 0.05. Abbreviations: preE, preeclampsia; Norm, normotensive; ETDRS, Early Treatment Diabetic Retinopathy Study grid; N2, Nasal outer; S2, Superior outer; T2, temporal outer; I2, inferior outer; N1, nasal inner; S1, superior inner; T1, temporal inner; I2, inferior inner; FCS, Fovea central subfield; FCP, Foveal center point (FCP); FCS Max, maximum Fovea central subfield. |
Statistical Analysis
For continuous variables, we used the mean and standard deviation (SD) for normally distributed data, and median and interquartile range (IQR) for non-normally distributed data. Categorical variables were summarized using counts and percentages. To compare the groups (preE vs normotensive), we employed Student’s t-test for normally distributed continuous variables, Wilcoxon rank-sum test for non-normally distributed continuous variables, and Fisher’s exact test for categorical variables.
We employed a multi-faceted approach to analyze retinal thickness measurements from SD-OCT in relation to our baseline characteristics and cognitive performance. We compared all the retinal measurements (9 ETDRS sectors, total volume, FCP, FCS, and retinal subfields) from both eyes between groups. There were strong correlations between all the retina measurements (86% significant pairwise correlations, mean r=0.77, p=<0.050), confirmed by Kaiser-Meyer-Olkin (0.772) and Bartlett’s sphericity tests (p<0.001). For this reason, we applied Principal Component Analysis (PCA) to the vector of all the retinal measurements using the average thickness of both eyes to minimize inter-eye differences. This approach allowed us to condense the major axes of variation, retaining >99% of variance with 3 orthogonal axes of retinal thickness, address multicollinearity issues and repeated measurements (left vs right eye), and improve statistical power by reducing the need for multi-hypothesis test correction in subsequent statistical analyses.
We averaged thickness measurements between eyes of the same individual. For approximately half of the individuals, we observed significant differences in thicknesses between eyes. We explored whether including eye-level thicknesses in the PCA altered our observations. There were no differences between separating or aggregating measurements between eyes.
We used linear regression to associate retinal thickness of each of the 9 ETDRS sectors, retinal subfields, or the loadings onto the three retinal principal components with cognitive performance adjusting for an interaction effect (preE x cognitive test) and confounding co-variates including visual acuity, age at study visit, hemoglobin A1C, gestational age at delivery, presence of hypertension and hypertensive medication. In the initial data exploration, we identified few outliers (>1.5 IQR) in cognitive scores, and we used the robust linear regression implementation in the MASS R-package using default parameters to weight against outliers while maintaining statistical power. This comprehensive analytical approach examined the relationships between retinal thickness, preE history and cognitive performance while accounting for confounding factors and the complex statistical structure of the data. A p-value < 0.05 was considered significant. Statistical analyses were performed using STATA software, version 18.0 and R (R Core Team, 2020), version 4.4.1.
Results
Study Population
The SD-OCT scans were performed in 17 women with preE and 18 with normotensive pregnancy history 10–15 years after delivery. We analyzed 69 eyes from 35 enrolled participants. One eye measurement was excluded due to low visual acuity (logMAR >1). The average age was 42.2 years (standard deviation [SD] 4.9, interquartile range [IQR] 40–45), with average visual acuity of logMAR 0.03 (SD 0.08, range −0.1 to 0.3).
Compared to normotensive participants, those with preE had higher BMI (35.2 vs 28.4 kg/m2, p=0.036) and diastolic blood pressure (77.7 vs 74.0 mmHg, p=0.022), and shorter gestational age at delivery (37.0 vs 40.0 weeks, p=0.003). PreE women had higher rates of MVM presence in their placenta (70.6% vs 11.1%, p<0.001) and lower HDL-cholesterol levels (51.0 mg/dL vs 61.0 mg/dL, p=0.039). Groups had similar years of education (p=0.260), rates of hypertension (p=0.120) and type 2 diabetes (p=0.150) (Table 1).
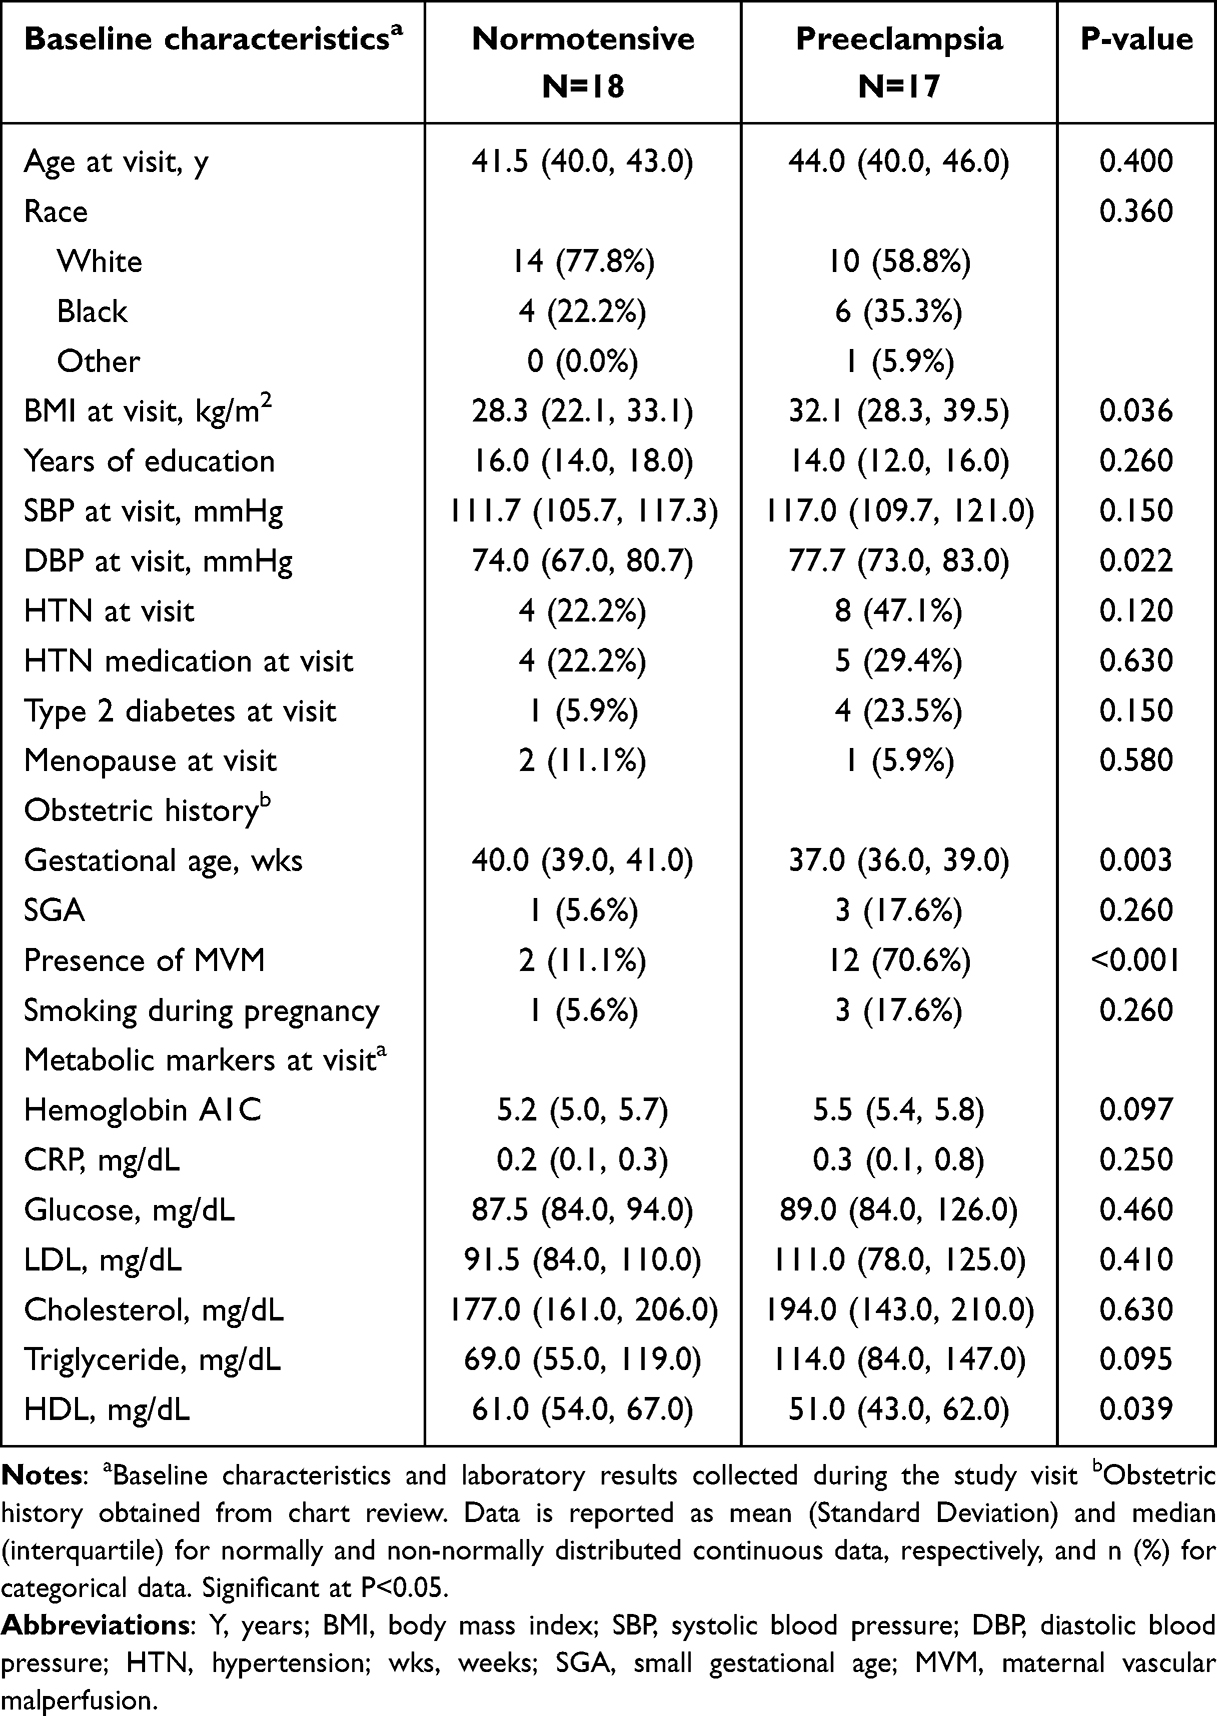 |
Table 1 Demographic and Clinical Characteristics of Women with Preeclampsia and Normotension 10–15 years Postpartum |
Retinal Measurements
All components of the outer retinal subfield showed significant thinning in preE versus normotensive participants: inferior (I2: β=−17.7, p=0.031), nasal (N2: β=−21.1, p=0.027), superior (S2: β=−18.8, p=0.018), and temporal (T2: β=−20.1, p=0.003). (Figure 1C). This pattern yielded a reduced total retinal volume (β=−0.5, p=0.028, Figure 1D) and an overall thinner outer retinal subfield in preE (β=−19.4, p=0.01). Inner subfield sectors, foveal central subfield (FCS), FCS max, and foveal center point (FCP) showed no significant differences (Figure 1E and F).
The PCA using all retinal measurements is shown in Figure 2A and B, Supplementary Figure 1. Three principal components explained 96% of the total variance: PC1 (74%) captured overall retinal thickness, PC2 (16%) represented foveal variation, and PC3 (6%) characterized outer retinal subfield patterns. PC3 scores differed significantly between preE and normotensive groups (β=15.8, P=0.039, Figure 2C). The weighted preE effects mapped onto ETDRS sectors confirmed preferential thinning in the outer retinal subfield, particularly S2, T2, and N2 regions.
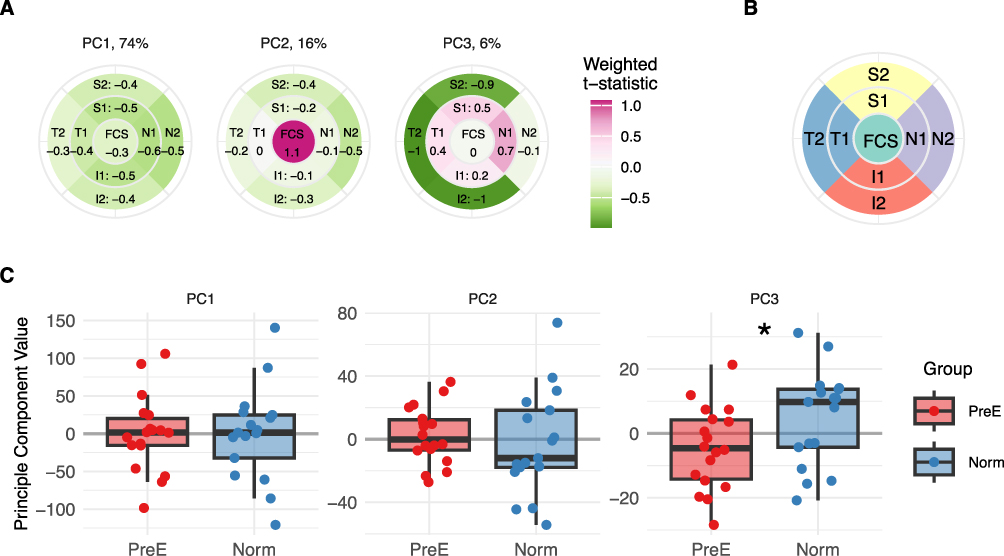 |
Figure 2 Principal Component Analysis of Retinal Measurements. (A) Retina differences between PreE and Norm women using Principal Component Analysis. Weighted contributions of each ETDRS sector to the first three principal components (PCs), which explain 74%, 16%, and 6% of total variance respectively. Color intensity indicates the strength and direction for the PreE v. Norm t-statistic effect weighted by the PC loading onto each ETDRS sector. (B) Reference diagram of ETDRS sectors. (C) Individual-level PC scores comparing preE and Norm. groups, showing significant differences in PC3. *P < 0.05. Abbreviations: preE, preeclampsia; Norm, normotensive; ETDRS, Early Treatment Diabetic Retinopathy Study grid; Retina thickness is measured in micrometers (μm). |
Associations Between Retinal Measurements and Cognitive Tests
Possible correlations between retina structural variation and cognitive test results were subsequently evaluated across domains. Cognitive assessment revealed comparable performance between preE and normotensive groups across all domains (Table 2). By individual cognitive test, thinner S1 (β=12.9, p=0.037) and N1 (β=12.2, p=0.032) were associated with worse scores on Stroop Word. There were also an association between information processing speed and S1 (β=13.8, p=0.037) (Figure 3A).
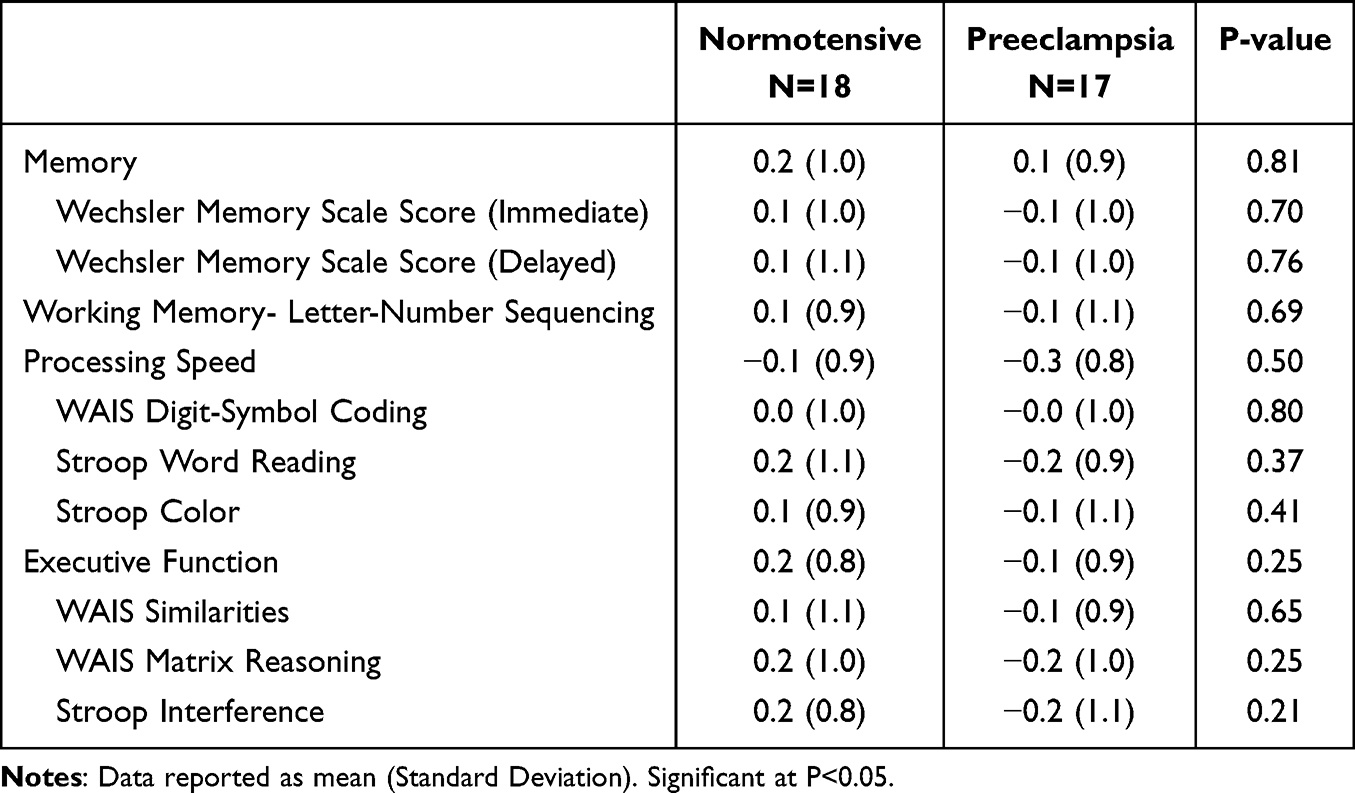 |
Table 2 Differences in Cognitive Assessments Between Preeclampsia and Normotensive Women 10–15 Years Postpartum |
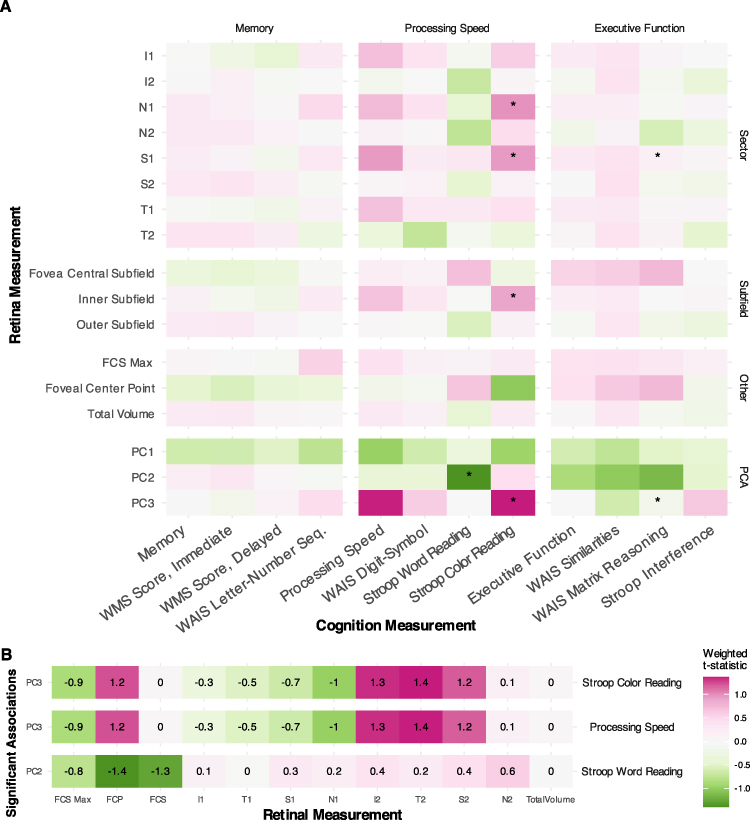 |
Figure 3 Associations Between Retinal Measurements and Cognitive Performance. (A) Heat map showing associations between retinal measurements and cognitive domain and individual test scores. The color scale plots the strength and direction of the preE vs Norm. robust linear regression t-statistic. (B) Significant loadings from principal component analysis mapped to cognitive measures. Color intensity indicates the strength and direction of the preE vs Norm. t-statistic weighted by the PC loading onto each retinal measurement. *P < 0.05. Abbreviations: preE, preeclampsia; Norm, normotensive. |
There were associations between the principal components and cognitive performance. PC2 demonstrated a strong relationship with Stroop Word (β=−17.7, p=0.035). PC3 showed the strongest association with information processing speed (β=17.37, p=0.006) and Stroop Color performance (β=12.3, p=0.006). Our detailed mapping of significant cognitive associations onto retinal measurements revealed distinct spatial patterns in the PCs (Figure 3B).
The relationship between retinal measurements and cognitive performance was significantly modulated by preE history. For the WAIS Letter-Number Sequencing test, preE history significantly altered the relationship with FCP max thickness (β=−17.3, P=0.013). Principal component analysis revealed that PC3 moderated the relationship between preE history and information processing speed (β=−15.5, P=0.016), while PC2 moderated the relationship with WAIS Similarities (β=22.7, P=0.034).
Discussion
Our study revealed spatially unique retinal changes in women with a preE history, with significant thinning in outer retinal subfields including I2, N2, S2, and T2. A similar retinal pattern among preE participants was confirmed using principal component analysis and was consistent across both eyes. Thinner areas (I1, N1) were associated with lower scores on Stroop color whereas PC2 and PC3 showed a relationship with information processing speed; however, these relationships differed depending on whether women had preE history or not. These findings suggest selective vulnerability of peripheral retinal regions to persistent microvascular changes after preE and may reflect changes associated with impartments in information processing speed, executive functioning and working memory.
Increased retinal thickness during pregnancy has been described, and attributed to pregnancy-related fluid retention.23,24 It is estimated that 14.8% of preE women have visual disturbances and retinal findings.25 PreE women can experience clinical symptoms associated with retinal disorders, such as sudden vision loss due to serous retinal detachment, retinal vascular occlusion or postpartum purrstcher-like retinopahy. Choroidal thickness was also reported to be significantly thinner in pregnant preE than in women, whereas no differences in macula thickness or RNFL were seen between the groups.8,19, In contrast, a higher choroidal thickness was reported in peripartum preE women, especially in the nasal area.12,13,26 Although these prior studies showed retinal and choroidal involvement, they are mostly restricted to the pregnancy period. Limited research exists on long-term retinal changes detected by OCT in preeclampsia. Our study addresses this gap by demonstrating that intra-group differences persist after age adjustment, indicating a direct association between preeclampsia and retinal thinning beyond typical age-related changes.
We observed in our study a decreased thickness of the retina 10–15 years after preE and speculate this may be a long-term consequence of microvascular dysfunction during pregnancy. Consistent with this, prior studies in preE have documented systemic microvasculature abnormalities outside and inside of the placenta including reduced venular diameters in conjunctiva,27 and abnormal endothelial glycocalyx of sublingual micro-vessels.28,29 A common placenta finding in preE is decidual vasculopathy and concomitant hypoxia and reperfusion lesions, also known as maternal vascular malperfusion (MVM). MVM can result in both a poorly perfused placenta and circulating endothelial microparticles which themselves induce or exacerbate systemic vessel injury via oxidative stress damage.30–32 We propose that this retinal thinning may be due to decreased of blood flow from vasospasm and/or increased resistance in the setting of an acute increase of blood pressure during pregnancy and this initial microvascular damage may extend both spatially outside the placenta to the retina and persist 10–15 years after pregnancy.
OCT shows promise to become an adjunct tool for early AD diagnosis. In AD, multiple studies have reported thinning of the RNFL and a relationship between reduced macular volume and severity of cognitive impairment.33–35 Even cognitively healthy women at high genetic risk of AD had a thinner fovea/central area of the retina demonstrating that early changes may appear in this area.36 Similar to the AD studies, our cohort (mean age 42.2 years) exhibited not only thinning in the outer retinal subfield but also an association between lower scores on Stroop Word and a thinner nasal and superior inner area. Epidemiological studies have reported an increased risk of AD and vascular dementia later in life among women with history of preE;37,38 although the shared mechanisms (eg neurovascular dysfunction, neuroinflammation) need further elucidation.
The association between retinal thickness and both information processing speed, executive function and working memory varied based on preE history. These findings are consistent with previous studies that have documented cognitive differences between women with and without preE history following delivery. In the peripartum period, our group previously reported that preE was associated with alterations in executive function, attention, and working memory, while other investigators demonstrated mild cognitive impairment and executive dysfunction among individuals with preE history years after delivery.4,39 While age-related decline in information processing speed is expected, this decline is particularly pronounced in degenerative brain disorders such as vascular dementia and cerebral small vessel disease.40,41 Furthermore, evidence suggests that executive function deterioration correlates with cortical degeneration in women with small vessel disease.42 More longitudinal studies integrating brain imaging, OCT and cognitive testing are needed to clarify the underlying mechanisms affecting women with preE.
Our findings reveal notable spatial patterns in retinal changes. PreE-associated thinning predominantly affected outer retinal subfield (T2, S2, N2, I2). The preferential thinning of outer retinal regions may reflect increased vulnerability to vascular dysfunction in areas farther from major vessels. The retina supply is determined by the arrangement of the central retinal artery and its branches. The outer temporal (T2) along with central area (FCP/FCS) are the most vulnerable sectors to ischemia and edema because of the high metabolic demand and lack of retinal capillaries. This anatomical arrangement suggests potential vascular vulnerability in the setting of preE.
The clinical significance of the outer retinal thinning extends beyond the local pathology. In a pilot study of adults with normal retina aging and early/intermediate age-related macular degeneration, a thinner outer retina was associated with thinning of occipital cortex, smaller hippocampus and thinner AD-related and other dementia-related brain areas.43 This highlights the potential predictive value of retinal layer thickness for brain atrophy. Given these findings and the non-invasive nature of OCT screening modalities, retina imaging may serve as valuable tool for long-term monitoring in the clinical evaluation of women with history of preeclampsia.
Our study has strengths and limitations. Studies integrating cognitive data to study retinal changes have been reported in AD; however, we are the first study evaluating these changes in the setting of preE. Current literature focuses primarily on choroidal studies, leaving retinal neural layer changes relatively unexplored. The spatial specificity of our findings – both in direct preE effects and cognitive correlations – highlights the need for targeted investigation of regional retinal changes and their functional consequences. We could not evaluate retina differences between early vs late onset preE separately due to the small sample size. This also restricted our ability to assess other variables (eg severity of preE) and to fully characterize regional patterns; however, these effect sizes warrants further investigation. We only had a single time-point measurement, which, limits our understanding of how these spatial patterns develop. In addition, our exploratory study was designed to use OCT only; more research is needed to incorporate OCT angiography (OCTA) to evaluate vessel density, and to examine relationships between retinal neural and vascular layer findings and brain neuroimaging data. Future studies should incorporate larger cohorts, longitudinal assessments, and comprehensive cognitive testing to determine the effect on the quality of life of these women affected by preeclampsia and to better characterize anatomically specific relationships between retinal structure and function in this population.
Conclusions
Retinal measurements 10–15 years post-delivery revealed spatially specific structural changes in those with prior preE. These findings suggest a preE-related pattern of neurodegeneration, and the potential for changes in these regions to predict cognitive impairments. The prospective correlation of retinal imaging via OCT with neuroimaging and cognitive evaluation may offer a robust multimodal approach to screening and monitoring neurovascular health in women with a history of preeclampsia. However, these preliminary findings necessitate replication in larger, more diverse cohorts to prove the validity of retinal thinning patterns as biomarkers of long-term vascular risk in preE.
Acknowledgment
Support was provided by the University of Pittsburgh Cluster Hire Initiative, University of Pittsburgh Department of Anesthesiology and Perioperative Medicine seed grant, the Society for Obstetric Anesthesia and Perinatology/Foundation for Anesthesia Education and Research (SOAP/FAER grant number 1061081, AJI), NIH National Institute on Drug Abuse grant (grant number F30DA053020, BNP), NIH National Institute of Aging grant (grant number R01AG072646, JMC), Jewish Healthcare Foundation (JMC), American Heart Association 16SFRN28930000 (JMC), National Eye Institute (grant number R01030517 EAR), Eye & Ear Foundation of Pittsburgh and unrestricted grant from Research to Prevent Blindness to University of Pittsburgh Department of Ophthalmology (EAR).
Disclosure
The authors report no conflicts of interest in this work.
References
1. McDonald SD, Malinowski A, Zhou Q, Yusuf S, Devereaux PJ. Cardiovascular sequelae of preeclampsia/eclampsia: a systematic review and meta-analyses. Am Heart J. 2008;156(5):918–11. doi:10.1016/j.ahj.2008.06.042
2. Shaaban CE, Rosano C, Cohen AD, et al. Cognition and cerebrovascular reactivity in midlife women with history of preeclampsia and placental evidence of maternal vascular malperfusion. Front Aging Neurosci. 2021;13:1–10. doi:10.3389/fnagi.2021.637574
3. Miller EC. Preeclampsia and cerebrovascular disease: the maternal brain at risk. Hypertension. 2019;74(1):5–13. doi:10.1161/HYPERTENSIONAHA.118.11513
4. Ibarra AJ, Butters MA, Lim G, et al. Longitudinal cognitive evaluation before and after delivery among people with preeclampsia. Am J Obstet Gynecol MFM. 2023;5(7):100966. doi:10.1016/j.ajogmf.2023.100966
5. Kao CC, Hsieh HM, Chang YC, Chu HC, Yang YH, Sheu SJ. Optical coherence tomography assessment of macular thickness in Alzheimer’s dementia with different neuropsychological severities. J Personal Med. 2023;13(7):1118. doi:10.3390/jpm13071118
6. Silverstein SM, Demmin DL, Schallek JB, Fradkin SI. Measures of retinal structure and function as biomarkers in neurology and psychiatry. Biomarkers Neuropsychiatry. 2020;2:100018. doi:10.1016/j.bionps.2020.100018
7. Ward DD, Mauschitz MM, Bönniger MM, Merten N, Finger RP, Breteler MMB. Association of retinal layer measurements and adult cognitive function: a population-based study. Neurology. 2020;95(9):e1144–e1152. doi:10.1212/WNL.0000000000010146
8. Gilbert AL, Prasad S, Mallery RM. Neuro-ophthalmic disorders in pregnancy. Neurol Clin. 2019;37(1):85–102. doi:10.1016/j.ncl.2018.09.001
9. Naderan M. Ocular changes during pregnancy. J Curr Ophthalmol. 2018;30(3):202–210. doi:10.1016/j.joco.2017.11.012
10. Pota ÇE. Optical coherence tomography angiography assessment of retinochoroidal microcirculation differences in preeclampsia. Photodiagn Photodyn Ther. 2024.
11. Jiang MS, Xu XL, Yang T, Li F, Zhang XD. Comparison of choroidal thickness in preeclamptic, healthy pregnant, and nonpregnant women: a systematic review and meta-analysis. Ophthalmic Res. 2019;62(1):1–10. doi:10.1159/000499916
12. Benfica CZ, Zanella T, Farias LB, Oppermann MLR, Canani LHS, Lavinsky D. Choroidal thickness in preeclampsia measured by spectral-domain optical coherence tomography. Int Ophthalmol. 2019;39(9):2069–2076. doi:10.1007/s10792-018-1043-7
13. Garg A, Wapner RJ, Ananth CV, et al. Choroidal and retinal thickening in severe preeclampsia. Invest Ophthalmol Vis Sci. 2014;55(9):5723–5729. doi:10.1167/iovs.14-14143
14. Lee YH, Kim DY, Bae JG, Kim YC. Relationship between proteinuria and changes in antepartum and postpartum choroidal thickness in patients with pre-eclampsia. Sci Rep. 2024;14(1):12672. doi:10.1038/s41598-024-63359-3
15. Björkman S, Lilliecreutz C, Bladh M, et al. Microvascular dysfunction in women with a history of hypertensive disorders of pregnancy: a population-based retrospective cohort study. BJOG. 2024;131(4):433–443. doi:10.1111/1471-0528.17665
16. Honigberg MC, Economy KE, Pabón MA, et al. Coronary microvascular function following severe preeclampsia. Hypertension. 2024;81(6):1272–1284. doi:10.1161/HYPERTENSIONAHA.124.22905
17. Olivares Ordoñez MA, Smith RC, Yiu G, Liu YA. Retinal microstructural and microvascular changes in Alzheimer disease: a review. Int Ophthalmol Clin. 2025;65(1):59–67. doi:10.1097/IIO.0000000000000549
18. István L, Czakó C, Élő Á, et al. Imaging retinal microvascular manifestations of carotid artery disease in older adults: from diagnosis of ocular complications to understanding microvascular contributions to cognitive impairment. Geroscience. 2021;43(4):1703–1723. doi:10.1007/s11357-021-00392-4
19. von Elm E, Altman DG, Egger M, Pocock SJ, Gøtzsche PC, Vandenbroucke JP. The Strengthening the Reporting of Observational Studies in Epidemiology (STROBE) statement: guidelines for reporting observational studies. Lancet. 2007;370(9596):1453–1457. doi:10.1016/S0140-6736(07)61602-X
20. Catov JM, Muldoon MF, Gandley RE, et al. Maternal vascular lesions in the placenta predict vascular impairments a decade after delivery. Hypertension. 2022;79(2):424–434. doi:10.1161/HYPERTENSIONAHA.121.18394
21. ACOG Practice Bulletin Clinical Management Guidelines for Obstetrician Gynecologists. Gestational Hypertension Preeclampsia. 2020;135(6):e237–e260.
22. Huang J, Liu X, Wu Z, Xiao H, Dustin L, Sadda S. Macular thickness measurements in normal eyes with time domain and fourier domain optical coherence tomography. Retina. 2009;29(7):980–987. doi:10.1097/IAE.0b013e3181a2c1a7
23. Pilas-Pomykalska M, Czajkowskii J, Oszukowski P. Ocular changes during pregnancy. Ginekol Pol. 2005;76(8):655–660.
24. Cankaya C, Bozkurt M, Ulutas O. Total macular volume and foveal retinal thickness alterations in healthy pregnant women. Semin Ophthalmol. 2013;28(2):103–111. doi:10.3109/08820538.2012.760628
25. Neudorfer M, Spierer O, Goder M, et al. The prevalence of retinal and optical coherence tomography findings in preeclamptic women. Retina. 2014;34(7):1376. doi:10.1097/IAE.0000000000000085
26. Evcimen Y, Onur IU, Cengiz H, Yigit FU. Optical coherence tomography findings in pre-eclampsia: a preliminary receiver operating characteristic analysis on choroidal thickness for disease severity. Curr Eye Res. 2019;44(8):916–920. doi:10.1080/02713683.2019.1600198
27. Houben AJHM, De Leeuw PW, Peeters LLH. Configuration of the microcirculation in pre-eclampsia: possible role of the venular system. J Hypertens. 2007;25(8):1665–1670. doi:10.1097/HJH.0b013e3281900e0e
28. Hauspurg A, Redman EK, Assibey-Mensah V, et al. Placental findings in non-hypertensive term pregnancies and association with future adverse pregnancy outcomes: a cohort study. Placenta. 2018;74:14–19. doi:10.1016/j.placenta.2018.12.008
29. Weissgerber TL, Garcia-Valencia O, Milic NM, et al. Early onset preeclampsia is associated with glycocalyx degradation and reduced microvascular perfusion. J Am Heart Assoc. 2019;8(4). doi:10.1161/JAHA.118.010647
30. Das S, Halushka MK. Extracellular vesicle microRNA transfer in cardiovascular disease. Cardiovasc Pathol. 2015;24(4):199–206. doi:10.1016/j.carpath.2015.04.007
31. González-Quintero VH, Smarkusky LP, Jiménez JJ, et al. Elevated plasma endothelial microparticles: preeclampsia versus gestational hypertension. Am J Obstet Gynecol. 2004;191(4):1418–1424. doi:10.1016/j.ajog.2004.06.044
32. Hecht JL, Zsengeller ZK, Spiel M, Karumanchi SA, Rosen S. Revisiting decidual vasculopathy. Placenta. 2016;42:37–43. doi:10.1016/j.placenta.2016.04.006
33. Coppola G, Di Renzo A, Ziccardi L, et al. Optical coherence tomography in Alzheimer’s disease: a meta-analysis. PLoS One. 2015;10(8):e0134750. doi:10.1371/journal.pone.0134750
34. Lu Y, Li Z, Zhang X, et al. Retinal nerve fiber layer structure abnormalities in early Alzheimer’s disease: evidence in optical coherence tomography. Neurosci lett. 2010;480(1):69–72. doi:10.1016/j.neulet.2010.06.006
35. Iseri PK, Altinaş O, Tokay T, Yüksel N. Relationship between cognitive impairment and retinal morphological and visual functional abnormalities in Alzheimer disease. J Neuroophthalmol. 2006;26(1):18–24. doi:10.1097/01.wno.0000204645.56873.26
36. López-Cuenca I, de Hoz R, Salobrar-García E, et al. Macular thickness decrease in asymptomatic subjects at high genetic risk of developing Alzheimer’s disease: an OCT study. J Clin Med. 2020;9(6):1728. doi:10.3390/jcm9061728
37. Schliep KC, Mclean H, Yan B, et al. Association between hypertensive disorders of pregnancy and dementia: a systematic review and meta-analysis. Hypertension. 2023;80(2):257–267. doi:10.1161/HYPERTENSIONAHA.122.19399
38. Carey C, Mulcahy E, McCarthy FP, et al. Hypertensive disorders of pregnancy and the risk of maternal dementia: a systematic review and meta-analysis. Am J Clin Exp Obstet Gynecol. 2024;231(2):196–210. doi:10.1016/j.ajog.2024.01.013
39. Fields JA, Garovic VD, Mielke MM, et al. Preeclampsia and cognitive impairment later in life. Am J Clin Exp Obstet Gynecol. 2017;217(1):74.e1–74.e11. doi:10.1016/j.ajog.2017.03.008
40. Righart R, Duering M, Gonik M, et al. Impact of regional cortical and subcortical changes on processing speed in cerebral small vessel disease. Neuroimage Clin. 2013;2:854–861. doi:10.1016/j.nicl.2013.06.006
41. Rösler A, Billino J, Müller NG, Weidauer S, Steinmetz H, Kleinschmidt A. Visual search in patients with subcortical vascular dementia: short fixations but long reaction times. Dement Geriatr Cognit Disord. 2005;20(6):375–380. doi:10.1159/000089104
42. Gunning-Dixon FM, Raz N. The cognitive correlates of white matter abnormalities in normal aging: a quantitative review. Neuropsychology. 2000;14(2):224–232. doi:10.1037//0894-4105.14.2.224
43. Jiang Y, Swain T, Gim N, et al. Outer retinal thinning is associated with brain atrophy in early age-related macular degeneration. Am J Ophthalmol. 2025;269:457–465. doi:10.1016/j.ajo.2024.09.033
 © 2026 The Author(s). This work is published and licensed by Dove Medical Press Limited. The
full terms of this license are available at https://www.dovepress.com/terms
and incorporate the Creative Commons Attribution
- Non Commercial (unported, 4.0) License.
By accessing the work you hereby accept the Terms. Non-commercial uses of the work are permitted
without any further permission from Dove Medical Press Limited, provided the work is properly
attributed. For permission for commercial use of this work, please see paragraphs 4.2 and 5 of our Terms.
© 2026 The Author(s). This work is published and licensed by Dove Medical Press Limited. The
full terms of this license are available at https://www.dovepress.com/terms
and incorporate the Creative Commons Attribution
- Non Commercial (unported, 4.0) License.
By accessing the work you hereby accept the Terms. Non-commercial uses of the work are permitted
without any further permission from Dove Medical Press Limited, provided the work is properly
attributed. For permission for commercial use of this work, please see paragraphs 4.2 and 5 of our Terms.
Recommended articles
Transient Increase in Patient Numbers with “Acute Macular Neuroretinopathy” Post SARS-CoV-2 Infection—Case Series During the First Surge of Infection in December 2022
Xu B, Zhang J, Zhang Y, Cheng Y, Huang Q
Journal of Inflammation Research 2023, 16:2763-2771
Published Date: 3 July 2023