Back to Journals » Journal of Pain Research » Volume 15
Predictive Validity and Patterns of Change Over Time of the Sensitivity to Pain Traumatization Scale: A Trajectory Analysis of Patients Seen by the Transitional Pain Service Up to Two Years After Surgery
Authors Fashler SR, Pagé MG ![]() , Svendrovski A
, Svendrovski A ![]() , Flora DB, Slepian PM
, Flora DB, Slepian PM ![]() , Weinrib AZ, Huang A, Fiorellino J, Clarke H
, Weinrib AZ, Huang A, Fiorellino J, Clarke H ![]() , Katz J
, Katz J ![]()
Received 12 April 2022
Accepted for publication 18 August 2022
Published 31 August 2022 Volume 2022:15 Pages 2587—2605
DOI https://doi.org/10.2147/JPR.S370497
Checked for plagiarism Yes
Review by Single anonymous peer review
Peer reviewer comments 2
Editor who approved publication: Dr Jonathan Greenberg
Samantha R Fashler,1 M Gabrielle Pagé,2 Anton Svendrovski,3 David B Flora,1 P Maxwell Slepian,1,4,5 Aliza Z Weinrib,1,4 Alexander Huang,4,5 Joseph Fiorellino,4,5 Hance Clarke,4,5 Joel Katz1,4,5
1Department of Psychology, York University, Toronto, ON, Canada; 2Department of Anesthesiology & Pain Medicine and Department of Psychology, Université de Montréal; Research Center of the Centre hospitalier de l’Université de Montréal (CRCHUM), Montréal, QC, Canada; 3UZIK Consulting Inc, Toronto, ON, Canada; 4Department of Anesthesia and Pain Management, Toronto General Hospital, Toronto, ON, Canada; 5Department of Anesthesiology and Pain Medicine, University of Toronto, Toronto, ON, Canada
Correspondence: Samantha R Fashler; Joel Katz, Department of Psychology, York University, 4700 Keele St., BSB 232, Toronto, ON, M3J 1P3, Canada, Email [email protected]; [email protected]
Purpose: The Sensitivity to Pain Traumatization Scale (SPTS-12) was developed to assess the propensity to develop a traumatic stress response to pain. The SPTS-12 is a reliable and valid scale with a one-factor structure. The aim of the present study is to further examine the psychometric properties of the SPTS-12 by evaluating its criterion validity and how scores change over time in a sample of postsurgical patients at the Toronto General Hospital Transitional Pain Service.
Participants and Methods: 361 adults (55% male; Mage = 50.6 years, SDage = 14.3) completed questionnaires assessing symptoms of pain, anxiety, depression, and trauma at multiple visits to the Transitional Pain Service after surgery. Latent-class growth mixture modeling defined prototypical longitudinal patterns (latent trajectories) of SPTS-12 scores up to two years after surgery. One-way ANOVAs examined how trajectory classes differed over time on measures of daily opioid use (mg morphine equivalents (MME)), average pain intensity, pain interference, and depressive symptoms.
Results: The final model consisted of five SPTS-12 trajectory groups; two characterized by a flat and unchanging pattern and three showing a small but statistically significant decrease over time. Analysis of pain-related outcomes predicted by SPTS-12 trajectories provided evidence of criterion validity of the SPTS-12. SPTS-12 trajectories did not significantly differ on daily MME at any time. Average pain, pain interference, and depression scores significantly differed across SPTS-12 trajectory groups at two or more postsurgical visits (all p < 0.05).
Conclusion: The SPTS-12 shows fairly stable patterns and predicts important pain-related and psychosocial outcomes over time. Two SPTS-12 trajectories (#2 and #5) with high scores, comprising ∼ 28% of the total sample, are associated with problematic outcomes on several pain and psychosocial measures. Targeting patients with high SPTS-12 scores for presurgical psychological treatment may prove beneficial in reducing the impact of CPSP.
Keywords: chronic pain, chronic postsurgical pain, trauma, psychology, scale validation, psychosocial factors, trajectory
Chronic postsurgical pain (CPSP) is a common complication, with incidence rates ranging from 10% to 50%.1 The transition from acute to chronic postsurgical pain is complex, with interacting biopsychosocial risk factors across the preoperative, intraoperative, and postoperative periods.2 Recently, there has been an increased recognition of psychological factors in CPSP.2,3 Given that surgery can expose the patient to traumatic medical procedures and stress, a particular interest is the presence of perioperative post-traumatic stress symptoms (PTSS), one of the diagnostic requirements for Posttraumatic Stress Disorder (PTSD) in the 5th edition of the Diagnostic and Statistical Manual for Mental Disorders.4
Pain and trauma are frequently comorbid in clinical settings, with rates of PTSD in pain clinics estimated at between 9.5 and 33%.5,6 After surgery, probable PTSD diagnosis as identified by self-report is estimated between 15 and 20% after cardiac surgery,7 breast cancer,8 and total knee replacement surgery.9 Furthermore, the impact of PTSS on health-related quality of life may become increasingly important as time elapses post-surgery: in a sample of 47 patients who underwent lateral thoracotomy, Katz et al10 found that the PTSS symptom of “emotional numbing” accounted for 4% of the variance in concurrent pain disability scores six months after surgery, and increased to 20% at 12 months after surgery. These results suggest that the relative impact of emotional numbing on quality-of-life indices such as pain disability becomes stronger as time from surgery increases.
The high degree of overlap between pain and trauma has been related to mutually maintaining factors, shared vulnerability factors, and behavioral responses that are present in both disorders.11–16 This strong theoretical relationship led Katz et al to propose sensitivity to pain traumatization as a construct to describes the propensity to develop a traumatic stress-like response to pain17 and to develop the Sensitivity to Pain Traumatization Scale (SPTS-12) to measure the construct.18 The SPTS-12 has been shown to be a reliable and valid scale with a one-factor structure in both community (N = 823) and postsurgical samples (N = 345),18 but its predictive validity and pattern of change over time have yet to be evaluated.
There is a growing trend in health research to better understand change over time while simultaneously accounting for patient heterogeneity by using latent class growth mixture models (GMM).19–22 A more precise account of subgroups at high risk of chronic postsurgical pain may be possible using GMM. For example, Chapman et al22 measured self-reported pain scores in a sample of 502 elective surgery patients daily for six days after surgery. The 6-day mean pain rating for the entire sample was 5.59 (SD = 2.20) with a mean slope of −0.31. The authors then used GMM to decompose the sample into three groups: patients with decreasing slopes (n = 314), flat slopes (n = 127), and increasing slopes (n = 61). They concluded that identifying pain trajectories after surgery yielded more precise and accurate information about the rate and direction of pain resolution (but see Bauer23 for a critique of inferential conclusions made using GMM). Because poorly managed acute pain predicts chronic postsurgical pain,24 providing more specialized pain management to patients whose pain is not improving could help improve pain-related outcomes. Given that the relative impact of psychological variables such as trauma may increase over time since surgery, identifying latent class trajectories of the SPTS-12 may similarly contribute to an improved understanding of how pain and disability change over time.
The aim of the present study is to further examine the psychometric properties of the SPTS-12 by evaluating its criterion validity and how SPTS-12 scores change over time in a clinical sample of patients receiving care after surgery from the Toronto General Hospital Transitional Pain Service. The objectives are: (1) to estimate growth mixture models to represent trajectories of SPTS-12 scores after surgery; (2) to describe the identified trajectory groups according to patient characteristics, pain history, and questionnaire data; and (3) to examine differences between trajectory groups for pain, pain disability, and morphine equivalent use at regular intervals after surgery (up to two weeks, three months, six months, one year, and two years).
Methods
Procedure
The data used in the present article come from a larger database study used for a program evaluation of the Transitional Pain Service. The larger study was approved by the University Health Network (UHN) Research Ethics Board (certificate approval #: 14–7705-AE and 16–5109) and the York University Human Participants Review Subcommittee (certificate approval #: 14–7705-AE). The study was conducted in accordance with the Declaration of Helsinki.
Participants were eligible for the study if they were older than 18 years and met one or more of the following TPS inclusion criteria: (1) considered a “pain alert” patient upon hospital admission (prior to surgery), whereby they have a history of chronic pain, drug abuse or misuse, present or past opioid use, or current use of methadone or buprenorphine; (2) spent more than three days observed by the Acute Pain Service postoperatively due to significant persistent postoperative pain; (3) postoperative pain management included more than 90 mg morphine equivalents per day (MME/day) of an opioid class drug; (4) postoperative interventional pain procedures are required; (5) subsequent pain consultations required when no longer observed by Acute Pain Service, or (6) patients referred by attending surgeons at UHN.
Eligible participants were subsequently approached either preoperatively or postoperatively by the TPS study coordinator who explained the study protocol. Participants provided written informed consent prior to involvement in the study. Participants were asked to complete a paper questionnaire package preoperatively, after discharge from the hospital, at their first outpatient visit in the TPS, and at each subsequent visit to the TPS. TPS visits were scheduled based on each participant’s clinical care requirements and not at fixed times after surgery. The present study only used data obtained postoperatively.
Measures
Demographic and Medical History
Demographic information including age and sex was collected. Preoperative variables were available for pre-existing medical conditions and diagnoses, prescription medication use, pain complaints, pain treatments, and surgery type. Daily MME dosage was available at each visit to the TPS.
Brief Pain Inventory-Short Form (BPI).
The BPI25 assesses pain severity and pain interference. The BPI consists of nine items, with the first asking if the participant is currently experiencing pain as well as the location of pain. The next four items use an 11-point response scale asking participants to rate their current level of pain as well as the average, lowest, and worst level of pain they experienced in the previous 24 hours. For these items, anchors were 0 = no pain and 10 = pain as bad as you can imagine. Subsequent items ask which medications or treatments participants are currently using for pain and the percentage of relief the medications or treatments are providing, with item anchors 0% = no relief and 100% = complete relief. The final item measures pain interference across seven domains (general activity, mood, walking ability, normal work, relations with other people, sleep, and enjoyment of life), with item anchors 0 = does not interfere and 10 = completely interferes. Pain interference is reported as the mean rating across the seven interference domains.26 The BPI short form has good internal consistency (α = 0.80 to 0.87 for pain severity items and α = 0.89 to 0.92 for pain interference items25) and good test-retest reliability with consecutive daily administration over the course of a week (r = 0.83 to 0.88 for pain severity items and r = 0.83 to 0.93 for pain interference items).27 In the present sample, the BPI showed excellent internal consistency across all times points for pain severity (α = 0.92) and pain interference (α = 0.92) scores.
Hospital Anxiety and Depression Scale (HADS)
The HADS28 consists of two subscales, one assessing symptoms of anxiety (HADS-A) and the other measuring symptoms of depression (HADS-D). The HADS was developed for use in outpatient primary or secondary care settings.28 Each subscale consists of seven items, each using a four-point response scale with different anchors depending on the item; for example, the first anxiety item asks participants to rate the degree to which they “feel tense or “wound up” ” with anchors 0 = not at all, 1 = from time to time, occasionally, 2 = a lot of the time, and 3 = most of the time. The first depression item asks participants how much they “still enjoy the things I used to enjoy”, with anchors 0 = definitely as much, 1 = not quite so much, 2 = only a little, and 3 = hardly at all. The total score range for each subscale is 0 to 21, with higher scores reflecting greater depressive and anxiety symptoms, respectively. Scores between 0 and 7 are considered in the normal range, scores between 8 and 10 are considered borderline, and scores between 11 and 21 are considered abnormal.28 According to a review of 14 studies, internal consistency for the HADS-A ranges from α =0.68 to 0.93 (M = 0.83) and for the HADS-D ranges from α = 0.67 to 0.90 (M = 0.82).29 The HADS has good test-retest reliability over a 0- to 2-week period (HADS-A; r = 0.84, HADS-D; r = 0.85; Herrmann, 1997). Furthermore, the HADS has demonstrated good divergent validity by determining that the items on the HADS measure depression and anxiety rather than physical symptoms secondary to injury or illness and by establishing that the HADS can differentiate between depression and anxiety.30 In the present sample, the HADS showed good internal consistency across all times points for anxiety (α = 0.86) and depression (α = 0.85) scores.
Pain Catastrophizing Scale (PCS)
The PCS31 assesses ruminative thinking, perception of threat, and feelings of helplessness regarding painful experiences and sensations. It consists of 13 items using a five-point response scale, with item anchors 0 = not at all and 4 = all the time. The total score range is 0 to 52 with higher scores indicating greater levels of pain catastrophizing. The PCS has good internal consistency α = 0.8731 and test-retest reliability over a six-week period r = 0.75.31 The PCS has demonstrated strong convergent validity such that individuals who engage in catastrophic thinking about pain endorsed more negative statements related to pain than individuals who do not.31,32 Total scores of 30 and higher are considered clinically relevant.33 In the present sample, the PCS showed excellent internal consistency across all time points (α = 0.96).
Abbreviated PTSD Checklist – Civilian Version (Abbreviated PCL-C).
The Abbreviated PCL-C34,35 is a short form of the PTSD Checklist – Civilian Version (PCL-C) that was developed to assess the traumatic response that individuals may have in response to a stressful event.36 The abbreviated PCL-C consists of six items drawn from the original 17-item PCL-C. Items are scored using a five-point response scale, with item anchors 1 = not at all to 5 = extremely. The total score range is 6 to 30, with higher scores reflecting greater traumatic responses. The abbreviated PCL-C (r = 0.97) has high sensitivity (0.80) and specificity (0.76) for detecting PTSD.34 The proposed total score cut-off to screen for PTSD for the abbreviated PCL-C is 14.34,35 In the present sample, the abbreviated PCL-C showed good internal consistency (α = 0.89). This questionnaire was administered only on a participant’s first visit to the TPS.
Sensitivity to Pain Traumatization Scale (SPTS-12)
The SPTS-1218 assesses the propensity to develop a traumatic response to pain. It consists of 12 items using a five-point response scale, with item anchors 0 = not at all true and 4 = entirely true. The total score range is 0 to 48 with higher scores indicating a more traumatic response to pain. Item 1 was from an earlier version of the SPTS-12 and was worded as “Pain keeps me awake at night” instead of the final version in which the wording was “When I am in pain, it keeps me awake at night”. The SPTS-12 has good internal consistency (α = 0.88). The SPTS-12 items are explained by a one-factor structure and has very good reliability and validity in a clinical and community sample.18 In the present sample, the SPTS-12 had excellent internal consistency across all times points (α = 0.91).
Statistical Analyses
Trajectory Analysis
Latent-class growth mixture modeling (ie GMM) for Gaussian longitudinal outcomes (ie normal distribution for error terms assumed at each time point) was used to define latent groups of distinct trajectory patterns of SPTS-12 scores across days (0 to 1583) after surgery for participants with two or more TPS visits after surgery. Analyses were conducted in R (Version 3.6.0) using the function “hlme” from the package “lcmm”.37–39 Models with 1 to 8 latent classes (or groups) were estimated with a linear term and then again with the addition of a quadratic term to account for potential curvature in trajectories; as a result, a total of 16 models was estimated. The optimal model was chosen based on the lowest Bayesian information criterion (BIC), high entropy (>80%) reflecting high confidence in group membership, and interpretability,40 and further required that each trajectory consist of at least 5% of the total participant sample. Following selection of the optimal number of trajectory groups, statistical significance of the quadratic term was used to determine if its inclusion improved the model.
Predictor Analysis
Several predictors were evaluated by entering them individually into the final trajectory model (ie a separate model was estimated for each predictor, included one-at-a-time). Predictors included participant age, sex, presence of preoperative chronic pain, preoperative MME/day, number of preoperative medical conditions, and surgery type. Predictor variables based on self-report scales were available post-surgically when participants filled out the questionnaire packages at their first visit to the TPS. These variables were baseline scores for average pain intensity, pain interference, depression, anxiety, trauma, pain catastrophizing, and MME/day. Next, significant predictors were concurrently added to the model.
Outcome Analysis
As a clinical service based on patient needs, the TPS did not restrict the time after surgery when participants were admitted to the TPS program nor were there requirements to attend the TPS at predetermined visits or for a specific number of visits. Thus, participants vary considerably regarding how soon after surgery they attended their first TPS visit, how frequently they attended the TPS, the time between TPS visits, and the total number of visits. Therefore, to improve data interpretability, five standardized reporting periods were created based on the time interval when participants were seen at the TPS after surgery: (1) up to two weeks (0–14 days), (2) three months (60–120 days), (3) six months (150–210 days), (4) one year (275–455 days), and (5) two years (550–910 days). For participants who had more than one TPS visit during a given reporting period, an average of the available scores was calculated to create one mean score for that period.
Separate one-way ANOVA analyses were used to evaluate how trajectory groups differed on outcomes at each of the five reporting periods. The outcomes were MME/day, average pain intensity, pain interference, and HADS-D. These variables were chosen due to their importance as outcomes in clinical trials on chronic pain.41 Significant omnibus tests were followed up with Tukey-Kramer post-hoc tests.42,43 To limit Type I error probability due to multiple comparisons across several ANOVAs, a more conservative alpha-level of 0.001 was used.
Results
Recruitment and Missing Data
A total of 766 participants were approached to participate in the study. Of the 544 participants who provided consent, 113 were not surgical referrals to the TPS. Sixty-one participants were excluded from analysis due to having data for only one TPS visit after surgery. For all scales, total scores were prorated by calculating the mean score of the available items and then multiplying this mean by the total number of items in the scale to create an adjusted total score.44 A given scale score was prorated only for participants who completed 80% or more of the items on that scale. Nine participants were excluded from analysis because they did not have 80% or more of the SPTS-12 completed on at least two TPS visits. The final sample consisted of 361 participants who provided consent, underwent surgery, had data from at least two TPS visits, and had sufficient data on the SPTS-12 (at least 80% of the SPTS-12 completed on at least two TPS visits). See Figure 1 for a diagram of the recruitment and retention of participants.
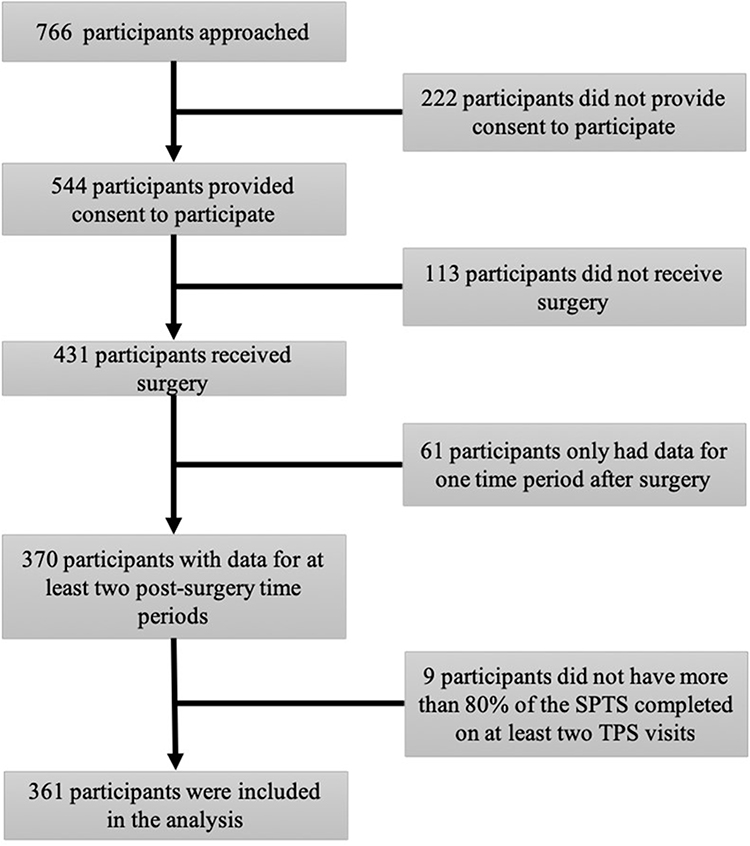 |
Figure 1 Flow diagram of participant recruitment and retention. |
Participant Characteristics
Of the 361 participants included in the final analysis, the mean age was 50.6 years (SD = 14.3) and 55.4% (n = 200) were male. Data on participant ethnicity was not available. The number of participant visits to the TPS ranged from 2 to 68 (M = 7.39, SD = 8.00; see Figure 2), with n = 291 participants having three or more visits, n = 185 having five or more visits, and n = 81 having 10 or more visits. The number of days between surgery and the first visit to the TPS ranged from 0 to 585 (M = 19.1, SD = 45.9). The number of days between surgery and hospital discharge ranged from 0 to 281 (M = 13.0, SD = 21.3).
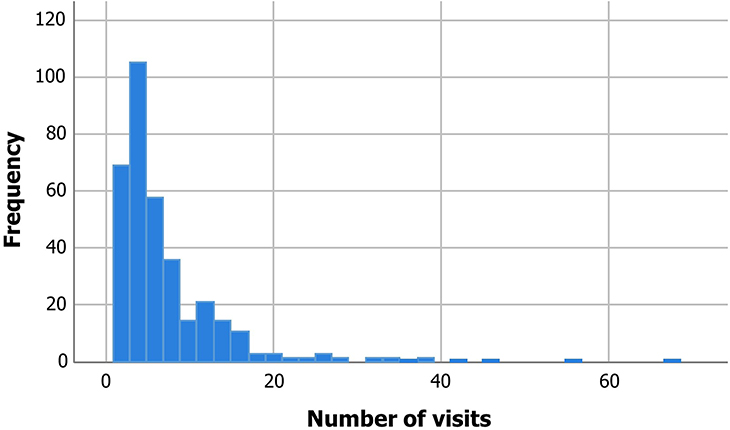 |
Figure 2 Histogram displaying the frequency of participant visits to the Transitional Pain Service after surgery. |
Preoperative diagnoses included the following (non-mutually-exclusive): chronic pain (56.5%), cancer (50.3%), gastroesophageal reflux disease (50.2%), hypertension (45.6%), arthritis (38.4%), diabetes mellitus (25.6%), thyroid disease (19.2%), peripheral vascular disease (11.4%), chronic obstructive pulmonary disease (14.9%), asthma (15.0%), anemia (15.2%), sleep apnea (12.9%), chronic kidney failure (10.8%), congestive heart failure (10.4%), angina (10.8%), peptic ulcer disease (10.0%), myocardial infarction (10.0%), and deep vein thrombosis (9.1%). The number of preoperative diagnoses ranged between 0 and 20 (M = 3.5, SD = 2.5, n = 276). The number of medications that participants reported taking preoperatively ranged from 0 to 22 (M = 6.4, SD = 4.6, n = 275).
Surgery type included thoracic (24.7%), transplant (16.4%), general (11.7%), cardiac (10.8%), ear, nose, and throat (10.0%), vascular (8.6%), obstetrical/gynecological (3.9%), multiple surgeries (3.9%), plastic (3.3%), neurological (3.3%), urologic (2.8%), and orthopedic (0.8%).
Descriptive Statistics
Descriptive statistics for the questionnaire data and MME/day for the complete sample are displayed in Table 1 according to the reporting period after surgery.
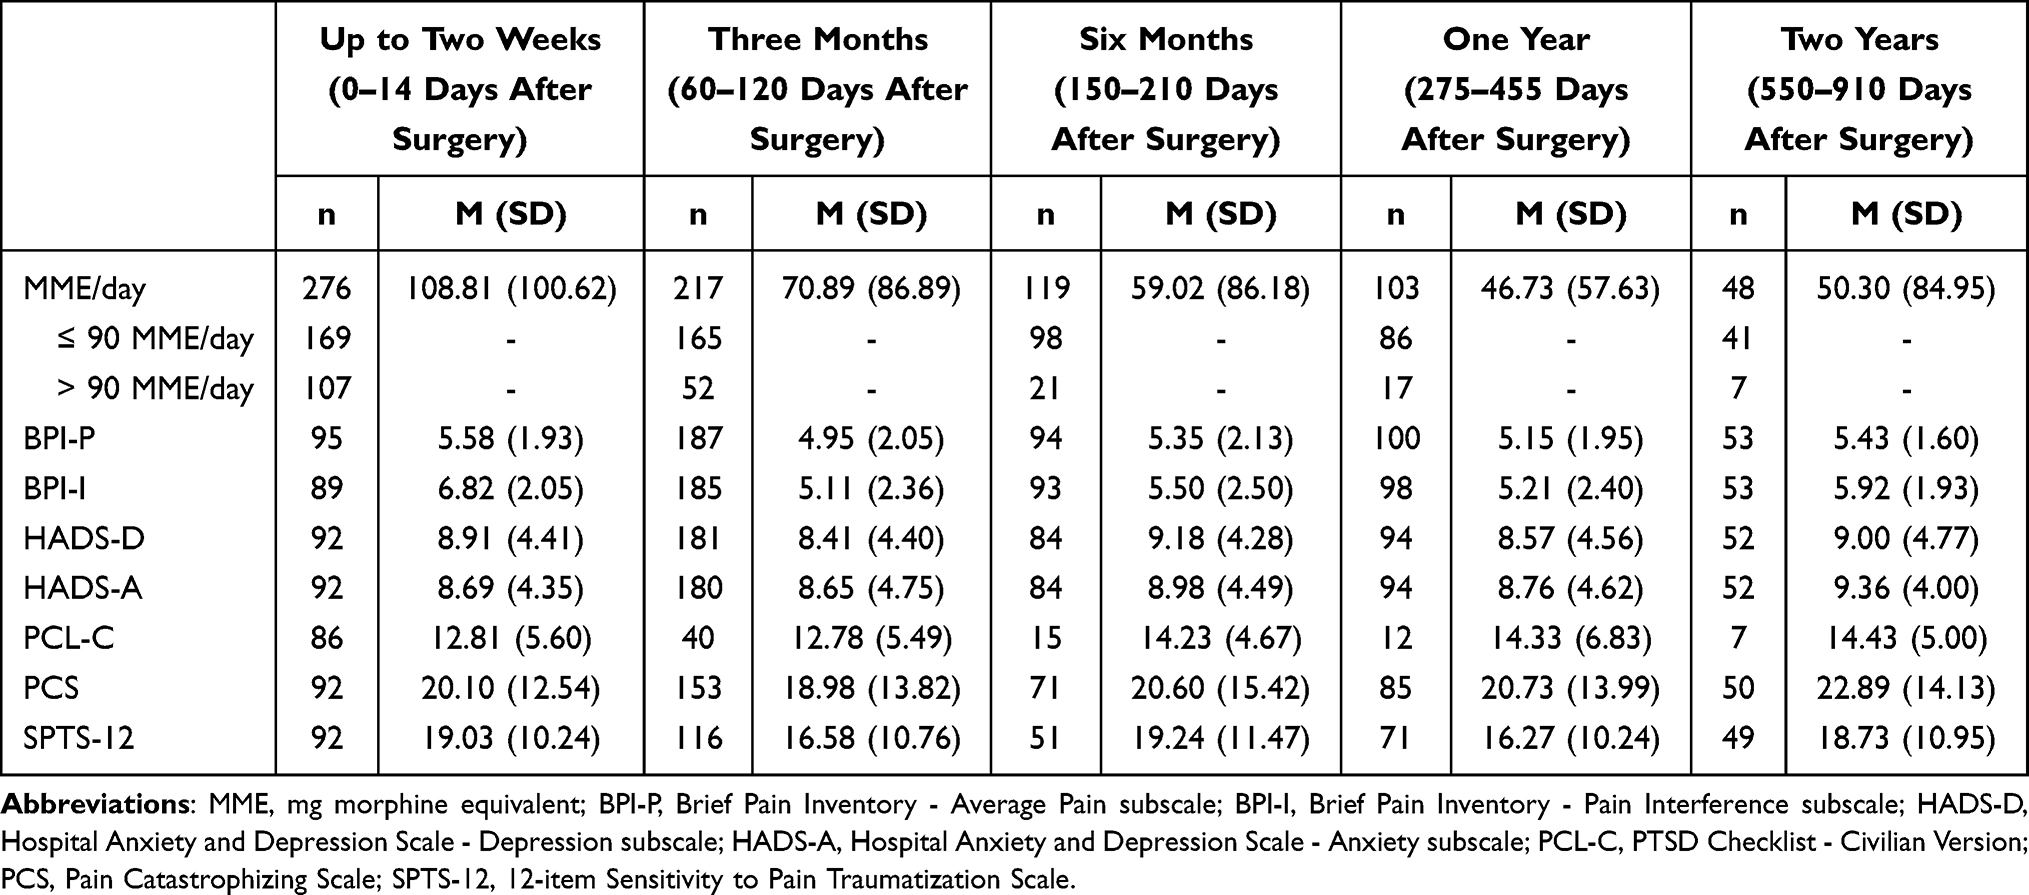 |
Table 1 Descriptive Data for the Total Sample (N = 361) |
SPTS-12 Growth Mixture Models
Model fit indices for the 16 GMMs of SPTS-12 total scores across time are displayed in Table 2. The best model consisted of five SPTS-12 trajectory groups for models tested (1) with linear terms and (2) with linear and quadratic terms. In the five-group model with quadratic terms, the quadratic term was non-significant in each of the trajectory groups (ps > 0.10). (Only the one-group model had a significant quadratic term; p = 0.005). The five-group linear model also has a lower BIC than the five-group quadratic model. Therefore, the final model consisted of five linear trajectory groups, with each of the five groups composed of more than 5% of the sample. See Table 3 for estimates of the final model.
 |
Table 2 Model Fit Indices for Sensitivity to Pain Traumatization Scale (SPTS-12) Scores |
 |
Table 3 Estimates for the Final Five Trajectory Group Model of the Sensitivity to Pain Traumatization Scale (SPTS-12) |
Figure 3 shows the mean SPTS-12 trajectories for the five groups. Descriptive characteristics of the five groups by reporting period are in Tables 4–8. Trajectory 1 is the largest group, consisting of 154 participants with a mean age of 50.79 years (SD = 14.99) and 56.49% (n = 87) are male. The SPTS-12 scores for this group start low (predicted value of SPTS-12 three days after surgery = 9.01) and remain low (predicted value of SPTS-12 two years after surgery = 7.20), significantly decreasing over time (p = 0.039). Trajectory 2 consists of 66 participants with a mean age of 54.09 years (SD = 12.71); 65.15% (n = 43) are male. This group starts with high SPTS-12 scores (predicted value of SPTS-12 three days after surgery = 27.63) that decrease significantly (p = 0.018; predicted value of SPTS-12 two years after surgery = 25.46;). Trajectory 3 consists of 62 participants with a mean age of 48.48 years (SD = 13.46); 50.00% (n = 31) are female. The SPTS-12 scores for this group start out moderate (predicted value of SPTS-12 three days after surgery = 16.04) and do not change significantly (p = 0.095; predicted value of SPTS-12 two years after surgery = 19.48;). Trajectory 4 consists of 43 participants with a mean age of 49.51 years (SD = 15.59); 48.84% (n = 22) are male. This group has the steepest downward slope, with the predicted SPTS-12 scores significantly (p < 0.001) dropping from 21.17 three days after surgery to 11.33 two years after surgery. Trajectory 5 consists of 36 participants with a mean age of 48.22 years (SD = 13.45); 50.00% (n = 18) are female. This trajectory starts as the worst off with the highest SPTS-12 scores (predicted value of SPTS-12 three days after surgery = 36.85), which did not significantly decrease (p = 0.415; predicted value of SPTS-12 two years after surgery = 37.82;).
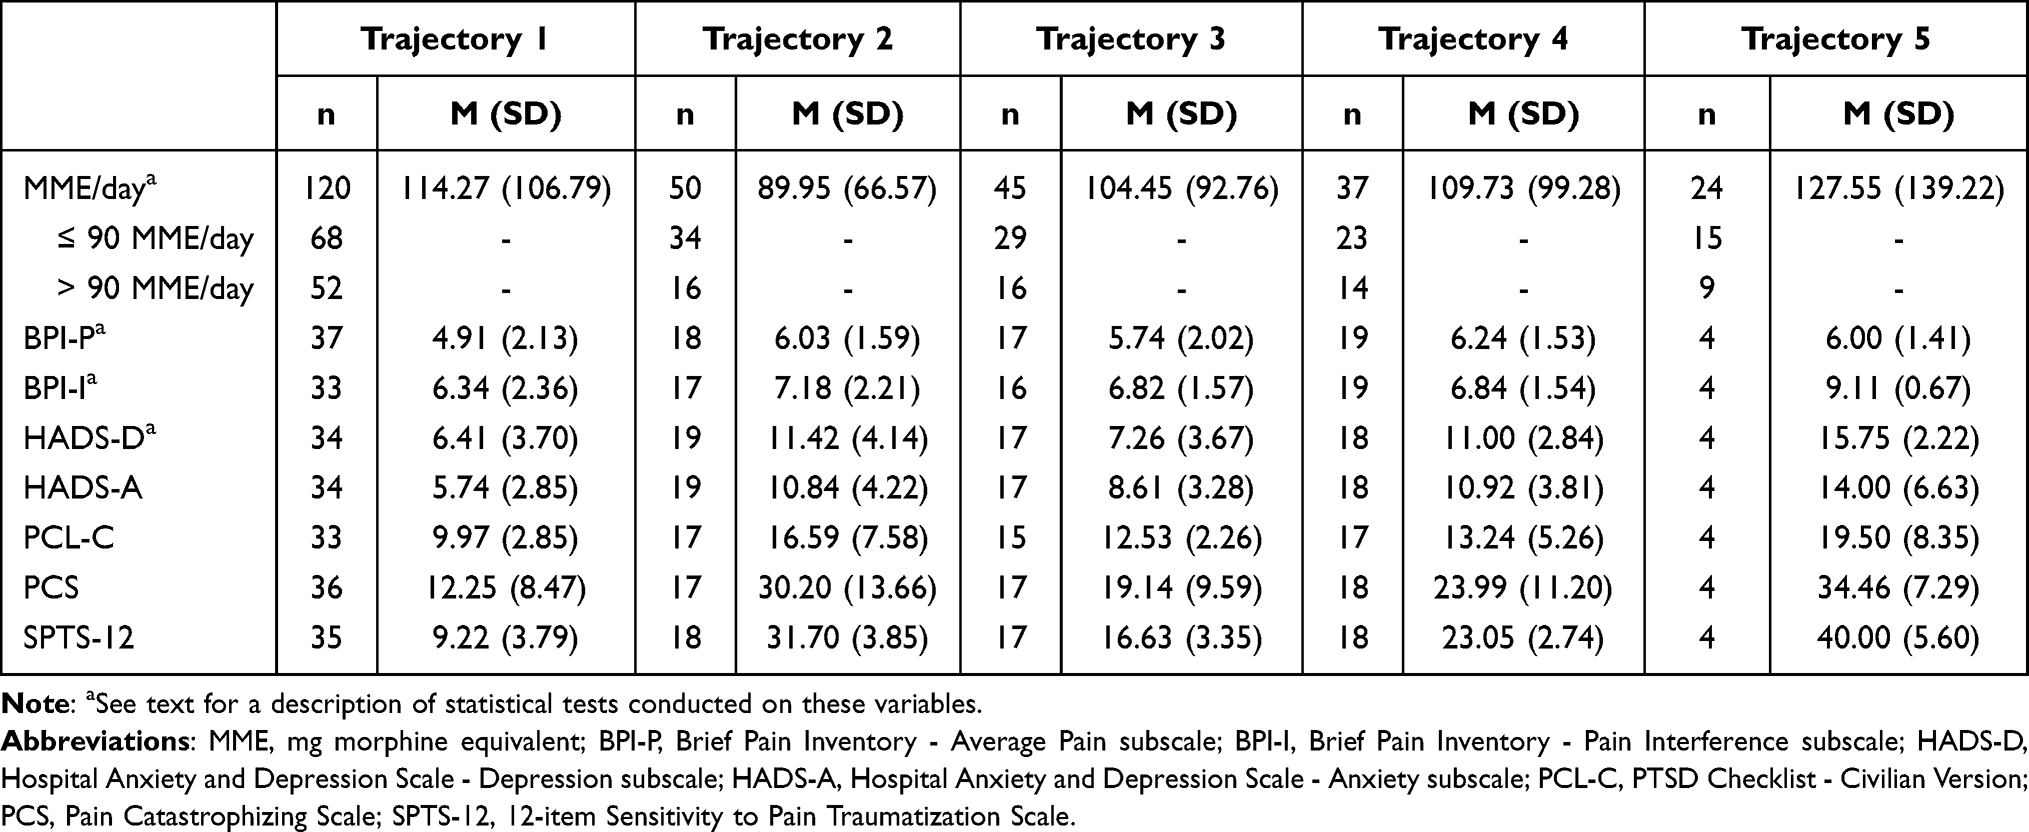 |
Table 4 Descriptive Data for the Sensitivity to Pain Traumatization Scale (SPTS-12) Trajectory Groups for the Final Model Up to Two Weeks (0–14 Days) After Surgery |
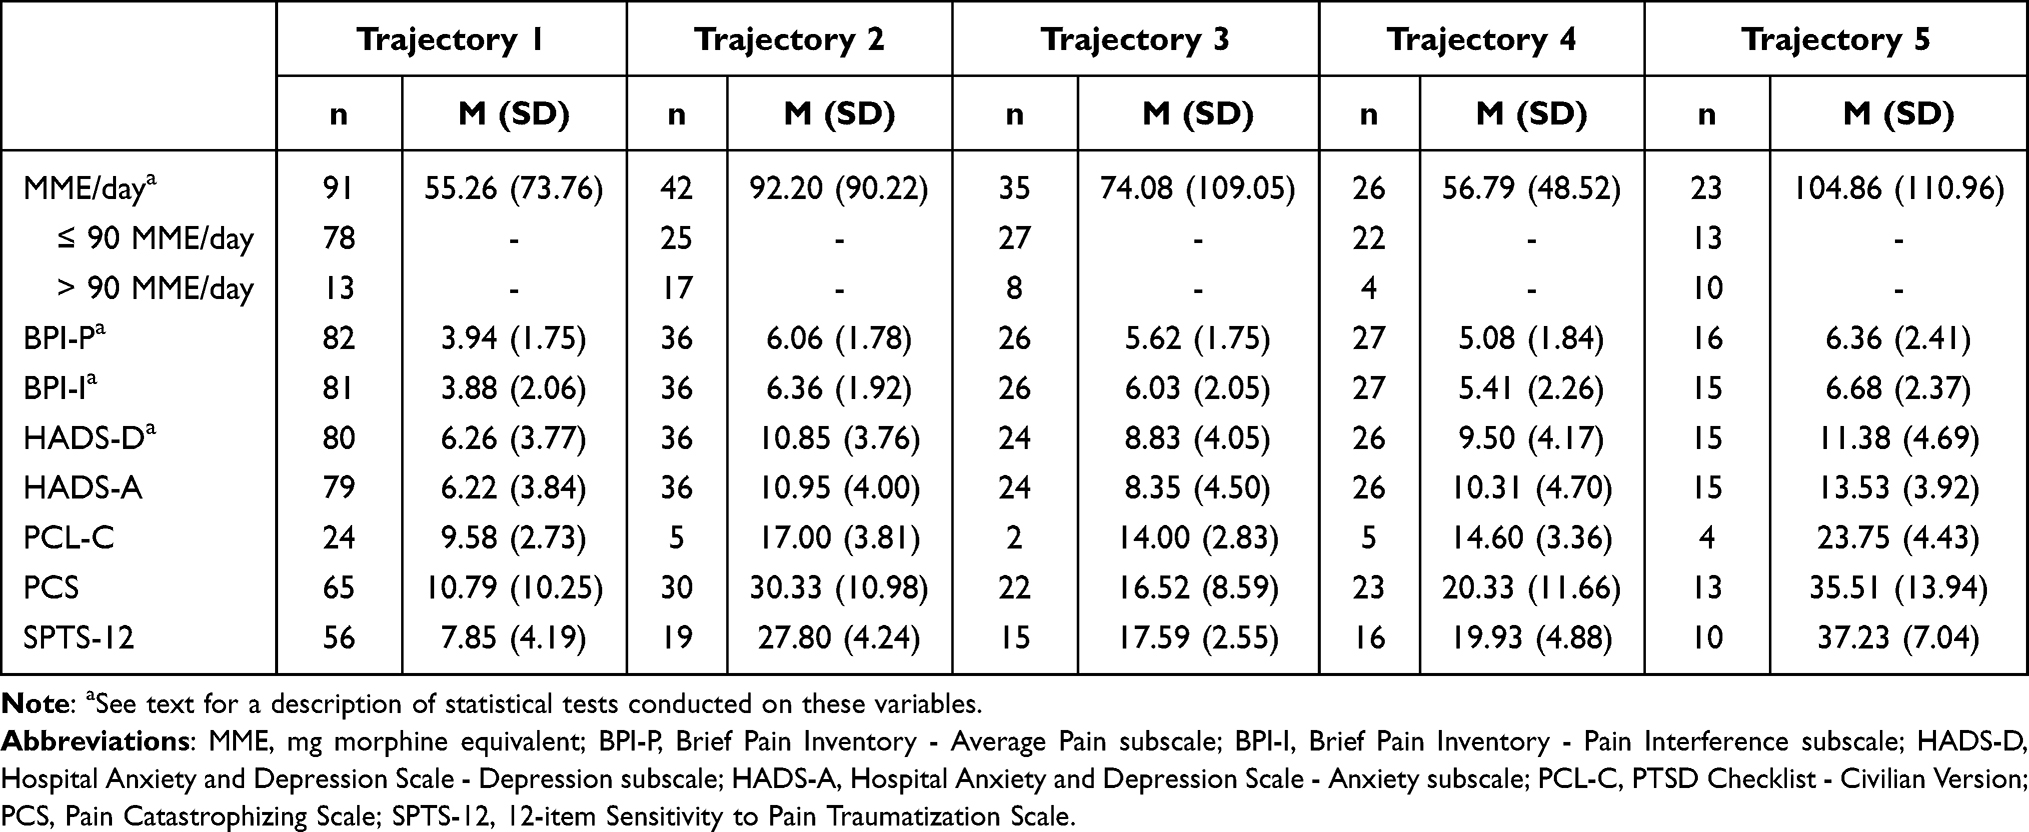 |
Table 5 Descriptive Data for the Sensitivity to Pain Traumatization Scale (SPTS-12) Trajectory Groups for the Final Model Three Months (60–120 Days) After Surgery |
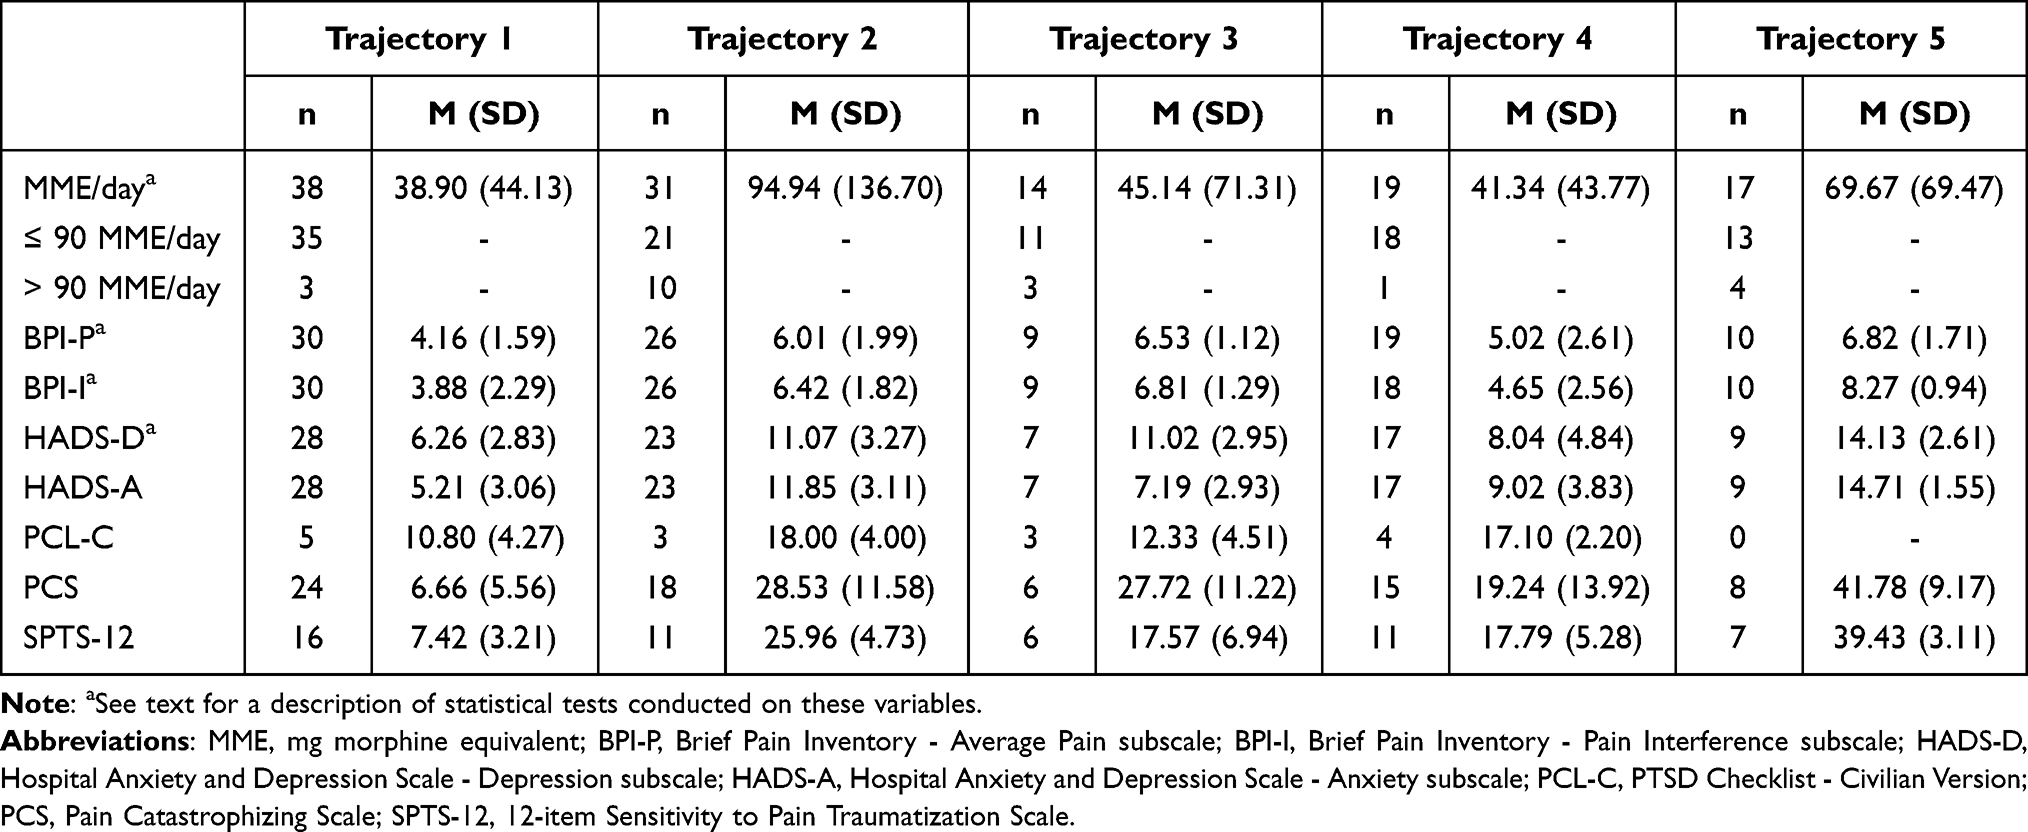 |
Table 6 Descriptive Data for the Sensitivity to Pain Traumatization Scale (SPTS-12) Trajectory Groups of the Final Model Six Months (150–210 Days) After Surgery |
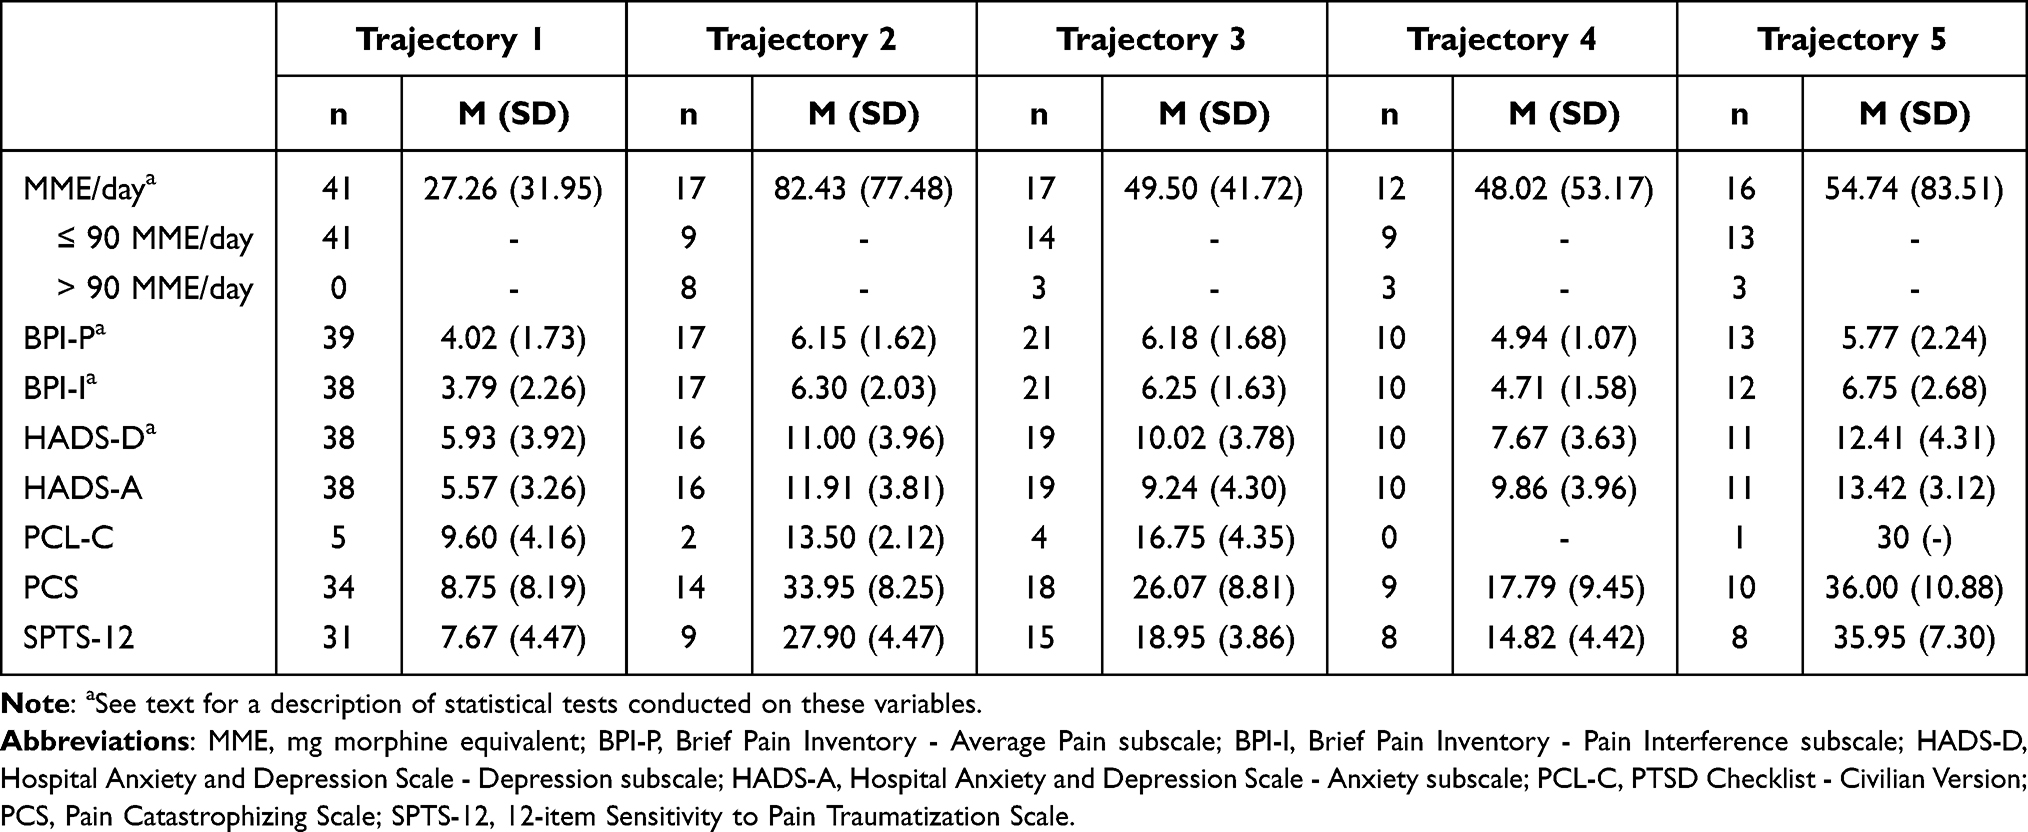 |
Table 7 Descriptive Data for the Sensitivity to Pain Traumatization Scale (SPTS-12) Trajectory Groups for the Final Model One Year (275–455 Days) After Surgery |
 |
Table 8 Descriptive Data for the Sensitivity to Pain Traumatization Scale (SPTS-12) Trajectory Groups for the Final Model Two Years (550–910 Days) After Surgery |
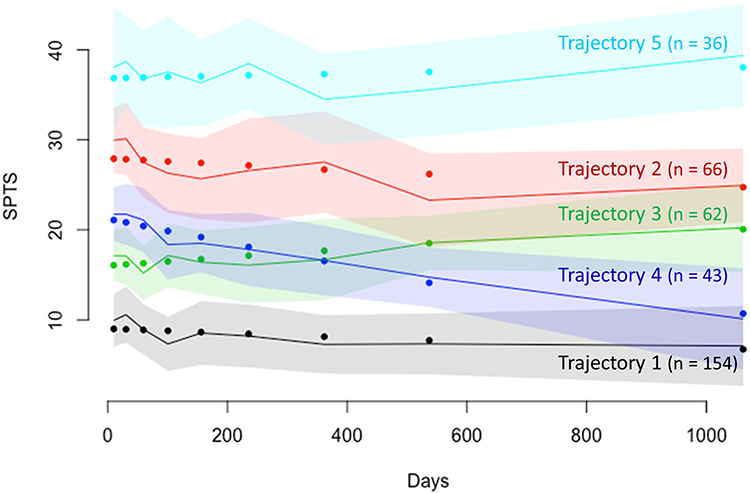 |
Figure 3 Trajectory groups of Sensitivity to Pain Traumatization Scale (SPTS-12) scores over days since surgery for the five-trajectory model. Predicted values are shown by the dots; observed values by the solid lines; and colored shading above and below each line shows the 95% confidence interval. |
Predictor Analysis
Each of the 13 predictors was individually added to the model. Depression, anxiety, and pain catastrophizing significantly predicted SPTS-12 trajectory group membership (see Table 9). However, when these predictors were included simultaneously, the complete-case sample size dropped to n = 89; therefore, these results are not reported.
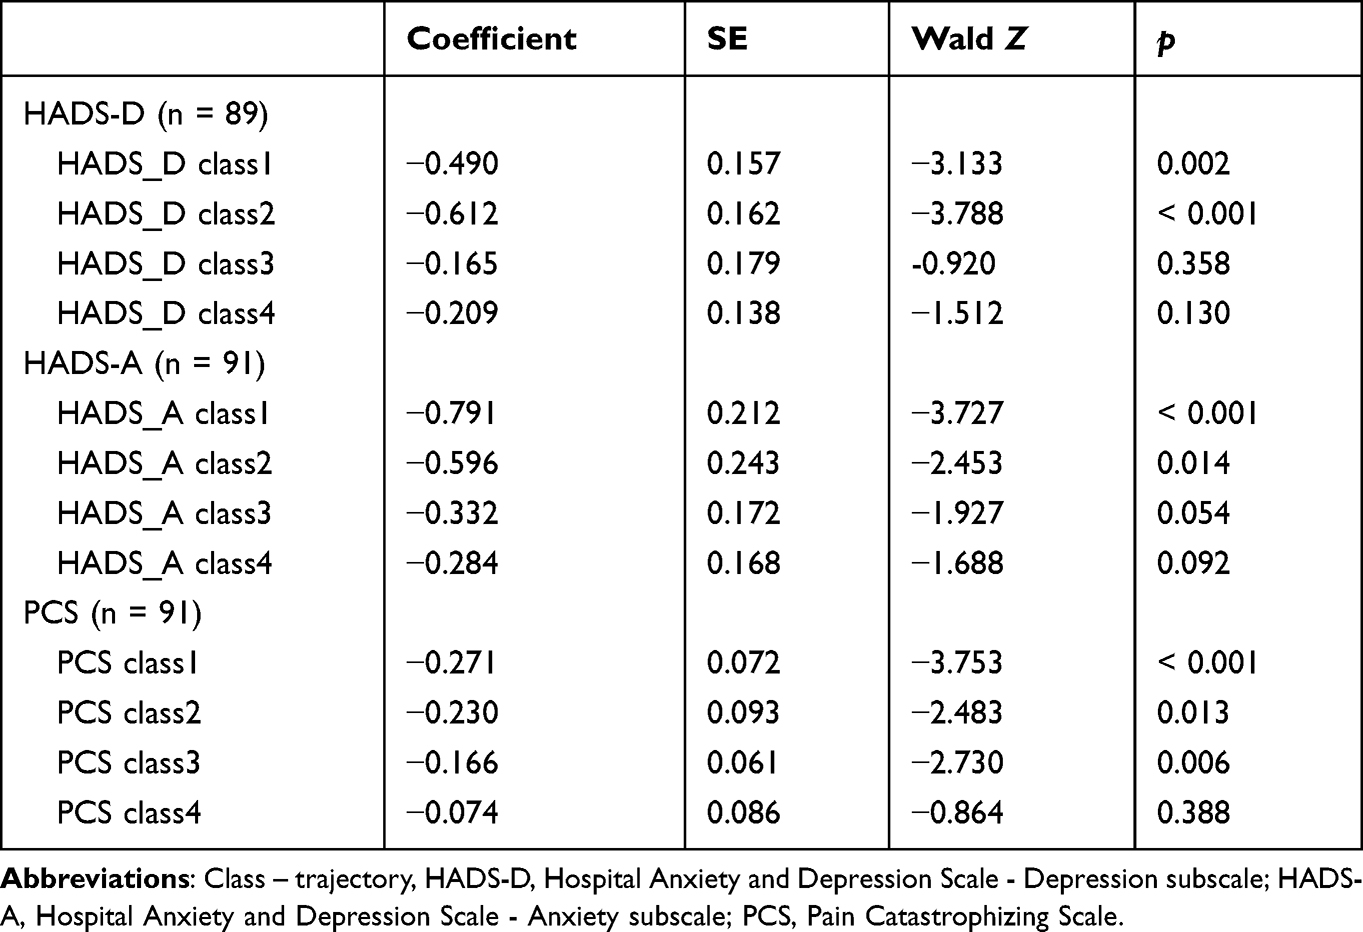 |
Table 9 Fixed Effect Estimates of the Three Significant Predictors, Depression, Anxiety, and Pain Catastrophizing Using Trajectory 5 of the Sensitivity to Pain Traumatization Scale (SPTS-12) as the Reference Trajectory |
Outcome Analysis
Figures 4–7 show how mean MME/day, average pain, pain interference, and depression scores change over time after surgery within each of the five SPTS-12 trajectory groups.
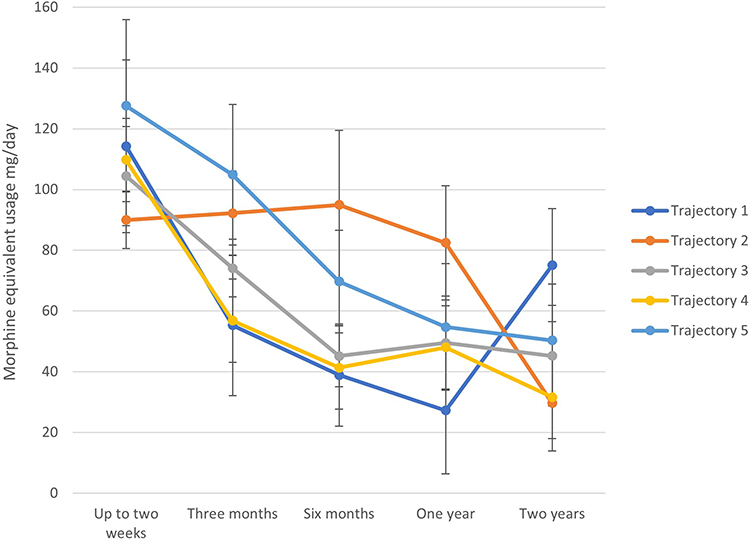 |
Figure 4 Reported mean rates of mg morphine equivalent usage per day over time after surgery for the five Sensitivity to Pain Traumatization Scale (SPTS-12) trajectory groups. Bars represent standard error of the mean. |
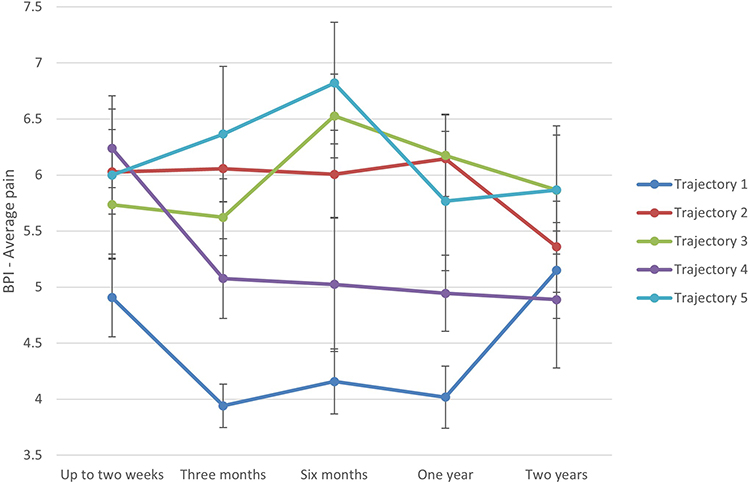 |
Figure 5 Reported mean pain ratings assessed with the Brief Pain Inventory (BPI) over time after surgery for the five Sensitivity to Pain Traumatization Scale (SPTS-12) trajectory groups. Bars represent standard error of the mean. |
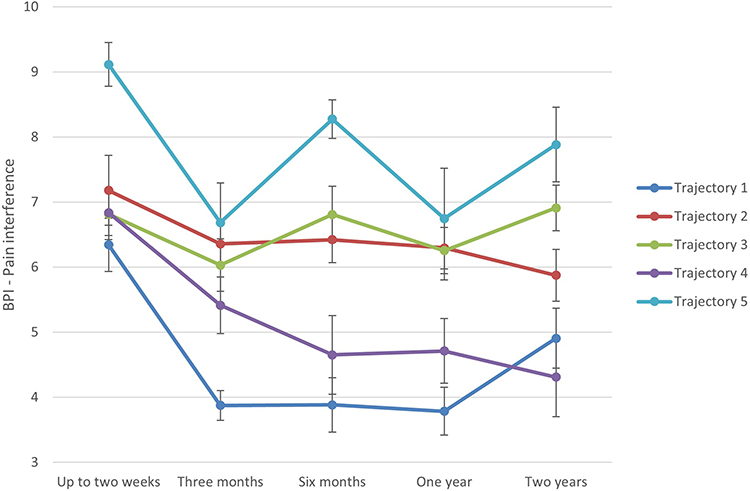 |
Figure 6 Reported mean pain interference ratings assessed with the Brief Pain Inventory (BPI) over time after surgery for the five Sensitivity to Pain Traumatization Scale (SPTS-12) trajectory groups. Bars represent standard error of the mean. |
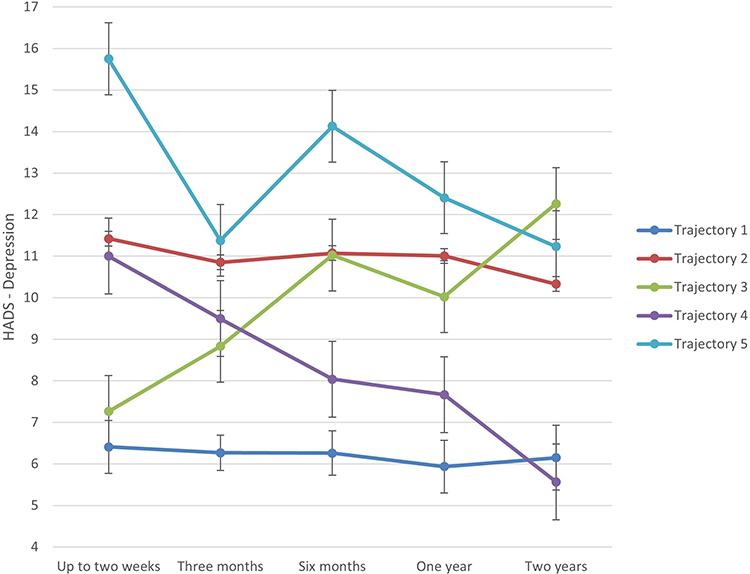 |
Figure 7 Reported mean depression ratings assessed with the Hospital Anxiety and Depression Scale (Hads) over time after surgery for the five Sensitivity to Pain Traumatization Scale (SPTS-12) trajectory groups. Bars represent standard error of the mean. |
MME/Day
Up to two weeks after surgery, MME/day did not significantly differ across trajectory groups, F(4, 271) = 0.76, p = 0.56. Three months after surgery, there were significant differences across trajectory groups, F(4, 212) = 2.50, p = 0.04, but none of the post-hoc tests were significant. Six months after surgery, trajectory groups did not significantly differ, F(4, 114) = 2.32, p = 0.06. One year after surgery, there were significant differences across trajectory groups, F(4, 98) = 3.13, p = 0.018, but none of the post-hoc tests were significant. Two years after surgery, trajectory groups did not significantly differ, F(4, 43) = 0.53, p = 0.72.
Average Pain Intensity
Up to two weeks after surgery, average pain intensity assessed with the BPI did not significantly differ across trajectory groups, F(4, 90) = 2.09, p = 0.09. Three months after surgery, there were significant differences across the trajectory groups, F(4, 182) = 12.78, p < 0.001. Post-hoc tests showed that pain intensity for SPTS-12 Trajectory 1 (M = 3.94, SD = 1.75) was significantly lower than that for SPTS-12 Trajectory 2 (M = 6.06, SD = 1.78, p < 0.001), SPTS-12 Trajectory 3 (M = 5.62, SD = 1.75, p = 0.001), and SPTS-12 Trajectory 5 (M = 6.36, SD = 2.41, p < 0.001). Six months after surgery, there were significant differences between groups, F(4, 89) = 6.04, p < 0.001, but none of the post-hoc tests were significant. One year after surgery, there were significant differences between groups, F(4, 95) = 7.92, p < 0.001. Post-hoc tests showed that pain intensity for SPTS-12 Trajectory 1 (M = 4.02, SD = 1.73) was significantly lower than that for SPTS-12 Trajectory 2 (M = 6.15, SD = 1.62, p < 0.001) and SPTS-12 Trajectory 3 (M = 6.18, SD = 1.68, p < 0.001). Two years after surgery, trajectory groups did not significantly differ, F(4, 48) = 0.66, p = 0.62.
Pain Interference
Up to two weeks after surgery, average pain interference assessed with the BPI did not significantly differ across trajectory groups, F(4, 84) = 1.91, p = 0.12. Three months after surgery, there were significant differences across the trajectory groups, F(4, 180) = 13.83, p < 0.001. Post-hoc tests showed that pain interference scores for SPTS-12 Trajectory 1 (M = 3.88, SD = 2.06) were significantly lower than those for SPTS-12 Trajectory 2 (M = 6.36, SD = 1.92, p < 0.001), SPTS-12 Trajectory 3 (M = 6.03, SD = 2.05, p < 0.001), and SPTS-12 Trajectory 5 (M = 6.68, SD = 2.37, p < 0.001). Six months after surgery, there were significant differences between groups, F(4, 88) = 12.35, p < 0.001. Post-hoc tests showed that pain interference scores for SPTS-12 Trajectory 1 (M = 3.88, SD = 2.29) were significantly lower than those from SPTS-12 Trajectory 2 (M = 6.42, SD = 1.82, p < 0.001) and SPTS-12 Trajectory 5 (M = 8.27, SD = 0.94, p < 0.001). Furthermore, pain interference scores for SPTS-12 Trajectory 4 (M = 4.65, SD = 2.56) were significantly lower than those for SPTS-12 Trajectory 5 (M = 8.27, SD = 0.94, p < 0.001). One year after surgery, there were significant differences between groups, F(4, 93) = 8.58, p < 0.001. Post-hoc tests showed that pain interference scores for SPTS-12 Trajectory 1 (M = 3.79, SD = 2.26) were significantly lower than those for SPTS-12 Trajectory 2 (M = 6.30, SD = 2.03, p = 0.001), SPTS-12 Trajectory 3 (M = 6.25, SD = 1.63, p < 0.001), and SPTS-12 Trajectory 5 (M = 6.75, SD = 2.68, p < 0.001). Two years after surgery, there were significant differences between groups, F(4, 48) = 7.73, p < 0.001. Post-hoc tests showed that pain interference scores for SPTS-12 Trajectory 1 (M = 4.91, SD = 1.90) were significantly lower than those for SPTS-12 Trajectory 5 (M = 7.88, SD = 1.62, p < 0.001). Furthermore, pain interference scores for SPTS-12 Trajectory 4 (M = 4.31, SD = 1.50) were significantly lower than those for SPTS-12 Trajectory 5 (M = 7.88, SD = 1.62, p = 0.001).
Depression
Up to two weeks after surgery, average depression assessed with the HADS-D differed significantly across trajectory groups, F(4, 87) = 12.44, p < 0.001. Post-hoc tests showed that HADS-D scores for Trajectory 1 (M = 6.41, SD = 3.70) were significantly lower than those for SPTS-12 Trajectory 2 (M = 11.42, SD = 4.14, p < 0.001), SPTS-12 Trajectory 4 (M = 11.00, SD = 2.84, p < 0.001), and SPTS-12 Trajectory 5 (M = 15.75, SD = 2.22, p < 0.001). Three months after surgery, there were significant differences across trajectory groups, F(4, 176) = 12.05, p < 0.001. Post-hoc tests showed that HADS-D scores for SPTS-12 Trajectory 1 (M = 6.26, SD = 3.77) were significantly lower than those for SPTS-12 Trajectory 2 (M = 10.85, SD = 3.76, p < 0.001) and SPTS-12 Trajectory 5 (M = 11.38, SD = 4.69, p < 0.001). Six months after surgery, there were significant differences between groups, F(4, 79) = 12.44, p < 0.001. Post-hoc tests showed that HADS-D scores for SPTS-12 Trajectory 1 (M = 6.26, SD = 2.83) were significantly lower than those for SPTS-12 Trajectory 2 (M = 11.07, SD = 3.27, p < 0.001) and SPTS-12 Trajectory 5 (M = 14.13, SD = 2.61, p < 0.001). Furthermore, HADS-D scores for SPTS-12 Trajectory 4 (M =8.04, SD = 4.84) were significantly lower than those for SPTS-12 Trajectory 5 (M = 14.13, SD = 2.61, p < 0.001). One year after surgery, there were significant differences between groups, F(4, 89) = 9.27, p < 0.001. Post-hoc test showed that HADS-D scores for SPTS-12 Trajectory 1 (M = 5.93, SD = 3.92) were significantly lower than those for SPTS-12 Trajectory 2 (M = 11.00, SD = 3.96, p < 0.001) and SPTS-12 Trajectory 5 (M = 12.41, SD = 4.31, p < 0.001). Two years after surgery, there were significant differences between groups, F(4, 47) = 6.01, p = 0.001, but none of the post-hoc tests were significant.
Discussion
The aim of the present study was to further validate the SPTS-12 by examining its patterns of change and predictive validity over a two-year period in postsurgical patients seen by the TPS. Growth mixture modeling (GMM) was used to define groups characterized by distinct latent trajectories of SPTS-12 scores over the two-year postsurgical interval. The optimally fitting model consisted of five SPTS-12 trajectories, two characterized by a flat and unchanging pattern, and three showing a small but statistically significant decrease over time. Analysis of pain-related outcomes predicted by SPTS-12 trajectories provided evidence of criterion validity of the SPTS-12. Average pain intensity, pain interference, and depression scores significantly differed across trajectory groups at two or more postsurgical visits, but SPTS-12 trajectory groups did not significantly differ on MME/day at any timepoint. Taken together, the present study supported the ability of the SPTS-12 to predict important pain-related outcomes over time.
The identification of five distinct SPTS-12 trajectory patterns highlights the heterogeneity of pain-related trauma symptoms among individuals after surgery. This heterogeneity would not have been evident using the sample average, as is typically done in most prospective studies of patients after surgery. To illustrate this point, the single-trajectory model of SPTS-12 scores (Figure 8) shows a pattern of SPTS-12 scores that begin moderately high, decrease gradually, and then start to increase approximately one and a half years after surgery. This model does not adequately capture the nuanced fluctuations of subgroups with different growth curves, and thus misrepresents the symptom experience of many individuals after surgery. Accordingly, this heterogeneity has implications for treatment recommendations: Knowing that an individual has a high SPTS-12 score at the outset of treatment could introduce an opportunity to intervene and address the symptoms related to a traumatic response to pain.
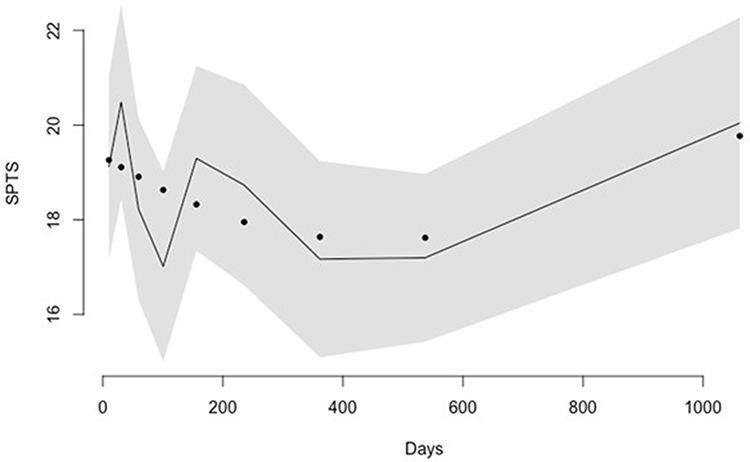 |
Figure 8 Trajectory of Sensitivity to Pain Traumatization Scale (SPTS-12) scores over days since surgery for the one-trajectory model, including the quadratic term. Predicted values are shown by the dots; observed values by the solid line; and the shading above and below the line shows the 95% confidence interval. |
The GMM analysis supported a five-group model of SPTS-12 score trajectories across time. Trajectory 1 was the largest group (42.7% of the sample) and showed the best overall outcome, with SPTS-12 scores starting low and remaining low. Overall, individuals in Trajectory 1 did not endorse experiencing symptoms suggesting that they were experiencing a traumatic response to pain after surgery. Moreover, their mean scores on the PCL-C at each timepoint did not exceed the proposed cut-off score to screen for PTSD,34,35 nor were the group means for depression, anxiety, or pain catastrophizing in the clinically relevant range.28,33 These findings are consistent with previous research showing that most individuals who undergo surgery do not develop problematic mental health symptoms.7–9,45
Trajectory 3 started with the next lowest SPTS-12 scores, which remained stable over time. This group’s mean scores met clinical cut-offs for depression symptoms at six months and at two years after surgery, for anxiety two years after surgery, and for trauma at three months and at one year after surgery. Individuals in Trajectory 4 showed the steepest decrease in SPTS-12 scores, starting at a mean of 21 three days after surgery and decreasing nearly in half two years later. Higher initial mean SPTS-12 scores were associated with depression and anxiety scores that met clinical cut-offs up to two weeks after surgery. On average, the proposed abbreviated PCL-C cut-off score to screen for PTSD was exceeded at three months and at one year after surgery.
Trajectories 2 and 5 were the worst off, with both groups starting high in SPTS-12 scores suggestive of a traumatic response to pain. SPTS-12 scores for Trajectory 2 showed statistically significant mean decrease, but the reduction was slight from a clinical perspective. In contrast, SPTS scores for Trajectory 5 remained consistently high across the two-year interval. For Trajectories 2 and 5, mean scores on the abbreviated PCL-C exceeded the proposed cut-off score for PTSD at all available timepoints. Moreover, both trajectory groups had mean scores above the clinically relevant range for depression and anxiety at all timepoints, with high reported levels of pain catastrophizing at most timepoints. Together, Trajectories 2 and 5 comprised 28.3% of the sample, demonstrating that a sizable proportion of participants endorsed considerable psychological distress. These estimates are similar to rates of anxiety and depression identified in previous research. For example, in a sample of heart-lung transplant recipients, Stilley et al46 found that depression and anxiety were clinically significant in 26.5% and 34.6% of patients up to a year and a half after surgery. In addition, researchers have estimated that probable PTSD diagnoses are present in 15–20% of patients after surgery.7–9 The higher rates of catastrophic thinking in response to pain comprise a unique finding which is important because individuals reporting higher PCS scores experience more pain for a longer duration after surgery.47–49
It is important to note that the present study examined a complex heterogenous sample of patients, which in the context of a trajectory analysis, is a strength. The mean number of preoperative diagnoses that participants had was 3.54 and included cancer, chronic obstructive pulmonary disease, and congestive heart disease. Furthermore, the type of surgery that participants underwent was diverse. It is possible that the pattern of findings would differ according to a specific diagnosis or surgery. For example, thoracic surgery is associated with some of the highest incidence rates of chronic pain after surgery, with a recent meta-analysis estimating that six months after thoracotomy, 47% of patients report pain,50 whereas modified radical mastectomy is associated with chronic pain incidence of 10% to 15% one year after surgery.51 Thus, it is possible that individuals who undergo a more painful surgery will score higher on the SPTS-12 following the surgery. Although it has been suggested that psychological factors are more important than surgery type,52 future research should examine differences in SPTS-12 scores and their trajectories based on surgery type.
There has been considerable empirical research on the relationship between chronic pain and trauma as well as theoretical models explaining why the two conditions tend to co-occur so frequently. Recently, Rosenbloom et al16 proposed a combined shared vulnerability and mutual maintenance model of chronic pain disability that includes both psychological and biological vulnerabilities. The primary psychological factors in the model include anxiety sensitivity and sensitivity to pain traumatization as diatheses. The biological vulnerabilities in the model may be related to sensitivity in the hypothalamic-pituitary-adrenal axis and a low threshold startle reflex. In the context of these diatheses and following exposure to a traumatic event such as major surgery, fear avoidance reactions to pain and traumatic stress symptoms activate mutual maintenance processes that increase the likelihood that both chronic pain and posttraumatic stress symptoms will develop.
Not surprisingly, and consistent with the combined shared vulnerability and mutual maintenance model of chronic pain disability16 , the results of the present study show strong relationships between high scores on the SPTS-12 (eg, Trajectories #2 and #5) and both pain intensity and pain interference scores. In the months after surgery, reported pain intensity and pain interference levels begin to significantly differ across SPTS-12 trajectories, with individuals in Trajectory 1 consistently reporting the lowest levels of both variables. As the SPTS-12 measures a traumatic response to pain, it stands to reason that pain intensity and pain interference would be higher for individuals in SPTS-12 trajectories characterized by more symptoms. For example, with higher levels of reported pain intensity and pain interference, it is more likely that individuals will report more avoidance of pain and higher sensitivity to pain. Furthermore, this effect may be bidirectional, wherein psychological factors can in themselves contribute to an individual’s reported pain experience.15,53,54
Another point worth mentioning is that among postsurgical patients with a cancer diagnosis, posttraumatic stress symptoms may develop from living with daily pain. Pain serves as a reminder of the cancer,55 living with a diagnosis of cancer56 as well as the threat of or an actual recurrence of cancer.57 It is also possible that the posttraumatic stress symptoms may be due to a previous unrelated traumatic event.58 In the present study, ~50% of the participants had undergone surgery for cancer thereby reinforcing the connection between SPTS-12 scores and pain outcomes, especially among participants in the problematic trajectories #2 and #5.
Limitations
The present study has limitations. Given that these data were collected as part of an ongoing clinical service, participants did not attend the TPS for a fixed number of appointments at pre-determined timepoints. Consequently, the number of participant appointments varied greatly as did the number of days between surgery and the first visit to the TPS, and the intervals between visits. Generalizability is likely affected in that individuals who experienced more pain intensity, pain interference, and psychological distress may have attended appointments more frequently and for a longer period after surgery than individuals whose pain and psychological dysfunction were less severe. To some degree, these considerations may be offset by the trajectory analyses which grouped similar participants together. Follow-up research is needed to ensure the consistency of the present findings in the TPS.
Second, there was a considerable amount of missing data from participants not completing all questionnaire items. Whereas 361 participants had complete data for the SPTS-12, only 89 participants also had completed at least 80% of other questionnaires included in the package. For this reason, the final SPTS-12 trajectory model was unable to include important predictors (ie depression, anxiety, and pain catastrophizing); these were instead assessed in post-hoc analyses.
Conclusion
The SPTS-12 shows fairly stable patterns over time within the 5 distinct trajectories identified. Two SPTS-12 trajectories (#2 and #5) with high scores, comprising ~28% of the total sample, are associated with problematic outcomes on several pain (intensity and interference) and psychosocial measures (depression, trauma). The SPTS-12 predicts important pain-related and psychosocial outcomes over time. Targeting patients with high SPTS-12 scores before and early on after surgery for psychological treatment of pain and trauma symptoms may prove beneficial in reducing the impact of CPSP later in the course of surgical recovery.
Acknowledgments
The present study was conducted in partial fulfillment of Samantha Fashler’s doctoral degree at York University and is based on Dr. Fashler’s dissertation titled “Validation of the Sensitivity to Pain Traumatization Scale”. Samantha Fashler was supported by a Canadian Institutes of Health Research (CIHR) Vanier Canada Graduate Scholarship. Joel Katz is supported by a CIHR Canada Research Chair in Health Psychology at York University. M. Gabrielle Pagé is a Junior 1 Research Scholar from the Fonds de recherche du Québec en santé. Hance Clarke is supported by a Merit Award from the Department of Anesthesiology and Pain Medicine at the University of Toronto. The research in this manuscript was accepted as a poster presentation at the Canadian Pain Society in May 2020.
Disclosure
M. Gabrielle Pagé received a grant from Pfizer Canada ULC and honoraria from Canopy Growth for work unrelated to the present study. Dr Samantha R Fashler reports grants from Canadian Institutes of Health Research (CIHR), during the conduct of the study. Dr Joel Katz reports grants from York University, during the conduct of the study. The authors report no other conflicts of interest in this work.
References
1. Kehlet H, Jensen TS, Woolf CJ. Persistent postsurgical pain: risk factors and prevention. Lancet. 2006;367(9522):1618–1625. doi:10.1016/S0140-6736(06)68700-X
2. Katz J, Seltzer Z. Transition from acute to chronic postsurgical pain: risk factors and protective factors. Expert Rev Neurother. 2009;9(5):723–744. doi:10.1586/ern.09.20
3. Weinrib AZ, Azam MA, Birnie KA, Burns LC, Clarke H, Katz J. The psychology of chronic post-surgical pain: new frontiers in risk factor identification, prevention and management. Br J Pain. 2017;11(4):169–177. doi:10.1177/2049463717720636
4. American Psychiatric Association. Diagnostic and Statistical Manual of Mental Disorders.
5. Macfarlane G, Morris S, Hunt I, et al. Chronic widespread pain in the community: the influence of psychological symptoms and mental disorder on healthcare seeking behavior. J Rheumatol. 1999;26(2):413–419.
6. Meltzer-Brody S, Leserman J, Zolnoun D, Steege J, Green E, Teich A. Trauma and posttraumatic stress disorder in women with chronic pelvic pain. Obstet Gynecol. 2007;109(4):902–908. doi:10.1097/01.AOG.0000258296.35538.88
7. Stoll C, Schelling G, Goetz AE, et al. Health-related quality of life and post-traumatic stress disorder in patients after cardiac surgery and intensive care treatment. J Thorac Cardiovasc Surg. 2000;120(3):505–512. doi:10.1067/mtc.2000.108162
8. O’Connor M, Christensen S, Jensen AB, Møller S, Zachariae R. How traumatic is breast cancer? Post-traumatic stress symptoms (PTSS) and risk factors for severe PTSS at 3 and 15 months after surgery in a nationwide cohort of Danish women treated for primary breast cancer. Br J Cancer. 2011;104(3):419–426. doi:10.1038/sj.bjc.6606073
9. Cremeans-Smith JK, Greene K, Delahanty DL. Symptoms of postsurgical distress following total knee replacement and their relationship to recovery outcomes. J Psychosom Res. 2011;71(1):55–57. doi:10.1016/j.jpsychores.2010.12.002
10. Katz J, Asmundson GJ, McRae K, Halket E. Emotional numbing and pain intensity predict the development of pain disability up to one year after lateral thoracotomy. Eur J Pain. 2009;13(8):870–878. doi:10.1016/j.ejpain.2008.10.003
11. Asmundson GJ, Coons MJ, Taylor S, Katz J. PTSD and the experience of pain: research and clinical implications of shared vulnerability and mutual maintenance models. Can J Psychiatry. 2002;47(10):930–937. doi:10.1177/070674370204701004
12. Keane TM, Barlow DH. Posttraumatic stress disorder. In: Barlow DH, editor. Anxiety and Its Disorders. Guilford Press; 2002:418–453.
13. Sharp TJ, Harvey AG. Chronic pain and posttraumatic stress disorder: mutual maintenance? Clin Psychol Rev. 2001;21(6):857–877. doi:10.1016/S0272-7358(00)00071-4
14. Liedl A, Knaevelsrud C. Chronic pain and PTSD: the Perpetual Avoidance Model and its treatment implications. Torture. 2008;18(2):69–76.
15. Turk DC. A diathesis-stress model of chronic pain and disability following traumatic injury. Pain Res Manage. 2002;7(1):9–19. doi:10.1155/2002/252904
16. Rosenbloom BN, Khan K, McCartney M, Katz J. Systematic review of persistent pain and psychological outcomes following traumatic musculoskeletal injury. J Pain Res. 2013;6:39–51. doi:10.2147/JPR.S38878
17. Kleiman V, Clarke H, Katz J. Sensitivity to pain traumatization: a higher-order factor underlying pain-related anxiety, pain catastrophizing and anxiety sensitivity among patients scheduled for major surgery. Pain Res Manag. 2011;16(3):169–177. doi:10.1155/2011/932590
18. Katz J, Fashler SR, Wicks C, et al. Sensitivity to pain traumatization scale: development, validation, and preliminary findings. J Pain Res. 2017;10:1297–1316. doi:10.2147/JPR.S134133
19. Benyamini Y, Ein-Dor T, Ginzburg K, Solomon Z. Trajectories of self-rated health among veterans: a latent growth curve analysis of the impact of posttraumatic symptoms. Psychosom Med. 2009;71(3):345–352. doi:10.1097/PSY.0b013e31819ccd10
20. Nosyk B, Guh DP, Sun H, et al. Health related quality of life trajectories of patients in opioid substitution treatment. Drug Alcohol Depend. 2011;118(2–3):259–264. doi:10.1016/j.drugalcdep.2011.04.003
21. Henly SJ, Wyman JF, Findorff MJ. Health and illness over time: the trajectory perspective in nursing science. Nurs Res. 2011;60(3 Suppl):S5–14. doi:10.1097/NNR.0b013e318216dfd3
22. Chapman CR, Donaldson GW, Davis JJ, Bradshaw DH. Improving individual measurement of postoperative pain: the pain trajectory. J Pain. 2011;12(2):257–262. doi:10.1016/j.jpain.2010.08.005
23. Bauer DJ. Observations on the use of growth mixture models in psychological research. Multivariate Behav Res. 2007;42(4):757–786. doi:10.1080/00273170701710338
24. Perkins FM, Kehlet H. Chronic pain as an outcome of surgery: a review of predictive factors. Anesthesiology. 2000;93(4):1123–1133. doi:10.1097/00000542-200010000-00038
25. Cleeland C, Ryan K. Pain assessment: global use of the brief pain inventory. Ann Acad Med Singapore. 1994;23(2):129–138.
26. Cleeland C. The brief pain inventory: user guide. University of Texas M. D. Anderson Cancer Center. Available from: https://www.mdanderson.org/content/dam/mdanderson/documents/Departments-and-Divisions/Symptom-Research/BPI_UserGuide.pdf.
27. Mendoza T, Mayne T, Rublee D, Cleeland C. Reliability and validity of a modified brief pain inventory short form in patients with osteoarthritis. Eur J Pain. 2006;10(4):353–361. doi:10.1016/j.ejpain.2005.06.002
28. Zigmond AS, Snaith RP. The Hospital Anxiety and Depression Scale. Acta Psychiatr Scand. 1983;67(6):361–370. doi:10.1111/j.1600-0447.1983.tb09716.x
29. Bjelland I, Dahl AA, Haug TT, Neckelmann D. The validity of the hospital anxiety and depression scale: an updated literature review. J Psychosom Res. 2002;52(2):69–77. doi:10.1016/S0022-3999(01)00296-3
30. Johnston M, Pollard B, Hennessey P. Construct validation of the hospital anxiety and depression scale with clinical populations. J Psychosom Res. 2000;48(6):579–584. doi:10.1016/S0022-3999(00)00102-1
31. Sullivan MJ, Bishop SR, Pivik J. The pain catastrophizing scale: development and validation. Psychol Assess. 1995;7(4):524. doi:10.1037/1040-3590.7.4.524
32. Osman A, Barrios FX, Kopper BA, Hauptmann W, Jones J, O’Neill E. Factor structure, reliability, and validity of the pain catastrophizing scale. J Behav Med. 1997;20(6):589–605. doi:10.1023/A:1025570508954
33. Sullivan MJ. The Pain Catastrophizing Scale User Manual. Montreal, Quebec: McGill University; 2009.
34. Lang AJ, Wilkins K, Roy-Byrne PP, et al. Abbreviated PTSD Checklist (PCL) as a guide to clinical response. Gen Hosp Psychiatry. 2012;34(4):332–338. doi:10.1016/j.genhosppsych.2012.02.003
35. Lang AJ, Stein MB. An abbreviated PTSD checklist for use as a screening instrument in primary care. Behav Res Ther. 2005;43(5):585–594. doi:10.1016/j.brat.2004.04.005
36. Weathers FW, Litz BT, Herman D, Huska J, Keane TM. The PTSD Checklist-Civilian Version (PCL-C). Boston, MA: National Center for PTSD; 1994.
37. Proust-Lima C, Philipps V, Liquet B. Estimation of extended mixed models using latent classes and latent processes: the R package lcmm; 2015. Available from: https://arxiv.org/pdf/1503.00890.pdf.
38. Proust-Lima C, Philipps V, Liquet B. Estimation of extended mixed models using latent classes and latent processes: the R Package lcmm. arXiv preprint arXiv:1503.00890. 2017;78(2):1–56. doi:10.18637/jss.v078.i02
39. Proust-Lima C, Philipps V, Diakite A, Liquet B. lcmm: extended mixed models using latent classes and latent processes. R package version: 1.8.1. Available from: https://cran.r-project.org/package=lcmm.
40. Nylund KL, Asparouhov T, Muthén BO. Deciding on the number of classes in latent class analysis and growth mixture modeling: a Monte Carlo simulation study. Struct Equ Modeling. 2007;14(4):535–569. doi:10.1080/10705510701575396
41. Dworkin RH, Turk DC, Farrar JT, et al. Core outcome measures for chronic pain clinical trials: IMMPACT recommendations. Pain. 2005;113(1):9–19. doi:10.1016/j.pain.2004.09.012
42. Toothaker LE. Multiple Comparison Procedures. Sage Publications Inc; 1993.
43. Ruxton GD, Beauchamp G. Time for some a priori thinking about post hoc testing. Behav Ecol. 2008;19(3):690–693. doi:10.1093/beheco/arn020
44. Enders CK. Applied Missing Data Analysis. Guilford press; 2010.
45. Oxlad M, Wade TD. Longitudinal risk factors for adverse psychological functioning six months after coronary artery bypass graft surgery. J Health Psychol. 2008;13(1):79–92. doi:10.1177/1359105307084314
46. Stilley CS, Dew MA, Stukas AA, et al. Psychological symptom levels and their correlates in lung and heart-lung transplant recipients. Psychosomatics. 1999;40(6):503–509. doi:10.1016/S0033-3182(99)71189-8
47. Granot M, Ferber SG. The roles of pain catastrophizing and anxiety in the prediction of postoperative pain intensity: a prospective study. Clin J Pain. 2005;21(5):439–445. doi:10.1097/01.ajp.0000135236.12705.2d
48. Strulov L, Zimmer EZ, Granot M, Tamir A, Jakobi P, Lowenstein L. Pain catastrophizing, response to experimental heat stimuli, and post–cesarean section pain. J Pain. 2007;8(3):273–279. doi:10.1016/j.jpain.2006.09.004
49. Pavlin DJ, Sullivan MJ, Freund PR, Roesen K. Catastrophizing: a risk factor for postsurgical pain. Clin J Pain. 2005;21(1):83–90. doi:10.1097/00002508-200501000-00010
50. Bayman EO, Brennan TJ. Incidence and severity of chronic pain at 3 and 6 months after thoracotomy: meta-analysis. J Pain. 2014;15(9):887–897. doi:10.1016/j.jpain.2014.06.005
51. Tasmuth T, Blomqvist C, Kalso E. Chronic post-treatment symptoms in patients with breast cancer operated in different surgical units. Eur J Surg Oncol. 1999;25(1):38–43. doi:10.1053/ejso.1998.0597
52. Hinrichs-Rocker A, Schulz K, Järvinen I, Lefering R, Simanski C, Neugebauer EA. Psychosocial predictors and correlates for chronic post-surgical pain (CPSP) - a systematic review. Eur J Pain. 2009;13(7):719–730. doi:10.1016/j.ejpain.2008.07.015
53. Linton SJ. A review of psychological risk factors in back and neck pain. Spine. 2000;25(9):1148–1156. doi:10.1097/00007632-200005010-00017
54. Pincus T, Burton AK, Vogel S, Field AP. A systematic review of psychological factors as predictors of chronicity/disability in prospective cohorts of low back pain. Spine. 2002;27(5):E109–E120. doi:10.1097/00007632-200203010-00017
55. Bender JL, Hohenadel J, Wong J, et al. What patients with cancer want to know about pain: a qualitative study. J Pain Symptom Manage. 2008;35(2):177–187. doi:10.1016/j.jpainsymman.2007.03.011
56. Kangas M, Henry JL, Bryant RA. Predictors of posttraumatic stress disorder following cancer. Health Psychol. 2005;24(6):579–585. doi:10.1037/0278-6133.24.6.579
57. Black EK, White CA. Fear of recurrence, sense of coherence and posttraumatic stress disorder in haematological cancer survivors. Psychooncology. 2005;14(6):83–90. doi:10.1002/pon.894
58. Shelby RA, Golden-Kreutz DM, Andersen BL. PTSD diagnoses, subsyndromal symptoms, and comorbidities contribute to impairments for breast cancer survivors. J Trauma Stress. 2008;21(2):719–730. doi:10.1002/jts.20316
 © 2022 The Author(s). This work is published and licensed by Dove Medical Press Limited. The
full terms of this license are available at https://www.dovepress.com/terms
and incorporate the Creative Commons Attribution
- Non Commercial (unported, 3.0) License.
By accessing the work you hereby accept the Terms. Non-commercial uses of the work are permitted
without any further permission from Dove Medical Press Limited, provided the work is properly
attributed. For permission for commercial use of this work, please see paragraphs 4.2 and 5 of our Terms.
© 2022 The Author(s). This work is published and licensed by Dove Medical Press Limited. The
full terms of this license are available at https://www.dovepress.com/terms
and incorporate the Creative Commons Attribution
- Non Commercial (unported, 3.0) License.
By accessing the work you hereby accept the Terms. Non-commercial uses of the work are permitted
without any further permission from Dove Medical Press Limited, provided the work is properly
attributed. For permission for commercial use of this work, please see paragraphs 4.2 and 5 of our Terms.
Recommended articles
Alleviating Excessive Worries Improves Co-Occurring Depression and Pain in Adolescent and Young Adult Cancer Patients: A Network Approach
Li W, Xu Y, Luo X, Wen Y, Ding K, Xu W, Garg S, Yang Y, Sun H
Neuropsychiatric Disease and Treatment 2022, 18:1843-1854
Published Date: 25 August 2022
Studies on Pain Associated with Anxiety or Depression in the Last 10 Years: A Bibliometric Analysis
Zhang Q, Sun H, Xin Y, Li X, Shao X
Journal of Pain Research 2024, 17:133-149
Published Date: 5 January 2024
AI Technology panic—is AI Dependence Bad for Mental Health? A Cross-Lagged Panel Model and the Mediating Roles of Motivations for AI Use Among Adolescents
Huang S, Lai X, Ke L, Li Y, Wang H, Zhao X, Dai X, Wang Y
Psychology Research and Behavior Management 2024, 17:1087-1102
Published Date: 12 March 2024
Mushrooms, Microdosing, and Mental Illness: The Effect of Psilocybin on Neurotransmitters, Neuroinflammation, and Neuroplasticity
Kinderlehrer DA
Neuropsychiatric Disease and Treatment 2025, 21:141-155
Published Date: 29 January 2025
Suicidal Ideation and Self-Injury in Trigeminal Neuralgia
Fishbein NS, Bakhshaie J, Greenberg J
Journal of Pain Research 2025, 18:2003-2010
Published Date: 12 April 2025