Back to Journals » Diabetes, Metabolic Syndrome and Obesity » Volume 16
Arginine Biosynthesis Pathway Found to Play a Key Role in the Neuroprotective Effect of Liu-Wei-Luo-Bi (LWLB) Granules in Diabetic db/db Mice with Peripheral Neuropathy Using an Untargeted Metabolomics Strategy
Authors Liu Q, Chen Y ![]() , Wang B, Chen Y, Li B, Guan S, Du K, Liu X, Yu Y, Liu J, Wang Z
, Wang B, Chen Y, Li B, Guan S, Du K, Liu X, Yu Y, Liu J, Wang Z
Received 10 July 2023
Accepted for publication 1 November 2023
Published 11 December 2023 Volume 2023:16 Pages 4065—4080
DOI https://doi.org/10.2147/DMSO.S423388
Checked for plagiarism Yes
Review by Single anonymous peer review
Peer reviewer comments 2
Editor who approved publication: Prof. Dr. Antonio Brunetti
Qiong Liu,1,2 Yafei Chen,1 Bo Wang,1 Yinying Chen,3 Bing Li,4 Shuang Guan,1 Kehe Du,5 Xiaoyang Liu,5 Yanan Yu,1 Jun Liu,1 Zhong Wang1
1Institute of Basic Research in Clinical Medicine, China Academy of Chinese Medical Sciences, Beijing, People’s Republic of China; 2Postdoctoral Research Station, China Academy of Chinese Medical Sciences, Beijing, People’s Republic of China; 3Guang’anmen Hospital, China Academy of Chinese Medical Sciences, Beijing, People’s Republic of China; 4Institute of Chinese Materia Medica, China Academy of Chinese Medical Sciences, Beijing, People’s Republic of China; 5iPhase Pharma Services, Beijing, People’s Republic of China
Correspondence: Zhong Wang, Institute of Basic Research in Clinical Medicine, China Academy of Chinese Medical Sciences, Beijing, People’s Republic of China, Email [email protected]
Aim: Liu-Wei-Luo-Bi (LWLB) granules was a Chinese compound prescription for treating diabetic peripheral neuropathy (DPN). The aim of this study was to investigate the effect of LWLB granules on diabetic mice with peripheral neuropathy and to elucidate the potential mechanism based on an untargeted metabolomics approach.
Methods: One hundred forty db/db mice were randomly divided into seven groups: the Control group, DPN group, Mudan (MD) granules group, Epalrestat (Epa) group, and the LWLB low, medium, or high dose (LW-l, LW-m, or LW-h) group. After 12 weeks of treatment, body weight, blood glucose, mechanical pain threshold, motor conduction velocity (MCV), sensory conduction velocity (SCV), and Pathological Organization of the Sciatic and Caudal Nerves in mice were measured. Serum samples were collected for untargeted metabolomics analysis using liquid chromatography quadrupole time-of-flight mass spectrometry (LC-QTOF-MS) and multivariate statistics. Disease-related pathways were screened out with function enrichment analyses of candidate biomarkers.
Results: LWLB granules can improve the peripheral neuropathy of type 2 diabetic mice with peripheral nerve conduction disorders, mainly through significantly improving the nerve conduction velocity (P < 0.05) and lowering the mechanical pain threshold (P < 0.05). A total of 43 metabolites were identified as potential biomarkers related to the therapeutic effect of LWLB granules. Fifty, 4, and 26; 23, 4, and 22; and 24, 1, and 16 biomarkers were discovered in the LW-l, LW-m, and LW-h groups at the 4th, 6th, and 12th weeks, respectively. Five, three, seven, five, and four metabolic pathways were found in MD, Epa, LW-l, LW-m, and LW-h groups, respectively. The arginine biosynthesis pathway is the overlapping pathway in LW-l, LW-m, and LW-h groups.
Conclusion: LWLB granules have an obvious neuroprotective effect on diabetic peripheral neuropathy, and the metabolism mechanism of LWLB is mainly related to the arginine biosynthesis pathway on diabetic db/db mice with peripheral neuropathy.
Keywords: diabetic peripheral neuropathy, Traditional Chinese Medicine, Liu-Wei-Luo-Bi granules, untargeted metabolomics, arginine biosynthesis
Introduction
Diabetic peripheral neuropathy (DPN) is a major cause of reduced quality of life and has an important impact on patients because of pain, sensory loss, gait instability, fall-related injury, and foot ulceration and amputation.1–3 Currently, intensive glycemic control and symptomatic treatment are the only therapies available for DPN.4–7 However, recent studies have shown that glycemic control and symptomatic treatment were not suitable as a long-term treatment because of the possibility of digestive and nervous system side effects.8 In addition, the development of new therapies is difficult and complex because of the inherently variable and complex nature of DPN.9–11 Therefore, there are no effective treatment interventions available clinically, and several novel and safe therapeutics are needed.12 Although some development in understanding the complex pathogenesis of DPN has occurred, various targeted therapies have not resulted in either consistent or sustained benefits to patients with DPN.13,14 Traditional Chinese medicine (TCM) is increasingly recognized in the current research for its unique medical theory to target multiple sites with a combination of compatible multi-component drugs, resulting in significant efficacy in the treatment of disease accompanied by few side effects.15
The emergence of metabolomics technology, which applies multivariate statistical techniques to analyze highly complex data sets generated by advanced analytical instruments, has provided an opportunity for the resolution of this issue.16–18 Metabonomics reflects organism function through measuring the metabolite end-products and the metabolic changes of a complete system caused by interventions in a holistic context.19,20 According to the holistic thinking property of TCM, metabonomics is also suggested to contribute to understanding.21–23 Li et al discovered 14 potential biomarkers of both DPN and Tang Luo Ning treatment by metabolomics analysis.24 In addition, metabonomics not only contributed to understanding the TCM theory but has also been used to analyze the applications, the mechanisms, and the safety assessment of Chinese herbs.25–28 Based on the multi-component, multi-effective, and multi-target characteristics of herbal compounds, the primary aim of this study was to investigate whether Liu-Wei-Luo-Bi (LWLB) granules improve type 2 DPN and the specific mechanism using untargeted metabolomics techniques.
Material and Methods
Drug Preparation
Liu-Wei-Luo-Bi (LWLB) Granules were derived from the National 13th Five-Year Plan Major New Drug Creation Project “Clinical Value Formulas Discovery and Evaluation Technology Based on Modular Pharmacology” (2017ZX09301059). LWLB is composed of 6 kinds of drug materials, including Hippophae rhamnoides Linn, Carthamus tinctorius L, Lonicera japonica Thunb, Scutellaria barbata D. Don, Achyranthes bidentata Bl and Ephedra sinica Stapf, with a fixed ratio of 10:10:10:10:10:10. These drug materials were provided by Chengdu University of Traditional Chinese Medicine and authenticated according to the Chinese Pharmacopoeia (Edition 2015, Volume I).
Mudan granules (MD), batch number: 10191126, specification: 7 g/bag. Expiration date: 2021.10.31. Mudan granules are similar to the subject in terms of function and treatment, with similar dosage forms and clear efficacy.
Epalrestat (Epa), an aldose reductase inhibitor for the prevention, improvement, and treatment of DPN. Lot No.: 20033101. Specification: 50 mg/tablet. Expiration date: 2023.02.28. Clinical studies have shown that Epa improves nerve dysfunction in DPN patients. It is one of the drugs commonly used to treat DPN in the clinic.
Chemicals and Reagents
Acetonitrile and methanol of HPLC-grade were acquired from J&K Scientific LTD. Deionized water was prepared using a Milli-Q pure water system (18.2 MΩ-cm) (Millipore, Bedford, MA). Formic acid was procured from Shanghai Ampli Scientific Instruments Co. Ammonium formate was acquired from Sinopharm Chemical Reagent Co., Ltd.
Animals and Treatment
SPF-grade male 11-week-old db/db mice, 140 mice, weighing 40–50 g, were used for the effect of Liu Wei Luo Paralysis Granules on peripheral neuropathy in mice with type 2 diabetes mellitus. The db/db and db/m mice were purchased from Changzhou Cavins Experimental Animal Co., Ltd., with experimental animal production license number: SCXK (Su) 2016–0010 and kept in the Barrier Environment B of Hunan Drug Safety Evaluation Research Center with experimental animal use license number: SYXK (Xiang) 2015–0016.
One hundred forty db/db mice were randomly divided into seven groups:
Group 1: the Control group
Group 2: the DPN group
Group 3: the MD Granules group (2.7 g/kg)
Group 4: the Epalrestat (Epa) group (19.5 mg/kg)
Group 5: the LWLB low dose (LW-l) group (4.4 g/kg)
Group 6: the LWLB medium dose (LW-m) group (8.7 g/kg)
Group 7: the LWLB high dose (LW-h) group (17.4 g/kg)
A total of six dose groups with 20 animals in each group, and another 20 db/m mice of the same age were taken as the Control group. Each dose group was given the corresponding drug by gavage at 20 mL/kg once a day for 12 weeks, whereas the Control and DPN groups were given an equal volume of pure water by gavage.
Blood Glucose Measurement
The blood glucose of mice was measured from tail tip blood using the Accu-Chek Active Blood Glucose Meter and the matched test strips (glucose dehydrogenase methods) (Roche Diabetes Care Inc). Before fasting blood glucose (FBG) was measured, mice were fasted for 12 h. The experimental personnel put on disposable sterilized gloves, took alcohol cotton balls to disinfect the tail of mice, and then used disposable sterile blood collection needles to collect blood from the tail tips one by one, monitored FBG at regular intervals, and made records.
Body Weight Measurement
The body weights of mice were measured every week starting from week 0 until the end of week 12, and water consumption and food intake were recorded (for the convenience of measurement, measurements were taken in cages and then the mean values were taken).
Mechanical Pain Threshold Measurement
At the 4th, 6th, 8th, 10th, and 12th weeks of drug administration, six (4th week of drug administration), six (6th week of drug administration), six (8th week of drug administration), six (10th week of drug administration), and ten (12th week of drug administration) mice were randomly selected from the designated group for the determination of mechanical pain threshold by YLS-3E Electronic Pressure Pain Instrument (Jinan Yiyan Technology Development Co.). The mice were placed on the paws of their hind feet at the indenter head, pressure was applied to the paws, the pressure was stopped when the mice showed pain responses such as struggling, and the pressure data (g) were recorded.
Detection of Sciatic Nerve Motor Conduction Velocity (MCV) and Sensory Conduction Velocity (SCV) in Mice
Three (4th week of administration), three (6th week of administration), and ten (12th week of administration) mice were randomly selected from the designated group, and the mice were anesthetized and fixed prone. The room temperature was strictly controlled at 20±0.5°C and the body temperature of rats/mice was maintained at 37°C. The right sciatic nerve conduction velocity (MCV) and sensory nerve conduction velocity (SCV) were measured by applying the BL-420S Biological Function Experiment System. The skin between the biceps femoris and semimembranosus muscles of the right lower limb was dissected, and a blunt separation was performed between the two muscles to expose the isolated right sciatic nerve. The exposed nerve was gently hung on an electrode hook containing two sets of stimulation electrodes and recording electrodes, and the nerve surface was kept in a moist and warm environment by adding a drop of preheated paraffin oil at 37°C. The stimulation intensity was 1.5 times the stimulation threshold. Measurement method: (1) MCV: One end of the stimulating electrode was placed on the proximal end of the nerve, and one end of the recording electrode was placed on the distal end of the nerve. The evoked action potential was recorded after stimulation; the time between the application of stimulation and the appearance of evoked potentials was the latency period and the length between the starting point of the stimulating electrode and the starting point of the recording electrode was the distance. The measurement was repeated 3–5 times, and the average value was calculated. The following formula was used: MCV (m/s) = distance between stimulating electrode and recording electrode/latency period. (2) SCV: The position of the stimulating electrode and the recording electrode were exchanged such that they were opposite the position of the measured MCV. The following formula was used: SCV (m/s) = distance between the stimulating electrode and the recording electrode/latency.
Pathological Histological Examination
After MCV and SCV measurements, the left sciatic nerve and the animal’s caudal nerve were taken, fixed in neutral formalin, dehydrated, paraffin embedded, sectioned, HE stained and nerve myelin stained, and the nerve structures, nerve fibers, and myelin cell morphology of the rats/mice were observed using light microscopy. Histochemical scoring (H-score) assessment incorporates both the staining intensity (i) and a percentage of stained cells at each intensity level (Pi). The i values are indicated as 0 (no evidence of staining), 1 (weak staining), 2 (moderate staining), and 3 (strong staining).
Preparation of Serum Samples
At week 12 of drug administration, after completion of the MCV and SCV assays, serum was collected from mice as follows: (1) The mice were fasted without water supply 12 h before sample collection and anesthetized with an intramuscular injection of 9.75 mg/kg xylazine hydrochloride, and 1–1.5 mL of blood was collected from the orbital venous plexus. (2) The collected blood was left undisturbed for approximately 30 min (not more than 2 h) at room temperature (20–25°C) for the blood to coagulate completely. If the laboratory temperature was low, the resting time was extended appropriately to allow the serum to separate fully. (3) After the serum was fully separated, the samples were centrifuged for 10 min at a centrifugal force of approximately 3000 × g. (4) Approximately 200–300 μL of the clear supernatant was carefully aspirated into 1.5-mL centrifuge tubes (in duplicate). The caps on the tubes were pressed to check the chisel, the tubes were placed in the sample cassette, and the sample information was marked. (5) The sample cassette was stored in a freezer at −80°C.
Liquid Chromatography Time-of-Flight Mass Spectrometry (LC-TOF-MS) Conditions
In this study, two analytical systems were used for the detection and analysis of metabolites. The advantage was that metabolites of different polarities in serum could be considered to comprehensively analyze their differences in the Control group, DNP group, MD group, Epa group, and LWLB group. In this study, Shimadzu LC-20AD HPLC/AB SCIEX Triple Q-TOF 5600+ liquid MS was used to develop and establish two sets of analytical systems for the comprehensive detection and analysis of metabolites in the mice sera. A Waters Atlantis T3 column (2.1 × 150 mm, 3 µm) separation system was used to detect and analyze small-molecule metabolites with low polarity. The second analytical system was an electrospray ionization (ESI) separation system with an Agela Venusil HILIC column (4.6 × 50 mm, 3 µm) used to detect and analyze small-molecule metabolites with high polarity.
Sample Preparation
The liver tissue samples were taken out of the −80°C freezer and thawed in the refrigerator at 4°C. Approximately 50 mg of liver tissue was accurately weighed with a 100,000-part balance, placed in a 10-mL centrifuge tube, and immediately placed on ice. Deionized water was added in a ratio of 1:19 (m:V) and homogenized fully using a homogenizer for 2 min at 20,000 rpm. Then, a pre-cooled methanol-acetonitrile (1:1) mixed solution was added in a ratio of 1:79 (m:V) to the deionized water homogenate. The samples were vortexed 30s and placed for 10 min in an ice bath ultrasonicator. The ultrasonicated samples were placed in a −20°C freezer for 1 h and then centrifuged at 4°C at 4000 rpm for 15 min. The supernatant was dried in a nitrogen blower and redissolved in 1 mL 50% acetonitrile aqueous solution. Fifty microliters were removed from each sample solution and mixed well with the quality control (QC) sample; all samples were then eddy oscillated for 30s followed by 5 min of ice bath ultrasonication. The samples were centrifuged at 4°C at 4000 rpm for 15 min. The supernatant was collected into a vial and analyzed.
Waters Atlantis T3 System Fluid Conditions
The system adopts the positive ion acquisition mode ESI+ and information-dependent acquisition (IDA) scanning mode. Important parameters included the following: parent ion scanning range (TOF MS): 50–1500 Da; product ion scanning range: 50–1500 Da; ion source gas 1 (GS1): 55, auxiliary heating gas (GS2): 55, curtain gas (CUR): 35, temperature (TEM): 500, ion spray voltage floating (ISVF): −4500, cluster removal voltage (DP): −80, impact energy (CE): −30, collision energy spread (CES): 15, ion release delay (IRD): 30, and ion release width (IRW): 15. The mobile phase comprised A (acetonitrile: water = 5:95 [containing 10 mM ammonium formate, 0.1% formic acid]) and B (acetonitrile: water = 95:5 [containing 10 mM ammonium formate, 0.1% formic acid]). A gradient elution was adopted: 0–13.0 min, 1% B ~ 99% B; 13.0–16.5 min, 99% B; 16.5–16.6 min, 99% B ~ 1% B; and 16.6–25.0 min, 1% B. The flow rate was 0.3 mL/min, the injection volume was 20 µL, the column temperature was 40°C, the injector temperature was 4°C, and the chromatographic column was Waters Atlantis T3 (2.1 × 150 mm, 3 µm).
Agela Venusil HILIC System Fluid Conditions
The system adopts the negative ion acquisition mode (ESI-) and IDA scanning mode. Important parameters included the following: parent ion scanning range (TOF MS): 50–1, 500 Da; product ion scanning range: 50–1500 Da; GS1:55, GS2:55, CUR: 35, TEM: 500, ISVF: −4500, DP: 80, CE: 30, CES: 15, IRD: 30, and IRW: 15. The mobile phase comprised A (acetonitrile: water = 5:95 [containing 10 mM ammonium formate, 0.1% formic acid]) and B (acetonitrile: water = 95:5 [containing 10 mM ammonium formate, 0.1% formic acid]). A gradient elution method was adopted: 0–1.0 min, 100% B; 1.0–14.0 min, 100% B ~ 65% B; 14.0–16.0 min, 65% B ~ 40% B; 16.0–18.0 min, 40% B; 18.0–18.01 min, 40% B to 100% B; and 18.01–25.0 min, 100% B. The flow rate was 0.3 mL/min, the injection volume was 20 μL, the column temperature was 40°C, the injector temperature was 4°C, and the chromatographic column was Agela Venusil HILIC (4.6 × 50 mm, 3 μm).
Identification and Validation of Potential Biomarkers
Metabolites selected as biomarker candidates for further statistical analysis were identified based on variable importance in the projection (VIP) ≥ 1 from the 10-fold cross-validated OPLS-DA model, which was validated at the univariate level with an adjusted P < 0.05. The biomarkers were identified by comparison of different groups, for example, the potential biomarkers of the MD group were discovered by comparing (Control vs DPN) with (DPN vs MD).
Pathway Analysis for the Biomarkers
The pathway analyses of potential biomarkers were performed with MetaboAnalyst (https://www.metaboanalyst.ca); the model organisms were set as Mouse and the database source was KEGG. The P-value threshold calculated from pathway analysis was set as 0.05, and those less than the threshold were screened out as potentially significant pathways.
Data Processing and Statistical Analysis
Raw data preprocessing and multivariate analysis for metabolomics studies were performed using MetaboAnalyst 4.02. After a programmed processing, the resulting three-dimensional data matrices containing the sample description, normalized peak areas, and the retention time–m/z pairs were processed using multivariate analysis. Principal component analysis (PCA) was used to display the overall differences. Partial least-squared discriminant analysis (PLS-DA) and orthogonal projection to latent structure-discriminate analysis (OPLS-DA) were used to verify the model and to explore the different metabolites between groups.
Data are presented as the mean ± standard deviation for continuous variables. The Student’s t-test was used for comparison between two groups. One-way analysis of variance (ANOVA) analysis was performed for multiple comparison. When the ANOVA showed statistical significance, post hoc analysis was done for further comparison between two groups. P < 0.05 indicated statistical significance. Spearman rank correlation analysis was done, and scatter plots were drawn to show the relationship between two variables using Graph Pad Prism, Version 8.0.
Results
Effect of LWLB Granules on Blood Glucose, Body Weight, Mechanical Pain Threshold, Nerve Conduction Velocity, and Pathological Organization of the Sciatic and Caudal Nerves in Mice
Effect of LWLB Granules on FBG in Mice
As shown in Figure 1a, the FBG values in the DPN group were higher than those in the Control group (P < 0.05). Compared with those in the DPN group, the FBG values of mice in the positive drug Epa group were significantly lower at the 6th, 10th, and 11th week of administration (P<0.05), whereas the FBG values of mice in the MD group were not significantly different (P>0.05). Compared with those in the DPN group, the FBG values of the LW-l group were lower at the 4th and 6th weeks of administration (P<0.05), the FBG values of the LW-m group were lower at the 4th, 6th, and 10th weeks of administration (P<0.05), and the FBG values of the LW-h group were lower at the 4th, 6th, and 7th weeks of administration (P<0.05). These blood glucose values of the low, middle, and high dose groups of LWLB Granules did not continue to decrease with the administration cycle. It is suggested that LWLB Granules administration has no obvious effect on blood glucose in the type 2 diabetes peripheral neuropathy mouse model (Supply Table 1).
 |
Figure 1 Effects of LWLB granules on fasting blood glucose (FBG) (a), body weight (b), mechanical pain threshold (c), motor conduction velocity (MCV) (d), and sensory conduction velocity (SCV) (e). Notes: Data are presented as group means ± SEM (n = 20 per group). #P < 0.05 vs the Control group; *P < 0.05 vs the diabetic peripheral neuropathy (DPN) group. |
Effect of LWLB Granules on Body Weight in Mice
As shown in Figure 1b, during the same period, the body weights of mice in the DPN group were significantly higher compared with those in the Control group (P < 0.01). The body weights of mice in the LW-h group were significantly lower at the 4th week compared with those in the DPN group (P < 0.05), but these decreases were within the normal growth fluctuation range. The body weights of mice in the MD group were significantly lower at the 4th week compared with those in the DPN group (P < 0.05). There was no statistical difference in the body weights of mice in the Epa, LW-l, and LW-m rest groups (P>0.05) (Supply Table 2).
Effect of LWLB Granules on Mechanical Pain Threshold in Mice
As shown in Figure 1c, compared with those in the Control group, the mechanical pain thresholds of the hind limbs of the mice in the DPN group were significantly higher before and during the administration of the drug (P<0.05). Compared with those in the DPN group, the mechanical pain thresholds of mice in each treatment group did not differ significantly at the 4th, 6th, 8th, and 10th weeks of administration (P>0.05); however, the mechanical pain thresholds of mice in each treatment group were significantly lower at the 12th week of administration (P<0.05) (Supply Table 3).
Effect of LWLB Granules on MCV and SCV in Mice
As shown in Figure 1d and e, compared with those in the Control group, MCV and SCV of mice in the DPN group were significantly lower in each dosing period (P < 0.05). At the 4th week of administration, the MCV values of mice in the MD group were significantly higher than those in the DPN group (P<0.05); the SCV values of mice in the LW-h group were significantly higher (P < 0.05). At the 6th week of administration, the MCV values of mice in the MD group were significantly higher than those in the DPN group (P<0.05); the SCV values of mice in the LW-h group were significantly higher (P < 0.05). At the 6th week of administration, compared with those in the DPN group, the MCV and SCV values of mice in all treatment groups were significantly higher (P<0.05), except for the SCV values of mice in the MD and LW-l groups, which did not differ significantly (P>0.05). At week 12 of administration, MCV and SCV were significantly higher in MD, Epa, and LWLB low, medium, and high dose groups of mice compared with those in the DPN group (P<0.05). Taken together, these results suggest that LWLB granules can improve the peripheral neuropathy of type 2 diabetic mice with peripheral nerve conduction disorders (Supply Tables 4 and 5).
Effect of LWLB Granules on Pathological Organization of the Sciatic and Caudal Nerves in Mice
As shown in Figure 2, the pathological scores of sciatic nerves in the DPN group were significantly higher at the 8th and 12th weeks of administration compared with those in the Control group (P<0.05). The pathological scores of caudal nerves in the DPN group were significantly higher at the 12th week of administration compared with those the Control group (P<0.05) (Figure 2). Compared with those in the DPN group, the pathological scores of sciatic nerves in mice in the MD group, Epa group, LW-l, LW-m, and LW-h groups were significantly lower at the 8th and 12th weeks of administration (P<0.05) (Supply Tables 6 and 7). The pathological scores of caudal nerves in the MD group, Epa group, LW-l, LW-m, and LW-h groups were significantly lower at the 12th week of administration compared with those in the DPN group (P<0.05).
 |
Figure 2 Effect of LWLB Granules on pathological organization of the sciatic and caudal nerves in mice. Notes: Data are presented as group means ± SEM (n = 20 per group). #P < 0.05 vs the Control group; *P < 0.05 vs the diabetic peripheral neuropathy (DPN) group. (a) The effect of LWLB granules on pathological organization of the sciatic nerves in mice. (b) Effect of LWLB granules on pathological organization of the caudal nerves in mice. |
Metabolomics Analysis
Quality Assurance
The total ion flow diagrams of the mice serum samples obtained by two systems of LC-TOF-MS are shown in Figure 3. In addition, a QC sample was inserted for every seven samples during batch injection to check the stability and performance of the instrument. Seven ions were randomly extracted from six QC samples, and the stability of the instrument system was investigated by calculating the relative standard deviation (RSD) values of the retention time (RT) and peak area of the seven ions. Supply Table 8 shows the RT and RSD values of the peak area of the six ions randomly extracted under the Waters Atlantis T3 system. Supply Table 8 shows the RT and RSD values of the peak area of the six ions randomly extracted under the Agela Venusil HILIC system. The results show that the two analytical systems developed by the laboratory are stable and reliable and can meet the requirements of mass sampling analysis.
 |
Figure 3 Discrimination of the serum metabolic profile among Control, DPN, Mudan (MD) granules, Epalrestat (Epa), and LWLB treatment groups: low dose (LW-l), medium dose (LW-m), and high dose (LW-h) groups. Notes: (a–c) The score plots of PCA at the 4th, 6th, and 12th weeks, respectively. (d–f) The score plots of partial least-squared discriminant analysis (PLS-DA) at the 4th, 6th, and 12th weeks, respectively. n = 3 per group. |
Multivariate Statistical Analysis
To obtain adequate information on the metabolites, the PCA was first used to provide an unbiased and comprehensive view of the metabolic phenotype of all serum samples from the Control, DPN, MD, Epa, LW-l, LW-m, and LW-h groups. As shown in Figure 3, the PCA score plot illustrates the distribution among the seven groups at 4, 6, and 12 weeks. Samples from mice in the Control and DPN groups were separated at the 4th, 6th, and 12th weeks, as shown in Figure 3a–c. Samples from mice in the Control and DPN groups were clearly separated at the 12th week, suggesting that significant metabolic changes had appeared at the 4th week and were most pronounced at the 12th week. Moreover, the LW-l, LW-m, and LW-h groups had a relatively analogous metabolic phenotype and seemed to display a restorable trend toward that seen in the Control group. This was especially evident at the 4th and 6th weeks, and the metabolic phenotypes corresponded with the pathological differences.
In addition, all serum samples were analyzed with PLS-DA to maximize the class discrimination in the Control, DPN, MD, Epa, LW-l, LW-m, and LW-h groups; the analysis had an excellent goodness of fit (R2 ≥ 0.95) and acceptable predictive ability (Q2 ≥ 0.50). In the seven groups, obvious clustering was found at the 4th, 6th, and 12th weeks, suggesting that the group differences were more remarkable than individual differences, as shown in Figure 3d–f. All results above indicated that the metabolic profiles were significantly altered in mouse sera after treatment with MD granules, Epa, and LWLB granules.
Screen and Identification of Potential Biomarkers
Orthogonal partial least squares discriminant analysis (OPLS-DA) was conducted to identify the significantly changed ions between the Control vs DPN groups, DPN vs MD groups, DPN vs Epa groups, DPN vs LW-l groups, DPN vs LW-m groups, and the DPN vs LW-h groups (Figure 4). The OPLS-DA models were developed based on the maximized intergroup differences and minimized intragroup differences and showed acceptable abilities for prediction and reliability with R2Y ≥ 0.89 and Q2 ≥ 0.68 at the 4th week, R2Y ≥ 0.70 and Q2 ≥ 0.07 at the 6th week, and R2Y ≥ 0.90 and Q2 ≥ 0.34 at the 12th week (Figure 4). Then, the VIP plots were generated. In this study, potential biomarkers were considered as such using these criteria: Variable ions with VIP values > 1 and P < 0.05 calculated by an independent sample Student’s t-test for discrimination of the two groups (Supply Table 9).
 |
Figure 4 Screening of serum metabolites regulated by MD, Epa, and LWLB administration. Notes: (a–c) The score plots of orthogonal partial least squares discriminant analysis (OPLS-DA) between the Control group (Con) vs DPN group at the 4th, 6th, and 12th weeks. (d–f) The score plots of OPLS-DA between the Con vs MD groups at the 4th, 6th, and 12th weeks. (g–i) The score plots of OPLS-DA between the Con vs Epa groups at the 4th, 6th, and 12th weeks. (j–l) The score plots of OPLS-DA between the Con vs LW-l groups at the 4th, 6th, and 12th weeks. (m–o) The score plots of OPLS-DA between the Con vs LW-m groups at the 4th, 6th, and 12th weeks. (p–r) The score plots of OPLS-DA between the Con vs LW-h groups at the 4th, 6th, and 12th weeks. n = 3 per group. |
Following the criteria, 107, 72, 54, 139, 61, and 67 variable ions were preliminarily screened out in the Control vs DPN groups, DPN vs MD groups, DPN vs Epa groups, DPN vs LW-l groups, DPN vs LW-m groups and DPN vs LW-h groups at the 4th week, respectively. Similarly, there were 21, 107, 23, 30, 24, and 26 variable ions discovered in the Control vs DPN groups, DPN vs MD groups, DPN vs Epa groups, DPN vs LW-l groups, DPN vs LW-m groups, and DPN vs LW-h groups at the 6th week, respectively. At the 12th week, 107, 61, 31, 65, 57, and 53 metabolites were found in the Control vs DPN groups, DPN vs MD groups, DPN vs Epa groups, DPN vs LW-l groups, DPN vs LW-m groups, and DPN vs LW-h groups, respectively (Table 1 and Supply Table 10).
 |
Table 1 The Number of Potential Biomarkers Were Screened Related to MD, Epa, and LWLB |
As shown in Table 1, to obtain more precise potential biomarkers for three treatment groups (MD, Epa, and LWLB), the metabolites obtained from the above analysis were compared in the following manner: (Con vs DPN) vs (DPN vs MD), (Con vs DPN) vs (DPN vs Epa), (Con vs DPN) vs (DPN vs LW-l), (Con vs DPN) vs (DPN vs LW-m), and (Con vs DPN) vs (DPN vs LW-h). Finally, 26, 30, and 23 biomarkers were identified in the MD group at the 4th, 6th, and 12th weeks, respectively, the concentrations of which were significantly different from those of the Control group and DPN group. In the Epa group, 21, 1, and 14 biomarkers were discovered after comparing with the Control group and DPN group at the 4th, 6th, and 12th weeks, respectively. There were 50, 4, and 26 biomarkers found in the LW-l group at the 4th, 6th, and 12th weeks. In the LW-m group, 23, 4, and 22 biomarkers were discovered after comparing with the Control group and DPN group at the 4th, 6th, and 12th weeks, respectively. Similarly, 24, 1, and 16 biomarkers were identified in the LW-h group at the 4th, 6th, and 12th weeks, respectively (Figure 5 and Supply Table 10).
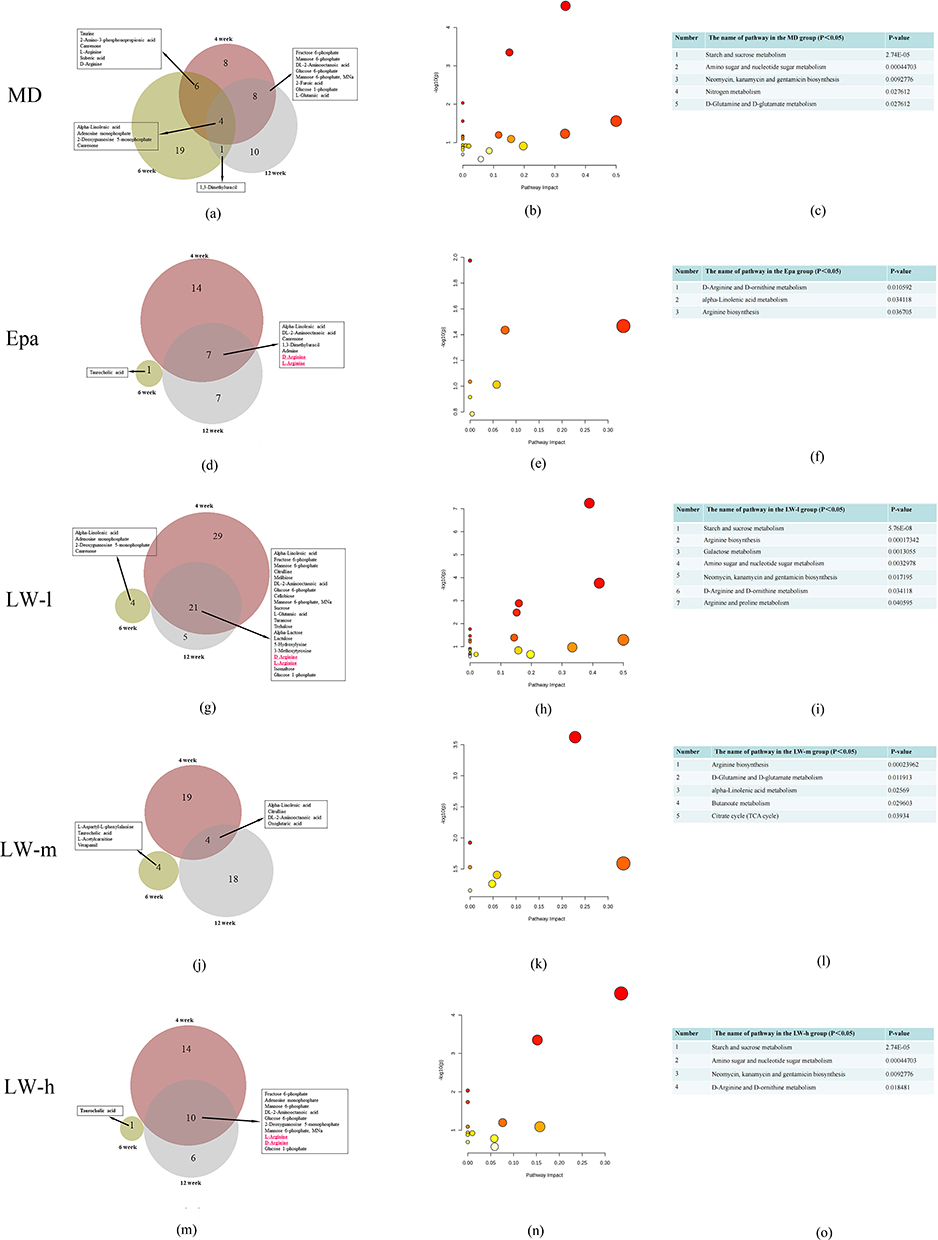 |
Figure 5 Venn diagram and pathway analysis of the biomarkers in MD, Epa, and LW-l, LW-m, and LW-h groups at the 4th, 6th, and 12th weeks. Notes: (a–c) The Venn diagram and pathway analysis of the biomarkers in MD group. (d–f) The Venn diagram and pathway analysis of the biomarkers in Epa group. (g–i) The Venn diagram and pathway analysis of biomarkers in LW-l group. (j–l) The Venn diagram and pathway analysis of biomarkers in LW-m group. (m–o) The Venn diagram and pathway analysis of biomarkers in LW-h group. |
In addition, to observe the changes of potential biomarkers in the different treatment groups resulting from variations in the treatment cycle, potential biomarkers were compared at week 4, week 6, and week 12. As shown in Figure 5, four overlapping potential biomarkers were discovered in the MD group at the 4th, 6th, and 12th weeks: alpha-linolenic acid, adenosine monophosphate, 2-deoxyguanosine 5-monophosphate, and canrenone. No overlapping biomarkers were found in the Epa, LW-l, LW-m, and LW-h groups at the 4th, 6th, and 12th weeks. When comparing the 4th week with the 6th week, six overlapping metabolites were found in the MD group (zero in the other groups). When comparing the 4th week with the 12th week, 8, 7, 21, 4, and 10 overlapping biomarkers were screened in the MD, Epa, LW-l, LW-m, and LW-h groups, respectively. By comparison, few overlapping metabolites were found when the 6th week was compared to the 12th week, except for 1,3-dimethyluracil found in the MD group.
Pathway Analysis for the Biomarkers
As shown in Figure 5, five metabolic pathways were screened in MD groups: starch and sucrose metabolism; amino sugar and nucleotide sugar metabolism; neomycin, kanamycin, and gentamicin biosynthesis; nitrogen metabolism; and D-glutamine and D-glutamate metabolism. There were three metabolic pathways discovered in Epa groups: D-arginine and D-ornithine metabolism, alpha-linolenic acid metabolism, and arginine biosynthesis (Figure 5). Seven, five, and four metabolic pathways were found in LW-l, LW-m, and LW-h groups, respectively (Figure 5). Starch and sucrose metabolism; arginine biosynthesis; galactose metabolism; amino sugar and nucleotide sugar metabolism; neomycin, kanamycin, and gentamicin biosynthesis; D-arginine and D-ornithine metabolism; and arginine and proline metabolism were the pathways of LW-l groups. In LW-m groups, the related pathways were arginine biosynthesis; D-glutamine and D-glutamate metabolism; alpha-linolenic acid metabolism; butanoate metabolism; and citrate cycle (TCA cycle). Interestingly, we found that the four pathways of the LW-h group were completely overlapping with the pathways of LW-l group: starch and sucrose metabolism; amino sugar and nucleotide sugar metabolism; neomycin, kanamycin, and gentamicin biosynthesis; and D-arginine and D-ornithine metabolism (Figure 5). Our study also found that the arginine biosynthesis pathway is the only overlapping pathway in LW-l, LW-m, and LW-h groups, but the P-values of the arginine biosynthesis pathway were 0.00017, 0.00023, and 0.063, respectively (Supply Table 11).
Discussion
This study showed that LWLB granules significantly improved nerve conduction dysfunction in type 2 DPN after 12 weeks of treatment in a db/db mouse model, mainly by increasing sciatic MCV and SCV, decreasing mechanical pain threshold, and lowering fasting glucose. Therefore, the LWLB granules had a neuroprotective effect on diabetic mice with peripheral neuropathy, providing an effective herbal prescription and treatment modality for the next clinical treatment of DPN and may have the advantages of multi-targeting and fewer side effects.
The neuropathic pain of DPN is a primary dysfunction of peripheral nociceptive and non-nociceptive nerves and is related to neuroplastic changes, thereby introducing hyperalgesia.29 Mechanical pain threshold increases and MCV and SCV decreases were found in the db/db diabetic mice in our study. Previous studies have reported that L-arginine can prevent the development of mechanical hyperalgesia and tactile and thermal allodynia by reducing NO and increasing the production of agmatine in painful diabetic neuropathy.14 Arginine was discovered to be involved in some biological and metabolic processes in diabetic rats,30 such as insulin release, protein metabolism, immune responses, glucagon release, and cellular signalization.31–33 Arginine serves as an important precursor for NO, polyarginine, and other physiological factors.34–36
As shown in Figure 6, the related metabolic pathways of LWLB granules in different groups were mainly, e.g., arginine biosynthesis, glycolysis/gluconeogenesis, amino sugar and nucleotide sugar metabolism, and arginine and proline metabolism. The urea cycle is a part of the arginine biosynthesis pathway, and the arginase enzyme can cleave arginine to generate urea and ornithine.37 Arginine can be produced from ornithine and citrulline through a series of reactions.38 The metabolites of the arginine biosynthesis pathway may be related to DPN. The levels of arginine, ornithine, argininosuccinate, and citrulline were significantly elevated in DPN[41.42]. The above metabolites of the arginine biosynthesis pathway help us to understand the pathogenesis of DPN. Arginine is involved in many biological processes, and some studies suggest that the incorporation of poly-arginine into peptide molecules may play an important role in determining neuroprotective efficacy.39 Previous research reported that arginine is the substrate of nitric oxide synthase (NOS) and arginase, producing NO and urea, respectively.40 However, we also found that the NO bioactivity was not related to the development of experimental diabetic sensory neuropathy in the STZ-induced diabetic rats.41
 |
Figure 6 The metabolic mechanism pathway diagram of LWLB granules in LW-l, LW-m, and LW-h groups. |
In this study, the arginine biosynthesis was always present in LW-l, LW-m, and LW-h groups and might play a key role in the neuroprotective effect in diabetic db/db mice with peripheral neuropathy. In summary, the metabolism mechanism of LWLB is mainly related to the arginine biosynthesis pathway in diabetic db/db mice with peripheral neuropathy. Moreover, this study discovered the arginine biosynthesis might play a key role in the neuroprotective effect in diabetic db/db mice with peripheral neuropathy. In addition, the validation of the neuroprotective effect on the pathway with DPN may need to be further explored.
Conclusion
We found that treatment with LWLB granules had a significant neuroprotective effect in db/db mice with DPN. Moreover, metabolomics indicated remarkable alterations in various serum metabolites. LWLB was involved in neuroprotection, insulin release, protein metabolism, immune responses, glucagon release, and cellular signalization during the progression of DPN. Additionally, the arginine biosynthesis might play a key role in neuroprotective effects in diabetic db/db mice with peripheral neuropathy.
Abbreviations
AMPK, Arginine-NO-AMP kinase; ANOVA, One-way analysis of variance; CES, Collision energy spread; CUR, Curtain gas; DPN, Diabetic peripheral neuropathy; Epa, Epalrestat; FBG, Fasting blood glucose; GS1, Ion source gas 1; GS2, Auxiliary heating gas; IDA, Information-dependent acquisition; IRD, Ion release delay; IRW, Ion release width; ISVF, Ion spray voltage floating; LC-QTOF-MS, Liquid chromatography quadrupole time-of-flight mass spectrometry; LW-h, LWLB high dose; LW-l, LWLB low dose; LWLB, Liu-Wei-Luo-Bi; LW-m, LWLB medium dose; MCV, Motor conduction velocity; MD, Mudan; NO, Nitric oxide; OPLS-DA, Orthogonal projection to latent structure-discriminate analysis; PCA, Principal component analysis; PLS-DA, Partial least-squared discriminant analysis; RSD, Relative standard deviation; RT, Retention time; SCV, Sensory conduction velocity; TCM, Traditional Chinese medicine; TEM, Temperature; VIP, Variable importance in the projection.
Ethics Approval and Consent to Participate
This study was carried out in accordance with the principles of the Basel Declaration and recommendations of the Guide for the Care and Use of Laboratory Animals of the National Institutes of Health. The protocol was approved by the Experimental Animal Ethics Committee of Hunan Laboratory Animal Center (the application number is IACUC-2020(2)004).
Acknowledgments
We would like to thank TopEdit for its linguistic assistance during the preparation of this manuscript. We would also like to thank the Hunan Laboratory Animal Center for its lab where we carried out the animal experiment of this manuscript.
Author Contributions
All authors made a significant contribution to the work reported, whether that is in the conception, study design, execution, acquisition of data, analysis and interpretation, or in all these areas; took part in drafting, revising or critically reviewing the article; gave final approval of the version to be published; have agreed on the journal to which the article has been submitted; and agree to be accountable for all aspects of the work.
Funding
This study was supported by the National Major Scientific and Technological Special Project for “Significant New Drugs Development” (2017ZX09301‐059), National Natural Science Foundation of China (81230086) and the Fundamental Research Funds for the Central public welfare research institutes (ZZ0908029).
Disclosure
The authors declare that they have no competing financial interests.
References
1. Stino AM, Smith AG. Peripheral neuropathy in prediabetes and the metabolic syndrome. J Diabetes Investig. 2017;8(5):646–655. doi:10.1111/jdi.12650
2. Selvarajah D, Kar D, Khunti K, et al. Diabetic peripheral neuropathy: advances in diagnosis and strategies for screening and early intervention. Lancet Diabetes Endocrinol. 2019;7(12):938–948. doi:10.1016/S2213-8587(19)30081-6
3. Iqbal Z, Azmi S, Yadav R, et al. Diabetic peripheral neuropathy: epidemiology, diagnosis, and pharmacotherapy. Clin Ther. 2018;40(6):828–849. doi:10.1016/j.clinthera.2018.04.001
4. Faselis C, Katsimardou A, Imprialos K, et al. Microvascular complications of type 2 diabetes mellitus. Curr Vasc Pharmacol. 2020;18(2):117–124. doi:10.2174/1570161117666190502103733
5. Vinik AI, Nevoret ML, Casellini C, et al. Diabetic neuropathy. Endocrinol Metab Clin North Am. 2013;42(4):747–787. doi:10.1016/j.ecl.2013.06.001
6. Calcutt NA. Diabetic neuropathy and neuropathic pain: a (con)fusion of pathogenic mechanisms. Pain. 2020;161(Suppl 1):S65–S86. doi:10.1097/j.pain.0000000000001922
7. Javed S, Alam U, Malik RA. Burning through the pain: treatments for diabetic neuropathy. Diabetes Obes Metab. 2015;17(12):1115–1125. doi:10.1111/dom.12535
8. Sakai D, Nakai T, Hiraishi S, et al. Upregulation of glycosaminoglycan synthesis by Neurotropin in nucleus pulposus cells via stimulation of chondroitin sulfate N-acetylgalactosaminyltransferase 1: a new approach to attenuation of intervertebral disc degeneration. PLoS One. 2018;13(8):e0202640. doi:10.1371/journal.pone.0202640
9. Jensen TS, Backonja MM, Hernández Jiménez S, et al. New perspectives on the management of diabetic peripheral neuropathic pain. Diab Vasc Dis Res. 2006;3(2):108–119. doi:10.3132/dvdr.2006.013
10. Sloan G, Shillo P, Selvarajah D, et al. A new look at painful diabetic neuropathy. Diabetes Res Clin Pract. 2018;144:177–191. doi:10.1016/j.diabres.2018.08.020
11. Tang HY, Jiang AJ, Ma JL, et al. Understanding the signaling pathways related to the mechanism and treatment of diabetic peripheral neuropathy. Endocrinology. 2019;160(9):2119–2127. doi:10.1210/en.2019-00311
12. Xin X, Zou H, Zheng N, et al. Metabonomic strategy to the evaluation of Chinese medicine compound danshen dripping pills interfering myocardial ischemia in rats. Evid Based Complement Alternat Med. 2013;2013:718305. doi:10.1155/2013/718305
13. Durán AM, Beeson WL, Firek A, et al. Dietary Omega-3 polyunsaturated fatty-acid supplementation upregulates protective cellular pathways in patients with type 2 diabetes exhibiting improvement in painful diabetic neuropathy. Nutrients. 2022;14(4):761. doi:10.3390/nu14040761
14. Rondón LJ, Farges MC, Davin N, et al. L-Arginine supplementation prevents allodynia and hyperalgesia in painful diabetic neuropathic rats by normalizing plasma nitric oxide concentration and increasing plasma agmatine concentration. Eur J Nutr. 2018;57(7):2353–2363. doi:10.1007/s00394-017-1508-x
15. Schrimpe-Rutledge AC, Codreanu SG, Sherrod SD, et al. Untargeted metabolomics strategies-challenges and emerging directions. J Am Soc Mass Spectrom. 2016;27(12):1897–1905. doi:10.1007/s13361-016-1469-y
16. Patti GJ, Yanes O, Siuzdak G. Innovation: metabolomics: the apogee of the omics trilogy. Nat Rev Mol Cell Biol. 2012;13(4):263–269. doi:10.1038/nrm3314
17. Ussher JR, Elmariah S, Gerszten RE, et al. The emerging role of metabolomics in the diagnosis and prognosis of cardiovascular disease. J Am Coll Cardiol. 2016;68(25):2850–2870. doi:10.1016/j.jacc.2016.09.972
18. Zhang A, Sun H, Wang Z, et al. Metabolomics: towards understanding traditional Chinese medicine. Planta Med. 2010;76(17):2026–2035. doi:10.1055/s-0030-1250542
19. Wu GS, Li HK, Zhang WD. Metabolomics and its application in the treatment of coronary heart disease with traditional Chinese medicine. Chin J Nat Med. 2019;17(5):321–330. doi:10.1016/S1875-5364(19)30037-8
20. Yu-te Z, Qiong S, Yu-ting Y, et al. Trilobatin ameliorates HFD/STZ-induced glycolipid metabolism disorders through AMPK-mediated pathways. J Funct Foods. 2023;103:105478.
21. Yang M, Lao L. Emerging applications of metabolomics in Traditional Chinese Medicine treating hypertension: biomarkers, pathways and more. Front Pharmacol. 2019;10:158. doi:10.3389/fphar.2019.00158
22. Fu Y, Zou T, Shen X, et al. Lipid metabolism in cancer progression and therapeutic strategies. MedComm. 2020;2(1):27–59. doi:10.1002/mco2.27
23. Wang M, Chen L, Liu D, et al. Metabolomics highlights pharmacological bioactivity and biochemical mechanism of Traditional Chinese Medicine. Chem Biol Interact. 2017;273:133–141. doi:10.1016/j.cbi.2017.06.011
24. Li Y, Yao W, Gao Y. Effects of Tang Luo Ning on diabetic peripheral neuropathy in rats revealed by LC-MS metabolomics approach. Biomed Chromatogr. 2022;36(7):e5374. doi:10.1002/bmc.5374
25. Ren JL, Zhang AH, Kong L, et al. Analytical strategies for the discovery and validation of quality-markers of traditional Chinese medicine. Phytomedicine. 2020;67:153165. doi:10.1016/j.phymed.2019.153165
26. He Y, Zhang H, Yang Y, et al. Using metabolomics in diabetes management with Traditional Chinese Medicine: a review. Am J Chin Med. 2021;49(8):1813–1837. doi:10.1142/S0192415X21500865
27. Ma X, Chi Y-H, Niu M, et al. Metabolomics coupled with multivariate data and pathway analysis on potential biomarkers in cholestasis and intervention effect of Paeonia lactiflora pall. Front Pharmacol. 2016;7:14. doi:10.3389/fphar.2016.00014
28. Jobgen WS, Fried SK, Fu WJ, et al. Regulatory role for the arginine-nitric oxide pathway in metabolism of energy substrates. J Nutr Biochem. 2006;17(9):571–588. doi:10.1016/j.jnutbio.2005.12.001
29. Todorovic SM. Painful diabetic neuropathy: prevention or suppression? Int Rev Neurobiol. 2016;127:211–225.
30. Raghavan SA, Dikshit M. Vascular regulation by the L-arginine metabolites, nitric oxide and agmatine. Pharmacol Res. 2004;49(5):397–414. doi:10.1016/j.phrs.2003.10.008
31. Reyes AA, Karl IE, Klahr S. Role of arginine in health and in renal disease. Am J Physiol. 1994;267(3 Pt 2):F331–F346. doi:10.1152/ajprenal.1994.267.3.F331
32. Wu G, Morris SM. Arginine metabolism: nitric oxide and beyond. Biochem J. 1998;336(Pt 1):1–17. doi:10.1042/bj3360001
33. Flynn NE, Meininger CJ, Haynes TE, et al. The metabolic basis of arginine nutrition and pharmacotherapy. Biomed Pharmacother. 2002;56(9):427–438. doi:10.1016/S0753-3322(02)00273-1
34. Wijnands KA, Castermans TM, Hommen MP, et al. Arginine and citrulline and the immune response in sepsis. Nutrients. 2015;7(3):1426–1463. doi:10.3390/nu7031426
35. Do KQ, Benz B, Grima G, et al. Nitric oxide precursor arginine and S-nitrosoglutathione in synaptic and glial function. Neurochem Int. 1996;29(3):213–224. doi:10.1016/0197-0186(96)00002-2
36. Ma X, Ruan G, Wang Y, et al. Two single-nucleotide polymorphisms with linkage disequilibrium in the human programmed cell death 5 gene 5’ regulatory region affect promoter activity and the susceptibility of chronic myelogenous leukemia in Chinese population. Clin Cancer Res. 2005;11(24 Pt 1):8592–8599. doi:10.1158/1078-0432.CCR-05-0039
37. Sun Y, Kong L, Zhang AH, et al. A hypothesis from metabolomics analysis of diabetic retinopathy: arginine-creatine metabolic pathway may be a new treatment strategy for diabetic retinopathy. Front Endocrinol. 2022;13:858012. doi:10.3389/fendo.2022.858012
38. Nishio A, Rehermann B. Virus-induced interferon regulates the urea cycle. Immunity. 2019;51(6):975–977. doi:10.1016/j.immuni.2019.11.012
39. Shekunova EV, Kashkin VA, Muzhikyan AА, et al. Therapeutic efficacy of arginine-rich exenatide on diabetic neuropathy in rats. Eur J Pharmacol. 2020;866:172835. doi:10.1016/j.ejphar.2019.172835
40. Tejero J, Hunt AP, Santolini J, et al. Mechanism and regulation of ferrous heme-nitric oxide (NO) oxidation in NO synthases. J Biol Chem. 2019;294(19):7904–7916. doi:10.1074/jbc.RA119.007810
41. Thomsen K, Rubin I, Lauritzen M. NO- and non-NO-, non-prostanoid-dependent vasodilatation in rat sciatic nerve during maturation and developing experimental diabetic neuropathy. J Physiol. 2002;543(Pt 3):977–993. doi:10.1113/jphysiol.2002.023564
 © 2023 The Author(s). This work is published and licensed by Dove Medical Press Limited. The
full terms of this license are available at https://www.dovepress.com/terms
and incorporate the Creative Commons Attribution
- Non Commercial (unported, 3.0) License.
By accessing the work you hereby accept the Terms. Non-commercial uses of the work are permitted
without any further permission from Dove Medical Press Limited, provided the work is properly
attributed. For permission for commercial use of this work, please see paragraphs 4.2 and 5 of our Terms.
© 2023 The Author(s). This work is published and licensed by Dove Medical Press Limited. The
full terms of this license are available at https://www.dovepress.com/terms
and incorporate the Creative Commons Attribution
- Non Commercial (unported, 3.0) License.
By accessing the work you hereby accept the Terms. Non-commercial uses of the work are permitted
without any further permission from Dove Medical Press Limited, provided the work is properly
attributed. For permission for commercial use of this work, please see paragraphs 4.2 and 5 of our Terms.