")
Back to Journals » International Journal of Nanomedicine » Volume 19
Anti-Cancer Potency of Copper-Doped Carbon Quantum Dots Against Breast Cancer Progression
Authors Wang M, Lan S, Zhang W , Jin Q, Du H, Sun X, He L, Meng X, Su L , Liu G
Received 14 November 2023
Accepted for publication 20 February 2024
Published 27 February 2024 Volume 2024:19 Pages 1985—2004
DOI https://doi.org/10.2147/IJN.S449887
Checked for plagiarism Yes
Review by Single anonymous peer review
Peer reviewer comments 2
Editor who approved publication: Dr Kamakhya Misra
Mengqi Wang,1,* Shuting Lan,1,* Wenqi Zhang,1,* Qin Jin,2 Hua Du,3 Xiaomei Sun,1 Lijun He,1 Xiangyun Meng,1 Liya Su,1 Gang Liu1
1Key Laboratory of Medical Cell Biology, Department of Achievement Transformation, Affiliated Hospital of Inner Mongolia Medical University, Hohhot, Inner Mongolia, People’s Republic of China; 2Department of Pathology, Affiliated Hospital of Nantong University, Nantong, Jiangsu, People’s Republic of China; 3Department of Pathology, Affiliated Hospital of Inner Mongolia Medical University, Hohhot, Inner Mongolia, People’s Republic of China
*These authors contributed equally to this work
Correspondence: Gang Liu, Email [email protected]
Introduction: The anti-cancer potency of copper-doped carbon quantum dots (Cu-CDs) against breast cancer progression needs more detailed investigations.
Methods: With urea and ethylene glycol applied as carbon sources and copper sulfate used as a reactive dopant, Cu-CDs were synthesized in the current study by a one-step hydrothermal synthesis method, followed by the characterization and biocompatibility evaluations of Cu-CDs. Subsequently, the anti-cancer potency of Cu-CDs against breast cancer progression was confirmed by these biochemical, molecular, and transcriptomic assessments, including viability, proliferation, migration, invasion, adhesion, clonogenicity, cell cycle distribution, apoptosis, redox homeostasis, and transcriptomic assays of MDA-MB-231 cells.
Results: The biocompatibility of Cu-CDs was confirmed based on the non-significant changes in the pathological and physiological parameters in the Cu-CDs treated mice, as well as the noncytotoxic effect of Cu-CDs on normal cells. Moreover, the Cu-CDs treatments not only decreased the viability, proliferation, migration, invasion, adhesion, and clonogenicity of MDA-MB-231 cells but also induced the redox imbalance, cell cycle arrest, and apoptosis of MDA-MB-231 cells via ameliorating the mitochondrial dysfunctions and regulating the MAPK signaling pathway.
Conclusion: Our findings confirmed the biosafety and excellent anti-cancer potency of Cu-CDs against breast cancer progression by tapping into mechanisms that disrupt malignant behaviors and oxidative homeostasis of breast cancer cells.
Keywords: copper, carbon quantum dots, breast cancer, oxidative stress, MAPK signaling pathway
Introduction
Breast cancer, one of the most malignant cancers with high mortality rates, is predominantly delayed due to the absence of early clinical symptoms.1,2 Nowadays, the applications of chemotherapeutics, hormone therapy, targeted therapy, and epigenetic drugs (mainly histone deacetylases and DNA methyltransferase inhibitors) effectively promote the prognosis and clinical treatment of breast cancer patients by blocking and regulating these multiple targets and biological pathways during carcinogenesis.3–5 However, the deteriorated relapse and metastasis in prolonged periods of clinical treatments, caused by the insufficient drug sensitivity in vivo6–8 and toxic-side effects on cells, tissues, and organs,9–12 seriously affect the outcome of clinical treatments and the quality of daily life for breast cancer patients.13 Even with a mastectomy, the outcomes of breast cancer patients remain unsatisfactory due to the complex mechanism of carcinogenesis, recurrence, and metastasis in vivo.14,15 Therefore, new therapeutic regimens and strategies for breast cancer patients are urgently needed.
During the carcinogenesis, recurrence, and metastasis processes in vivo, mitochondrial dysfunction induced by the chemical depletion or overproliferation of mitochondrial DNA (mtDNA), impairment of the mitochondrial respiratory chain, pathogenic mtDNA mutations, or defects of these nuclear-encoded mitochondrial enzymes seriously promoted the malignant behaviors and invasive properties of cancer cells to an apoptosis-resistant and chemo-resistant phenotype.16,17 The abovementioned regulation mechanisms are positively related to these various vital intracellular processes, including the regulation of immune destruction, cellular invasion, metabolic reprogramming, cellular proliferation, chronic inflammations, death resistance, induced angiogenesis, or replicative immortalities.18–22 Moreover, the alterations in oncogenes or tumor suppressors such as tumor suppressor p53 (TP53) or hypoxia-inducible factor 1 (HIF-1) also disturbed mitochondrial respiration and cellular metabolism, in turn contributing to enhanced tumorigenesis and carcinogenic transformation, as well as potentially facilitating cancer metastasis.16
Based on the increased understanding of the role of mitochondrial alterations during oncogenesis and tumor progression, growing evidence in the past decades has indicated that mitochondrial dysfunctions increase the production of reactive oxygen species (ROS) and lead to the accumulation of these oncometabolites such as fumarate, succinate, and 2-hydroxyglutarate.16 These devastating cascades inflict serious damage to the mitochondrial oxidative phosphorylation (OXPHOS) system, resulting in the aggravation of oxidative stress-related damages. Adverse effects of these cascades not only inevitably exacerbate mtDNA mutations but also trigger the mtDNA epigenetic regulation (mitoepigenetics) abnormalities (including histone hypermethylation, histone acetylation, histone phosphorylation, histone glycosylation, and DNA methylation),23,24 subsequently disturbing the nucleosomal assembly, chromatin remodeling, and genomic stability.25 Given the fatal role of mitochondrial dysfunctions in promoting breast cancer progression, targeting mitochondrial alterations and mitochondrial retrograde signaling have been applied as promising therapeutic strategies and diagnostic potentials for selective anti-cancer therapies in breast cancer pathophysiology.17,26,27 During the last decade, several mitochondria-targeting therapeutic agents such as liposomes, epigenetic agents, biguanides, vitamin analogues, bedaquiline, and nanoparticles have been designed to target mtDNA and increase tumor cell apoptosis for the clinical trials for cancer patients.17
These recent breakthroughs in nanotechnology and nanomaterials promoted the combination therapy against malignant cancers by allowing the safe delivery or release of anti-cancer drugs28–30 and alleviating their toxic side effects.31 According to these former publications, carbon quantum dots (CDs), one of inorganic-based nanomaterials with inherent photophysical properties and excellent biocompatibilities, have been exploited for cell tracking, functional enzyme designing, bio-photo sensing, bio-imaging, and anti-tumor drug delivery.32–34 Additionally, the synthetic modifications of CDs not only improve the stability and biocompatibility of uncapped CDs35–37 but also eliminate the abnormal generation of free radicals, DNA damage, and apoptosis levels caused by uncapped CDs.29,30 Accordingly, the anti-cancer potencies of modified CDs have been examined in multi-therapeutic models or even clinical trials.29,38–42 However, the regulation mechanism related to the anti-cancer potency of copper-doped CDs (Cu-CDs) in interfacing with breast cancer progression via ameliorating the mitochondrial dysfunctions has not been investigated.
After the synthesis, characterization, and biocompatibility evaluations of Cu-CDs, MDA-MB-231 cells were treated with Cu-CDs in the present study, followed by assessments, including viability, proliferation, migration, invasion, adhesion, clonogenicity, cell cycle distribution, redox homeostasis, and apoptosis. Moreover, RNA-seq analyses were conducted to elucidate the regulation mechanism related to the anti-cancer effect of Cu-CDs, inspiring the future development of therapeutic applications for nanomedicine in the clinical treatment of breast cancer progression.
Materials and Methods
Chemicals
Unless otherwise indicated, the chemicals used in the present study were obtained from Sigma-Aldrich (Shanghai, China) and Thermo Fisher (Shanghai, China).
Synthesis and Characterization of Cu-CDs
For the synthesis of Cu-CDs, 300 mg copper sulfate (99.95%, Kermel, Tianjin, China) and 1.0 g urea (99%, General-Reagent, Shanghai, China) was added to the mixed solution of 2 mL ethylene glycol (99.7%, Concord, Tianjin, China), 5 mL distilled water, and 5 mL Dimethyl sulfoxide (95%, Heowns, Tianjin, China). All solvents were uniformly mixed, transferred to 50 mL PTFE liner, and then reacted at 200 °C for 10 h. After the reaction, all solution was cooled to room temperature with the precipitate removed by centrifugation at 8000 rpm for 20 min. After centrifugation, the supernatant was collected, dialyzed for 24 h by a 1000 kDa dialysis bag, and freeze-dried for 48 h.
The transmission electron microscopy (TEM) images of Cu-CDs were obtained by a JEOL JEM-2100F field transmission electron microscope. The X-ray photoelectron spectroscopy (XPS) analysis of Cu-CDs was conducted with an XPS system (Thermo Fisher) using Al monochromatic Ka radiation (hv=1486.6 eV) with the binding energies of the C 1s line at 284.8 eV from adventitious carbon. Fourier transforms infrared (FTIR) spectrum was recorded by an ALPHA FT-IR spectrophotometer system from 370 to 7500 cm−1 using the infrared reflection method. The UV spectrum of Cu-CDs was examined in a solution of water by the OCEAN OPTICS (DH-2000-BAL).
In vivo Biocompatibility Evaluation of Cu-CDs
For the in vivo biocompatibility of Cu-CDs, 18 male C57/BL6 mice (6 weeks), obtained from the SiPeiFu Biotechnology Company (Beijing, China), were housed in polyethylene veterinary cages under controlled conditions (temperature: 20–22°C, relative humidity: 60 ± 10%, and 12-h light/dark cycles) with a standard balanced rodent diet supplied and consumed ad libitum. All animal-related experiments applied in the present study have been approved in accordance with the ethical standards of the Ethics Committee of Inner Mongolia Medical University (Approval number 513, 2023) and conducted according to the NIH Guide for the Care and Use of Laboratory Animals.
After acclimatization for 1 week, each mouse was weighed with the body weight recorded and assigned to the experimental groups (n=9 per group) as follows: negative control group (NC, orally administered with 0.2 mL normal saline) and Cu-CDs group (orally administered with 5 mg/kg body weight of Cu-CDs). Before administration, the power of Cu-CDs was dissolved by normal saline and the concentration and treatment periods of Cu-CDs applied for the in vivo biocompatibility evaluation were optimized based on these former publications.43 According to the experimental design, mice were daily administered corresponding drugs. After treatments for 14 d, all mice were weighed with the blood collected.44 Afterward, all mice were sacrificed by cervical dislocation, and the liver, renal, and testis tissues of each mouse were collected, weighed, and kept in 10% neutral buffered formalin solution (G2161, Solarbio, Beijing, China) for the following histological assay. According to departmental protocol,44 the index of the liver, renal, and testis was calculated as the wet organ weight/body weight ×%. The in vivo biocompatibility evaluation of Cu-CDs was investigated by assessing the blood physiological parameters, including white blood cell (WBC), red blood cell (RBC), hemoglobin (HGB), platelet (PLT), mean corpuscular hemoglobin (MCH), and mean corpuscular hemoglobin concentration (MCHC). Subsequently, the liver and renal functions of each group were analyzed by assessing the plasma levels of blood urea nitrogen (BUN), creatinine (CRE), alanine aminotransferase (ALT), and aspartate aminotransferase (AST) by an automated chemistry analyzer (AU5800, Beckman, Shanghai, China). Moreover, the inflammatory levels of each group were detected by assessing the IL-1β and IL10 levels in mice serum by an enzyme-linked immunosorbent assay (ELISA) with commercial kits (88-7013-88 for IL-1β and 88-7105-88 for IL-10, Thermo Fisher, Shanghai, China). After formalin fixation, the paraffin sections of the liver, renal, and testis tissues were prepared.45 The paraffin sections were stained with a hematoxylin and eosin staining (H&E) kit (G1120, Solarbio, Beijing, China), a periodic acid Schiff (PAS) staining kit (G1281, Solarbio, Beijing, China), or a Masson trichrome staining kit (G1345, Solarbio, Beijing, China) to confirm the in vivo biocompatibility of Cu-CDs.
For in vitro biocompatibility evaluation of Cu-CDs, a rat renal tubular epithelial cells (NRK52E), a mouse Leydig cell line (TM3), and a bovine mammary alveolar cell-T (MacT), were applied. NRK52E and TM3 cells, validated by the short tandem repeat (STR) profiling, were obtained from the Cell Bank of Procell Life Science & Technology Company (CL-0174 for NRK52E cells and CL-0234 for TM3 cells, Wuhan, China). MacT cells were kindly gifted by Mr. Yuhao Chen from the College of Life Science at Inner Mongolia University. The Ethics Committee of Inner Mongolia Medical University approved the use of the above cell lines (Approval number 513, 2023).
To avoid the contamination possibility and to ensure the repeatability of the present study, NRK52E, TM3, and MacT cells were cultured by commercial culture medium (CM-0147 for NRK52E cells, CM-0234 for TM3 cells, and PM150210B for MacT cells, Procell Technology, Wuhan, China). Before in vitro biocompatibility evaluation of Cu-CDs treatments, the powder of Cu-CDs was dissolved by the corresponding culture medium with the final concentration of Cu-CDs as 50 μg/mL and the groups set as the Cu-CDs group.46,47 In addition, the cells cultured with the same volume of corresponding culture medium were set as the NC group. According to the experimental design, cells were cultured in a living cell workstation (IncuCyte Zoom, Essen BioScience, USA) with the cell morphology in both groups recorded at 6 h, 18 h, and 24 h post-treatment. After 24 h of Cu-CDs treatments, the cell viabilities of each group were detected by a Countess II Automated Cell Counter (Thermo Fisher, Beijing, China).
Cytotoxicity Effect Assay of Cu-CDs Treatment Against Breast Cancer Progression
MDA-MB-231 cells were kindly gifted by Miss Jinyang Li from West China Hospital of Sichuan University. After cell thawing, MDA-MB-231 cells were cultured by RPMI 1640 medium (01-100-1ACS, Biological Industries, Shanghai, China) supplemented with 10% fetal bovine serum (FBS, C04001, VivaCell, Shanghai, China) and 100 IU/mL penicillin/streptomycin antibiotics (P/S, 15070063, Thermo Fisher, China).
The cytotoxicity effect of Cu-CDs treatment against breast cancer progression was analyzed by a 3-(4,5-dimethylthiazol-2-yl)-2,5-diphenyl tetrazolium bromide (MTT) assay. Briefly, MDA-MB-231 cells were placed in 96 wells-culture plates (Corning, Beijing, China) at a density of 5000 per plate and cultured for 24 h. For Cu-CDs treatments, the culture medium of MDA-MB-231 cells was individually supplemented with 20, 40, 80, and 160 μg/mL Cu-CDs with MDA-MB-231 cells incubated for 24 h. In addition, MDA-MB-231 cells cultured by the culture medium supplemented with the same volume of Dulbecco’s phosphate-buffered saline (DPBS, 14190250, Thermo Fisher, Beijing, China) were set as the NC group. After drug treatments, 10 μL MTT solution (5 mg/mL, C0009S, Beyotime, Shanghai, China) was added to the culture medium with the 96 wells-culture plates incubated at 37 °C for 2 h. After supplementation of 100 μL dimethyl sulfoxide solution (DMSO, CD4731, Coolaber, Beijing, China), the 96 wells-culture plates were incubated at 37 °C for 2 h and the absorbance at 570 nm of 96 wells-culture plates was measured by a microtiter plate reader (Multiskan, Thermo Fisher, Beijing, China). Subsequently, the inhibiting rate (IR) of Cu-CDs treatments on the proliferation of breast cancer cells was calculated and the Cu-CDs concentration applied for the following assessments was optimized.
EdU Staining Assay
The potential effect of Cu-CDs treatments on inhibiting the proliferation potentials of breast cancer cells was confirmed by a 5-ethynyl-2’-deoxyuridine (EdU) staining assay.48 Accordingly, MDA-MB-231 cells were washed with DPBS solution and incubated with the EdU staining solution (C0071S, Beyotime, Shanghai, China) at 37 °C for 2 h. After incubation with 10 μg/mL of 4’,6-diamidino-2-phenylindole solution (DAPI, C0065, Solarbio, Beijing, China) at 37 °C for 5 min, the EdU staining of each group was examined and recorded. The relative EdU staining density of each group was analyzed by Image J software.
Migration Assay
The potential effect of Cu-CDs treatments on the migration capacity of breast cancer cells was confirmed by a wound-healing assay.49 Briefly, MDA-MB-231 cells were collected, plated in 6-well culture plates (Corning, Beijing, China), and cultured for 24 h. Before Cu-CDs treatments, a wound across the cell monolayer was prepared by scratching with a 200 μL plastic pipette tip. After washing with DPBS solution, the culture medium of MDA-MB-231 cells was supplemented with Cu-CDs or DPBS solution. After culturing for 24 h, the wound closure was observed and recorded.
Transwell Invasion Assay
The potential effect of Cu-CDs treatments on the invasion ability of breast cancer cells was analyzed by a Transwell invasion assay. Accordingly, MDA-MB-231 cells, resuspended in the serum-free culture medium supplemented with Cu-CDs or DPBS solution, were plated into the upper chamber of a Transwell invasion well (Corning, Beijing, China) at a density of 2×10³ per well, while the bottom chamber was supplemented with 600 μL culture medium. After culturing for 24 h, MDA-MB-231 cells on the upper chamber were removed by a swab with the chamber fixed in methanol and stained with 0.1% crystal violet solution (C0121, Beyotime, Shanghai, China). Subsequently, MDA-MB-231 cells migrated through the chamber and were recorded with the cell number quantified by Image J software.
Cell Adhesion Assay
A cell-matrix adhesion assay was carried out to evaluate the potential effect of Cu-CDs treatments on the cell adhesion ability of breast cancer cells.50 Briefly, 30 μL of fibronectin (5 μg/mL, FC010, Millipore, Beijing, China) was added to the 96-well culture plates, followed by overnight incubation, air drying at room temperature, and blocking with 0.1% bovine albumin solution (BSA, V900933, Sigma-Aldrich, Shanghai, China). Subsequently, MDA-MB-231 cells of both groups were collected, resuspended, and replated at pre-coated 96-well culture plates with a density of 5×10³ cells per well. After culturing for 30 min, the 96-well culture plates were washed with DPBS solution. The attached cells were fixed with methanol and stained with 0.1% crystal violet solution. The number of adherent cells in each group was photographed and recorded.
Clonogenicity Assay
A clonogenicity assay was conducted to evaluate the anti-cancer effect of Cu-CDs treatments against breast cancer progression.51 Briefly, MDA-MB-231 cells were collected, plated in a 6-well culture plate at a density of 1000 cells per well, and cultured with the culture medium supplemented with Cu-CDs or DPBS solution for 7 d. The visible colonies were fixed with 4% paraformaldehyde solution (PFA, P1110, Solarbio, Beijing, China) and incubated with 0.1% crystal violet solution. The number of colonies was examined and recorded.
Cell Cycle Assay
For cell cycle assay, MDA-MB-231 cells of both groups were collected, resuspended, and fixed with ice-cold 70% ethanol at −20 °C overnight. Cell cycle assay of each group was conducted and analyzed by flow cytometry (FACS) with a FACScan flow cytometer (BD Biosciences).
Mitochondrial Functions Assessment
The effect of Cu-CDs treatments on mitochondrial dysfunctions of breast cancer cells was confirmed by assessing the mitochondrial activity and mitochondrial membrane potentials (ΔΨm) of MDA-MB-231 cells by MitoTracker staining and JC-1 staining.52
For MitoTracker staining, MDA-MB-231 cells after PFA fixation were washed with DPBS solution and incubated with 200 nM MitoTracker staining solution (C1049, Beyotime, Shanghai, China) at 37 °C for 30 min. After DAPI staining, the MitoTracker staining was recorded with the MitoTracker staining intensity analyzed by Image J software.
For JC-1 staining, MDA-MB-231 cells were washed with DPBS solution and incubated with 10 μM JC-1 staining solution (C2006, Beyotime, Shanghai, China) at 37 °C for 20 min. Subsequently, the staining signals of J-aggregate (green staining intensity) and J-monomer (red staining intensity) were recorded with ΔΨm potentials (relative J-aggregate/J-monomer staining intensity ratio) analyzed by Image J software.
ROS Production Assay
The effect of Cu-CDs treatments on the redox homeostasis of breast cancer cells was further analyzed by assessing ROS production in MDA-MB-231 cells.48 MDA-MB-231 cells were incubated with 10 μM dichlorofluorescein diacetate (DCFH-DA) staining solution (S0033, Beyotime, Shanghai, China) at 37 °C for 30 min. After DAPI staining, the DCFH-DA staining was examined and recorded with the ROS production level analyzed by the quantification of DCFH-DA staining intensity by Image J software.
Redox Homeostasis Assay
The effect of Cu-CDs treatments against the redox homeostasis in breast cancer cells was confirmed by the assessment of GSH, SOD, and MDA activities in the Cu-CDs treated MDA-MB-231 cells by commercial kits (S0052 for GSH, S0109 for SOD, and S0131 for MDA, Beyotime, Shanghai, China).
Assessment of DNA Damages and Apoptosis
The effect of Cu-CDs treatments on DNA damage and apoptosis of breast cancer cells was investigated by the immunofluorescence (IF) staining of γH2A, Annexin-V staining, and Western blot analysis.
For IF staining, MDA-MB-231 cells after PFA fixation were permeabilized with 0.5% Triton X-100 solution (T8200, Solarbio, Beijing, China) at 37 °C for 15 min and incubated with 5% BSA at 37 °C for 15 min. Subsequently, the cells were incubated with a rabbit anti-γH2A antibody (with 1:500 dilutions, ab81299, Abcam, Shanghai, China) at 4 °C overnight. After the incubation of the secondary antibody at 37 °C for 1 h, the cells were washed with DPBS solution and incubated with DAPI staining solution. After examination and record of IF staining, the DNA damages of each group were analyzed by the calculation of IF staining intensity of γH2A by ImageJ software.
Moreover, MDA-MB-231 cells were collected, washed with 4 °C pre-cold DPBS solution, and incubated with Annexin V-FITC solution (CA1020, Solarbio, Beijing, China) at 37 °C for 5 min. After the incubation of propidium iodide (PI) solution, a FACS assay of cellular apoptosis was conducted within 1 h.
For Western blot analysis of these apoptosis-related proteins, total protein lysates of both groups were extracted and quantified by commercial kits (DE101, Transgen, Beijing, China) and BCA assay kits (PC0020, Solarbio, Beijing, China). The proteins lysates were resolved on SDS-PAGE gels (P1200, Solarbio, Beijing, China), transferred to polyvinylidene fluoride membranes (PVH00010, Millipore, Beijing, China), and immunoblotted with a rabbit anti-Bax antibody (with 1:2000 dilutions, 50599-2-IG, Proteintech, Wuhan, China), a rabbit anti-Bcl-2 (with 1:2000 dilutions, 12789-1-AP, Proteintech, Wuhan, China) or a mouse anti-ACTIN antibody (with 1:2000 dilutions, CW0096M, CWbio, Beijing, China) at 4 °C overnight. After being rinsed with TBST solution, these immunoblotted membranes were incubated with secondary antibodies (with 1:2000 dilutions, CWbio, Beijing, China) at room temperature for 1 h, visualized with enhanced chemiluminescence solution (ECL, W1001, Promega, Beijing, China), and recorded in ChampChemi (Beijing, China).
Transcriptomics Analysis
To confirm the comprehensive regulation mechanism related to the effect of Cu-CDs treatments against breast cancer progression, RNA-Seq analysis of MDA-MB-231 cells of both groups was conducted by the Frasergen Biotechnology Company (Wuhan, China).44 Approved by the Ethics Committee of Inner Mongolia Medical University (Approval number 513, 2023), the total RNA of each group was extracted by a Trizol reagent kit (Invitrogen, Carlsbad, CA, USA). RNA quality was evaluated by an Agilent 2100 Bioanalyzer (Agilent Technologies, Palo Alto, CA, USA) and checked by RNase-free agarose gel electrophoresis. Subsequently, mRNA of each group was enriched by Oligo (dT) beads, fragmented into short fragments by fragmentation buffer, and reversely transcribed into cDNA by NEBNext® Ultra™ RNA Library Prep Kit for Illumina® (7530, New England Biolabs, Ipswich, MA, USA). The purified double-stranded cDNA fragments were end-repaired, A base added, and ligated to Illumina sequencing adapters. After the purification of the ligation reaction by the AMPure XP Beads (1.0 ×), PCR was amplified and the cDNA library was sequenced using Illumina Novaseq6000.
The raw data was filtered for the bioinformatics analyses with the low-quality reads trimmed by fastp software (Version 0.18.0). The selected clean reads were aligned to the reference genomic sequence using HISAT2.2.4 with the transcript expression calculated using RSEM software and differentially expressed genes (DEGs) analyzed by the DESeq2 software. In the present study, the genes with the parameter of false discovery rate (FDR)<0.05 and absolute fold change (FC) ≥ 2 were considered DEGs. All DEGs were analyzed by gene ontology (GO) analysis and Kyoto Genes and Genomes (KEGG) enrichment.
Furthermore, the potential target interactions were analyzed by using the String database with the organism settings of Homo sapiens and a moderate confidence ≥ 0.4. The MNC plug-in in Cytoscape (Version 3.6.1) was used to examine the PPI network and nominate the hub genes with top node degrees.
Accuracy Validation of RNA-Seq Data
To validate the accuracy of RNA-Seq data, the different expression patterns of 10 DEGs of interest in the breast cancer tissues and normal breast tissues were assessed by the GEPIA database, followed by the quantitative assessments of Real-time PCR analyses of these DEGs of interest and MAPK signaling pathway-related genes53 in the MDA-MB-231 cells of both groups.
For Real-time PCR analyses, the mRNA of each group was extracted by Trizol reagent. After the reversed syntheses of cDNA, the Real-time PCR of each group was performed by a Real-time PCR kit (RR820A, Takara, Dalian, China) with β-actin applied as internal controls. After Real-time PCR analyses, the PCR qualities were checked by the melting curves with the relative gene expression levels of each group calculated by the 2−ΔΔCt method.45 The specific primers for the reverse transcription PCR and Real-time PCR analyses were shown in Supplemental Table 1.
Based on the GEPIA database, the accuracy of RNA-Seq data was analyzed by investigating the different expression patterns of these selected hub genes between the breast cancer samples and normal breast samples. The Kaplan-Meier plotter database was applied to reveal the potential relationship between the expression levels of these selected hub genes and the relapse-free survival (RFS) or overall survival (OS) of breast cancer patients. Lastly, Real-time PCR analyses of these selected hub genes in the MDA-MB-231 cells of both groups were performed to confirm the effect of Cu-CDs treatments on manipulating the expression patterns of these hub genes with the specific primers added in the Supplemental Table 1.
Calculation of Staining Intensity
During the process of the abovementioned staining assessment, the same staining procedures of each group were conducted to guarantee the validity of experimental data. The parameters within the microscope or ChampChemi were set to the same for the record of the staining result. For the calculation of staining intensity, Image J software was applied to define a region of interest (ROI) with the average staining intensity per unit area within the ROI analyzed. The average staining values were used to calculate the final staining intensity of each staining assessment.
Statistical Analysis
The statistical analysis in the present study was conducted by the Statistical Package for the Social Sciences (SPSS, IBM, Version 19.0) with the experimental statistics presented as mean ± standard deviation (SD). Based on the result of residual normality (Gaussian distribution) and variance homogeneity, the statistical analyses were analyzed by a parametric (one-way ANOVA LSD test) or a nonparametric (Wilcoxon) test. Statistical difference was accepted as significant at P<0.05.
Results
Synthesis Optimization and Characteristics of Cu-CDs
As shown in Figure 1A, the TEM results revealed that the spherical nanoparticles were successfully synthesized, and the inset results confirmed that the Cu-CDs were crystalline with a lattice-spacing distance of around 0.23 nm, which corresponded to the (100) plane of graphitic carbon. The results of size distribution and polydispersity index of Cu-CDs confirmed that the average diameter of Cu-CDs was around 2.88 nm (Supplemental Figure 1). The XPS results indicated that the Cu successfully coped with CDs (Figure 1B), and the doping ratio was 0.36%. The XPS high-resolution survey of Cu 2P was displayed in Figure 1C. The High-resolution XPS spectrum of C1s shows three peaks at 284.45 eV and 285.0 eV (Supplemental Figure 2A), which were attributed to C=C and C-C, respectively, and the binding energy at 285.6 eV attributed to C-O, C-N, and C-S. N 1s XPS spectrum of the Cu-CDs can be deconvoluted into three peaks at 398.4, 399.7, and 400.3 eV (Supplemental Figure 2B), representing the pyridinic N, pyrrolic N, and amidic N. Moreover, the peak at 399.0 eV was attributed to the -NH2. The two peaks at 163.18 eV (S-p2/3), and 164.17 eV (S-p1/2) suggested the presence of C-S-C, and the peak at 167.5eV revealed a small portion of -SO2 and -SO3 groups on the surface of Cu-CDs (Supplemental Figure 2C). As shown in Supplemental Figure 2D, the O1s spectrum had two peaks centered at 530.86 eV, and 531.71 eV, which could be attributed to C=O, C-O-C/C-OH. Inspired by this work, FTIR was used to investigate the functional groups on the surface of Cu-CDs. As observed in Figure 1D, obvious absorption bands at 3400 cm−1 to 3200 cm−1 were ascribed to the stretching vibration of C-H, N-H, and O-H. The peak at 1600 cm−1 can be attributed to the asymmetric stretching vibration of the COO. These observations confirmed the existence of -OH -COOH and NH2 groups on the surface of Cu-CDs. The characteristic infrared absorption peak band of the N-Cu-N stretching vibration at about 1100 cm−1 was also observed, indicating the formation of Cu-CDs. Almost all FTIR spectra were consistent with the results of XPS.
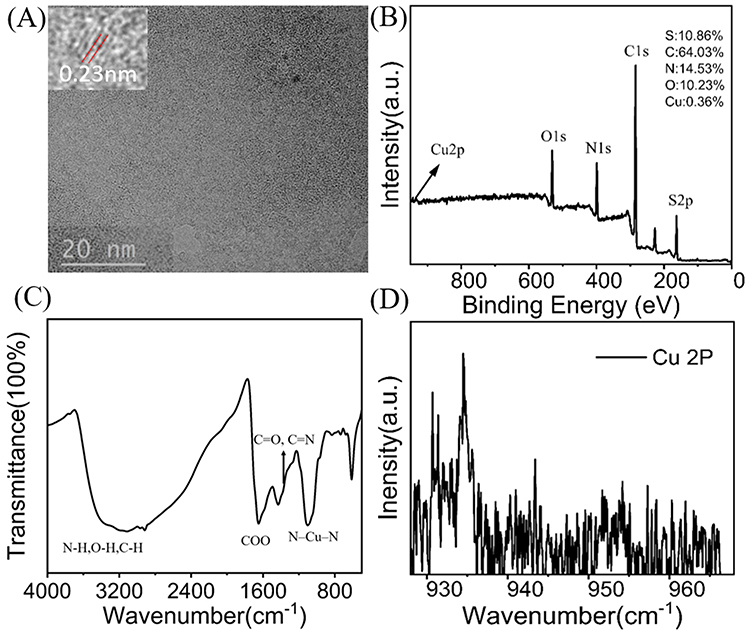 |
Figure 1 Characteristics of Cu-CDs. (A) TEM image of Cu-CDs. The Inset indicates the lattice structure of Cu-CDs. (B) XPS survey spectrum of Cu-CDs. (C) XPS high-resolution survey of Cu 2P. (D) FTIR spectrum of Cu-CDs. |
To analyze the UV-vis absorption, photoluminescence excitation (PLE), and the fluorescence properties (PL) of the as-prepared Cu-CDs, UV–vis absorption and fluorescence spectra were recorded, and the results are shown in Figure 2. The UV spectra reflected the π−π* transitions of C–C bonds for the absorption peak (Figure 2A). The n−π* transitions of non-bonding electrons of oxygen atoms involved in C–O/C=O bonds, both of which displayed a wide peak from 200 nm to 400 nm. The excitation and fluorescence spectra of the Cu-CDs were distinct and well-defined with peaks centered at 370 nm and 419 nm (Figure 2B).
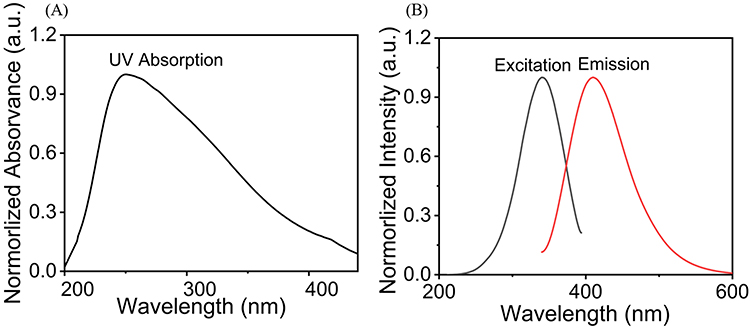 |
Figure 2 Spectral properties of Cu-CDs. (A) UV–vis absorption of Cu-CDs. (B) PLE (black line) and PL (red line) spectra of Cu-CDs. |
Biocompatibility Assessment of Cu-CDs
As presented in Figure 3, non-significant differences in the liver index (Figure 3A, P>0.05), renal index (Figure 3B, P>0.05), and testis index (Figure 3C, P>0.05) between the NC and Cu-CDs groups were found, confirming the non-toxic effect of Cu-CDs treatments on organogenetic development. Likewise, the results of renal and liver function assessment by analyzing the mice’s blood parameters confirmed the non-significant connections between the changes in the renal and liver functions and the Cu-CDs treatments, evidenced by the non-significant differences existing in the BUN (Figure 3D, P>0.05), CRE (Figure 3E, P>0.05), AST (Figure 3F, P>0.05), and ALT (Figure 3G, P>0.05) activities between the NC and Cu-CDs groups. Combined with the non-significant differences in the expression levels of inflammation-related parameters, including IL-1β (Figure 3H, P>0.05) and IL-10 (Figure 3I, P>0.05) between the NC and Cu-CDs groups, as well as the non-significant differences in the physiological parameters such as WBC, RBC, HGB, PLT, MCH, and MCHC (Supplemental Figure 3A–F), above results demonstrated the in vivo biocompatibility of Cu-CDs prepared in the current study.
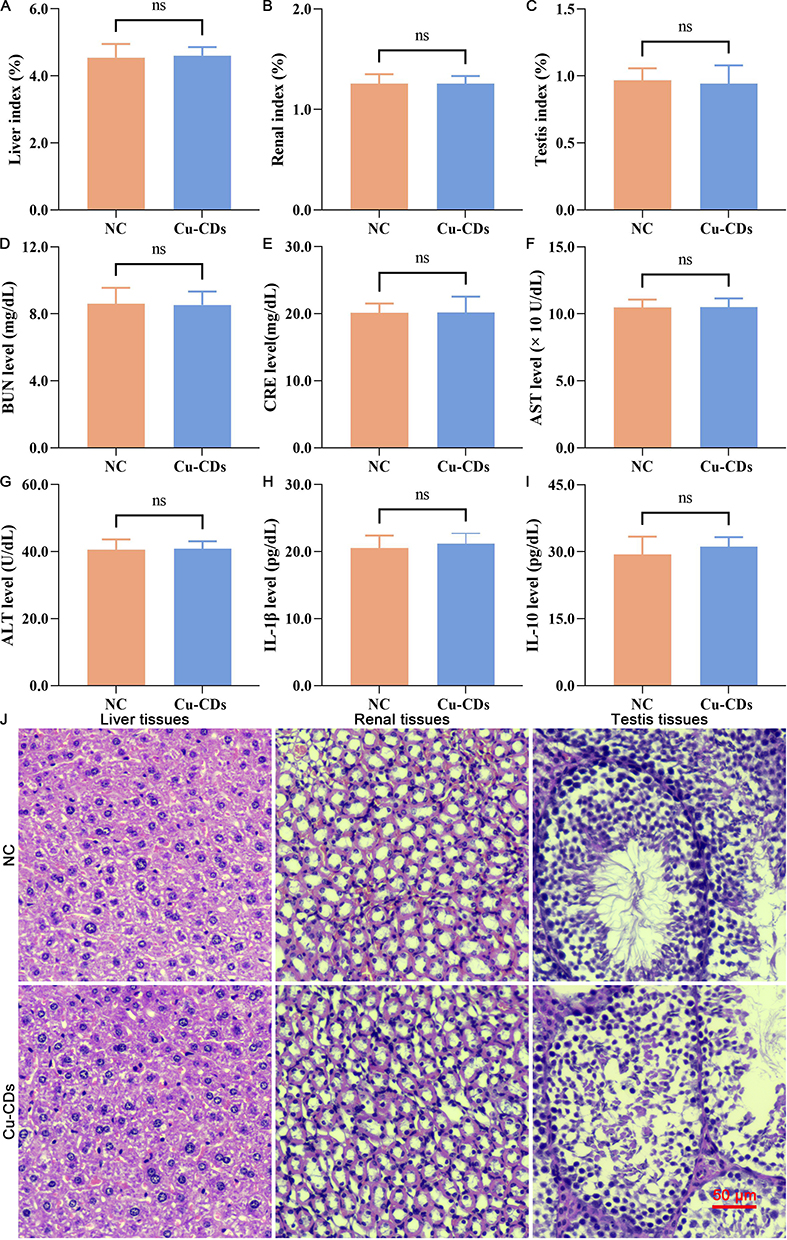 |
Figure 3 In vivo biocompatibility assessment of Cu-CDs. (A) Liver index. (B) Renal index. (C) Testis index. (D) BUN level. (E) CRE level. (F) AST level. (G) ALT level. (H) IL-1β level. (I) IL-10 level. (J) HE staining. ns represents P>0.05. |
Noticeably, histological staining, including H&E, PAS, and Masson trichrome staining, was conducted to confirm the in vivo biocompatibility of Cu-CDs. As shown in Figure 3J–L and Supplemental Figure 3G and H, the staining results confirmed the non-existence of residual Cu-CDs nanoparticles in the mice liver, renal, and testis tissues of the Cu-CDs group. Compared with the NC group, no observable tissue damage was observed in the mice liver, renal, and testis tissues of the Cu-CDs group, indicating that the in vivo biocompatibility of Cu-CDs prepared in the present study was satisfactory.
After the treatment of 50 μg/mL of Cu-CDs for 24 h, the in vitro biocompatibility of Cu-CDs prepared in the present study was verified by the cell models. Compared with the NC group, non-observation of cell damages or inhibition effect of proliferation was found in the Cu-CDs-treated MacT, TM3, and NRK52E cells (Figure 4A–C), as well as the non-significant viability of MacT, TM3, and NRK52E cells between the NC and Cu-CDs groups (Figure 4D–4F, P>0.05), emphasizing the in vitro biocompatibility of Cu-CDs.
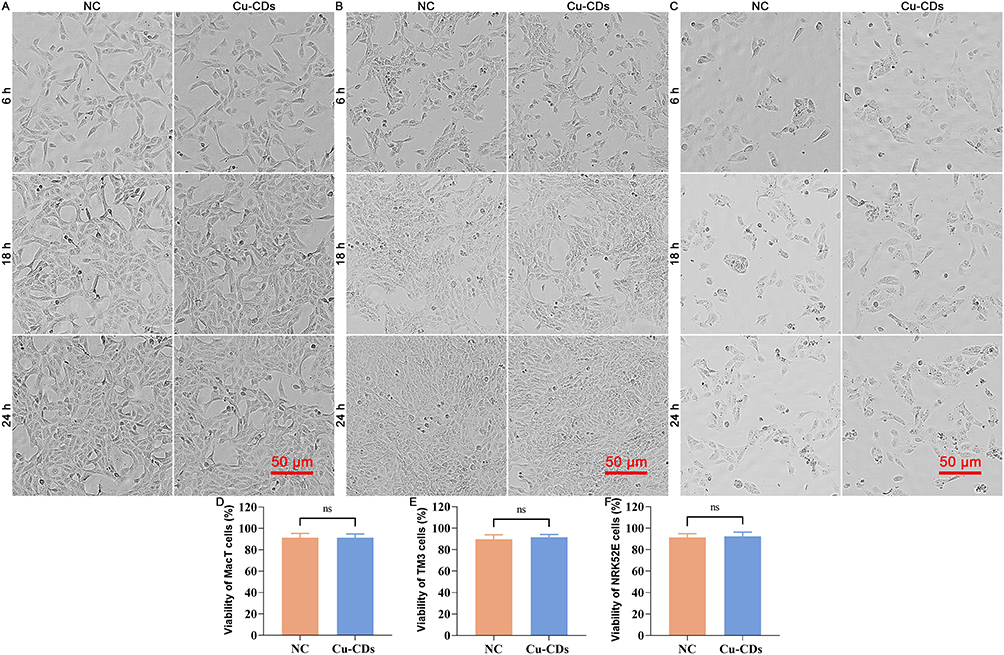 |
Figure 4 In vitro biocompatibility assessment of Cu-CDs. (A) Representative morphology of Cu-CDs exposed MacT cells. (B) Representative morphology of Cu-CDs exposed TM3 cells. (C) Representative morphology of Cu-CDs exposed NRK52E cells. (D) Viability of MacT cells treated with Cu-CDs after 24 h. (E) Viability of TM3 cells treated with Cu-CDs after 24 h. (F) Viability of NRK52E cells treated with Cu-CDs after 24 h. ns represents P>0.05. |
Effect of Cu-CDs Treatments on the Viability, Proliferation, Migration, Invasion, Adhesion, Clonogenicity, Cell Cycle Distribution, and Apoptosis of MDA-MB-231 Cells
Accordingly, the cytotoxicity effect of Cu-CDs treatments on the viability, proliferation, migration, invasion, adhesion, clonogenicity, cell cycle distribution, and apoptosis of MDA-MB-231 cells was analyzed to confirm the anti-cancer capability of Cu-CDs treatments.
As shown in Supplemental Figure 4, the results of the MTT assay revealed that the viabilities of MDA-MB-231 cells at 24 h post-treatment of Cu-CDs were noticeably reduced from 78.53±2.70% for the 20 μg/mL Cu-CDs group, 66.03±2.22% for the 40 μg/mL Cu-CDs group, 45.90±3.12% for the 80 μg/mL Cu-CDs group to 31.97±3.07% for the 160 μg/mL Cu-CDs group in a dose-dependent manner (P<0.05), signifying the adverse effect of Cu-CDs treatments on the viability of MDA-MB-231 cells. Considering the significant differences in the cell viability among each group, 80 μg/mL of Cu-CDs treatments were selected as the optimal dose for the following studies.
Furthermore, the EdU staining was applied to confirm the adverse effect of Cu-CDs treatments on attenuating the proliferation capability of breast cancer cells. As present in Figure 5A and B, the positive EdU staining intensity of the Cu-CDs group was significantly decreased in comparison with that of the NC group (P<0.01), indicating that the Cu-CDs treatment effectively suppressed the proliferation potentials of MDA-MB-231 cells. Besides, the results of the wound healing assessment unveiled that the scratch closure potentials of MDA-MB-231 at 24 h post-treatment of Cu-CDs were remarkably inhibited (Figure 5C and D, P<0.001). Simultaneously, the invasion and adhesion potentials of MDA-MB-231 cells were determined by a Transwell invasion assay and a cell-matrix adhesion assay. Notably, the results confirmed the significantly declined number of MDA-MB-231 cells migrating across the polycarbonate membranes in the Cu-CDs group than that of NC group (Figure 5E and F, P<0.001), as well as the remarkably restrained number of immobilized MDA-MB-231 cells in the Cu-CDs group than that of NC group (Figure 5G and H, P<0.001). Together with the greatly diminished number of clonogenicity (Figure 5I and J, P<0.001) and altered cell cycle arrest (Figure 5K and L) in the Cu-CDs group compared to the NC group, these results underlined the effectively depressed effect of Cu-CDs treatments on breast cancer progression by inhibiting the viability, proliferation, migration, invasion, adhesion, clonogenicity, and cell cycle distribution potentials of MDA-MB-231 cells.
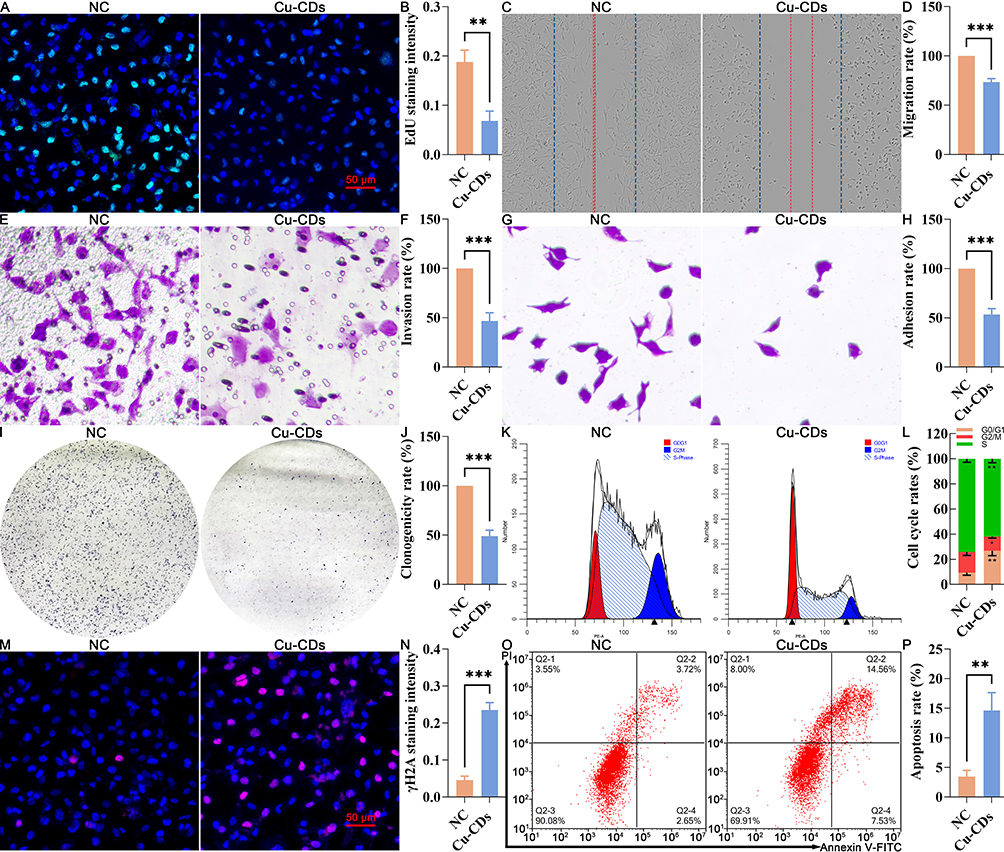 |
Figure 5 Effect of Cu-CDs treatments on the viability, proliferation, migration, invasion, adhesion, clonogenicity, cell cycle distribution, and apoptosis of MDA-MB-231 cells. (A) Representative EdU staining. (B) Relative EdU staining intensity. (C) Representative result of cell migration. (D) Quantitative result of cell migration. (E) Representative result of cell invasion. (F) Quantitative result of cell invasion assay. (G) Representative result of cell adhesion. (H) Quantitative result of cell adhesion assay. (I) Representative result of colony formation assay. (J) Quantitative result of colony formation assay. (K) Cell cycle distribution by flow cytometry. (L) Percentage of cells in each cell cycle phase. (M) Representative IF staining of γH2A. (N) Relative staining intensity of γH2A. (O) Representative FACS result of Annexin V/PI staining. (P) Apoptosis rate. *Represents P<0.05, with **Representing P<0.01, and ***Representing P<0.001. |
To confirm the cytotoxicity effect of Cu-CDs treatments on the malignant characteristics of MDA-MB-231 cells, the cell death induction potentials of Cu-CDs treatments were assessed by the IF staining of γH2A, Annexin V-PI staining, and Western blot. As expected, the stimulated cell death induced by the Cu-CDs treatments was confirmed by the consistent differences in the IF staining intensity of γH2A (Figure 5M and N, P<0.001), positive Annexin V staining signal (Figure 5O and P, P<0.01), and the expression patterns of Bax and Bcl-2 (Supplemental Figure 5, P<0.05) between the NC and Cu-CDs groups, which emphasize the capability of Cu-CDs treatments on perturbing breast cancer progression by its cell death induction capacities.
Effect of Cu-CDs Treatments on the Redox Homeostasis of MDA-MB-231 Cells
The anti-cancer effect of Cu-CDs treatments on triggering the mitochondrial dysfunctions of MDA-MB-231 cells was validated by MitoTracker staining and JC-1 staining. Compared with those of the NC group, the presence of diminished MitoTracker staining intensity (Figure 6A and B, P<0.01) and altered ΔΨm potential (relative J-AGG/ J-MON ratio, Figure 6C and D, P<0.001) in the Cu-CDs group reflected the mitochondrial dysfunctions in the Cu-CDs treated MDA-MB-231 cells. Consistently, the microscopic observation of enhanced DCFH-DA staining intensity in the Cu-CDs group compared to that in the NC group (Figure 6E and F, P<0.001) emphasized the promoted ROS generation levels in the Cu-CDs treated MDA-MB-231 cells.
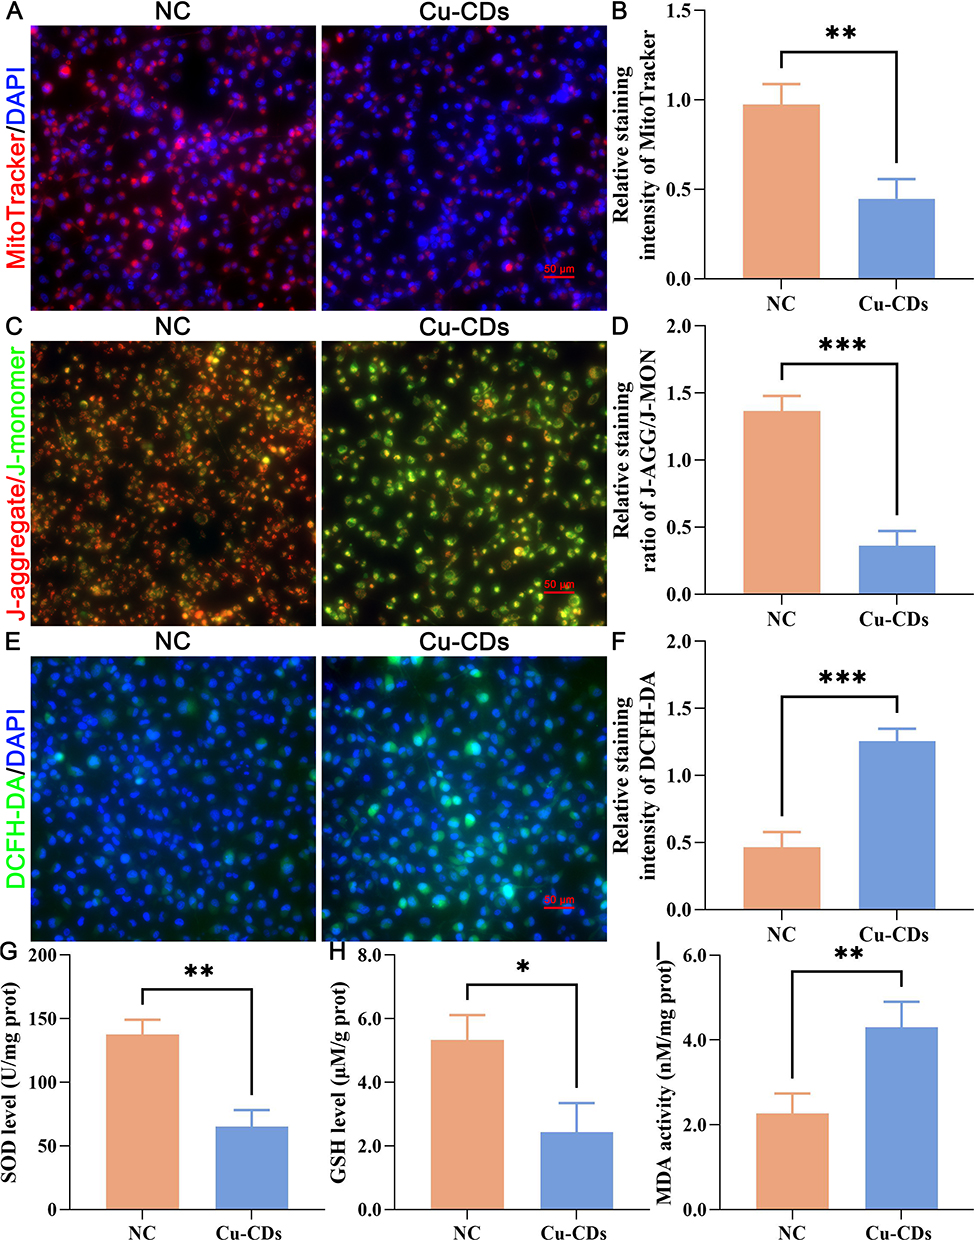 |
Figure 6 Effect of Cu-CDs treatments on the redox imbalance of MDA-MB-231 cells. (A) Representative MitoTracker staining. (B) Relative MitoTracker staining intensity. (C) Representative JC-1 staining. (D) Relative staining ratio of J-AGG/J-MON. (E) Representative DCFH-DA staining. (F) Relative DCFH-DA staining intensity. (G) SOD activity. (H) GSH activity. (I) MDA activity. *Represents P<0.05, with **Representing P<0.01, and ***Representing P<0.001. |
Furthermore, the oxidative stress-related damages induced by the Cu-CDs treatments were determined by assessing the biochemical content including oxidants (MDA) and antioxidants (GSH, SOD) in MDA-MB-231 cells. Our results showed that the SOD (Figure 6G, P<0.01) and GSH (Figure 6H, P<0.05) levels were sharply depleted upon exposure to Cu-CDs treatments. It is worth mentioning that the MDA level in the Cu-CDs group was meaningfully up-regulated in comparison with that of the NC group (Figure 6I, P<0.01), inducing the oxidants generation induced by the Cu-CDs treatments and collectively reaffirming the therapeutic effect of Cu-CDs treatments against breast cancer progression by rewiring the redox homeostasis of breast cancer cells towards cytotoxic oxidation.
RNA-Seq Results of MDA-MB-231 Cells After Cu-CDs Treatment
The unbiased transcriptome characteristics of MDA-MB-231 cells upon Cu-CDs exposure were analyzed to investigate the molecular biology mechanism underlying the therapeutic effect of Cu-CDs treatments against breast cancer progression. In total, 14,916 transcripts were mined in the MDA-MB-231 cells between the NC and Cu-CDs groups. As visualized in Figure 7, the volcano plot (Figure 7A) showed that 2065 genes were statistically identified in both NC and Cu-CDs groups, consisting of 513 upregulated DEGs and 1552 downregulated DEGs in the Cu-CDs group when compared to the NC group (P<0.05). As expected, the heat map shown in Figure 7B confirmed that the MDA-MB-231 cells treated with Cu-CDs had a distinct hierarchical clustering of genes compared to the NC group.
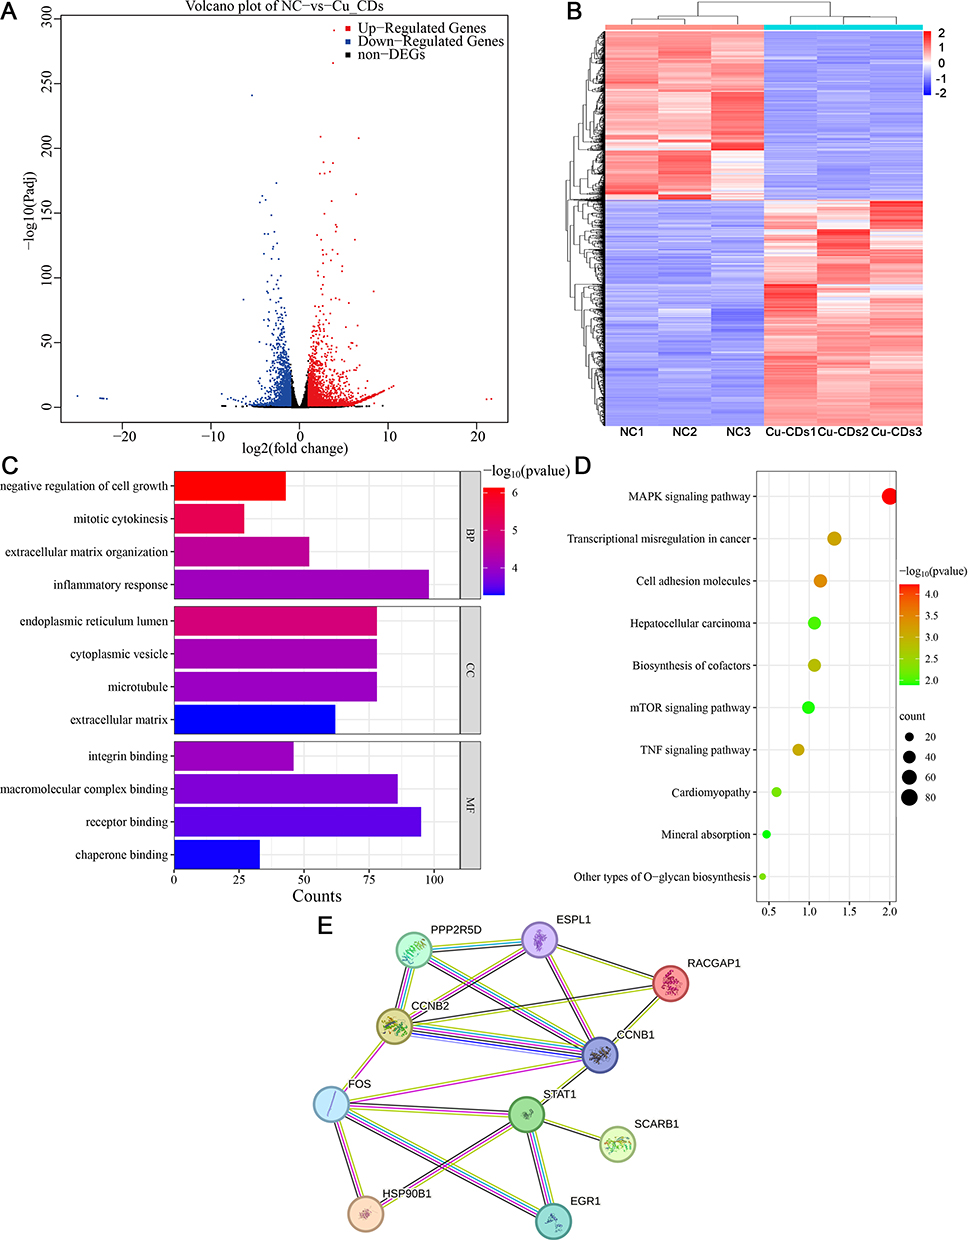 |
Figure 7 Effect of Cu-CDs treatments on the transcriptome characteristics of MDA-MB-231 cells. (A) Volcano plots of DEGs. (B) Heat map of DEGs. (C) GO analysis. (D) KEGG pathway enrichment analysis. (E) Protein–protein interaction network analysis of hub genes. |
Conventionally, the functional enrichment analyses of GO were performed to determine the overall functional implications of identified DEGs. In terms of biological processes (BP), these DEGs were predominantly involved in the subcategories of negative regulation of cell growth, extracellular matrix organization, and inflammatory response, while these DEGs were significantly implicated in cellular component (CC) terms such as endoplasmic reticulum lumen, cytoplasmic vesicle, and microtubule. In terms of molecular function (MF), these DEGs were associated with receptor binding, macromolecular complex binding, and integrin binding (Figure 7C).
Additionally, quantitative assessments of qRT-PCR of 10 DEGs of interest (AKR1C1, CELF6, CRYAB, FOSB, KIF20A, MAOA, MXRA5, OAS2, PLK1, and SYT12) were performed to validate the accuracy of the RNA-Seq data with the different expression patterns of these DEGs of interest in the breast cancer tissues and normal tissues confirmed by the GEPIA database. As expected, the results of the GEPIA database (Supplemental Figure 6A) and the RNA-Seq data (Supplemental Figure 6B) were well matched with the expression profile of DEGs of interest by qRT-PCR (Supplemental Figure 6C), confirming the reliability of the RNA-Seq data.
To characterize the GO-annotated DEGs in the MDA-MB-231 cells treated with Cu-CDs treatments, these DEGs were sorted into the canonical signaling pathways based on KEGG enrichment pathways analysis. On the basis of selection criteria of FDR<0.05, the KEGG results illustrated that these GO-annotated DEGs were mainly enriched in the MAPK signaling pathway, transcriptional misregulation in cancer, cell adhesion molecules, and mTOR signaling pathway (Figure 7D). The RT-PCR results further confirmed that the expression levels of MAPK signaling pathway-related genes (CACNA1C, DDIT3, DUSP2, FOS, GADD45A, JUN, and HSPA6) in the Cu-CDs group were remarkably altered in comparison with those of the NC group (Supplemental Figure 7).
Lastly, the interactive analysis of these overlapping genes was performed via the STRING website and the generated PPI network confirmed that CCNB1, CCNB2, EGR1, ESPL1, FOS, HSP90B1, PPP2R5D, RACGAP1, SCARB1, and STAT1 were the 10 most important targets in the core PPI network (Figure 7E). Expectedly, the results of the GEPIA database and count value of RNA-Seq data confirmed that the expression levels of CCNB1, CCNB2, ESPL1, FOS, and RACGAP1 in the breast cancer samples were significantly different when compared to the normal breast samples (Supplemental Figure 8A and B). More excitingly, the validated qRT-PCR results confirmed that compared with those of the NC group, the expression levels of CCNB1, CCNB2, ESPL1, FOS, and RACGAP1 were altered in the Cu-CDs group (Supplemental Figure 8C). More convincingly, the expression levels of CCNB1, CCNB2, ESPL1, FOS, and RACGAP1 were positively related to the OS and RFS of breast cancer patients included in the Kaplan-Meier plotter database (Supplemental Figure 9), indicating the accuracy of these selected hub genes related to the breast cancer progression.
Taken together, these unbiased transcriptomic and genetic results not only supported the theory that Cu-CDs treatment suppressed breast cancer progression by regulating the malignant behaviors and redox homeostasis of MDA-MB-231 cells but also revealed the possible regulation mechanism upon Cu-CDs treatment via manipulating the MAPK signaling pathway and the expression patterns of these hub genes (CCNB1, CCNB2, ESPL1, FOS, and RACGAP1).
Discussion
During the past decades, the adequately widespread adoption and biomedical applications of cancer-targeted therapies based on the emerging of modern nanotheranostics extensively provide sophisticated insights for revolutionizing the clinical treatment of breast cancer patients from surgical routines to multidisciplinary approaches, including chemotherapies, endocrine therapies, immunotherapies, radiotherapies, and targeted therapies.54 Most recently, the excellent synergistic functionalities, including therapeutic, drug delivery, and biological imaging applications of these multimodal theranostic nanomedicines have aroused broad research interests in the scientific community in exploring and developing versatile biomaterial nanosystems to decrease the gap between cancer diagnosis and treatment with minimized comprehensions.55,56 Simultaneously, these interdisciplinary fields promote the concomitant development of new strategies to integrate multimodal theranostic in precision and even personalized medicines.56 Increasing interests in the development of nanotheranostics for breast cancer diagnosis and therapy have been also motivated by the unique physicochemical properties of these nanotheranostics via distinctively interacting with cells and tissues, thereby catalyzing the transformative shifts for innovative nanoscale targeting techniques.57
As observed in various literatures, Cu-based biomaterial nanosystems originate not only from the extraordinary properties of Cu but also from the tunable physicochemical, biological, and mechanical attributes of the proposed Cu-composed functional nanoparticles. Owing to distinctive physicochemical properties such as elasticity, inexpensive availability, high surface-to-volume ratio, ductility, hardness, flexibility, rigidity, high yield strength, and macro-quantum tunneling effect, Cu-based biomaterial nanosystems have been applied as ideal candidates in a diverse array of biomedical application requirements, including catalytic nanotherapeutics, bioimaging, antibacterial, antifungal, accelerated tissue regeneration, molecular doping, photothermal effects, and photodynamic nanomedicines.58 Despite the shortcomings, including environmentally harmful, unstable, and readily oxidizable natures, the unique theranostic effectiveness of Cu-based nanoparticles with selective cytotoxicity against cancer cells has been emphasized in many preclinical treatments and drug deliveries against breast, colorectal, lung, and skin cancers.58 However, few reports on the potential effect of Cu-CDs against breast cancer progression have been found to date.
As a class of emerging carbonaceous nanoscale materials, CDs, also coined as carbon quantum dot or graphene quantum dot, possess numerous advantageous merits like excellent fluorescent properties, extremely small sizes, remarkable ability to penetrate, outstanding ease of synthesis, adjustable surface modification, low cytotoxicity, environmental compatibility, superior aqueous dispersibility, as well as inexpensiveness, large scale-up production, and versatile conjugation with various organic and inorganic molecules.32,59 These CDs have also attracted extensively significant scientific attention in a variety of areas from different perspectives during the past decades. Additionally, the sharp growth of publications on CDs in recent years has made the fabricated Cu-CDs one of the most popular nanomaterials and attractive substitutes in a broad range of prospective applications, including antimicrobial nano-agents, bioimaging, photothermal therapy, photodynamic therapy, and chemodynamic therapy.60–63 In 2019, Wang et al found the photoactive Cu-CDs loaded with nano-graphene oxide sheets presented a significant enhancement of cytotoxic effect against breast cancer cell lines.64 In the present study, a one-step hydrothermal method was applied to synthesize Cu-CDs with urea and ethylene glycol used as organic carbon sources, meanwhile, copper sulfate was used as reactive dopants. Subsequently, the present study questioned, validated, and added to the growing evidence regarding the excellent potency of Cu-CDs treatments against breast cancer progression via inhibiting the viability, proliferation, migration, invasion, adhesion, and clonogenicity potentials of breast cancer cells and promoting cell cycle arrest, DNA damages, and apoptosis levels of breast cancer cells. Beyond these aforementioned mechanistic insights, this study also explored a mechanism-based rationale for the anti-cancer potency of Cu-CDs treatments by tapping into mechanisms that disrupt the oxidative homeostasis of breast cancer cells.
Moreover, the validated results of transcriptomic confirmed that the DEGs induced by the Cu-CDs treatments were significantly enriched in the MAPK signaling pathway. Activated by diverse extracellular and intracellular stimuli, including growth factors, inflammatory cytokines, environmental stresses, genotoxic stresses, and oxidative stress, the MAPK signaling pathway is signaling components that integrate diverse signals to elicit a variety of biological responses to modulate proliferation, differentiation, migration, invasion, survival, transformation, apoptosis, metabolism, and inflammatory responses.65 The abnormal redundancy and crosstalk of the MAPK signaling pathway have been implicated in the pathogenesis of many human diseases, including aging, histiocytoses, ocular diseases, neurodegenerative diseases, cardiovascular disorders, and tumorigenesis.66,67
In 2021, Wang et al reported that mitochondrial dysfunction was an upstream regulator of the MAPK signaling pathway in mammalian cells, and the mitochondrial dysfunction-induced activations of the MAPK signaling pathway were critical cascades to regulate the redox homeostasis of mammalian cells, which was in line with previous in vivo studies based on animal models.67 According to former literature, exogenous or endogenous ROS production plays important roles during the mitochondrial dysfunction-induced activation of the MAPK signaling pathway.68–71 Given the altered ROS production, mitochondrial dysfunction, and altered expression levels of MAPK signaling pathway-related genes in the Cu-CDs-treated MDA-MB-231 cells found in the present study, we speculated that the anti-cancer characteristics of Cu-CDs treatments against breast cancer progression were positively related to the mitochondrial dysfunction, altered ROS production, and subsequent redox imbalances, in turn regulating the MAPK signaling pathway. Although several studies have revealed the positive connections between Cu exposure and altered activation of the MAPK signaling pathway,72–74 additional studies are still needed to confirm the detailed regulation mechanism related to the potential effect of Cu-CDs treatments on the activation of the MAPK signaling pathway.
Although the Cu content in the Cu-CDs prepared in the current study was lower than those Cu-CDs prepared in former publications,75,76 the potential effect of excessive Cu exposure on triggering the Cu intoxication-related pathogenesis, including anovulation, cirrhosis, dyszoospermia, gastropathy, hemolysis, neurodegenerative disease, kidney dysfunctions, and teratogenicity may limit the clinical applications of Cu-CDs with higher Cu content.77,78 Due to the good biosafety and excellent anti-cancer potency of Cu-CDs prepared in the present study, we hope the current research warrants more studies to confirm the regulation mechanism related to the anti-cancer potency of Cu-CDs treatments against breast cancer progression, as well as the differences in the anti-cancer effect of Cu-CDs with different content of Cu on cancer progression.
Conclusion
The above findings confirmed the biosafety and anti-cancer potency of Cu-CDs by tapping into mechanisms that disrupt malignant behaviors and oxidative homeostasis of breast cancer cells. We hope that the anti-cancer potency of Cu-CDs will benefit the target drug investigations and tantalizing researches related to the applications of Cu-CDs treatments from the laboratory to the clinical investigations.
Abbreviations
CDs, carbon quantum dots; mtDNA, mitochondrial DNA; TP53, tumor suppressor p53; HIF-1, hypoxia-inducible factor 1; ROS, reactive oxygen species; OXPHOS, oxidative phosphorylation; TEM, transmission electron microscopy; XPS, X-ray photoelectron spectroscopy; FT-IR, Fourier transforms infrared; PLE, photoluminescence excitation; PL, fluorescence properties; NC, negative control; WBC, white blood cell; RBC, red blood cell; HGB, hemoglobin; PLT, platelet; MCH, mean corpuscular hemoglobin; MCHC, mean corpuscular hemoglobin concentration; BUN, blood urea nitrogen; CRE, creatinine; ALT, alanine aminotransferase; AST, aspartate aminotransferase; ELISA, enzyme-linked immunosorbent assay; H&E, hematoxylin & eosin staining; PAS, periodic acid Schiff; STR, short tandem repeat; MTT, 3-(4,5-dimethylthiazol-2-yl)-2,5-diphenyl tetrazolium bromide; DPBS, Dulbecco’s phosphate-buffered saline; DMSO, dimethyl sulfoxide; IR, inhibiting rate; EdU, 5-ethynyl-2’-deoxyuridine; DAPI, 4’,6-diamidino-2-phenylindole; BSA, bovine albumin; PFA, paraformaldehyde solution; FACS, flow cytometry; ΔΨm, mitochondrial membrane potentials; DCFH-DA, dichlorofluorescein diacetate; IF, immunofluorescence; PI, propidium iodide; ECL, enhanced chemiluminescence solution; DEGs, differentially expressed genes; FDR, false discovery rate; GO, gene ontology; KEGG, Kyoto Genes and Genomes; BP, biological processes; CC, cellular component; MF, molecular function; RFS, relapse-free survival; OS, overall survival; ROI, region of interest; SPSS, Statistical Package for the Social Sciences; SD, standard deviation.
Acknowledgments
We would like to thank Mr. Fangyuan Liu, Miss Jie Chen, and Miss Bichao Wen from the Affiliated Hospital of Inner Mongolia Medical University for their professional help.
Funding
This work was supported by the Natural Science Foundation of Inner Mongolia (2020BS08014 to Gang Liu and 2021MS08093 to Hua Du), National Natural Science Foundation of China (82060567 to Gang Liu and 82360551 to Liya Su), General Program of Science Projects of Inner Mongolia Medical University (YKD2021MS036 to Gang Liu), Guiding Science and Technology Projects of Nantong (JCZ20004 to Qin Jin), and Outstanding Young Talents Cultivation Program of Grassland Elite in Inner Mongolia (Q202286 to Gang Liu).
Disclosure
The authors report no conflicts of interest in this work.
References
1. Miller KD, Fidler-Benaoudia M, Keegan TH, Hipp HS, Jemal A, Siegel RL. Cancer statistics for adolescents and young adults, 2020. CA Cancer J Clin. 2020;70(6):443–459. doi:10.3322/caac.21637
2. Sung H, Ferlay J, Siegel RL, et al. Global cancer statistics 2020: GLOBOCAN estimates of incidence and mortality worldwide for 36 cancers in 185 countries. CA Cancer J Clin. 2021;71(3):209–249. doi:10.3322/caac.21660
3. Harbeck N, Gnant M. Breast cancer. Lancet. 2017;389(10074):1134–1150.
4. Emens LA. Breast cancer immunotherapy: facts and hopes. Clin Cancer Res. 2018;24(3):511–520. doi:10.1158/1078-0432.CCR-16-3001
5. Liang Y, Zhang H, Song X, Yang Q. Metastatic heterogeneity of breast cancer: molecular mechanism and potential therapeutic targets. Semin Cancer Biol. 2020;60:14–27. doi:10.1016/j.semcancer.2019.08.012
6. Kosiol N, Juranek S, Brossart P, Heine A, Paeschke K. G-quadruplexes: a promising target for cancer therapy. Mol Cancer. 2021;20(1):40. doi:10.1186/s12943-021-01328-4
7. Núñez Abad M, Calabuig-Fariñas S, Lobo de Mena M, et al. Update on systemic treatment in early triple negative breast cancer. Therapeut Adv Med Oncol. 2021;13:1758835920986749. doi:10.1177/1758835920986749
8. Kim R, Kin T. Clinical perspectives in addressing unsolved issues in (neo)adjuvant therapy for primary breast cancer. Cancers. 2021;13(4):926. doi:10.3390/cancers13040926
9. Sinha D, Sarkar N, Biswas J, Bishayee A. Resveratrol for breast cancer prevention and therapy: preclinical evidence and molecular mechanisms. Semin Cancer Biol. 2016;40–41:209–232. doi:10.1016/j.semcancer.2015.11.001
10. Jia H, Truica CI, Wang B, et al. Immunotherapy for triple-negative breast cancer: existing challenges and exciting prospects. Drug Resist Updat. 2017;32:1–15. doi:10.1016/j.drup.2017.07.002
11. Verret B, Cortes J, Bachelot T, Andre F, Arnedos M. Efficacy of PI3K inhibitors in advanced breast cancer. Ann Oncol. 2019;30(Suppl 10):x12–x20. doi:10.1093/annonc/mdz381
12. Aggarwal S, Verma SS, Aggarwal S, Gupta SC. Drug repurposing for breast cancer therapy: old weapon for new battle. Semin Cancer Biol. 2021;68:8–20. doi:10.1016/j.semcancer.2019.09.012
13. Zhang J, Yang J, Zuo T, et al. Heparanase-driven sequential released nanoparticles for ferroptosis and tumor microenvironment modulations synergism in breast cancer therapy. Biomaterials. 2021;266:120429. doi:10.1016/j.biomaterials.2020.120429
14. Samadder NJ, Riegert-Johnson D, Boardman L, et al. Comparison of universal genetic testing vs guideline-directed targeted testing for patients with hereditary cancer syndrome. JAMA Oncol. 2021;7(2):230–237. doi:10.1001/jamaoncol.2020.6252
15. McDonnell DP, Wardell SE, Chang C-Y, Norris JD. Next-generation endocrine therapies for breast cancer. J Clin Oncol. 2021;39(12):1383–1388. doi:10.1200/JCO.20.03565
16. Hsu -C-C, Tseng L-M, Lee H-C. Role of mitochondrial dysfunction in cancer progression. Exp Biol Med. 2016;241(12):1281–1295. doi:10.1177/1535370216641787
17. Chen K, Lu P, Beeraka NM, et al. Mitochondrial mutations and mitoepigenetics: focus on regulation of oxidative stress-induced responses in breast cancers. Semi Cancer Biol. 2022;83:556–569. doi:10.1016/j.semcancer.2020.09.012
18. Gilkes DM, Semenza GL, Wirtz D. Hypoxia and the extracellular matrix: drivers of tumour metastasis. Nat Rev Cancer. 2014;14(6):430–439. doi:10.1038/nrc3726
19. Pickup MW, Mouw JK, Weaver VM. The extracellular matrix modulates the hallmarks of cancer. EMBO Rep. 2014;15(12):1243–1253. doi:10.15252/embr.201439246
20. He X, Zhou A, Lu H, et al. Suppression of mitochondrial complex I influences cell metastatic properties. PLoS One. 2013;8(4):e61677. doi:10.1371/journal.pone.0061677
21. Cichon MA, Radisky DC. Extracellular matrix as a contextual determinant of transforming growth factor-β signaling in epithelial-mesenchymal transition and in cancer. Cell Adh Migr. 2014;8(6):588–594. doi:10.4161/19336918.2014.972788
22. C-j K, Huang -C-C, Lin H-Y, et al. Androgen-induced TMPRSS2 activates matriptase and promotes extracellular matrix degradation, prostate cancer cell invasion, tumor growth, and metastasis. Cancer Res. 2015;75(14):2949–2960. doi:10.1158/0008-5472.CAN-14-3297
23. Matilainen O, Quirós PM, Auwerx J. Mitochondria and epigenetics - crosstalk in homeostasis and stress. Trends Cell Biol. 2017;27(6):453–463. doi:10.1016/j.tcb.2017.02.004
24. Pidugu VR, Yarla NS, Bishayee A, Kalle AM, Satya AK. Novel histone deacetylase 8-selective inhibitor 1,3,4-oxadiazole-alanine hybrid induces apoptosis in breast cancer cells. Apoptosis. 2017;22(11):1394–1403. doi:10.1007/s10495-017-1410-2
25. Shukla S, Penta D, Mondal P, Meeran SM. Epigenetics of breast cancer: clinical status of epi-drugs and phytochemicals. Adv Exp Med Biol. 2019;1152:293–310.
26. Feeley KP, Bray AW, Westbrook DG, et al. Mitochondrial genetics regulate breast cancer tumorigenicity and metastatic potential. Cancer Res. 2015;75(20):4429–4436. doi:10.1158/0008-5472.CAN-15-0074
27. Kannan A, Wells RB, Sivakumar S, et al. Mitochondrial reprogramming regulates breast cancer progression. Clin Cancer Res. 2016;22(13):3348–3360. doi:10.1158/1078-0432.CCR-15-2456
28. Kim MW, Jeong HY, Kang SJ, et al. Anti-EGF receptor aptamer-guided co-delivery of anti-cancer siRNAs and quantum dots for theranostics of triple-negative breast cancer. Theranostics. 2019;9(3):837–852. doi:10.7150/thno.30228
29. Tade RS, Patil PO. Theranostic prospects of graphene quantum dots in breast cancer. ACS Biomater Sci Eng. 2020;6(11):5987–6008. doi:10.1021/acsbiomaterials.0c01045
30. Lee JJ, Saiful Yazan L, Che Abdullah CA. A review on current nanomaterials and their drug conjugate for targeted breast cancer treatment. Int J Nanomed. 2017;12:2373–2384. doi:10.2147/IJN.S127329
31. Wang C, Wu C, Zhou X, et al. Enhancing cell nucleus accumulation and DNA cleavage activity of anti-cancer drug via graphene quantum dots. Sci Rep. 2013;3:2852. doi:10.1038/srep02852
32. Devi P, Saini S, Kim KH. The advanced role of carbon quantum dots in nanomedical applications. Biosens Bioelectron. 2019;141:111158. doi:10.1016/j.bios.2019.02.059
33. Elugoke SE, Adekunle AS, Fayemi OE, Mamba BB, Sherif EM, Ebenso EE. Carbon-based quantum dots for electrochemical detection of monoamine neurotransmitters-review. Biosensors. 2020;10(11):162. doi:10.3390/bios10110162
34. Zheng XT, Ananthanarayanan A, Luo KQ, Chen P. Glowing graphene quantum dots and carbon dots: properties, syntheses, and biological applications. Small. 2015;11(14):1620–1636. doi:10.1002/smll.201402648
35. Yuan X, Liu Z, Guo Z, Ji Y, Jin M, Wang X. Cellular distribution and cytotoxicity of graphene quantum dots with different functional groups. Nanoscale Res Lett. 2014;9(1):108. doi:10.1186/1556-276X-9-108
36. Su W, Guo R, Yuan F, et al. Red-emissive carbon quantum dots for nuclear drug delivery in cancer stem cells. J Phys Chem Lett. 2020;11(4):1357–1363. doi:10.1021/acs.jpclett.9b03891
37. Bamrungsap S, Zhao Z, Chen T, et al. Nanotechnology in therapeutics: a focus on nanoparticles as a drug delivery system. Nanomedicine. 2012;7(8):1253–1271. doi:10.2217/nnm.12.87
38. Zhang D, Wen L, Huang R, Wang H, Hu X, Xing D. Mitochondrial specific photodynamic therapy by rare-earth nanoparticles mediated near-infrared graphene quantum dots. Biomaterials. 2018;153:14–26. doi:10.1016/j.biomaterials.2017.10.034
39. Hua XW, Bao YW, Chen Z, Wu FG. Carbon quantum dots with intrinsic mitochondrial targeting ability for mitochondria-based theranostics. Nanoscale. 2017;9(30):10948–10960. doi:10.1039/C7NR03658B
40. Battogtokh G, Choi YS, Kang DS, et al. Mitochondria-targeting drug conjugates for cytotoxic, anti-oxidizing and sensing purposes: current strategies and future perspectives. Acta Pharm Sin B. 2018;8(6):862–880. doi:10.1016/j.apsb.2018.05.006
41. Tao W, Ji X, Xu X, et al. Antimonene quantum dots: synthesis and application as near-infrared photothermal agents for effective cancer therapy. Angew Chem Int Ed Engl. 2017;56(39):11896–11900. doi:10.1002/anie.201703657
42. Zhang Y, Shen Y, Teng X, Yan M, Bi H, Morais PC. Mitochondria-targeting nanoplatform with fluorescent carbon dots for long time imaging and magnetic field-enhanced cellular uptake. ACS Appl Mater Interfaces. 2015;7(19):10201–10212. doi:10.1021/acsami.5b00405
43. Liu M, Huang L, Xu X, et al. Copper doped carbon dots for addressing bacterial biofilm formation, wound infection, and tooth staining. ACS Nano. 2022;16(6):9479–9497. doi:10.1021/acsnano.2c02518
44. Zhang W, Sun J, Liu F, et al. Alleviative effect of lactoferrin interventions against the hepatotoxicity induced by titanium dioxide nanoparticles. Biol Trace Elem Res. 2023;2023:1–19.
45. Liu G, Li S, Yuan H, et al. Effect of sodium alginate on mouse ovary vitrification. Theriogenology. 2018;113:78–84. doi:10.1016/j.theriogenology.2018.02.006
46. Zhu P, Zhang T, Li J, et al. Near-infrared emission Cu, N-doped carbon dots for human umbilical vein endothelial cell labeling and their biocompatibility in vitro. J Appl Toxicol. 2021;41(5):789–798. doi:10.1002/jat.4119
47. Ku T, Hao F, Yang X, et al. Graphene quantum dots disrupt embryonic stem cell differentiation by interfering with the methylation level of Sox2. Environ Sci Technol. 2021;55(5):3144–3155. doi:10.1021/acs.est.0c07359
48. Li S, Liu M, Ma H, et al. Ameliorative effect of recombinant human lactoferrin on the premature ovarian failure in rats after cyclophosphamide treatments. J Ovarian Res. 2021;14(1):17. doi:10.1186/s13048-020-00763-z
49. Jin Q, Dai Y, Wang Y, Zhang S, Liu G. High kinesin family member 11 expression predicts poor prognosis in patients with clear cell renal cell carcinoma. J Clin Pathol. 2019;72(5):354–362. doi:10.1136/jclinpath-2018-205390
50. Shen J, Cao B, Wang Y, et al. Hippo component YAP promotes focal adhesion and tumour aggressiveness via transcriptionally activating THBS1/FAK signalling in breast cancer. J Exp Clin Cancer Res. 2018;37(1):175. doi:10.1186/s13046-018-0850-z
51. Tong X, Zhuang Z, Wang X, et al. ACBP suppresses the proliferation, migration, and invasion of colorectal cancer via targeting Wnt/beta-catenin signaling pathway. Biomed Pharmacother. 2021;137:111209. doi:10.1016/j.biopha.2020.111209
52. Ren J, Li S, Wang C, et al. Glutathione protects against the meiotic defects of ovine oocytes induced by arsenic exposure via the inhibition of mitochondrial dysfunctions. Ecotoxicol Environ Saf. 2021;230:113135. doi:10.1016/j.ecoenv.2021.113135
53. Liu Y, Guan X, Wang M, et al. Disulfiram/Copper induces antitumor activity against gastric cancer via the ROS/MAPK and NPL4 pathways. Bioengineered. 2022;13(3):6579–6589. doi:10.1080/21655979.2022.2038434
54. Liu CG, Han YH, Kankala RK, Wang SB, Chen AZ. Subcellular performance of nanoparticles in cancer therapy. Int J Nanomed. 2020;15:675–704. doi:10.2147/IJN.S226186
55. Ma Y, Huang J, Song S, Chen H, Zhang Z. Cancer-targeted nanotheranostics: recent advances and perspectives. Small. 2016;12(36):4936–4954. doi:10.1002/smll.201600635
56. Dong C, Feng W, Xu W, et al. The coppery age: copper (Cu)‐involved nanotheranostics. Adv Sci. 2020;7(21):2001549. doi:10.1002/advs.202001549
57. Chehelgerdi M, Chehelgerdi M, Allela OQB, et al. Progressing nanotechnology to improve targeted cancer treatment: overcoming hurdles in its clinical implementation. Mol Cancer. 2023;22(1):169. doi:10.1186/s12943-023-01865-0
58. Naikoo G, Al-Mashali F, Arshad F, et al. An overview of copper nanoparticles: synthesis, characterisation and anticancer activity. Curr. Pharm. Des. 2021;27(43):4416–4432. doi:10.2174/1381612827666210804100303
59. Kumar VB, Sher I, Rencus‐Lazar S, Rotenstreich Y, Gazit E. Functional carbon quantum dots for ocular imaging and therapeutic applications. Small. 2022;19(7):e2205754. doi:10.1002/smll.202205754
60. Wang J, Xu M, Wang D, et al. Copper-doped carbon dots for optical bioimaging and photodynamic therapy. Inorg Chem. 2019;58(19):13394–13402. doi:10.1021/acs.inorgchem.9b02283
61. Wang Y, Yao J, Cao Z, et al. Peroxidase‐mimetic copper‐doped carbon‐dots for oxidative stress‐mediated broad‐spectrum and efficient antibacterial activity. Chem Eur J. 2022;28(14):e202104174. doi:10.1002/chem.202104174
62. Najaflu M, Shahgolzari M, Bani F, Khosroushahi AY. Green synthesis of near-infrared copper-doped carbon dots from alcea for cancer photothermal therapy. ACS Omega. 2022;7(38):34573–34582. doi:10.1021/acsomega.2c04484
63. Xia Q, Zhang Y, Zhang H, et al. Copper nanocrystalline-doped folic acid-based super carbon dots for an enhanced antitumor effect in response to tumor microenvironment stimuli. J Mat Chem B. 2022;10(39):8046–8057. doi:10.1039/D2TB01363K
64. Wang L, Yan J. Superficial synthesis of photoactive copper sulfide quantum dots loaded nano-graphene oxide sheets combined with near infrared (NIR) laser for enhanced photothermal therapy on breast cancer in nursing care management. J Photochem Photobiol B Biol. 2019;192:68–73. doi:10.1016/j.jphotobiol.2018.12.024
65. Kim EK, Choi E-J. Pathological roles of MAPK signaling pathways in human diseases. Biochim Biophys Acta. 2010;1802(4):396–405. doi:10.1016/j.bbadis.2009.12.009
66. Papaconstantinou J. The role of signaling pathways of inflammation and oxidative stress in development of senescence and aging phenotypes in cardiovascular disease. Cells. 2019;8(11):1383. doi:10.3390/cells8111383
67. Cohen Aubart F, Idbaih A, Emile J-F, et al. Histiocytosis and the nervous system: from diagnosis to targeted therapies. Neuro Oncol. 2021;23(9):1433–1446. doi:10.1093/neuonc/noab107
68. Cui L, Bu W, Song J, et al. Apoptosis induction by alantolactone in breast cancer MDA-MB-231 cells through reactive oxygen species-mediated mitochondrion-dependent pathway. Arch Pharm Res. 2018;41(3):299–313. doi:10.1007/s12272-017-0990-2
69. Lin S, Qin HZ, Li ZY, Zhu H, Long L, Xu LB. Gallic acid suppresses the progression of triple-negative breast cancer HCC1806 cells via modulating PI3K/AKT/EGFR and MAPK signaling pathways. Front Pharmacol. 2022;13:1049117. doi:10.3389/fphar.2022.1049117
70. Park HS, Han JH, Park JW, et al. Sodium propionate exerts anticancer effect in mice bearing breast cancer cell xenograft by regulating JAK2/STAT3/ROS/p38 MAPK signaling. Acta Pharmacol Sin. 2021;42(8):1311–1323. doi:10.1038/s41401-020-00522-2
71. Zhao Y, Fu L, Chen J, et al. Eupalinolide O induces apoptosis in human triple-negative breast cancer cells via modulating ROS generation and Akt/p38 MAPK signaling pathway. J Oncol. 2022;2022:8802453. doi:10.1155/2022/8802453
72. Kim YJ, Bond GJ, Tsang T, Posimo JM, Busino L, Brady DC. Copper chaperone ATOX1 is required for MAPK signaling and growth in BRAF mutation-positive melanoma. Metallomics. 2019;11(8):1430–1440. doi:10.1039/c9mt00042a
73. Li Y, Liang R, Zhang X, et al. Copper chaperone for superoxide dismutase promotes breast cancer cell proliferation and migration via ROS-mediated MAPK/ERK signaling. Front Pharmacol. 2019;10:356. doi:10.3389/fphar.2019.00356
74. Yip NC, Fombon IS, Liu P, et al. Disulfiram modulated ROS-MAPK and NFκB pathways and targeted breast cancer cells with cancer stem cell-like properties. Br J Cancer. 2011;104(10):1564–1574. doi:10.1038/bjc.2011.126
75. Du J, Zhao Y, Chen J, et al. Difunctional Cu-doped carbon dots: catalytic activity and fluorescence indication for the reduction reaction of: p -nitrophenol. RSC Adv. 2017;7:33929–33936. doi:10.1039/C7RA05383E
76. Ullah I, Suliman H, Alamzeb M, et al. An insight into recent developments of copper, silver and gold carbon dots: cancer diagnostics and treatment. Front Bioeng Biotechnol. 2023;11:1292641.
77. Vahab L, Keshipour S. Novel nanosensor of cobalt(II) and copper(II) constructed from graphene quantum dots modified with Eriochrome Black T. Sci Rep. 2022;12(1). doi:10.1038/s41598-022-17616-y
78. Ren J, Wang B, Li L, et al. Glutathione ameliorates the meiotic defects of copper exposed ovine oocytes via inhibiting the mitochondrial dysfunctions. Ecotoxicol Environ Saf. 2023;251:114530. doi:10.1016/j.ecoenv.2023.114530
 © 2024 The Author(s). This work is published and licensed by Dove Medical Press Limited. The full terms of this license are available at https://www.dovepress.com/terms.php and incorporate the Creative Commons Attribution - Non Commercial (unported, v3.0) License.
By accessing the work you hereby accept the Terms. Non-commercial uses of the work are permitted without any further permission from Dove Medical Press Limited, provided the work is properly attributed. For permission for commercial use of this work, please see paragraphs 4.2 and 5 of our Terms.
© 2024 The Author(s). This work is published and licensed by Dove Medical Press Limited. The full terms of this license are available at https://www.dovepress.com/terms.php and incorporate the Creative Commons Attribution - Non Commercial (unported, v3.0) License.
By accessing the work you hereby accept the Terms. Non-commercial uses of the work are permitted without any further permission from Dove Medical Press Limited, provided the work is properly attributed. For permission for commercial use of this work, please see paragraphs 4.2 and 5 of our Terms.