
Back to Journals » Nature and Science of Sleep » Volume 18

Analysis of the Correlation Between Tongue Fat and Retroglossal Obstruction in Patients with Obstructive Sleep Apnea
Authors Hao Y, Qin J, Wang Z, Duan Y, Cao X, Zhang Z, Wu D 
Received 2 February 2026
Accepted for publication 22 June 2026
Published 10 July 2026 Volume 2026:18 596746
DOI https://doi.org/10.2147/NSS.S596746
Checked for plagiarism Yes
Review by Single anonymous peer review
Peer reviewer comments 2
Editor who approved publication: Dr Sarah L Appleton
Yibo Hao,1,2,* Jie Qin,1,* Zhe Wang,1 Yanru Duan,1,3 Xiangrong Cao,1,3 Zhiming Zhang,1 Dahai Wu1
1Department of Otolaryngology, General Hospital of Northern Theater Command, Shenyang, Liaoning, 110016, People’s Republic of China; 2Postgraduate Training Base of China Medical University in the General Hospital of Northern Theater Command, Shenyang, 110001, People’s Republic of China; 3Postgraduate Training Base of Dalian Medical University in the General Hospital of Northern Theater Command, Dalian, Liaoning, 116044, People’s Republic of China
*These authors contributed equally to this work
Correspondence: Dahai Wu, Department of Otolaryngology, General Hospital of Northern Theater Command, No. 83, Wenhua Road, Shenhe District, Shenyang, 110016, People’s Republic of China, Tel +86-24-28851341, Email [email protected]
Purpose: To investigate the impact of tongue fat on glossoptosis and lingual hypertrophy and the relationship between tongue fat and retroglossal obstruction in patients with obstructive sleep apnea (OSA).
Methods: This study enrolled 97 patients with moderate-to-severe OSA. All patients underwent standard diagnostic polysomnography (PSG) and a second PSG with a nasopharyngeal tube inserted (NPT-PSG). The NPT stents open the nasal, nasopharyngeal, and retropalatal airways, so the residual apnea-hypopnea index (NPT-AHI) specifically quantifies retroglossal obstruction. Patients were classified based on NPT-PSG and upper airway CT into three groups: non-retroglossal obstruction (non-RGO), glossoptosis (GLO), and lingual hypertrophy (LH). Three-dimensional CT reconstructions were used to assess tongue anatomy, including volume, fat volume, and fat percentage. Group differences in baseline traits and tongue measurements were analyzed. We further examined the relationship between tongue fat and RGO, and identified factors influencing RGO in OSA.
Results: After adjusting for gender, age, and BMI, the LH group had larger tongue volume compared to the other two groups, whereas the GLO group had more tongue fat and a higher tongue fat percentage compared to the non-RGO group. Apnea-hypopnea index (AHI) for NPT-PSG (NPT-AHI) was positively correlated with tongue volume (r=0.349, P< 0.001), tongue fat volume (r=0.368, P< 0.001), and tongue fat percentage (r=0.281, P=0.006), and negatively correlated with LSaO2 (r=− 0.312, P< 0.001). Multiple regression indicated tongue volume (β=0.264, P=0.005), tongue fat volume (β=0.271, P=0.002), and LSaO2 (β=− 0.285, P=0.006) were independent influencing factors of NPT-AHI.
Conclusion: Tongue fat volume is more strongly associated with glossoptosis, whereas overall tongue volume is more closely associated with lingual hypertrophy. Increased tongue volume, higher tongue fat content, and decreased LSaO2 are associated with more severe retroglossal obstruction. Precise therapies targeting tongue fat may benefit OSA patients with RGO.
Keywords: obstructive sleep apnea, tongue fat, retroglossal obstruction, nasopharyngeal tube, computed tomography
Introduction
Obstructive sleep apnea (OSA) is a common sleep-related breathing disorder characterized by recurrent partial or complete upper airway obstruction during sleep, leading to pauses in breathing and inadequate ventilation.1 The clinical manifestations of OSA typically encompass symptoms such as excessive daytime sleepiness, fatigue, nocturia, and morning headaches.2 Untreated OSA is closely associated with various cardiovascular and cerebrovascular diseases, significantly impacting patients’ quality of life and long-term health. Therefore, gaining a comprehensive understanding of its pathogenesis is crucial for the effective treatment of OSA. Obstruction in the retroglossal regions is one of the primary causes of upper airway collapse in patients with OSA.3 However, it is important to note that the collapse of the lateral pharyngeal wall also plays a significant role.4,5 The etiology of the retroglossal obstruction is complex, among which glossoptosis and lingual hypertrophy are important etiologies.6 Clinically, it is crucial to distinguish between glossoptosis and lingual hypertrophy, as they represent different pathophysiological mechanisms underlying retroglossal obstruction. Glossoptosis refers to functional backward collapse of the tongue base/body during sleep without anatomical narrowing during wakefulness, whereas lingual hypertrophy denotes anatomical enlargement of the tongue that structurally reduces the retroglossal airway space. Thus, the tongue plays a vital role in retroglossal obstruction in patients with OSA.
The tongue is an essential organ in maintaining airway patency,7 with its internal fat distribution primarily affecting its structure and function,8 consequently influencing airway patency. Recent studies have shown a close relationship between tongue fat content and OSA.9 One research indicates that OSA patients have significantly increased tongue volume and tongue fat content, with fat accumulation primarily concentrated at the base of the tongue.10 In another study, reduction in tongue fat has been linked to improvements in the apnea-hypopnea index (AHI) in OSA patients following weight loss.11
These studies underscore the significance of tongue fat in the occurrence and progression of OSA, yet further investigation is warranted on the relationship between tongue fat and retroglossal obstruction. Infiltration of tongue fat may not only weaken tongue muscle tension, leading to glossoptosis,12 but may also contribute to lingual hypertrophy through accumulation at the base of the tongue. While our prior work showed that a more posteriorly positioned tongue relative to the occlusal surface was associated with retroglossal obstruction,13 it remained unclear whether this posterior positioning reflected functional collapse during sleep (glossoptosis), anatomical tongue enlargement (lingual hypertrophy), or other intrinsic tissue alterations such as fat infiltration. This study shifts the focus to internal tongue fat deposition, hypothesizing that it is a key mechanism mediating glossoptosis and lingual hypertrophy. Therefore, this study aims to investigate the impact of tongue fat on glossoptosis and lingual hypertrophy, as well as the relationship between tongue fat and retroglossal obstruction in patients with OSA.
Materials and Methods
Subjects
This was a retrospective study. Patients presenting with sleep-related snoring at the Department of Otolaryngology-Head and Neck Surgery were consecutively enrolled from March 2019 to October 2024. Following polysomnography (PSG) evaluation, 97 patients with moderate-severe OSA were ultimately included in this study. All upper airway CT scans were obtained as part of routine preoperative evaluation for patients being considered for upper airway surgery. Therefore, CT was clinically indicated, not performed solely for research purposes, consistent with the ALARA principle. The patient’s selection criteria were as follows: (1) meeting the OSA diagnostic criteria published by the American Academy of Sleep Medicine (AASM);14 (2) no previous surgical intervention for OSA; (3) experiencing PSG after nasopharyngeal tube (NPT) insertion (NPT-PSG) examination successfully; (4) experiencing upper airway CT examination successfully; (5) no noticeable artifacts on CT examination; (6) no history of major oropharyngeal trauma or surgery; (7) diagnosed as lateral pharyngeal wall collapse by Muller’s maneuver; (8) no apparent malformations such as micrognathia; (9) no over-hypertrophy of the palatine tonsils or lingual tonsils; (10) no severe impairment of cardiorespiratory function, psychiatric/emotional disorder, or hypothyroidism. The study protocol was approved by the Medical Ethics Committee of our hospital with the number Y (2024) 346.
Study Design Overview
This study was designed to investigate the relationship between tongue fat and retroglossal obstruction in patients with moderate-to-severe OSA. All enrolled patients underwent two overnight PSG studies: one standard diagnostic PSG (without NPT) to establish baseline OSA severity, and a second PSG with a nasopharyngeal tube in place (NPT-PSG) to isolate retroglossal obstruction. All patients also underwent upper airway computed tomography (CT) during calm breathing in the supine position. Based on NPT-AHI and the retroglossal cross-sectional area (RCSA) measured from CT, patients were classified into three groups: non-retroglossal obstruction (non-RGO), glossoptosis (GLO), and lingual hypertrophy (LH). Tongue volume, tongue fat volume, and tongue fat percentage were quantified from three-dimensional CT reconstructions for each patient.
Polysomnography (PSG)
Alice 5 PSG system (Phillips Respironics, USA) was used for monitoring sleep in all patients. And all PSG data were scored according to the AASM recommended criteria (Level 1A), refining the definition of hypopnea to a 30% decrease in airflow lasting at least 10s and associated with a ≥3% SpO2 desaturation or an arousal.14
Characterizing Retroglossal Collapse Using Polysomnography After Nasopharyngeal Tube Insertion (NPT-PSG)
To isolate retroglossal obstruction from other upper airway sites, we performed PSG after NPT insertion. The NPT bypasses the nasal cavity, nasopharynx, and retropalatal region, allowing the residual apnea-hypopnea index (NPT-AHI) to specifically reflect collapse at the retroglossal level. This technique thus enables characterization of tongue-related obstruction. NPT-PSG was performed as previously reported.13,15 The standardized procedure consisted of the following steps: an appropriately sized NPT (internal diameter 6.0–8.0 mm, selected based on the patient’s nasal cavity diameter) was used. No sedation was administered; all patients underwent natural sleep during PSG. Prior to insertion, 1% ephedrine solution and 1% lidocaine gel were applied to shrink and anesthetize the nasal mucosa, the surface of the NPT was lubricated with liquid paraffin. To avoid entering the retroglossal region and to ensure the tube solely stented the retropalatal airway, the NPT was advanced only until its distal end reached the plane of the uvula tip. The proximal end was securely fixed at the anterior nostril with a drawstring to prevent migration or dislodgement during sleep. After successful NPT insertion, a second overnight PSG study was performed with the NPT kept in place throughout the recording. The examination procedures and diagnostic parameters remained identical to those of the first PSG without NPT. All patients tolerated the NPT well without significant discomfort or arousals that visibly altered sleep architecture; the tube position was verified periodically during sleep to confirm it remained at the uvula tip plane. As the NPT insertion could alleviate obstructions in the nasal cavity, nasopharynx, and retropalatal regions during sleep, AHI determined by NPT-PSG (NPT-AHI) served as a diagnostic criterion for retroglossal obstruction. Retroglossal obstruction was diagnosed when NPT-AHI was ≥ 15 events/hour by NPT-PSG because retroglossal surgery was considered unnecessary for patients with NPT-AHI < 15 events/hour.15–17 To minimize nocturnal variability, each patient’s PSG and NPT-PSG were conducted on consecutive days under identical environmental conditions and using the same scoring protocol.
Upper Airway CT
All subjects underwent a CT scan of the upper airway (General Electrical Medical Systems, Milwaukee, WI) with a scan thickness of 0.625 mm. Image acquisition was performed during calm breathing with the subjects in the supine position and with the head in a neutral position, during which the subjects were instructed to breathe with their mouths closed to avoid the effect of changes in head and jaw position on the tongue.18
This study utilized the Lightspeed 16-slice spiral CT scanner (General Electric Medical Systems, Milwaukee, WI) for upper airway CT scans. Participants were positioned in a supine position with their head and neck adjusted to be in a neutral position and the upper airway aligned in a straight line. During scanning, each participant was instructed to breathe steadily through the nose, keep the mouth closed, maintain the tongue in a static position, and refrain from swallowing to prevent changes in head and jaw position from affecting the tongue.18 Continuous scans were taken from the skull base to the thoracic inlet, with a scan thickness of 0.625mm. All original image data were transferred to the 3D Slicer 5.6.0 software for 3D reconstruction and data extraction.
Image Reconstruction and Measurement of Morphological Parameters
The three-dimensional reconstruction of upper airway CT images was created by the investigators using specialized 3D visualization and analysis software (3D slicer 5.6.0),19 which allowed for manual segmentation slice by slice. The image segmentation technique allowed the region of interest (ROI) to be tracked and segmented in various CT planes along the edges of anatomical structures. The tongue (defined as the intrinsic tongue and genioglossus muscle) was obtained by manual segmentation and layer filling using 3D Slice software, and tongue fat was obtained by threshold segmentation using a grayscale threshold of −200 to −20 Hounsfield units (HU). The range of HU values used to differentiate and quantify fat in the tongue was based on established ranges from studies on humans, lambs, and dogs,20–22 with adjustments made accordingly. Tongue volume and tongue fat volume were obtained based on segmentation statistics in the quantitative tool. Tongue fat percentage was calculated as tongue fat volume/tongue volume.
The tongue was divided into the retropalatal region (RP region) and retroglossal region (RG region) on the mid-sagittal 3D images to further clarify the distribution of tongue fat. The RP region was defined as the level of the hard palate to the tip of the uvula, and the RG region was defined as the tip of the uvula to the base of the epiglottis23 (Figure 1). Subsequently, tongue volume, tongue fat volume, and tongue fat percentage for the RP and RG regions were determined using the same methods as described earlier. Additionally, the RCSA was defined as the airway cross-sectional area at the level of the tip of the epiglottis.24 A cutoff of 180 mm2 for this measurement, derived from a previous CT-based study by Li et al,25 was used to distinguish glossoptosis (RCSA > 180 mm2) from lingual hypertrophy (RCSA ≤ 180 mm2). All image analyses were performed by one trained technologist blinded to the subject’s status and supervised by one investigator. The imaging data collected included tongue volume (total, RP, RG), tongue fat volume (total, RP, RG), tongue fat percentage (total, RP, RG), and RCSA.
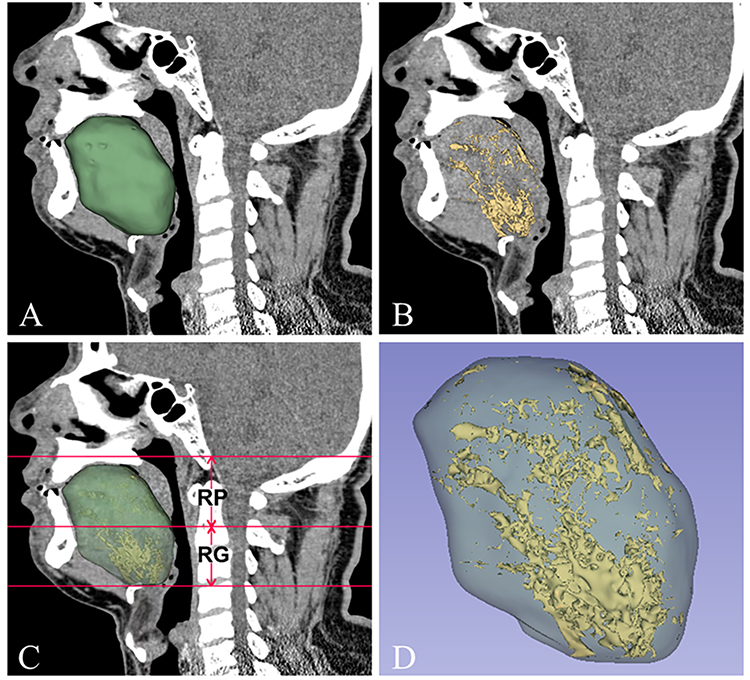 |
Figure 1 Three-dimensional reconstructed CT images. (A) Mid-Sagittal image of tongue segmentation (green area). (B) Mid-Sagittal of tongue fat segmentation (yellow area). (C) Anatomical definition of the upper airway regions: the retropalatal region (RP region) extends from the level of the hard palate to the tip of the uvula, and the retroglossal region (RG region) extends from the tip of the uvula to the root of the epiglottis. (D) Three-dimensional reconstruction image of the tongue and tongue fat. |
Diagnostic Criteria of Glossoptosis and Lingual Hypertrophy
The causes of retroglossal obstruction mainly include glossoptosis, lingual hypertrophy, palatine tonsillar hypertrophy, lingual tonsillar hypertrophy, and micrognathia. This study focuses on patients with glossoptosis and lingual hypertrophy with the following definitions and diagnostic criteria:6 (1) Glossoptosis: Glossoptosis is defined as a functional upper airway obstruction caused by the tongue base and/or body collapsing backward during sleep, despite the absence of anatomical narrowing in the retroglossal airway during wakefulness. This condition may represent a primarily non-anatomical contributor, likely driven by neuromuscular dysfunction, although a combination of anatomical and non-anatomical factors cannot be excluded. The diagnostic criteria were as follows: after excluding palatine tonsillar hypertrophy, lingual tonsillar hypertrophy, and micrognathia through routine physical examination and CT scans, patients with NPT-AHI ≥ 15 events/hour and RCSA > 180 mm2 were considered for glossoptosis. (2) Lingual hypertrophy: It refers to an anatomical enlargement of the tongue (localized or generalized), resulting in structural narrowing of the upper airway and elevated collapsibility during sleep. This anatomical compromise directly reduces the retroglossal airway space, predisposing it to obstructive events. The diagnostic criteria were as follows: after excluding hypertrophy of the palatine tonsils, lingual tonsils, and micrognathia through routine physical examination and CT scans, patients with NPT-AHI ≥ 15 events/hour and RCSA ≤ 180 mm2 were considered for lingual hypertrophy.
Statistical Analysis
Statistical data analysis was conducted using SPSS version 29.0 (IBM, Chicago, Illinois, USA). Normality was assessed using the Shapiro–Wilk test (for n ≤ 50) or the Kolmogorov–Smirnov test (for n > 50). Normally distributed data were expressed as mean ± standard deviation (SD), and non-normally distributed data as median (interquartile range, IQR). Categorical variables were compared between groups using the chi‑square test, or Fisher’s exact test when expected cell frequencies were less than 5. Intergroup comparisons were performed using one-way ANOVA (for normally distributed data with homogeneity of variance, confirmed by Levene’s test) or the Kruskal–Wallis test (for non-normally distributed data). The outcome variables evaluated included tongue volume (total, RP, RG), tongue fat volume (total, RP, RG), and tongue fat percentage (total, RP, RG). Groups included: non-RGO group, GLO group, and LH group. Analysis of covariance (ANCOVA) was used to compare the differences between the three groups after adjusting for gender, age, and body mass index (BMI). Pearson or Spearman correlation analyses were used to clarify the correlation between tongue volume, tongue fat, tongue fat percentage, and AHI, NPT-AHI. Partial correlation analysis was used to analyze the correlation between tongue volume, tongue fat, tongue fat percentage, and AHI, NPT-AHI while controlling for gender, age, and BMI. Variables with non-normal distribution were transformed by logarithmic or square root for partial correlation analysis. Finally, multiple linear regression analysis was used to determine the independent influencing factors of NPT-AHI. All reported P values are two‑tailed, and no adjustment for multiple comparisons was applied. Therefore, the results should be interpreted with caution as the nominal significance level may be inflated due to multiple testing.
Results
Basic Characteristics of Participants
The basic characteristics of participants overall and in subgroups are shown in Table 1. Among 97 participants (90 males, 7 females), the median age was 36 (30, 44.75) years, with a mean BMI of 29.57±3.39 kg/m2. The mean AHI was 62.87±22.06 events/hour, the median lowest oxygen saturation (LSaO2) was 68.5 (57, 77) %, and the median NPT-AHI was 16.25 (7.03, 37.13) events/hour. Patients were stratified into three groups: non-retroglossal obstruction (non-RGO, n=41), glossoptosis (GLO, n=35), and lingual hypertrophy (LH, n=21). There was no statistically significant gender difference among the groups (all P>0.05). The LH group was significantly older than the other two groups (P②=0.022, P③=0.008). The GLO group had a significantly higher BMI than the non-RGO group (P①=0.007). Additionally, both GLO and LH groups had higher AHI (P①<0.001, P②=0.028) and NPT-AHI (P①<0.001, P②<0.001) and lower LSaO2 (P①<0.001, P②=0.008) than the non-RGO group.
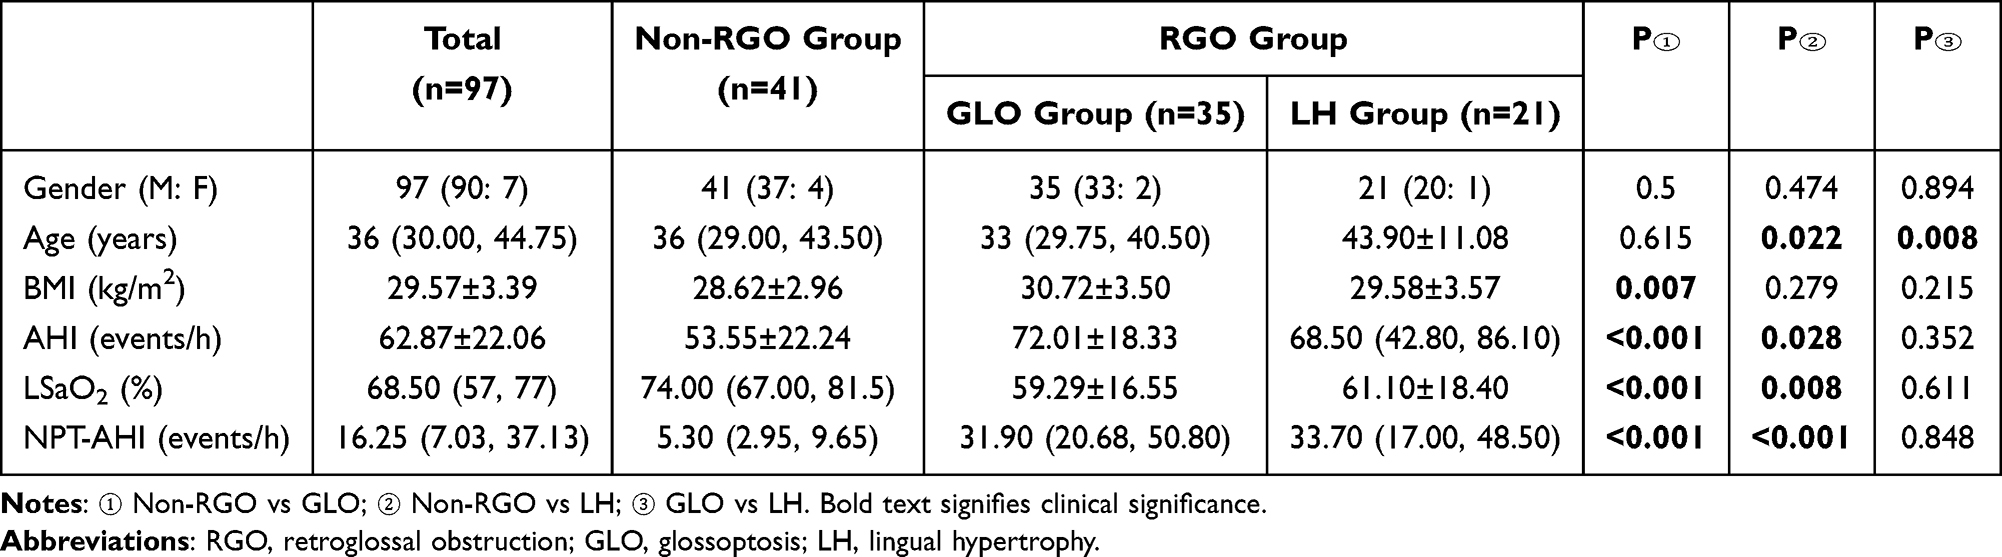 |
Table 1 Basic Characteristics of Participants Overall and in Subgroups |
Participants’ Tongue Anatomy Measurements
Tongue anatomy measurements of participants overall and in subgroups are shown in Table 2. Among all participants, a median tongue volume was 79.32 (73.27, 90.05) cm3, with a median tongue fat volume of 3.26 (2.24, 5.34) cm3 and tongue fat percentage of 4.18 (2.72, 6.14) %. Fat deposition predominated in the RG region (Figure 1). After adjusting for gender, age, and BMI, significant variations in tongue anatomy were observed across subgroups: (1) Regarding the tongue volume, there was a significant difference in total tongue volume between the three groups (P①#=0.009, P②#<0.001, P③#<0.001), with the LH group showing the largest tongue volume and the non-RGO group the smallest. The RG tongue volume was significantly larger in the LH compared to the non-RGO (P②#<0.001) and GLO (P③#<0.001) groups. The RP tongue volume did not differ between LH and non-RGO (P②#=0.053) or GLO (P③#=0.502), but GLO exhibited higher RP tongue volume than non-RGO (P①#=0.03). (2) Regarding the tongue fat volume, no significant differences were observed between the GLO and LH groups (P#>0.05). However, both the GLO and LH groups exhibited elevated total tongue fat volume (P①#=0.007, P②#=0.013) and RG tongue fat volume (P①#=0.004, P②#=0.011) compared to the non-retroglossal obstruction (non-RGO) group. In contrast, the RP tongue fat volume showed no intergroup differences (P#>0.05). (3) Regarding the tongue fat percentage, the total tongue fat percentage was higher in GLO than in non-RGO (P①#=0.024), while the RG tongue fat percentage was higher in GLO than in the other two groups (P①#=0.008, P③#=0.036). However, no differences were noted in tongue fat percentage between LH and non-RGO (P②#>0.05) or in RP tongue fat percentage across all groups (P#>0.05). In conclusion, the LH group exhibited larger tongue volume, whereas the GLO group showed higher tongue fat volume and tongue fat percentage.
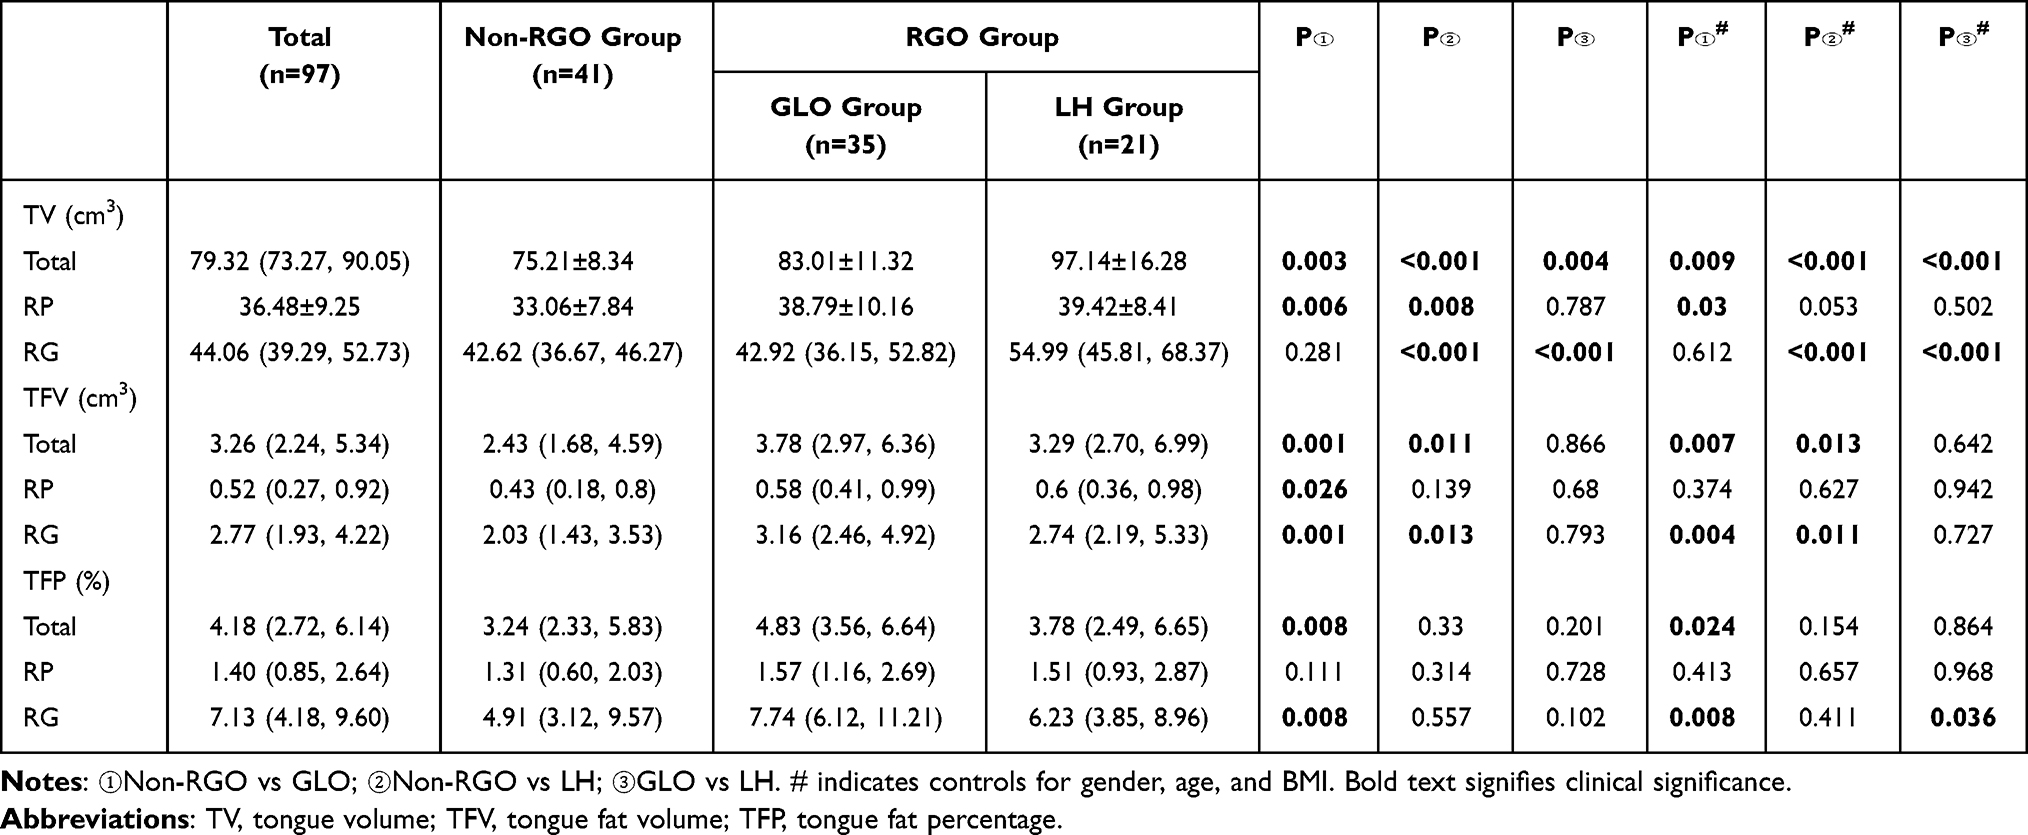 |
Table 2 Tongue Anatomy Measurements of Participants Overall and in Subgroups |
Relationship Between AHI and Individual Parameters
The correlation and partial correlation analysis between AHI and individual parameters are shown in Table 3. Overall, AHI significantly correlated with BMI, NPT-AHI, LSaO2, tongue volume, and tongue fat volume. When controlling for gender, age, and BMI using partial correlation analysis, AHI remained positively correlated with NPT-AHI (r#=0.34, P#<0.001), tongue volume (r#=0.224, P#=0.031), and tongue fat (r#=0.206, P#=0.048), while negatively correlated with LSaO2 (r#=−0.316, P#=0.002).
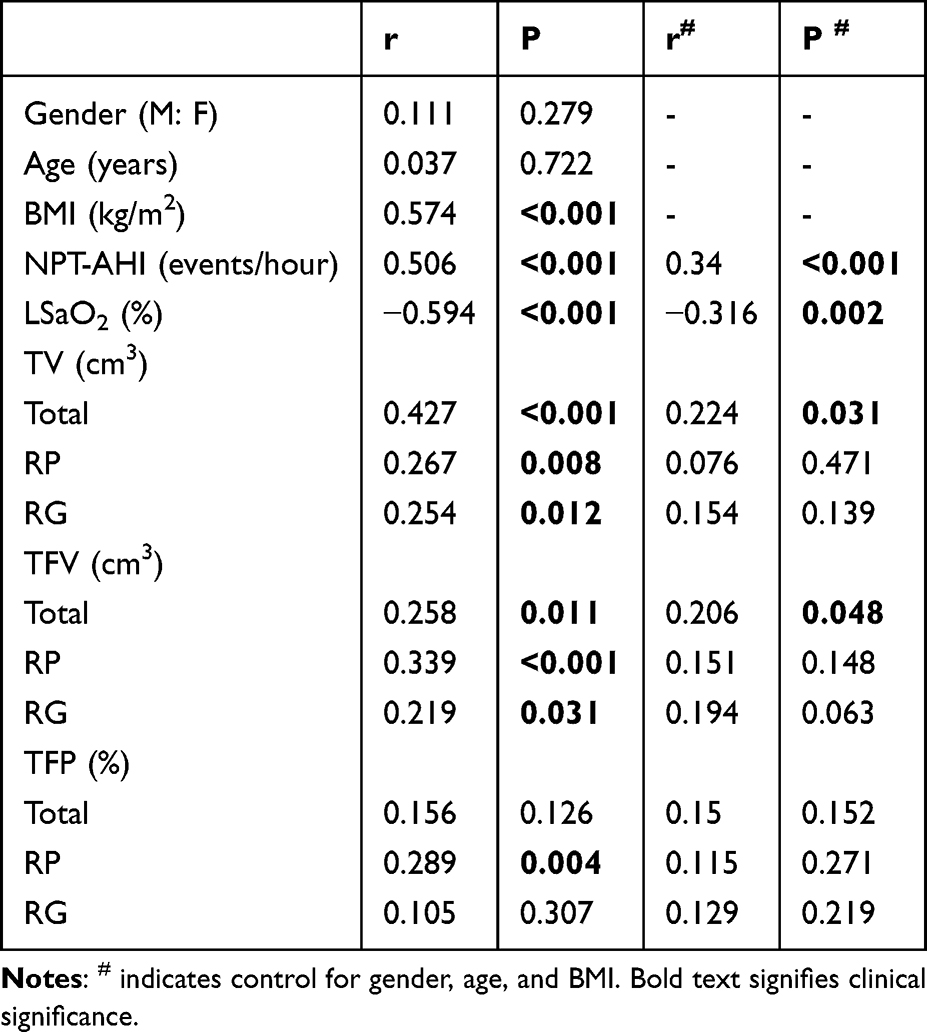 |
Table 3 Correlation and Partial Correlation Analysis Between AHI and Individual Parameters |
Relationship Between NPT-AHI and Individual Parameters
The correlation and partial correlation analyses between NPT-AHI and individual parameters are shown in Table 4. Overall, NPT-AHI exhibited significant correlations with BMI, AHI, LSaO2, tongue volume, tongue fat volume, and tongue fat percentage. When controlling for gender, age, and BMI using partial correlation analysis, NPT-AHI showed positive correlations with total tongue volume (r#=0.349, P#<0.001), RP tongue volume (r#=0.242, P#=0.02), total tongue fat volume (r#=0.368, P#<0.001), RG tongue fat volume (r#=0.396, P#<0.001), total tongue fat percentage (r#=0.281, P#=0.006), and RG tongue fat percentage (r#=0.306, P#=0.003), while negatively correlated with LSaO2 (r#=−0.312, P#<0.001).
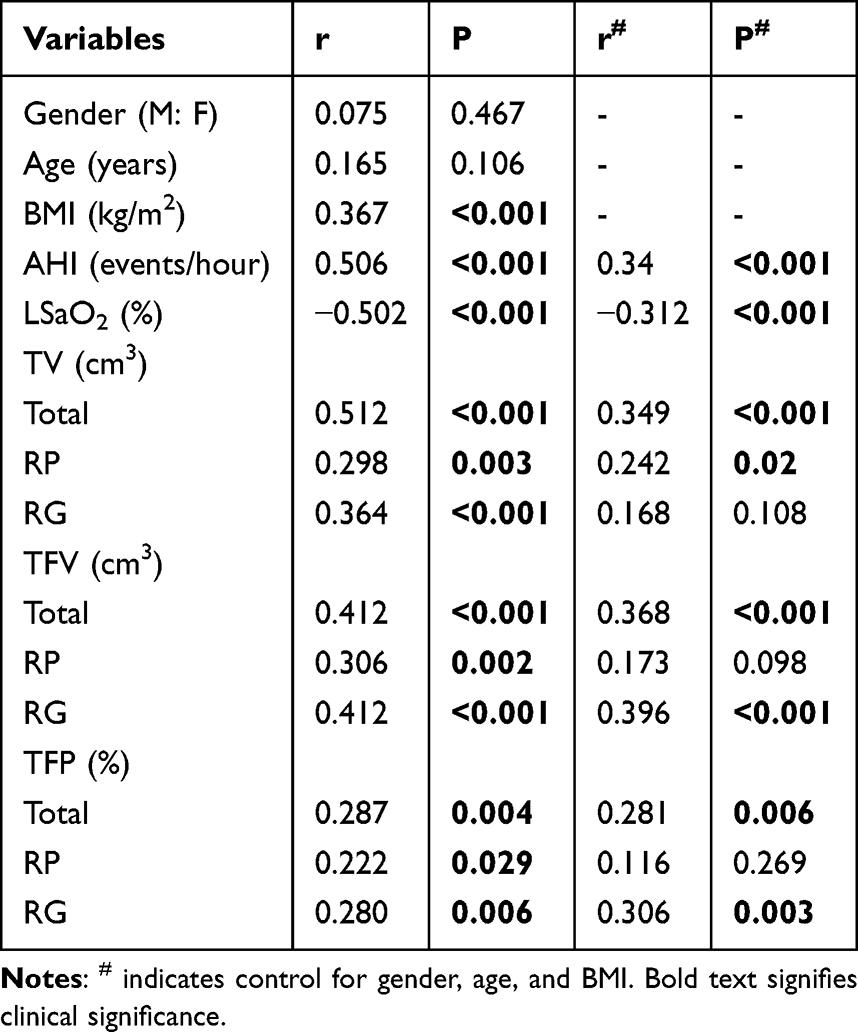 |
Table 4 Correlation and Partial Correlation Analysis Between NPT-AHI and Individual Parameters |
Independent Influencing Factors on Retroglossal Obstruction in Patients with OSA
The results of the multiple linear regression analysis of the factors influencing retroglossal obstruction in patients with OSA are shown in Table 5. Finally, in order to determine the independent influencing factors on the retroglossal obstruction in OSA patients, we performed multiple linear regression analysis with NPT-AHI as the dependent variable and gender, age, BMI, AHI, LSaO2, tongue volume, and tongue fat volume as the independent variables (excluding tongue fat percentage due to multicollinearity issues). In Table 5, B denotes the unstandardized regression coefficient (change in NPT-AHI in events/hour per one-unit increase in the predictor), and Beta (β) denotes the standardized regression coefficient (change in NPT-AHI in standard deviations per one standard deviation increase in the predictor). The results indicate that tongue volume (β=0.264, P=0.005), tongue fat volume (β=0.271, P=0.002), and LSaO2 (β=−0.285, P=0.006) are independent influencing factors of NPT-AHI.
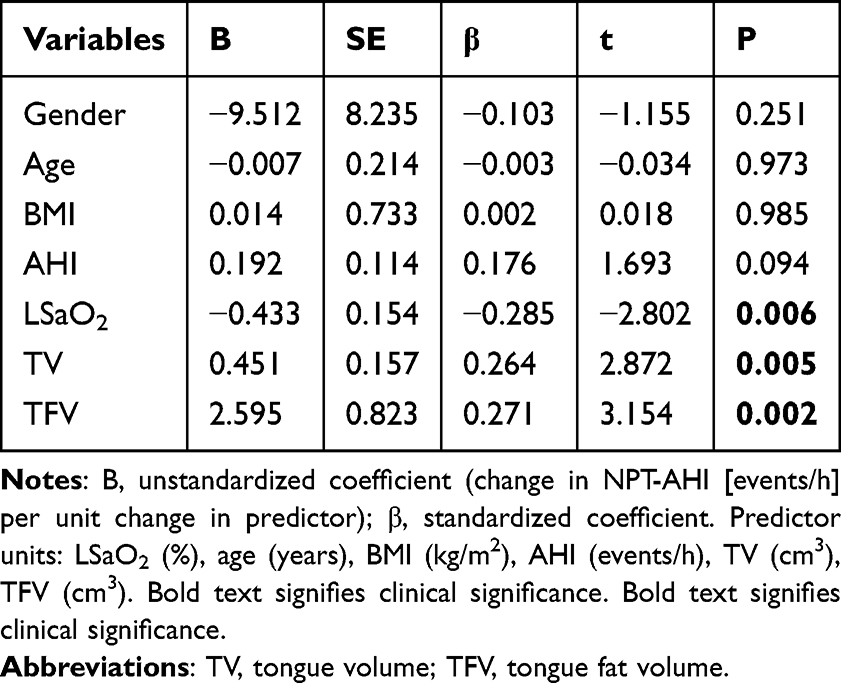 |
Table 5 Multiple Linear Regression Analysis of Factors Influencing Retroglossal Obstruction in Patients with OSA |
Discussion
This study provides novel evidence that tongue fat distribution plays a distinct mechanistic role in retroglossal obstruction subtypes. We demonstrate that: (1) OSA patients with retroglossal obstruction exhibit significantly higher tongue fat volume (particularly in the RG region) compared to non-retroglossal obstruction patients after adjusting for gender, age, and BMI; (2) Glossoptosis and lingual hypertrophy represent distinct phenotypic manifestations-glossoptosis is characterized by disproportionate RG fat accumulation (higher fat percentage), while LH shows proportional increases in both RG volume and fat; (3) Tongue volume, tongue fat volume, and LSaO2 independently predict retroglossal obstruction severity (NPT-AHI). These results suggest that excess tongue fat, especially when concentrated at the tongue base, is more strongly associated with functional collapse (glossoptosis), whereas increased tongue volume with commensurate fat is associated with anatomical narrowing (lingual hypertrophy). It is well recognized that other anatomical factors, including severe palatine tonsillar hypertrophy (which can extend inferiorly and medially to narrow the retroglossal airspace or displace the tongue base6,26), lingual tonsillar hypertrophy, and micrognathia, can also contribute to retroglossal obstruction. However, the present study focused specifically on the two primary tongue‑related mechanisms, which constitute critical challenges in surgical management.6,27
Tongue Fat is Strongly Associated with Glossoptosis
The association between elevated tongue fat percentage and glossoptosis persisted after adjustment for gender, age, and BMI, indicating that fat infiltration itself contributes to retroglossal collapse. Mechanistically, the tongue base anchors the extrinsic lingual muscles (genioglossus, hyoglossus, styloglossus) to skeletal structures. Excessive fat deposition within this region may impair the biomechanical efficiency of these muscles, reducing their ability to stiffen the retroglossal airway against negative inspiratory pressure during sleep.10 This interpretation aligns with the observation that glossoptosis is characterized by functional posterior displacement of the tongue without anatomical narrowing during wakefulness. Our data provide the direct evidence linking regional tongue fat overload to this functional phenotype.
In contrast, lingual hypertrophy appears to be driven primarily by increased tongue volume rather than selective fat accumulation. The fact that tongue fat percentage in the LH group did not differ from the non‑RGO group after covariate adjustment suggests that the elevated tongue fat volume in LH is proportional to the overall enlargement of the tongue. This implies that different therapeutic strategies may be needed for the two subtypes. Specifically, weight loss interventions for glossoptosis versus volume‑reduction surgery for lingual hypertrophy.
The Role of Hypoxia in Tongue Fat Deposition and Muscle Dysfunction
Our regression analysis identified LSaO2 as an independent negative predictor of NPT‑AHI (β = −0.285, P = 0.006), indicating that more severe nocturnal hypoxemia is associated with greater retroglossal obstruction. This finding raises the possibility of a bidirectional relationship between hypoxia and tongue pathology. Intermittent hypoxia, a hallmark of OSA, stabilizes hypoxia‑inducible factor‑1α (HIF‑1α), which in turn promotes adipose tissue inflammation and insulin resistance.28,29 Such metabolic disturbances may facilitate fat deposition in the tongue, creating a vicious cycle. In addition, chronic intermittent hypoxia can impair mitochondrial metabolism and alter oxidative myofibers in the geniohyoid muscle,30 potentially reducing the contractile strength of tongue muscles and predisposing to retroglossal collapse. Although the cross-sectional design of our study does not allow us to establish causality, these mechanistic associations suggest that effective treatment of OSA through improved nocturnal oxygenation may also reduce fat accumulation and muscle dysfunction in the tongue. This could complement interventions that directly target fat.
Predominant Fat Deposition in the Retroglossal Region
Our regional analysis revealed that tongue fat is predominantly localized to the RG region rather than the retropalatal region, regardless of RGO subtype (Figure 1 and Table 2). The RG region anchors the extrinsic lingual muscles to skeletal structures. Excessive fat infiltration here may act as a mechanical burden that impairs muscle contraction and reduces the ability to stiffen the retroglossal airway during sleep. This anatomical predilection may provide a structural explanation for why the tongue base is particularly vulnerable to fat‑related dysfunction and why retroglossal obstruction often originates from this site.
Comparison with Previous Literature
Previous studies have established that OSA patients have larger tongue volumes and higher tongue fat content than non‑OSA controls,9,10 and that weight loss reduces tongue fat with concomitant improvement in AHI.11 Our findings further expand on these observations, suggesting that the relationship between tongue fat and OSA severity varies depending on the type of obstruction. In our cohort, the glossoptosis group drove the correlation between tongue fat percentage and NPT‑AHI. This suggests that past studies reporting an association between tongue fat and AHI may have been primarily capturing patients with glossoptosis‑like physiology. The few studies that failed to find a significant correlation between tongue fat and OSA severity31,32 may have included a higher proportion of patients with lingual hypertrophy or multi‑level obstruction, diluting the effect. By using NPT‑PSG to isolate retroglossal obstruction, we minimized such confounding, which likely increased our ability to detect fat‑related associations.
Clinical Implications and Precision Treatment
The preferential fat deposition in the RG region has direct therapeutic implications. For patients with glossoptosis, who exhibit disproportionately high tongue fat percentage, fat‑reducing strategies should be prioritized. These include lifestyle modification and weight loss, which have been shown to reduce tongue fat and improve AHI,11 as well as oropharyngeal exercises that may preferentially target the tongue base.33,34 Emerging techniques such as cryolipolysis35–37 represent experimental approaches that could be refined to selectively reduce RG fat. In contrast, for patients with lingual hypertrophy, where tongue volume enlargement is the dominant feature, surgical volume reduction such as midline glossectomy or tongue‑base suspension is more appropriate. Importantly, the RG region should be the primary operative target during these procedures. Previous studies support confining midline glossectomy to the foramen cecum area (the middle‑posterior third of the tongue). This aligns with our perspective, as this corresponds to the RG region with the highest fat content. Therefore, preoperative characterization of RGO subtypes using NPT-PSG and RCSA measurements may guide the treatment of OSA. Specifically, fat-targeted non-surgical interventions are used for glossoptosis, while volume-reduction surgery is used for lingual hypertrophy. Both approaches focus on the RG region.
Limitations
There are several potential limitations of the present study that need to be addressed. First, the study population was relatively small, with a low percentage of female patients, and other anatomical measurements of the upper airway were not measured. Future studies should expand the sample size, especially by increasing the number of female patients, to explore gender differences and further enrich the correlation between tongue anatomy measurements and other anatomical measurements. Second, the cross-sectional design precludes any inference of causality. Although we identified associations between tongue fat and retroglossal obstruction, we cannot determine whether tongue fat accumulation leads to obstruction or results from OSA-related metabolic changes. Furthermore, our restrictive inclusion criteria limit the generalizability of the findings to the broader OSA population with multi-level collapse or less severe disease.
Third, we did not recruit people with non-OSA as controls to analyze, and future research should incorporate a healthy control group to better compare the differences between the OSA group and the non-OSA group. Fourth, due to surgical indication limitations, this study only included patients with moderate-to-severe OSA (mean AHI 63 events/hour). The high severity reflects our tertiary referral practice, where patients are typically more severe. Consequently, our findings may not generalize to mild OSA or primary care settings. Future studies should include patients across the full severity spectrum for comprehensive assessment. Fifth, although we defined significant retroglossal obstruction as NPT‑AHI ≥ 15 events/hour based on prior surgical criteria, we acknowledge that night‑to‑night variability could affect group assignment. The non‑RGO group (NPT‑AHI < 15) may inherently have milder disease, potentially biasing comparisons toward overestimated differences in tongue anatomy. Nevertheless, all patients had moderate‑to‑severe OSA on baseline PSG (AHI ≥ 15), and the paired within‑subject design partially mitigated this concern. Future studies with repeated NPT‑PSG are warranted. Sixth, the RCSA cutoff of 180 mm2 is anatomically related to tongue size, which could introduce inherent tongue volume differences between groups. However, the additional NPT‑AHI criterion and adjustment for covariates mitigate this concern, and the observed volume differences are a key finding rather than an artifact. Seventh, we assumed linear relationships in regression analyses; residual diagnostics did not suggest significant nonlinearity, but larger studies are needed to explore possible nonlinear effects. Finally, it is important to note that while CT-based fat segmentation provides valuable structural information and was suitable for the purposes of this study given the availability of clinical scans, it is not the most precise method for quantifying fat tissue. Future studies could employ more advanced techniques specifically designed for fat characterization, such as m-Dixon MRI to improve accuracy and reliability in quantifying lingual fat.
Conclusion
In summary, retroglossal obstruction severity in OSA patients is associated with larger tongue volume, higher tongue fat volume, and lower LSaO2. Moreover, the patterns of these associations differ between the two etiologies: glossoptosis shows a stronger association with tongue fat, whereas lingual hypertrophy shows a stronger association with overall tongue volume. From a clinical perspective, these findings support the consideration of precise treatment strategies targeting tongue fat in OSA patients with retroglossal obstruction, especially those with the glossoptosis phenotype.
Data Sharing Statement
The datasets generated and analysed during the current study are available from the corresponding author, Dahai Wu, upon reasonable request.
Ethics Approval and Consent to Participate
This study was approved by the Institutional Review Board of General Hospital of Northern Theater Command (Y (2024) 346) and was conducted in accordance with the Declaration of Helsinki. As this study was retrospective and involved only retrospective analysis of anonymized medical records, posed no additional risks to participants, and did not involve direct interaction with patients, the hospital’s Institutional Review Board waived the requirement for written informed consent. All patient data were anonymized and handled in accordance with the hospital’s confidentiality agreement to ensure privacy and were used only for the purpose of this study.
Author Contributions
Yibo Hao and Jie Qin: Writing – original draft, Writing – review and editing, Visualization, Resources, Project administration, Methodology, Investigation, Conceptualization, Software. Dahai Wu: Writing – original draft, Writing – review and editing, Visualization, Resources, Project administration, Methodology, Investigation, Conceptualization, Software. Zhe Wang: Writing – review and editing, Investigation. Yanru Duan: Writing – review and editing, Investigation. Xiangrong Cao: Writing – review and editing, Investigation. Zhiming Zhang: Writing – review and editing, Supervision, Methodology, Conceptualization. All authors gave final approval of the version to be published; have agreed on the journal to which the article has been submitted; and agree to be accountable for all aspects of the work.
Funding
This work was supported by the Joint Project of Liaoning Provincial Science and Technology Program (Key R&D Program) [Grant 2023JH2/101800014].
Disclosure
The authors declare no competing interests.
References
1. Jordan AS, McSharry DG, Malhotra A. Adult obstructive sleep apnoea. Lancet. 2014;383(9918):736–12. doi:10.1016/S0140-6736(13)60734-5
2. Antic NA, Catcheside P, Buchan C, et al. The effect of CPAP in normalizing daytime sleepiness, quality of life, and neurocognitive function in patients with moderate to severe OSA. Sleep. 2011;34(1):111–119. doi:10.1093/sleep/34.1.111
3. Gamaleldin O, Bahgat A, Anwar O, et al. Role of dynamic sleep MRI in obstructive sleep apnea syndrome. Oral Radiol. 2021;37(3):376–384. doi:10.1007/s11282-020-00455-w
4. Schwab RJ. Properties of tissues surrounding the upper airway. Sleep. 1996;19(suppl_10):S170–174. doi:10.1093/sleep/19.suppl_10.170
5. Ciscar MA, Juan G, Martínez V, et al. Magnetic resonance imaging of the pharynx in OSA patients and healthy subjects. Europ Resp J. 2001;17(1):79–86. doi:10.1183/09031936.01.17100790
6. Gao W, Shi L, Xing D, et al. Analysis of the cause of retrolingual obstruction in patients with moderate-severe obstructive sleep apnea. Europ Archiv Oto-Rhino-Laryngol. 2024;281(2):1031–1039. doi:10.1007/s00405-023-08333-x
7. White DP, Younes MK. Obstructive sleep apnea. Compr Physiol. 2012;2(4):2541–2594. doi:10.1002/j.2040-4603.2012.tb00472.x
8. Choi SJ, Files DC, Zhang T, et al. Intramyocellular lipid and impaired myofiber contraction in normal weight and obese older adults. J Gerontol a Biol Sci Med Sci. 2016;71(4):557–564. doi:10.1093/gerona/glv169
9. Molnár V, Lakner Z, Molnár A, et al. The predictive role of the upper-airway adipose tissue in the pathogenesis of obstructive sleep apnoea. Life. 2022;12:1543.
10. Kim AM, Keenan BT, Jackson N, et al. Tongue fat and its relationship to obstructive sleep apnea. Sleep. 2014;37(10):1639–1648. doi:10.5665/sleep.4072
11. Wang SH, Keenan BT, Wiemken A, et al. Effect of weight loss on upper airway anatomy and the apnea-hypopnea index. the importance of tongue fat. Am J Respir Crit Care Med. 2020;201(6):718–727. doi:10.1164/rccm.201903-0692OC
12. Schweiger C, Manica D, Kuhl G. Glossoptosis. Seminars Pediatric Surg. 2016;25(3):123–127. doi:10.1053/j.sempedsurg.2016.02.002
13. Li S, Qin Y, Wu D. Lingual-occlusal surface position predicts retroglossal obstruction in patients with obstructive sleep apnea hypopnea syndrome. Acta oto-laryngologica. 2015;135(11):1146–1151. doi:10.3109/00016489.2015.1061696
14. Berry RB, Brooks R, Gamaldo C, et al. AASM scoring manual updates for 2017 (Version 2.4). J Clin Sleep Med. 2017;13(5):665–666. doi:10.5664/jcsm.6576
15. Li S, Wu D, Bao J, Shi H. The nasopharyngeal tube: a simple and effective tool to indicate the need for uvulopalatopharyngoplasty. Laryngoscope. 2014;124(4):1023–1028. doi:10.1002/lary.24351
16. Lee JJ, Sundar KM. Evaluation and management of adults with obstructive sleep apnea syndrome. Lung. 2021;199(2):87–101. doi:10.1007/s00408-021-00426-w
17. Akashiba T, Inoue Y, Uchimura N, et al. Sleep apnea syndrome (SAS) clinical practice guidelines 2020. Respiratory Investigation. 2022;60(1):3–32. doi:10.1016/j.resinv.2021.08.010
18. Cai M, Brown EC, Hatt A, Cheng S, Bilston LE. Effect of head and jaw position on respiratory-related motion of the genioglossus. J Appl Physiol. 2016;120(7):758–765. doi:10.1152/japplphysiol.00382.2015
19. Fedorov A, Beichel R, Kalpathy-Cramer J, et al. 3D slicer as an image computing platform for the quantitative imaging network. Magnetic Resonance Imag. 2012;30(9):1323–1341. doi:10.1016/j.mri.2012.05.001
20. Nemoto M, Yeernuer T, Masutani Y, et al. Development of automatic visceral fat volume calculation software for CT volume data. J Obes. 2014;2014:495084. doi:10.1155/2014/495084
21. Rosenblatt AJ, Scrivani PV, Boisclair YR, et al. Evaluation of a semi-automated computer algorithm for measuring total fat and visceral fat content in lambs undergoing in vivo whole body computed tomography. Veterinary J. 2017;228:46–52. doi:10.1016/j.tvjl.2017.10.012
22. Song A, Phillips H, Oliveira CR, McCoy AM. CT volumetric analysis permits comparison of tongue size and tongue fat in different canine brachycephalic and mesaticephalic breeds. Veterinary Radiol Ultrasound. 2023;64(3):429–438. doi:10.1111/vru.13221
23. Gottlieb DJ, Punjabi NM. Diagnosis and management of obstructive sleep apnea: a review. JAMA. 2020;323(14):1389–1400. doi:10.1001/jama.2020.3514
24. Wu D, Shi H, Guo X, Li S. Predictive value of lingua/pharynx ratio for retroglossal obstruction in patients with obstructive sleep apnea hypopnea syndrome. Acta oto-laryngologica. 2013;133(5):504–508. doi:10.3109/00016489.2012.743172
25. Li S, Dong X, Shi H, et al. Localization of upper airway stricture in patients with obstructive sleep apnea syndrome by CT scan. Zhonghua Er Bi Yan Hou Ke Za Zhi. 2002;37(2):133–136.
26. Baudouin R, Alali A, Hans S, Blumen M, Chabolle F. OSAS and upper pharynx surgery: does basilingual collapsus always rhyme with failure? Europ Ann Otorhinolaryngol Head Neck Dis. 2021;138(3):135–139. doi:10.1016/j.anorl.2020.07.004
27. Remmers JE, deGroot WJ, Sauerland EK, Anch AM. Pathogenesis of upper airway occlusion during sleep. J Appl Physiol Respir Environ Exerc Physiol. 1978;44(6):931–938. doi:10.1152/jappl.1978.44.6.931
28. Lee YS, Kim JW, Osborne O, et al. Increased adipocyte O2 consumption triggers HIF-1α, causing inflammation and insulin resistance in obesity. Cell. 2014;157(6):1339–1352. doi:10.1016/j.cell.2014.05.012
29. Li P, Oh DY, Bandyopadhyay G, et al. LTB4 promotes insulin resistance in obese mice by acting on macrophages, hepatocytes and myocytes. Nat Med. 2015;21(3):239–247. doi:10.1038/nm.3800
30. Wongkitikamjorn W, Hosomichi J, Wada E, et al. Gestational intermittent hypoxia induces mitochondrial impairment in the geniohyoid muscle of offspring rats. Cureus. 2022;14:e25088.
31. Jugé L, Olsza I, Knapman FL, et al. Effect of upper airway fat on tongue dilation during inspiration in awake people with obstructive sleep apnea. Sleep. 2021;44(12). doi:10.1093/sleep/zsab192
32. Zhao B, Cao Z, Xie Y, et al. The relationship of tongue fat content and efficacy of uvulopalatopharyngoplasty in Chinese patients with obstructive sleep apnea. BMC Surg. 2023;23(1):254. doi:10.1186/s12893-023-02144-x
33. Puhan MA, Suarez A, Lo Cascio C, Zahn A, Heitz M, Braendli O. Didgeridoo playing as alternative treatment for obstructive sleep apnoea syndrome: randomised controlled trial. BMJ. 2006;332(7536):266–270. doi:10.1136/bmj.38705.470590.55
34. Verma RK, Johnson JJ, Goyal M, Banumathy N, Goswami U, Panda NK. Oropharyngeal exercises in the treatment of obstructive sleep apnoea: our experience. Sleep Breath. 2016;20(4):1193–1201. doi:10.1007/s11325-016-1332-1
35. Sasaki GH. Reply: cryolipolysis for fat reduction and body contouring: safety and efficacy of current treatment paradigms. Plastic Reconstructive Surg. 2016;137(3):640e–641e. doi:10.1097/01.prs.0000479983.49996.c0
36. Lipner SR. Cryolipolysis for the treatment of submental fat: review of the literature. J Cosmet Dermatol. 2018;17(2):145–151. doi:10.1111/jocd.12495
37. Orestes MI, Tuchayi SM, Wang Y, et al. Safety and feasibility of selective tongue fat reduction with injected ice-slurry. Laryngoscope Investigative Otolaryngol. 2022;7(5):1675–1680. doi:10.1002/lio2.902
 © 2026 The Author(s). This work is published and licensed by Dove Medical Press Limited. The
full terms of this license are available at https://www.dovepress.com/terms
and incorporate the Creative Commons Attribution
- Non Commercial (unported, 4.0) License.
By accessing the work you hereby accept the Terms. Non-commercial uses of the work are permitted
without any further permission from Dove Medical Press Limited, provided the work is properly
attributed. For permission for commercial use of this work, please see paragraphs 4.2 and 5 of our Terms.
© 2026 The Author(s). This work is published and licensed by Dove Medical Press Limited. The
full terms of this license are available at https://www.dovepress.com/terms
and incorporate the Creative Commons Attribution
- Non Commercial (unported, 4.0) License.
By accessing the work you hereby accept the Terms. Non-commercial uses of the work are permitted
without any further permission from Dove Medical Press Limited, provided the work is properly
attributed. For permission for commercial use of this work, please see paragraphs 4.2 and 5 of our Terms.
Recommended articles
Assessing Invasiveness of Ground-Glass Nodules Using Ternary-Class CT Radiomics Models: A Multi-Center Study with SHAP Explanations
Zhao P, Chen H, Gu H, Lin Y, Ma Y
Cancer Management and Research 2026, 18:602730
Published Date: 5 June 2026