Back to Journals » Journal of Inflammation Research » Volume 17
Analysis of Immune and Prognostic-Related lncRNA PRKCQ-AS1 for Predicting Prognosis and Regulating Effect in Sepsis
Authors Ding X, Liang W, Xia H ![]() , Liu Y, Liu S, Xia X, Zhu X
, Liu Y, Liu S, Xia X, Zhu X ![]() , Pei Y
, Pei Y ![]() , Zhang D
, Zhang D
Received 28 August 2023
Accepted for publication 7 December 2023
Published 12 January 2024 Volume 2024:17 Pages 279—299
DOI https://doi.org/10.2147/JIR.S433057
Checked for plagiarism Yes
Review by Single anonymous peer review
Peer reviewer comments 4
Editor who approved publication: Dr Adam Bachstetter
Xian Ding,1,* Wenqi Liang,2,* Hongjuan Xia,1,* Yuee Liu,2 Shuxiong Liu,1 Xinyu Xia,1 Xiaoli Zhu,1 Yongyan Pei,3 Dewen Zhang4
1Department of Emergency, Third Affiliated Hospital of Naval Medical University, Shanghai, People’s Republic of China; 2Department of Emergency, Shanghai Changhai Hospital, Naval Medical University, Shanghai, People’s Republic of China; 3School of Chemistry and Chemical Engineering, Guangdong Pharmaceutical University, Zhongshan, People’s Republic of China; 4Longhua Clinical Medical College, Shanghai University of Traditional Chinese Medicine, Shanghai, People’s Republic of China
*These authors contributed equally to this work
Correspondence: Yongyan Pei, School of Chemistry and Chemical Engineering, Guangdong Pharmaceutical University, No. 9-13, Zhongshan Campus, No. 13, Changmingshui Avenue, Wuguishan, Zhongshan City, Guangdong Province, People’s Republic of China, Email [email protected] Dewen Zhang, Longhua Clinical Medical College, Shanghai University of Traditional Chinese Medicine, 1200 Cailun Road, Pudong New Area, Shanghai, People’s Republic of China, Email [email protected]
Background: Sepsis was a high mortality and great harm systemic inflammatory response syndrome caused by infection. lncRNAs were potential prognostic marker and therapeutic target. Therefore, we expect to screen and analyze lncRNAs with potential prognostic markers in sepsis.
Methods: Transcriptome sequencing and limma was used to screen dysregulated RNAs. Key RNAs were screened by correlation analysis, lncRNA-mRNA co-expression and weighted gene co-expression network analysis. Immune infiltration, gene set enrichment analysis and gene set variation analysis were used to analyze the immune correlation. Kaplan–Meier curve, receiver operator characteristic curve, Cox regression analysis and nomogram were used to analyze the correlation between key RNAs and prognosis. Sepsis model was established by lipopolysaccharide-induced HUVECs injury, and then cell viability and migration ability were detected by cell counting kit-8 and wound healing assay. The levels of apoptosis-related proteins and inflammatory cytokines were detected by RT-qPCR and Western blot. Reactive Oxygen Species and superoxide dismutase were detected by commercial kit.
Results: Fourteen key differentially expressed lncRNAs and 663 key differentially expressed genes were obtained. And these lncRNAs were closely related to immune cells, especially T cell activation, immune response and inflammation. Subsequently, Subsequently, lncRNA PRKCQ-AS1 was identified as the regulator for further investigation in sepsis. RT-qPCR results showed that PRKCQ-AS1 expression was up-regulated in clinical samples and sepsis model cells, which was an independent prognostic factor in sepsis patients. Immune correlation analysis showed that PRKCQ-AS1 was involved in the immune response and inflammatory process of sepsis. Cell function tests confirmed that PRKCQ-AS1 could inhibit sepsis model cells viability and promote cell apoptosis, inflammatory damage and oxidative stress.
Conclusion: We constructed immune-related lncRNA-mRNA regulatory networks in the progression of sepsis and confirmed that PRKCQ-AS1 is an important prognostic factor affecting the progression of sepsis and is involved in immune response.
Keywords: sepsis, immune-related lncRNA, lncRNA-mRNA, PRKCQ-AS1, prognosis and progress
Introduction
Sepsis was a life-threatening multiple-organ dysfunction, usually caused by severe trauma, burns and major surgery, accompanied by systemic inflammatory response and immunosuppressive process.1–3 Some studies have also confirmed that the development of sepsis involves various immune stress and immune regulation processes.4–6 At present, the treatment of sepsis mainly depended on early identification and the use of antibiotics, but the clinical effect was still not satisfactory, and it was still the main cause of death in critically ill patients.7,8 According to statistics, more than 30 million people developed sepsis every year, and about 30% of them die. Moreover, patients who survived sepsis had a poor prognosis and were at risk of recurrence.9,10 Therefore, it was very important to understand the basic mechanism of sepsis and identify potential biomarkers and targets as tools for diagnosis, treatment and drug development.
With the development of sequencing technology, previous studies have shown that pathogen activation of immune cells can lead to dynamic changes in the expression of some infection-resistant genes, including lncRNA. LncRNA has been confirmed that lncRNA was involved in the occurrence and development of a variety of diseases, including sepsis.11,12 Yang et al found that lncRNA NEAT1 inhibited the progression of lipopolysaccharide-induced (LPS-induced) sepsis in RAW264.7 cells by regulating the miR-31-5p/POU2F1 axis, suggesting that NEAT1 would be a potential therapeutic target for sepsis.13 Similarly, lncRNA MIR155HG can promote the progression of sepsis by regulating the miR-194-5p/MEF2A axis, suggesting that MIR155HG can be used as a potential biomarker to promote the diagnosis and treatment of sepsis.14 In addition, lncRNAs were also generally involved in the pathogenesis of various diseases by targeting miRNA or mRNA. Liu et al confirmed that lncRNA GSEC can regulate glycolytic metabolism by targeting PFKFB3, activate neutrophil inflammation and promote the development of sepsis.15 However, the current research on lncRNA-mRNA expression network in sepsis was limited, and the role of lncRNAs associated with sepsis has not been fully clarified, which may be an important factor hindering the study of the complex molecular mechanism of this deadly disease. Meanwhile, because of its multiple regulatory mechanisms, lncRNA has also been reported by researchers as a potential marker of various diseases.16 Therefore, further research was needed to study how lncRNA affects sepsis and regulates the exact molecular mechanisms, as well as to identify candidate lncRNA for diagnosis and treatment.
In this study, we expected to establish novel lncRNA-mRNA co-expression network and screen out key lncRNAs involved in the development of sepsis by transcriptome sequencing, series of bioinformatics methods and qPCR. Then to explore the role of key lncRNAs from lncRNA-mRNA co-expression network in sepsis by western, sepsis model (LPS-induced HUVECs) and cell function assay. The research content was shown in the form of flow chart (Figure S1). The results of this study can provide targeted basis for early diagnosis, drug development and treatment of sepsis.
Materials and Methods
Gene Expression Omnibus Database Acquisition
GSE95233 and GSE28750 expression profile data were downloaded from Gene Expression Omnibus (GEO) (https://www.ncbi.nlm.nih.gov/geo/) database. GSE95233 was based on [HG-U133_Plus_2] Affymetrix Human Genome U133 Plus 2.0 Array, which contained 73 blood samples (22 healthy controls and 51 sepsis samples). GSE28750 was based on [HG-U133_Plus_2] Affymetrix Human Genome U133 Plus 2.0 Array, which contained 31 blood samples (20 healthy controls and 10 sepsis samples). Meanwhile, GSE95233 clinical information were download.
Clinical Sample Collection
Nineteen diagnosed patients with septic infection treated in the third affiliated Hospital of Naval Medical University from May 2021 to September 2021 were selected as samples, and 19 healthy volunteers were selected as control group (Table S1). Inclusion criteria: (1) Refer to the diagnostic criteria for sepsis in the third edition of the international consensus on the definition of sepsis and septic shock (Sepsis-3);17 (2) Age ≥ 18 years old; (3) Complete clinical data; (4) The patient was informed and signs an informed consent form. Exclusion criteria; (1) hospitalization time<24 h; (2) Infected with viruses or other pathogens; (3) immunodeficiency, malignant tumor, hematological disease or severe mental illness; (4) Received antibiotic treatment before admission; (5) women who were lactating or pregnant; (6) patients or their families offered to give up treatment. Collect basic information of patients (age and gender); 4 mL Peripheral blood was collected and stored in −80°C. Among 19 pairs clinical samples, 4 pairs of samples were used for transcriptome sequencing, and the remaining 15 pairs were used for RT-qPCR analysis of key genes. This study was approved by the Ethics Committee of the third affiliated hospital of naval military medical university and was carried out in accordance with the Declaration of Helsinki.
Cell Culture, Transfection and Treatment
Human umbilical vein endothelial cells (HUVECs) were purchased from BeNa Culture Collection (BNCC, Henan, China). The culture medium was 90% Dulbecco’s modified Eagle’s medium (DMEM, Thermo, USA) mixed with 10% fetal bovine serum (FBS, Thermo, USA) and cultured in cell incubator with 5% CO2 and 37 °C.
PRKCQ-AS1(ENST00000663449) overexpression plasmid (pCDH-GFP-PRKCQ-AS1) and si-PRKCQ-AS1 were all purchased from Guangzhou RiboBio (China). The sequence information of overexpressing plasmids and siRNA can be found in Supplementary Materials 1 and 2. All plasmids were tested according to the manufacturer’s instructions and transfected into cells using Lipofectamine 3000 reagent (Invitrogen, USA).
For LPS induction, HUVECs were inoculated in 6-well plates or 96-well plates and incubated for 12 h. HUVECs were treated with LPS (0.1μg/mL, 1μg/mL, 5μg/mL, 10μg/mL and 100μg/mL) or normal saline (control) for 24 h, and cells were collected for further analysis.
RNA Isolation and Libraries Preparation for RNA Sequencing
The total RNA was extracted according to the manufacturer’s instructions using RNAprep Pure efficient total RNA extraction kit (TIANGen, Beijing, China). RNA concentration and purity were detected by NanoDrop2000 and agarose gel electrophoresis, respectively. RNA integrity was then verified using Agilent 2100 bioanalyzer. Library construction was performed using TruSeq Stranded Total RNA with Ribo-Zero (Illumina, California, USA). After construction of libraries, the libraries were initially quantified by Qubit2.0 Fluorometer and diluted to 1.5 ng/μL, then the insert size of the libraries was detected by Agilent 2100 bioanalyzer. qRT-PCR quantified the effective concentration of the libraries accurately and was quantified using qRT-PCR (the effective concentration of the library was higher than 2nM). Finally, the libraries were sequenced using NovaSeq 6000.
Sequencing Data Processing and Screening of Differentially Expressed RNAs (lncRNAs and mRNAs)
Firstly, the quality of the original sequencing data was filtered as follows: (1) The adapter sequence in reads was removed; (2) The bases containing non-AGCT in the 5’ end were removed before shear; (3) pruned the reads terminal with low sequencing quality (less than Q20); (4) reads containing 10% N were removed; (5) Discard the small segments less than 25bp after the adapter is removed and the quality is trimmed. The sequence data after quality control were compared to the human reference genome GRCh38 (http://asia.ensembl.org/Homo_sapiens/Info/Index). According to the comparison results, the FPKM value of each gene/transcript in the sample was calculated. For all mRNA genes and transcripts, six databases (NR, Swiss-Prot, Pfam, STRING, GO and KEGG) were annotated.
After obtaining gene expression levels, RNAs with significant differences between sepsis groups and control groups were screened. Firstly, the original read count was normalized. Screening criteria: | log2 fold change (FC) |≥1, q<0.05 and False Discovery Rate (FDR)<0.05.18 Finally, volcano plot and heat map were used to visualize the differentially expressed RNAs.
Functional Enrichment Analysis
The “simple enrichment analysis” in Sangerbox tool was used for functional analysis.18 Then, the R software package clusterProfiler (version 3.14.3) was used for enrichment analysis to obtain the results of gene set enrichment. The minimum gene set was 5, and the maximum gene set was 5000. P values <0.05 and FDR of <0.25 were considered statistically significant.
Co-Expression Analysis and Weighted Gene Co-Expression Network Analysis
To explore the targeting relationship between lncRNAs and mRNAs, we calculated the Pearson correlation coefficient (PCCs) between lncRNAs and mRNA. P<0.05 and Pearson’s correlation>0.9 were the criteria for predicting target genes of lncRNAs. The co-expression network was then mapped and visualized via Cytoscape 3.9.1.
Weighted gene co-expression network analysis (WGCNA) was performed using the GSE28750 dataset as the genetic background. Firstly, MAD (Median Absolute Deviation) of each gene was calculated, and the top 50% of the minimum MAD genes were excluded. Outlier genes and samples were removed using goodSamplesGenes method of R software package WGCNA. Further, a scale-free co-expression network was constructed. After choosing the power of 6, we carried out hierarchical cluster analysis and clustered genes according to the set criteria. The execution parameters were: power=6, block Size=7000, minimodules=20, deepSplit=2, mergeCutHeight =0.25, hub cut=0.9. Finally, the correlation between gene modules and phenotypes was calculated, and identified the trait-related modules.
Gene Set Enrichment Analysis and Gene Set Variation Analysis
“Gene set enrichment analysis (GSEA)” in Sangerbox tool was used to analyze the differences of biological processes between different groups of septic patients. The h.all.v7.4.symbols.gmt and c2.cp.kegg.v7.4.symbols.gmt subsets were downloaded from Molecular Signatures Database (http://www.gsea-msigdb.org/gsea/downloads.jsp). Based on GSE95233 data and phenotypic grouping, the minimum gene set was set to 5, the maximum gene set was 5000, a thousand resampling times, p value <0.05 and False Discovery Rate (FDR) <0.25 were considered statistically significant.
“Gene set variation analysis (GSVA)” in Sangerbox tool was used to calculate the enrichment score of each sample downloaded. The c2.all.v7.4.symbols.gmt subset was downloaded from Molecular Signatures Database (http://www.gsea-msigdb.org/gsea/downloads.jsp). Based on GSE95233 data, Hänzelmann et al method was used to evaluate the related pathways and molecular mechanisms.19 The minimum gene set was 5 and the maximum gene set was 5000. Then R software package “limma” (version 3.40.6) was used to analyze the difference of the matrix. The identification condition was | log2 fold change (FC) | ≥ 0.5, p value < 0.05 and FDR < 0.05.
Immune Cell Infiltration
Based on the GSE95233 data, CIBERSORT was used to calculate the scores of 22 kinds of immune cells. The different types of immune cells were screened according to the condition of p < 0.05. ggplot2 package was used to draw a histogram. Then, R software package “corrplot” was used to visualize the correlation of each type of immune cell infiltration. Furthermore, ggplot2 package was used to visualize the correlation between RNA and immune cells, as well as the difference of immune cells between sepsis group and control group.
Survival Prognosis Analysis
Survival analysis was performed using R software package “survival with GSE95233 clinical data, presented using.” Kaplan–Meier curve. The Log-rank (Mantel-Cox) test was used to identify statistical differences. Univariate and multivariate Cox regression analysis was performed by Sangerbox tool for key RNAs with age and gender. R software package “forestplot” was used to drawn forest plot. Then, R software package “rms” was used to construct nomogram by integrating survival time, survival status, age and gender. Finally, the accuracy and stability of nomogram were evaluated by calibration curve, Receiver operator characteristic (ROC) curve and Kaplan–Meier curve.20
Validation of lncRNAs Expression in RNA Sequencing by RT-qPCR
Reverse transcription (1 μg) was performed using Fast King cDNA first-Strand Synthesis kit (TIANGen, Beijing, China). The expression of RNA was detected by Bio-Rad real-time PCR detection system. All the primers were designed by Primer 5 and the sequence of primers were shown in Table S2. GAPDH and β-actin were used as the internal controls. And the 2−ΔΔCt method was used to calculate the relative expression. Sangon Biotech (Shanghai, China) for synthesis. Each sample was repeated three times.
Western Blot Assay
Total protein was extracted using protein lysis solution (Beyotime, Shanghai, China) according to the manufacturer’s instructions. Then Bicinchoninic Acid (BCA) protein concentration determination kit (Beyotime, Shanghai, China) was used to quantify the extracted protein. After adding sodium dodecyl sulfate (SDS)-loading buffer, it was placed in boiling water at 98°C for 5 min to denature. The sample was separated by 12% sodium dodecyl sulfate-polyacrylamide gel (SDS-PAGE). Then the protein was transferred to polyvinylidene fluoride (PVDF, Millipore, Bedford, USA) membrane by Western electrophoresis. The membrane was incubated in 5% skimmed dry milk for 2 h. After incubation, they were incubated overnight with primary antibody: Bcl-2 (1RV 1000, AF0060, Beyotime, Shanghai, China), Bax (1RV 1000, AF1270, Beyotime, Shanghai, China), caspase1 (1RV 1000, AF1681, Beyotime, Shanghai, China), IL-1 β (1RV 1000, AF7209, Beyotime, Shanghai, China), NLRP3 (1RV 1000, AF2155, Beyotime, Shanghai, China) and GAPDH (1RV 1000, AF1186, Beyotime, Shanghai, China). The corresponding second antibody was horseradish peroxidase labeled goat anti-rabbit IgG (H+L) (A0208,1VO1000, Beyotime, Shanghai, China). Finally, the PVDF films were treated with Clarity Western ECL substrate (1705061 USA) and observed by chemiluminescence imaging system (Bio-Rad, USA).
Cell Viability
LPS-induced HUVECs were obtained. Pancreatin digested and resuspended as a single-cell suspension. Five thousand cells/well were inoculated into 96-well plates after counting. Then cultured in cell incubator for 24 h. Continue to culture after transfection of plasmid. They were taken out at 24h and 48h, respectively. About 10 μL cell counting kit-8 (CCK-8) solution (C0038, Beyotime, Shanghai, China) was added to each well and incubated for 3 h. Finally, the absorbance value at OD450 was measured by automatic microporous instrument. Three replicates per well.
Wound Healing Assay
LPS-induced HUVECs were obtained. 5×10⁵ cells/well were inoculated into 24-well plates after counting and then cultured in cell incubator for 24 h. After transfection of plasmid, the cells were cultured for 6 h. The transfected cells were collected again to prepare single-cell suspension. 5×10⁵ cells/well were inoculated into 24-well plates after counting. Then cultured in cell incubator for 24 h. 200 μL sterile pipette end was used to scratch monolayer cells to form scratches and remove suspended cells. Serum-free medium was added to each well and cultured in the incubator for 48 h. The cell migration area was observed and photographed, and the differences in cell healing ability were evaluated according to the migration area.
Detection of Reactive Oxygen Species and Superoxide Dismutase
Reactive Oxygen Species Assay Kit (Beyotime, Shanghai, China) was used to detect reactive oxygen species (ROS) levels in transfected or LPS-treated HUVECs, according to the manufacturer’s instructions. Finally, the fluorescence value was detected by full-function enzyme marker of 488nm excitation wavelength and 525 nm emission wavelength.
Total Superoxide Dismutase Assay Kit with WST-8 (Beyotime, Shanghai, China) was used to detect the level of superoxide dismutase (SOD) in transfected or LPS-treated HUVECs according to the manufacturer’s instructions. Finally, the absorption value at 450 nm was detected by full-function enzyme marker.
Statistical Analysis
Statistical analysis was performed using GraphPad Prism 8 and SPSS 26. All data were expressed as mean ± standard deviation (SD). Statistical evaluation was performed using the student t-test between two groups. P <0.05 was considered to be statistically significant.
Results
Transcriptome Analysis of Sepsis
After quality filtering of transcriptome sequencing raw data,125.581 Gb Clean Data was obtained, the average data amount of each sample was 15.698 Gb, the percentage of Q30 bases was over 93.89%, GC content was between 47.53% and 57.54%, and the alignment rate was between 96.355% and 97.986%. Through statistics, we found that the obtained lncRNAs were divided into 10 types (Figure 1A), among which antisense (36.05%) and lincRNA (33.76%) were the main types. Through principal component analysis (PCA) based on lncRNA expression data, we can clearly find that the two groups could be significantly differentiated into two parts (Figure 1B). The same was true for mRNA analysis (Figure 1C). These results indicated that the transcriptome profiles were significantly altered in the control and sepsis groups.
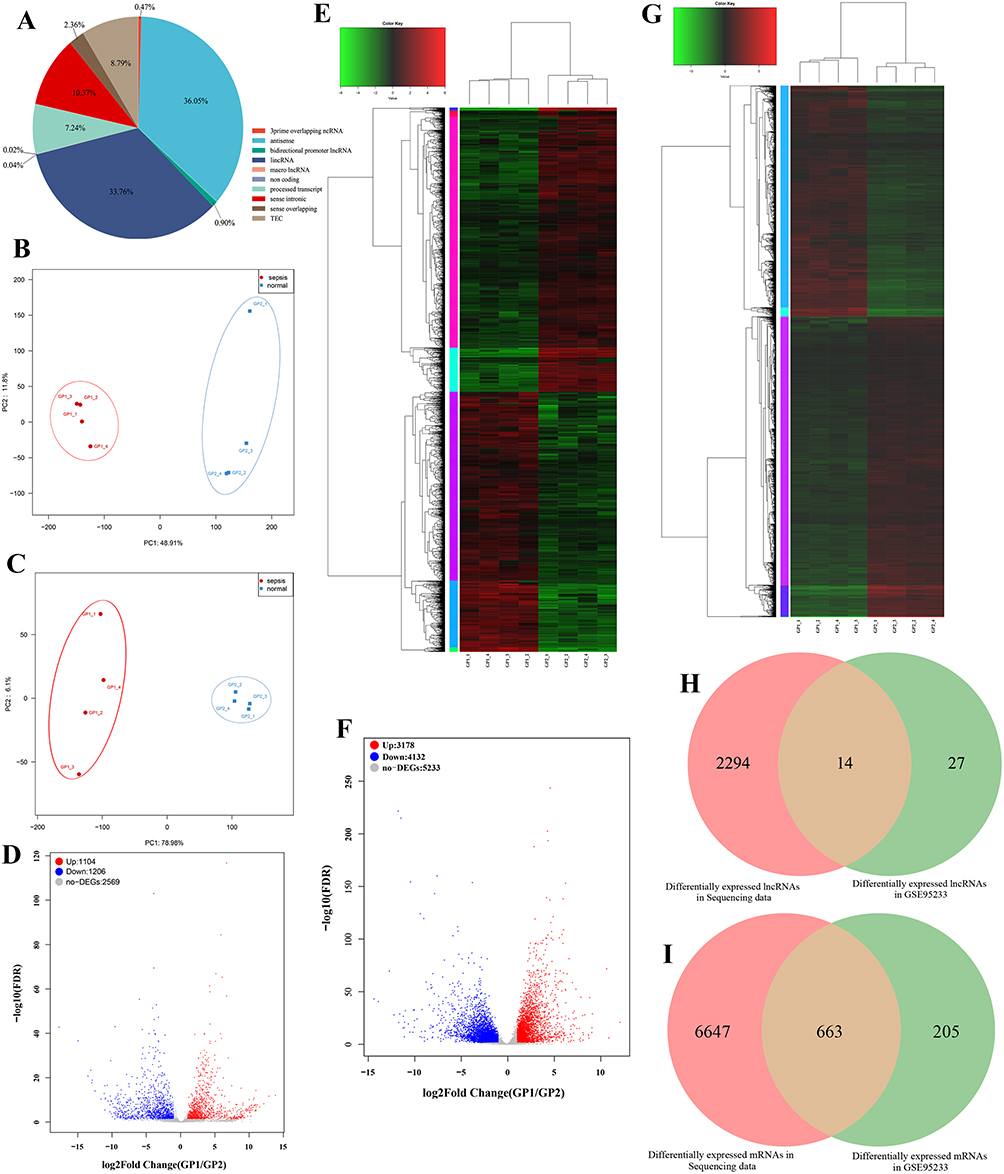 |
Figure 1 (A) The type and proportion of lncRNA identified in transcriptome sequencing data. (B) PCA principal component analysis based on lncRNA expression in sepsis group and control group. (C) PCA principal component analysis based on mRNA expression in sepsis group and control group. (D) Volcano plot shows the differential expression of lncRNAs between sepsis group and control group. GP1 represents the sepsis group. GP2 represents the normal group. (E) Heat map shows the differential expression of lncRNAs between sepsis group and control group. GP1 represents the sepsis group. GP2 represents the normal group. (F) Volcano plot shows the differential expression of mRNAs between sepsis group and control group. GP1 represents the sepsis group. GP2 represents the normal group. (G) Heat map shows the differential expression of mRNAs between sepsis group and control group. GP1 represents the sepsis group. GP2 represents the normal group. (H) Venn shows the common differential expression lncRNAs between sequencing data and GSE95233. (I) Venn shows the common differential expression mRNAs between sequencing data and GSE95233. |
Screening of Differentially Expressed lncRNAs and Differentially Expressed mRNAs
A total of 2310 differentially expressed lncRNAs (DElncs) were screened, of which 1104 were up-regulated and 1206 were down-regulated. Likewise, we obtained 7310 differentially expressed mRNAs (DEMs), of which 3178 were up-regulated and 4132 were down-regulated. The top 10 up- and down-DElncs and DEMs were exhibited in Table 1 and Table 2, respectively. The DElncs and DEMs between the two groups were displayed by volcano plot and heat map (Figure 1D–G). Using the same method, a total of 40 DElncs and 868 DEMs were obtained from GSE95233 (Figure S2). Subsequently, 14 overlapping DElncs and 663 overlapping DEMs between transcriptome sequencing difference analysis data and GSE95233 difference analysis data were obtained by Venn (Figure 1H and I).
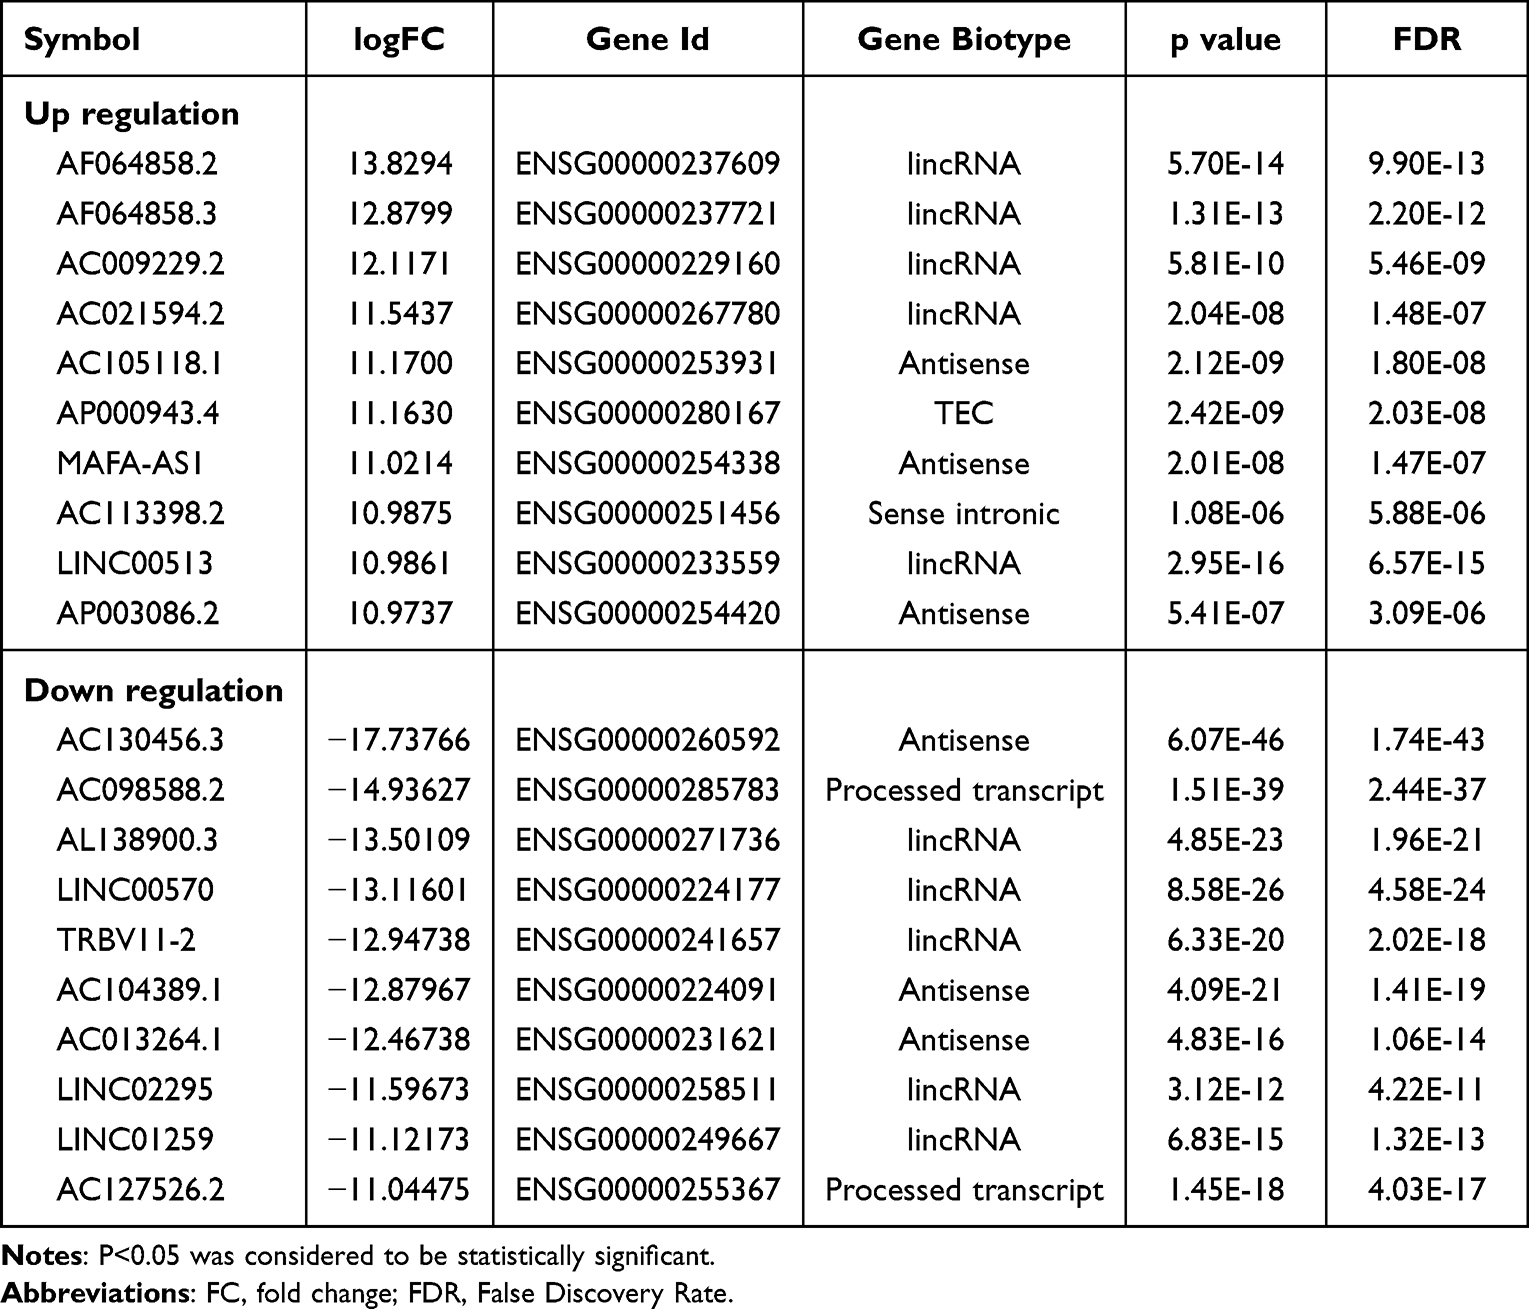 |
Table 1 Top 10 (Up- and Down-Regulated) of Differentially Expressed lncRNAs in Normal Bloods and Sepsis Bloods |
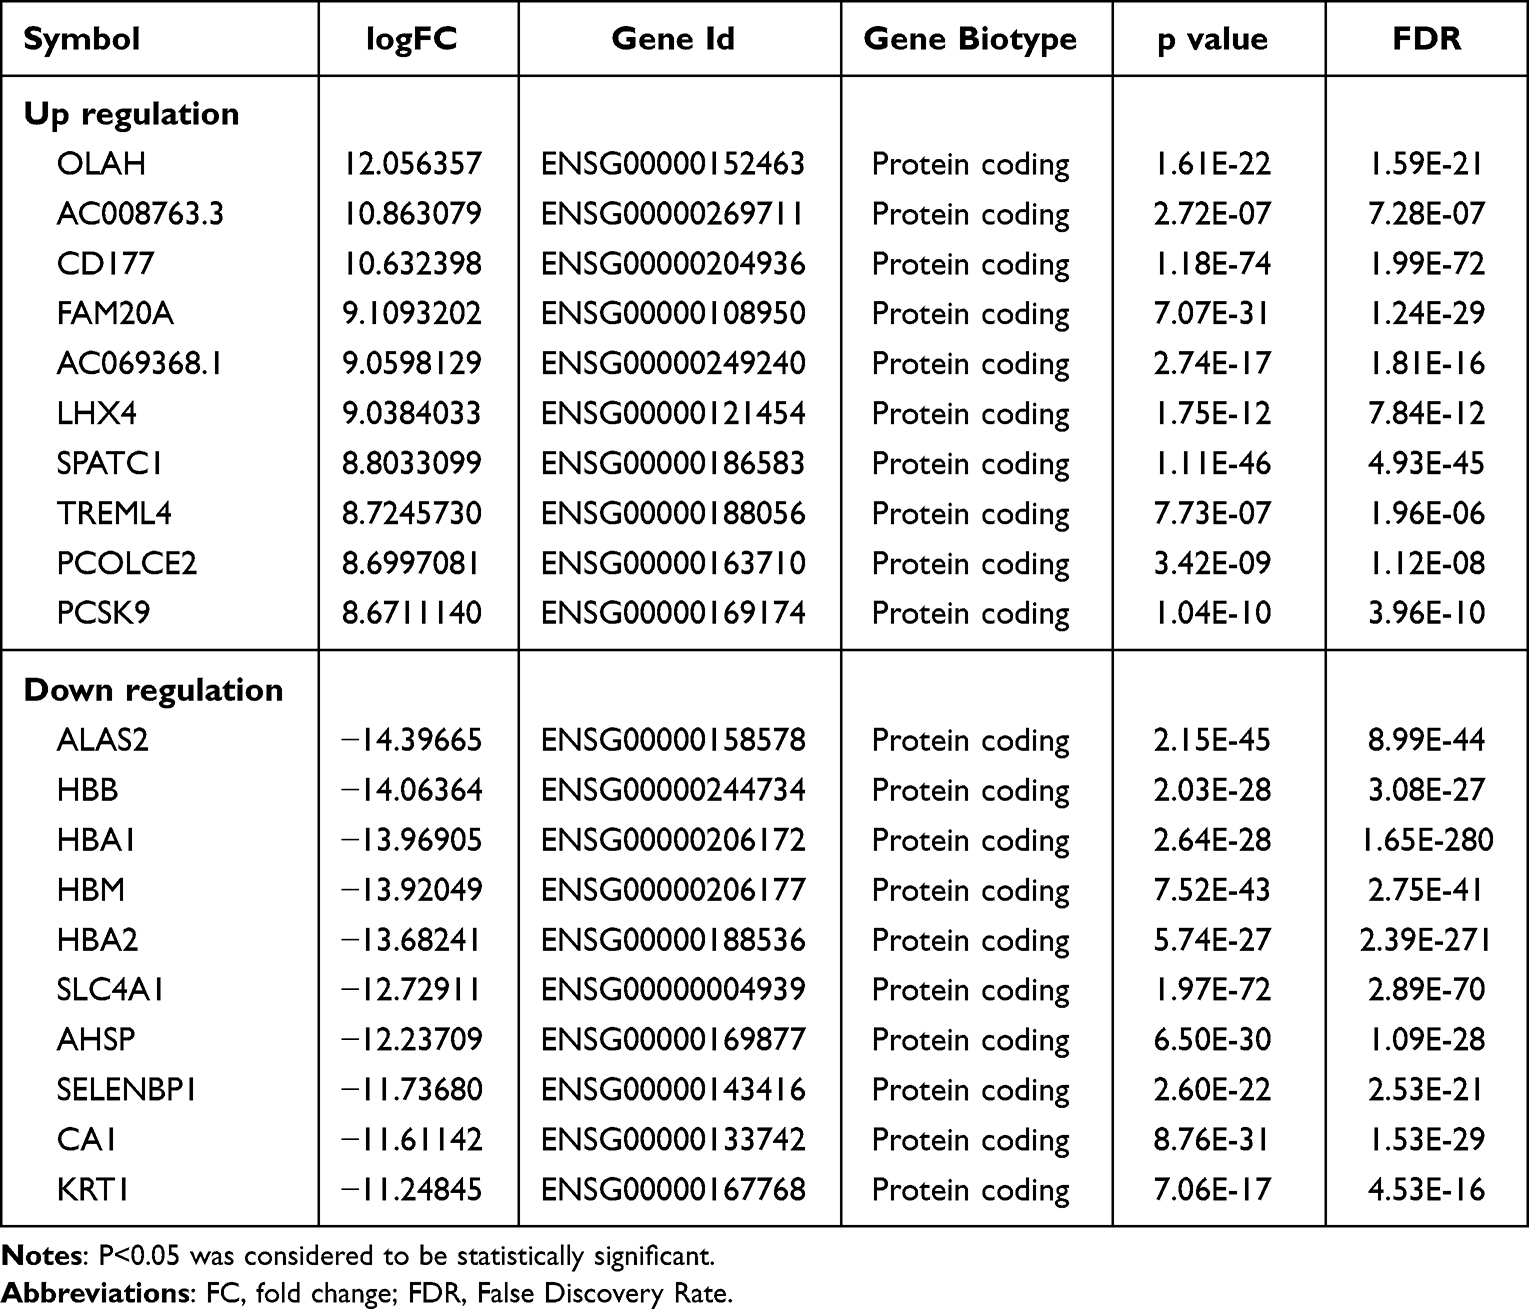 |
Table 2 Top 10 (Up- and Down-Regulated) of Differentially Expressed mRNAs in Normal Bloods and Sepsis Bloods |
Construction of lncRNA-mRNA Co-Expression Network and Functional Enrichment Analysis
According to the prediction criteria, a total of 3938 target genes of 14 overlapping were screened, of which 12 were Cis target genes. After overlapping with 663 differentially expressed mRNAs, 373 common mRNAs were obtained (Figure 2A). Subsequently, 14 overlapping DElncs and 373 common mRNAs were used to construct the lncRNA-mRNA co-expression network, including 387 nodes and 600 edges (Figure 2B).
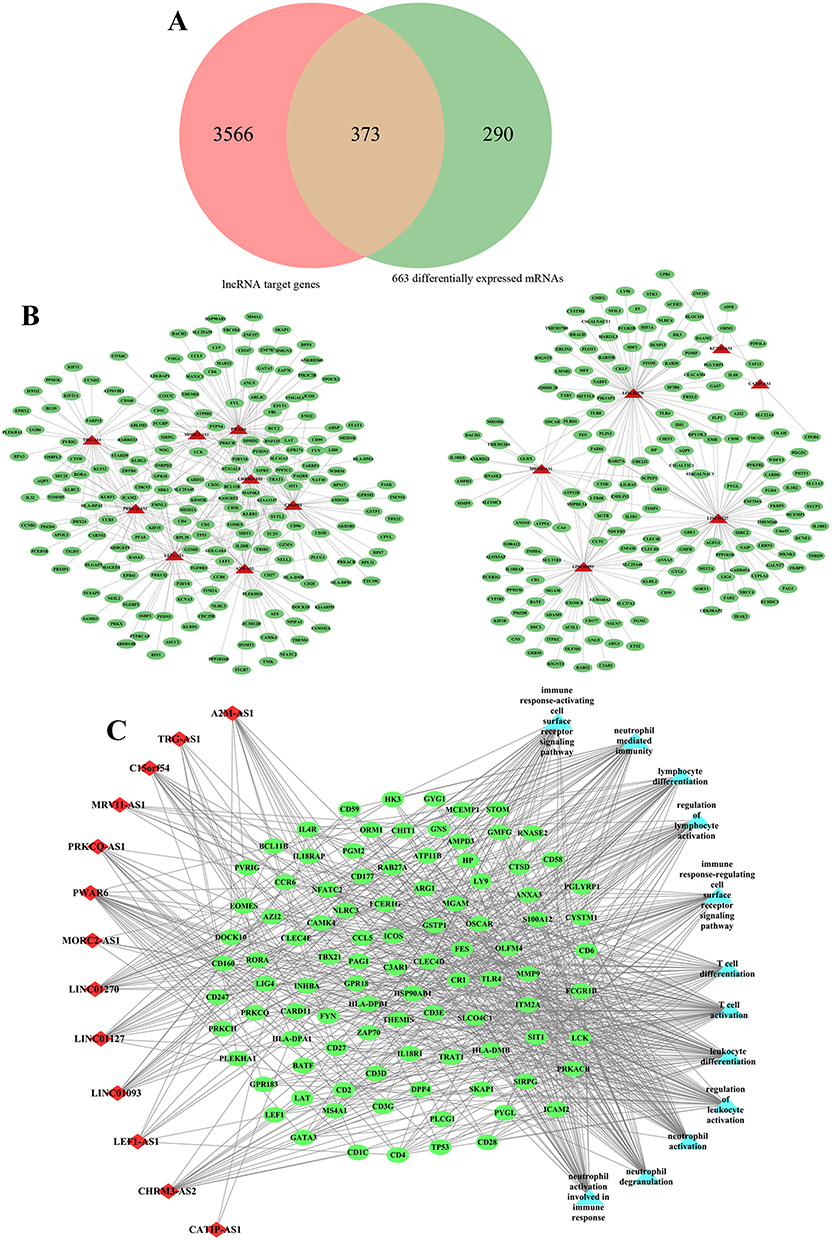 |
Figure 2 (A) Venn shows the common mRNAs between lncRNA target genes and differential expression mRNAs. (B) lncRNA-mRNA co-expression network. The green oval represents mRNAs. the red triangles represent lncRNAs. (C) lncRNA-mRNA-GO term co-expression network. The green oval represents mRNAs. the red diamonds represent lncRNAs. The light blue triangle represents GO terms. |
Furthermore, the functional enrichment analysis results of 373 common mRNAs showed that these mRNAs were enriched in immune cell-related functions, such as T cell activation, T cell complex and MHC protein complex. Among them, biological processes mainly include T cell activation, leukocyte differentiation, neutrophil activation and stress, lymphocyte differentiation, and cell surface receptor signaling pathway activation (Figure S3A). In the cellular component (CC), these mRNAs were mainly associated with T cell receptor complexes, immune synapses, plasma membrane receptor complexes, MHC Class II protein complexes, and ficolin-1-rich granules (Figure S3B). In addition, molecular function (MF) analysis showed that it was mainly involved in cytokine receptor regulation, MHC protein complex binding, cytokine regulation, pattern recognition receptor activity, and SH3/SH2 adapter activation (Figure S3C). KEGG enrichment analysis also revealed similar functional pathways, mainly involved in Th17/Th1/Th2 cell differentiation, PD-1 checkpoint pathway, T cell receptor signaling pathway, cell adhesion molecules (CAMs), antigen processing and presentation, and NF-kappa B signaling pathway (Figure S3D). Subsequently, we select the functional terms with more than 30 enriched genes and construct the lncRNA-mRNA-functional terms network was construct with the functional terms with more than 30 enriched genes, 14 overlapping DElncs and 373 common mRNAs (Figure 2C). Taken together, these results suggested that the 14 keys DElncs in sepsis played a potential role in regulating the expression of genes related to T cell activation and immune response function.
Weighted Gene Co-Expression Network Analysis of lncRNAs and mRNAs in Sepsis
WGCNA analysis was performed using GSE28750 as the genetic background. The results showed that the soft threshold power β of lncRNA was6, and the soft threshold power β of mRNA was 16, both of which were consistent with the scale-free network and had greater biological significance (Figure 3A and B). Then, the hierarchical clustering tree results showed that lncRNA consensus contains 8 modules (Figure S4A). The relationship between co-expression modules and sepsis was shown in Figure 3C. We found that the trend of genetic change in each module was reversed between the control group and sepsis. According to p-values and correlation values, brown module was selected as significant modules associated with sepsis, including 2 core lncRNAs. In the same, mRNA consensus identified 18 modules, in which the mediumorchid module was significantly correlated with sepsis, including 238 core mRNAs (Figure S4B), Figure 3D). By comparing the core module with lncRNAs and mRNAs in the lncRNA-mRNA co-expression network, one common key lncRNA (PRKCQ-AS1) and 67 common key mRNAs were obtained, including 12 PRKCQ-AS1 co-expressed mRNAs (AQP3, ICAM2, IL32, KDM2B, KLF12, OSBPL3, P2RY8, PCED1B, PRKCQ, PVRIG, RORA and SIRPG) (Figure 3E and F). GO and KEGG analysis showed that the biological functions of these mRNAs were mainly involved in immune system processes such as immune response activation and regulation, lymphocyte activation, cell adhesion and cell surface receptor signaling pathways (Figure 3G). KEGG was mainly enriched in Th17 cell differentiation, T cell receptor signaling pathway, NF-kappa B signaling pathway, circadian rhythm and water reabsorption regulation (Figure 3H).
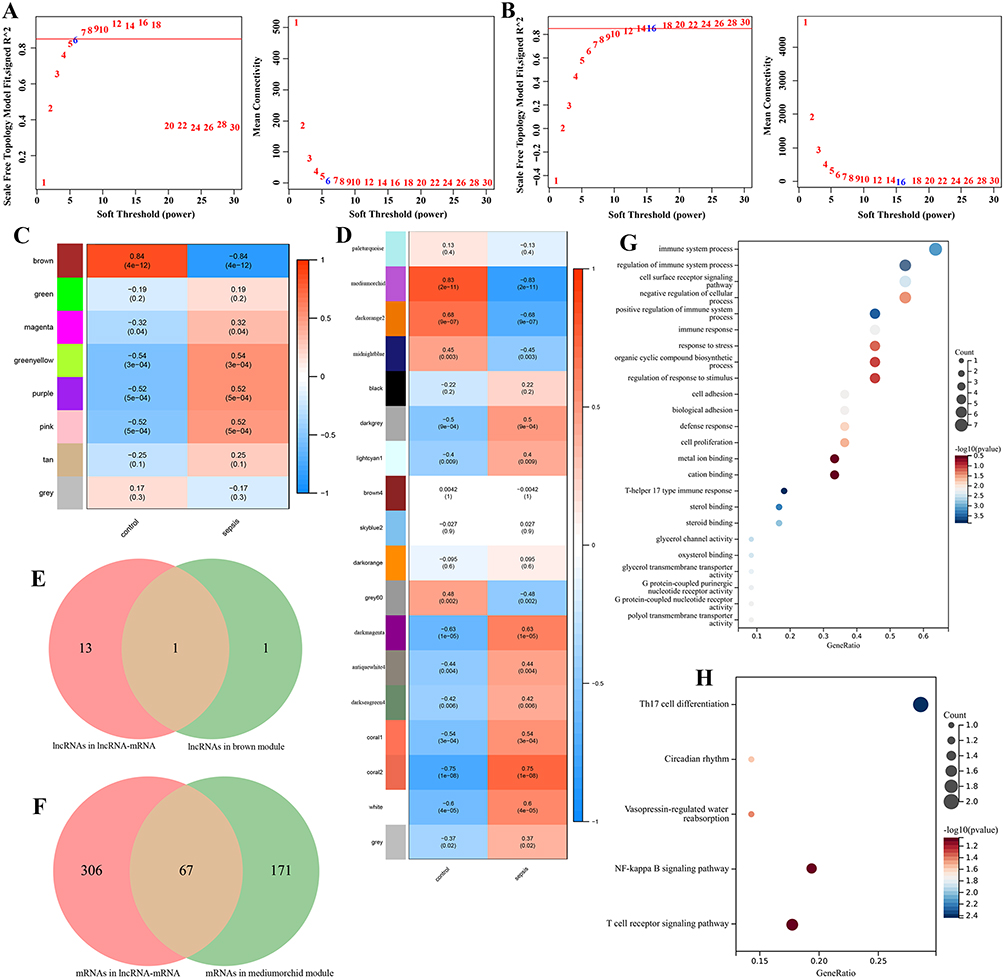 |
Figure 3 (A) lncRNA WGCNA soft threshold results, where the horizontal axis is soft threshold (power) and the vertical axis is the evaluation parameter of the scale-free network. (B) mRNA WGCNA sample clustering results (above) and soft threshold results (below), where the horizontal axis is soft threshold (power) and the vertical axis is the evaluation parameter of the scale-free network. (C) Correlation heat map of sepsis phenotype and control phenotype with each module of lncRNAs. The horizontal axis is the basic phenotype, the vertical axis is the module, the color indicates the correlation, and the text represents the correlation coefficient and significance p value. (D) Correlation heat map of sepsis phenotype and control phenotype with each module of mRNAs. The horizontal axis is the basic phenotype, the vertical axis is the module, the color indicates the correlation, and the text represents the correlation coefficient and significance p value. (E) Common lncRNAs between lncRNA-mRNA co-expression network and WGCNA key modules. (F) Common mRNAs between lncRNA-mRNA co-expression network and WGCNA key modules. (G) GO enrichment analysis of common mRNAs. The ordinate text indicates the name of GO. The x-coordinate is Gene Ratio. (H) KEGG enrichment analysis of common mRNAs. The ordinate text indicates the name of GO. The x-coordinate is gene Ratio. |
Gene Set Enrichment Analysis and Gene Set Variation Analysis
The above enrichment results were carried out by using cross genes. In order to avoid the one-sidedness of the results, we carried out GSEA on the whole GSE95233 and observed its enrichment in KEGG and HALLMARK. Figure 4A and B show the major biological processes of GSE95233 in KEGG and HALLMARK, respectively (p<0.05 and FDR<0.25). KEGG was mainly enriched in Oxidative phosphorylation, PPAR signaling pathway, Nicotinate and Nicotinamide metabolism, Natural killer cell mediated cytotoxicity, Wnt signaling pathway and T cell receptor signaling pathway. In HALLMARK analysis, GSE95233 was mainly involved in Reactive oxygen species pathway, Glycolysis, IL6 AK-STAT3 signaling, Wnt-β-catenin signaling, Adipogenesis and p53 pathway. These pathways were mainly involved in inflammation, oxidative stress, immunity, glycolysis and other similar roles. Subsequently, patients were divided into a high-expression group and a low-expression group according to the median expression of PRKCQ-AS1 for GSEA analysis (Figure 4C and D). The results showed that in KEGG and HALLMARK, the high-expression group involved abundant biological signal pathways, including Cell adhesion molecules cams, Antigen processing and presentation, T cell receptor signaling pathway, Natural killer cell mediated cytotoxicity, Wnt signaling pathway, Primary immunodeficiency. The low-expression group was mainly enriched in Cholesterol homeostasis, IL6 JAk-STAT3 signaling, Hypoxia and Xenobiotic metabolism.
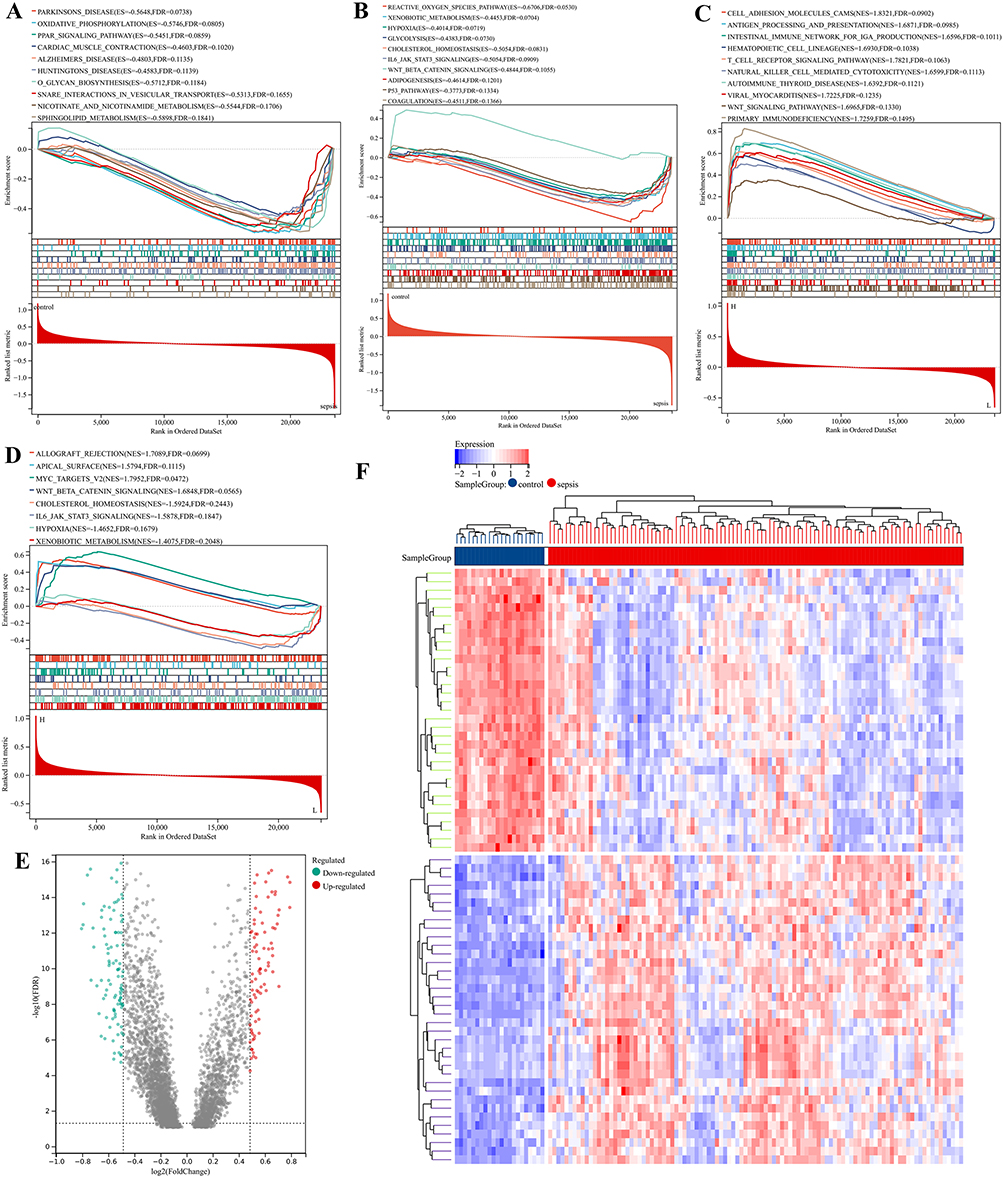 |
Figure 4 Gene Set Enrichment Analysis (GSEA) and Gene Set Variation Analysis (GSVA) enrichment analysis. (A) GSEA on the whole GSE95233 and observed its enrichment in KEGG set. (B) GSEA on the whole GSE95233 and observed its enrichment in HALLMARK set. (C) GSEA based on PRKCQ-AS1 expression in KEGG set. (D) GSEA based on PRKCQ-AS1 expression in HALLMARK set. (E) Volcano for differential GSVA enrichment analysis of PRKCQ-AS1 expression in sepsis and control groups. Green dots represent down regulated enrichment, and red dots represent up regulated enrichment. (F) The heat map shows the significant gene sets; blue is the control group, red is the sepsis group, the blue square represents low enrichment, and the red square represents high enrichment. |
Subsequently, GSVA analysis results of GSE95233 showed 196 differential gene sets between the sepsis group and the control group, including 90 up-regulated gene sets and 106 down-regulated gene sets. These differential gene sets were also involved in protein repair, antimicrobial proteins, glycolysis, and immune cell stress and response (Figure 4E and F and Table 3).
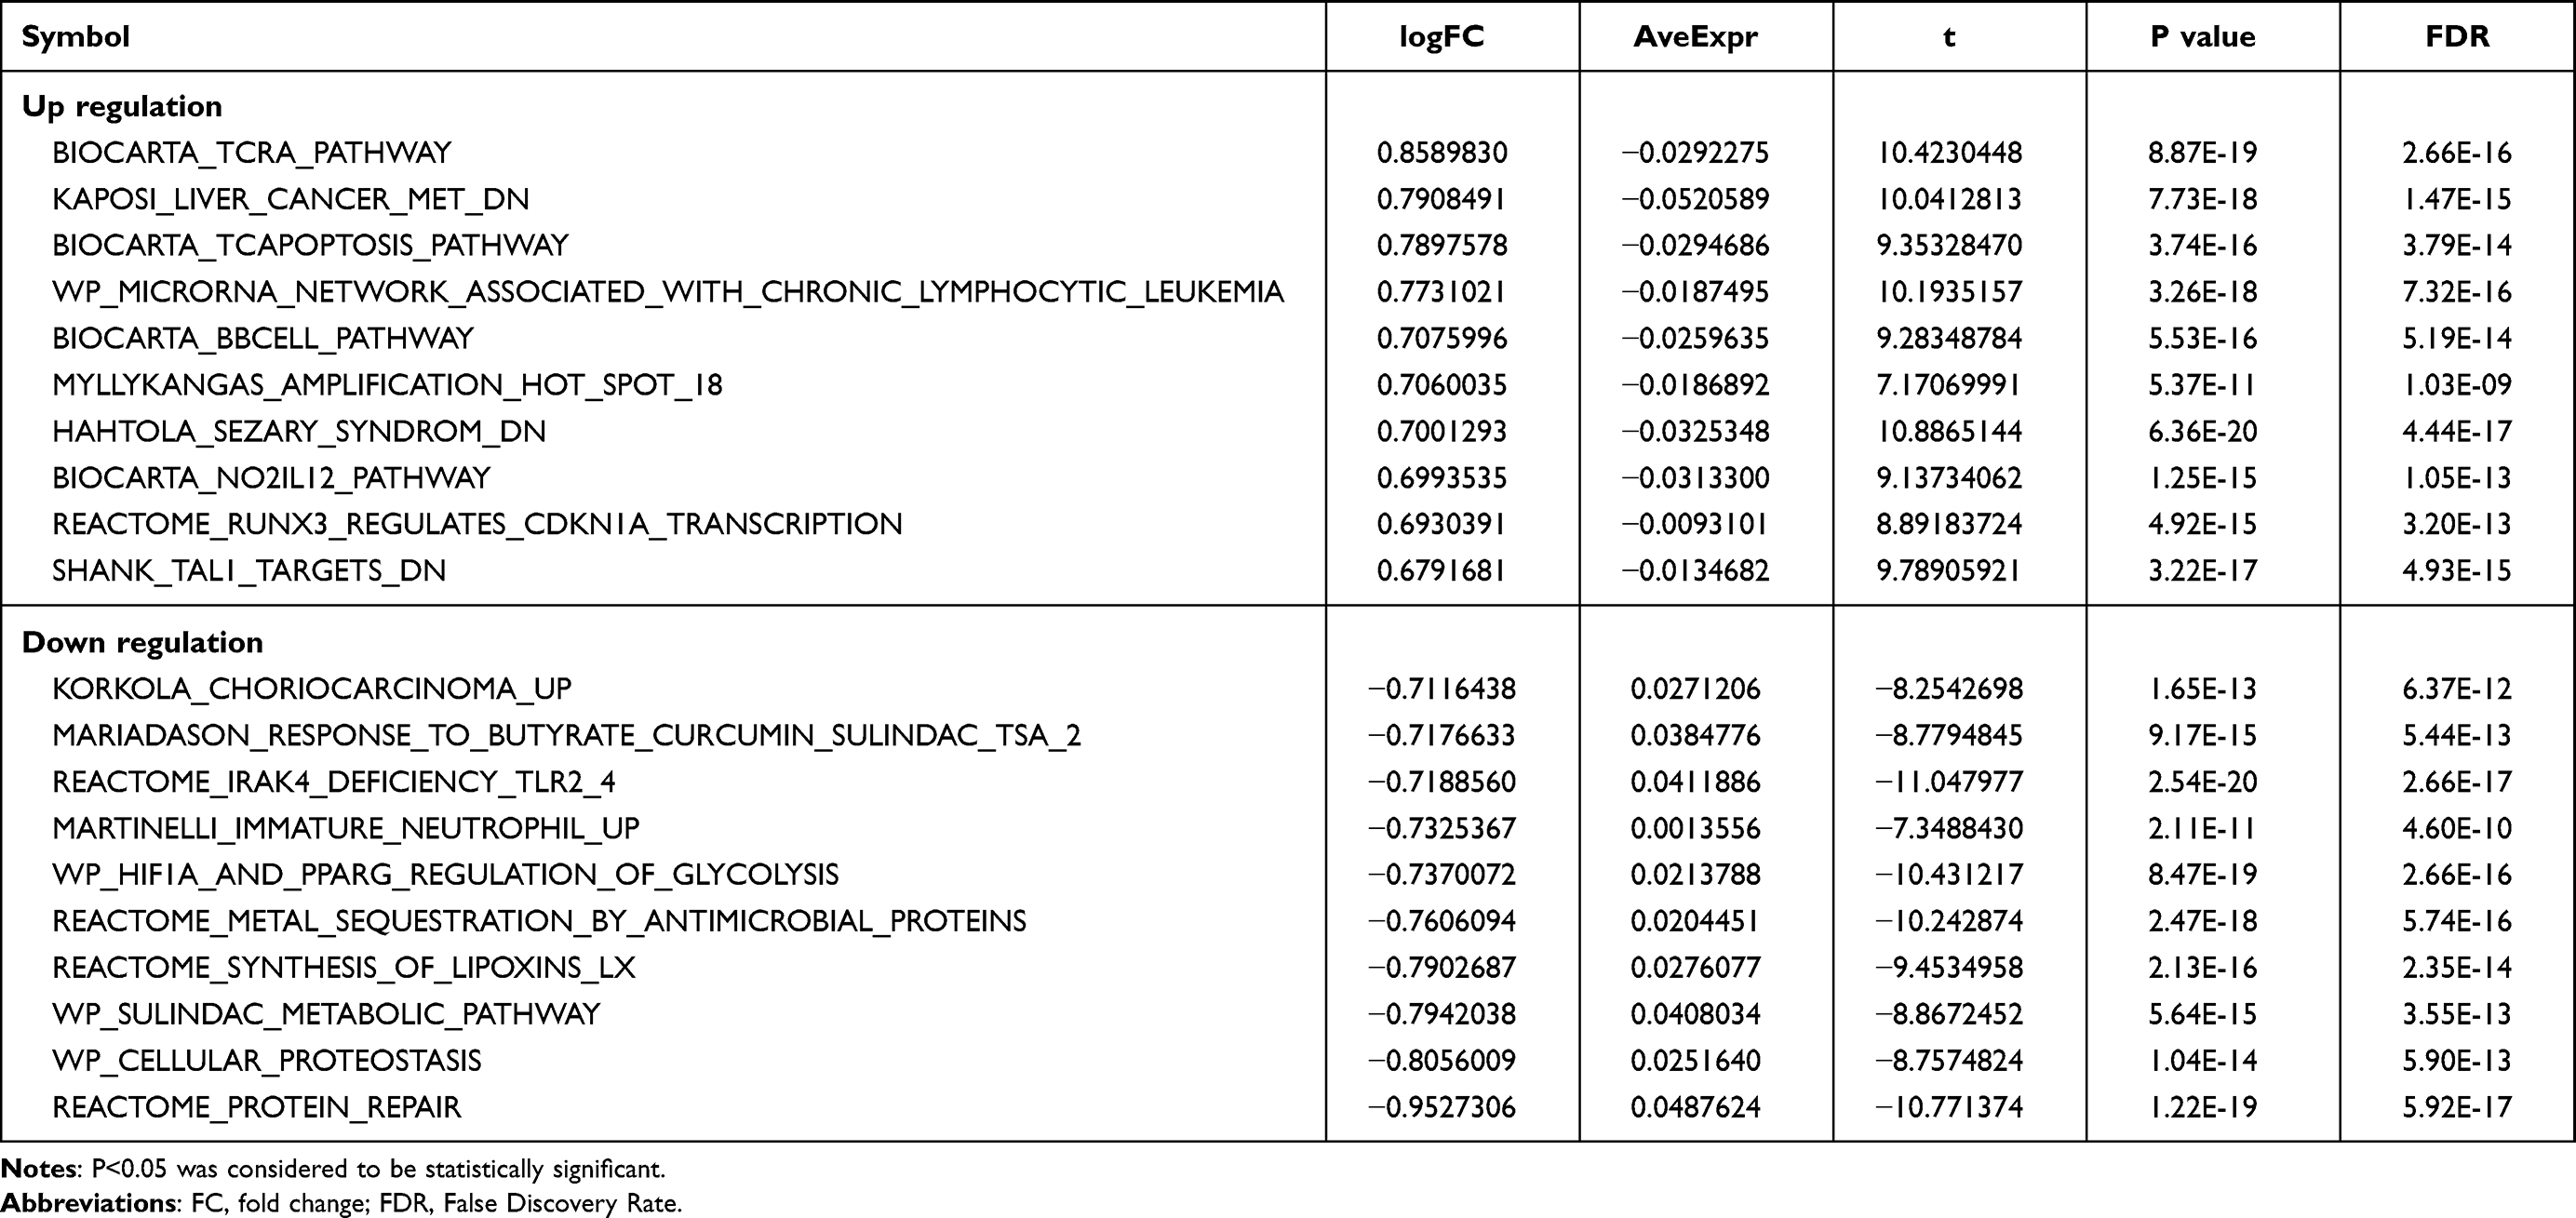 |
Table 3 GSVA Enrichment Analysis |
Immune Infiltration Analysis
To further confirm the correlation between PRKCQ-AS1 expression and immune cells, CIBERSORT algorithm was performed, and the results were shown in the bar chart (Figure 5A). PCA clustering results showed that there were differences in immune cell infiltration between the sepsis and control group, which could be well distinguished between the two groups (Figure 5B). The violin plot of immune cell infiltration showed that Plasma cells, T cells gamma delta, Monocytes, Eosinophils, and Neutrophils were infiltrate in the sepsis group and were higher than in the control samples. B cells naive, T cells CD8, NK cells resting, Dendritic cells resting and Mast cells resting had low infiltration (Figure 5C). Correlation analysis between PRKCQ-AS1 and immune cells showed that 12 kinds of immune cells had significant correlation with PRKCQ-AS1 expression. B cells native, T cells CD8, T cells CD4 native, T cells CD4 memory resting, NK cells resting, Dendritic cells resting, Mast cells resting was negatively correlated with the expression of PRKCQ-AS1. Plasma cells, T cells follicular helper, T cells gamma delta, Mast cells activated, Neutrophils and PRKCQ-AS1 expressions were positively correlated (Figure 5D). The correlation of immune cell scores between high-expression group and low-expression group showed that different immune cells showed differently in the two groups. Among them, B cells native, Plasma cells, T cells CD8, T cells CD4 memory resting, T cells gamma delta, NK cells resting, Dendritic cells resting, Mast cells resting, Mast cells activated and Neutrophils were significantly different (Figure 5E and F). These results further supported the possibility that PRKCQ-AS1 levels may influence the immune activity of immune cells.
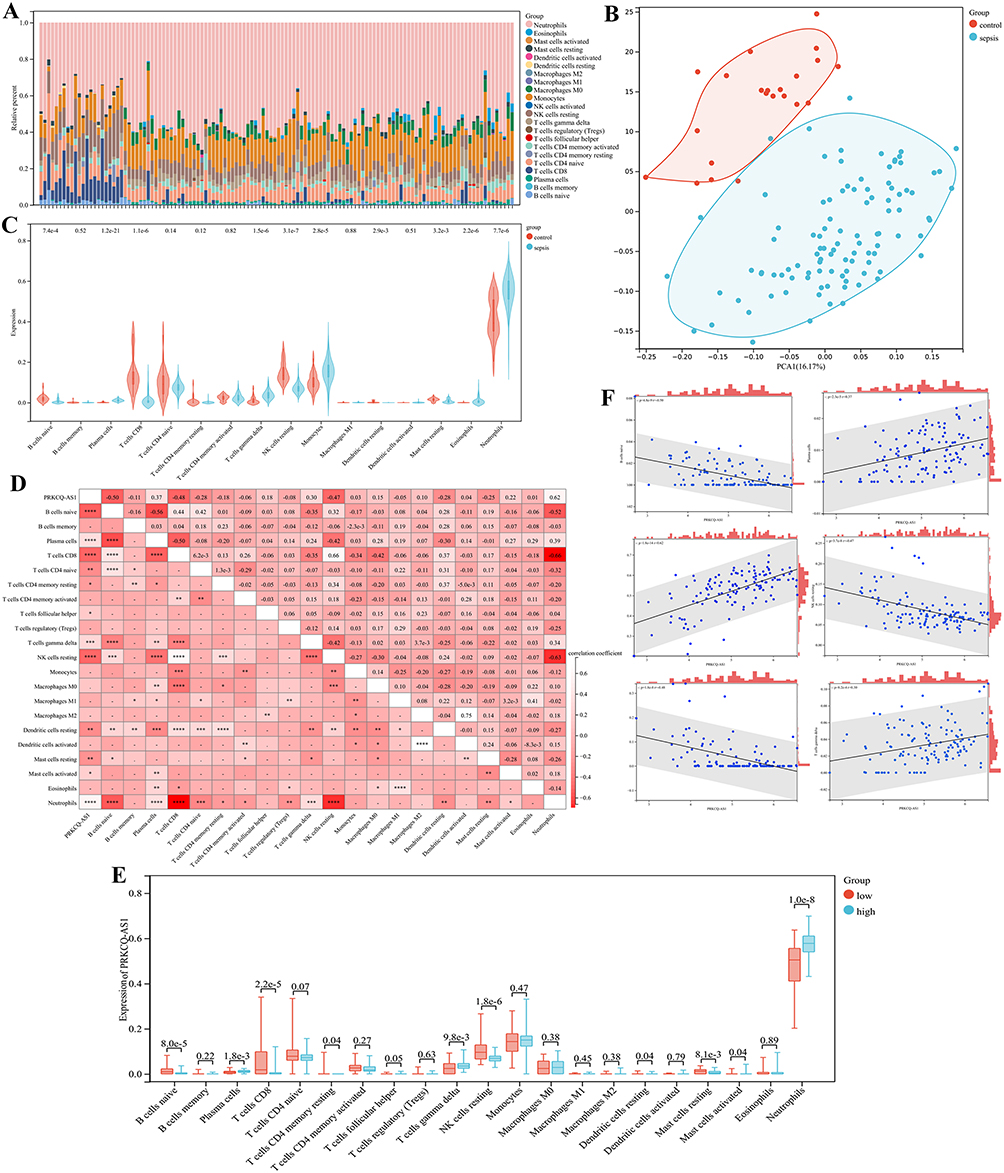 |
Figure 5 Immune cell infiltration and correlational analysis. (A) Barplot shows the proportion of 22 immune cells in sepsis samples. (B) PCA analysis of immune infiltration background dataset. (C) Immune cells are expressed at different group of sepsis (sepsis vs control) as violin chart. Turquoise is the sepsis group, and red is the control group. (D) The correlation heat map of 22 kinds of infiltrated immune cells and PRKCQ-AS1 expression. Light red means positive correlation, and red means negative correlation. ****p <0.0001, ***p <0.001, ** p<0.01, *p<0.05 (E) Immune cells are expressed at different levels of PRKCQ-AS1 (low vs high) as box diagram. Turquoise is the low expression group, and red is the low expression group. (F) The correlation of infiltrated immune cells (Plasma cells, T cells gamma delta, NK cells resting, T cells CD8, B cells native and Neutrophils) and PRKCQ-AS1 expression. |
Validation and Evaluation of PRKCQ-AS1
PRKCQ-AS1 expression profile in GSE95233 and GSE28750 datasets were obtained, respectively, ROC analysis results showed that the AUC values of PRKCQ-AS1 in the two datasets were 0.88 and 0.96, respectively, indicating that PRKCQ-AS1 may have a certain predictive effect on sepsis (Figure 6A and B). Kaplan–Meier curve showed that PRKCQ-AS1 was significantly correlated with the survival of sepsis patients (logrank p<0.05) (Figure 6C). Univariate and multivariate Cox regression analysis results showed that PRKCQ-AS1 may be an independent prognostic factor for sepsis patients (Figure 6D and E). Moreover, Pearson correlation analysis showed that PRKCQ-AS1 was related to gender (p=0.049). In order to explore the predictability of PRKCQ-AS1 and clinical factors for survival, a nomogram was established based on multivariate results (Figure 6F). C-index value was 0.81, indicating the predictability of nomogram. And calibration curve, ROC analysis and Kaplan–Meier analysis further reflect the predictability and reliability of nomogram (Figure 6G–I). These results also indicated that PRKCQ-AS1 had the potential of prognostic markers for sepsis patients.
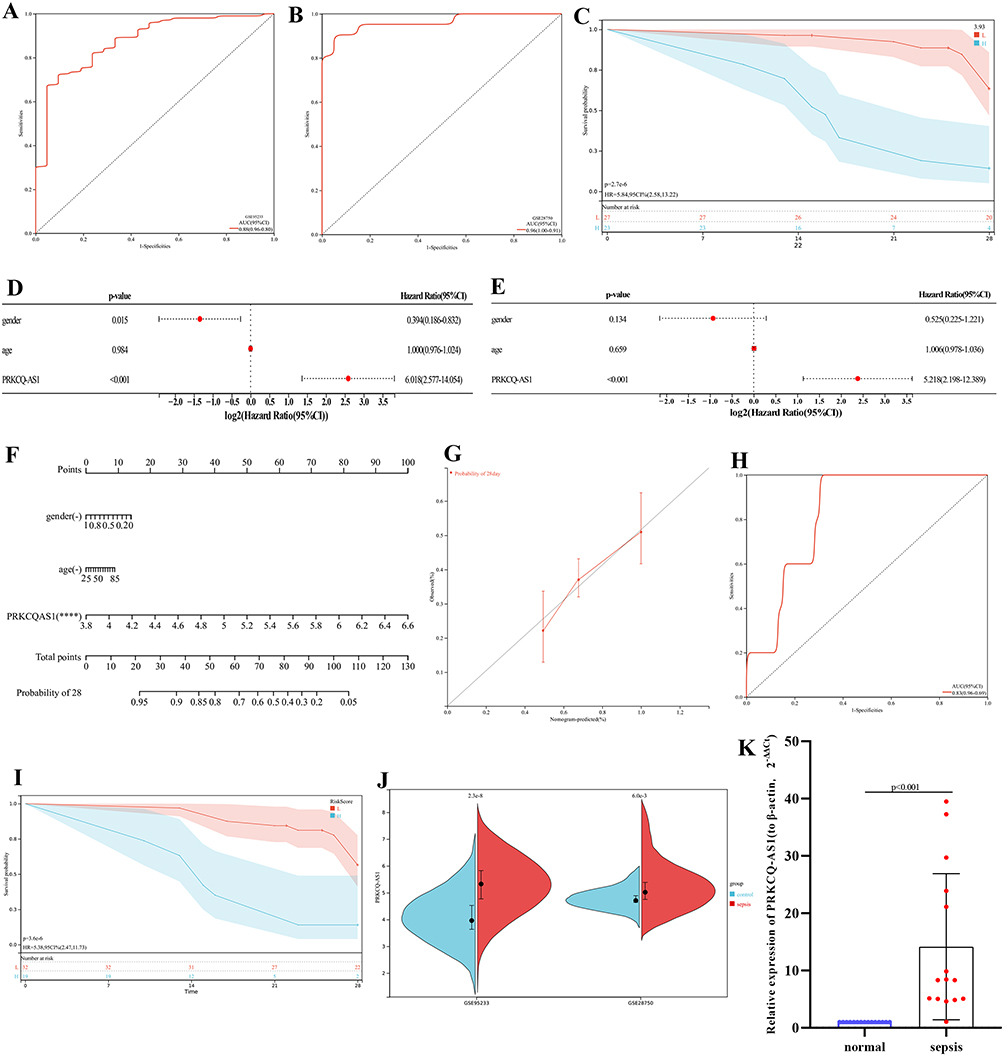 |
Figure 6 (A) ROC analysis of PRKCQ-AS1based on GSE95233. (B) ROC analysis of PRKCQ-AS1based on GSE28750. (C) PRKCQ-AS1 survival analysis in sepsis patients. The turquoise line represents high expression group, and the red line represents low expression group. The turquoise shading and red shading represent 95% confidence interval. (D) Forest maps show univariate Cox analysis results. (E) Forest maps show multivariate Cox analysis results. (F) A nomogram of 28-day survival prediction of sepsis patients constructed with PRKCQ-AS1 expression, age and gender. ****p <0.0001. (G) The calibration curve corresponding to the nomogram. (H) The ROC analysis corresponding to the nomogram. (I) Kaplan–Meier curve corresponding to the nomogram. The turquoise line represents high expression group, and the red line represents low expression group. The turquoise shading and red shading represent 95% confidence interval. (J) PRKCQ-AS1 expression in GSE95233 and GSE28750. (K) PRKCQ-AS1 expression in 15 sepsis samples and 15 control samples by RT-qPCR. The expression level of actin was used as an internal reference for PRKCQ-AS1. The data are shown as the mean ± standard deviation. |
To verify the expression trend of PRKCQ-AS1GSE95233 and GSE28750 were used as external data for validation. As shown in Figure 6J, PRKCQ-AS1 expression was up-regulated in the two datasets, consistent with transcriptome sequencing data. Subsequently, RT-qPCR results showed that PRKCQ-AS1 was also upregulated in sepsis patients, which was consistent with the results of bioinformatics analysis as shown in Figure 6K.
PRKCQ-AS1 Contributes to Sepsis Model Cell (LPS-Induced HUVECs) Proliferation, Apoptosis, Migration, Inflammatory Response and Oxidative Stress
Firstly, cell activity results showed that different concentrations LPS significantly inhibited the viability of HUVECs cell, and the IC50 value was 3.011 μg/mL by fitting curve (Figure 7A). In addition, the treatment of LPS promoted the expression of PRKCQ-AS1 in HUVECs (Figure 7B), which verified that the expression trend of PRKCQ-AS1 was consistent with the results of bioinformatics analysis and transcriptome sequencing data. Fluorescence microscope observation and qPCR results showed that PRKCQ-AS1 plasmid was successfully transfected into the cells and interfered with the expression of PRKCQ-AS1 (Figure S5). CCK8 results showed that overexpression of PRKCQ-AS1 significantly inhibited cell proliferation. In contrast, silencing PRKCQ-AS1 significantly promoted cell proliferation (Figure 7C). The result trend of wound healing assay was consistent with CCK8. Si-PRKCQ-AS1 promoted cell migration. Increased expression of PRKCQ-AS1 showed the opposite result, and cell mobility was significantly lower than that of the control group (Figure 7D and E). In addition, qPCR and western results showed that si-PRKCQ-AS1 decreased the expression levels of Bax, caspase1, IL-1β and NLRP3, and increased the expression levels of Bcl-2. The results of overexpression of PRKCQ-AS1 were reversed (Figure 8A–K). These results suggested that PRKCQ-AS1 could promote apoptosis and inflammation. As shown in Figure 8L and M, increasing the expression of PRKCQ-AS1 significantly increased the ROS content, while significantly reduced the SOD production. When PRKCQ-AS1 was knocked out, SOD content increased significantly and ROS content decreased. These results suggested that PRKCQ-AS1 could inhibit the activity of sepsis model cells and induce apoptosis, inflammation and oxidative stress.
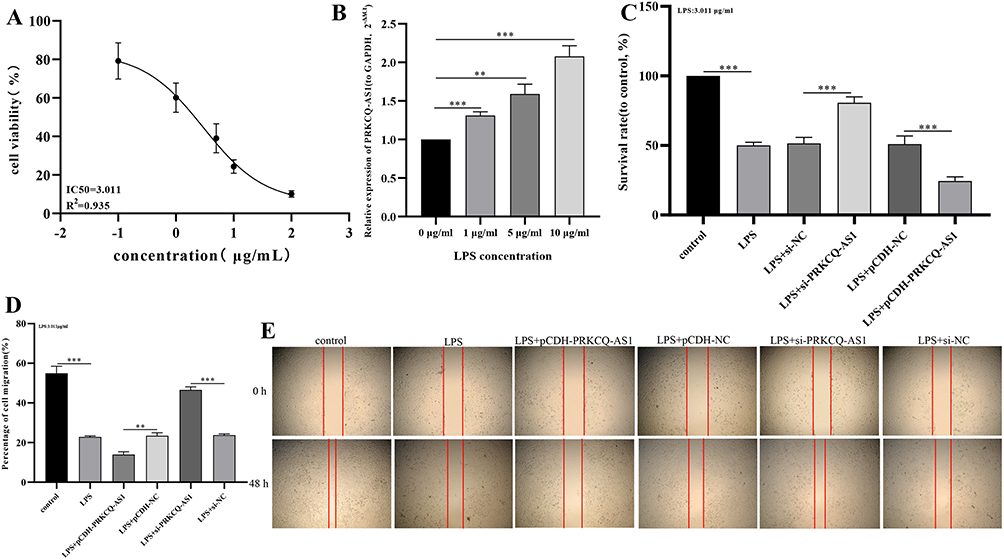 |
Figure 7 (A) Fitting curve of the effect of LPS on HUVECs activity. (B) Effects of LPS concentration on PRKCQ-AS1 expression in HUVECs by RT-qPCR. The expression level of GAPDH was used as an internal reference for PRKCQ-AS1. The data are shown as the mean ± standard deviation. ***p <0.001. **p<0.01. (C) The effects of PRKCQ-AS1 knockdown or overexpression on the vitality of sepsis-related cell (LPS-induced HUVECs) measured using the CCK-8 assay. The data are shown as the mean ± standard deviation. ***p < 0.001. (D and E) The effects of PRKCQ-AS1 knockdown or overexpression on the migration of sepsis-related cell (LPS-induced HUVECs) measured using the wound healing assay. The data are shown as the mean ± standard deviation. ***p < 0.001. **p < 0.01. |
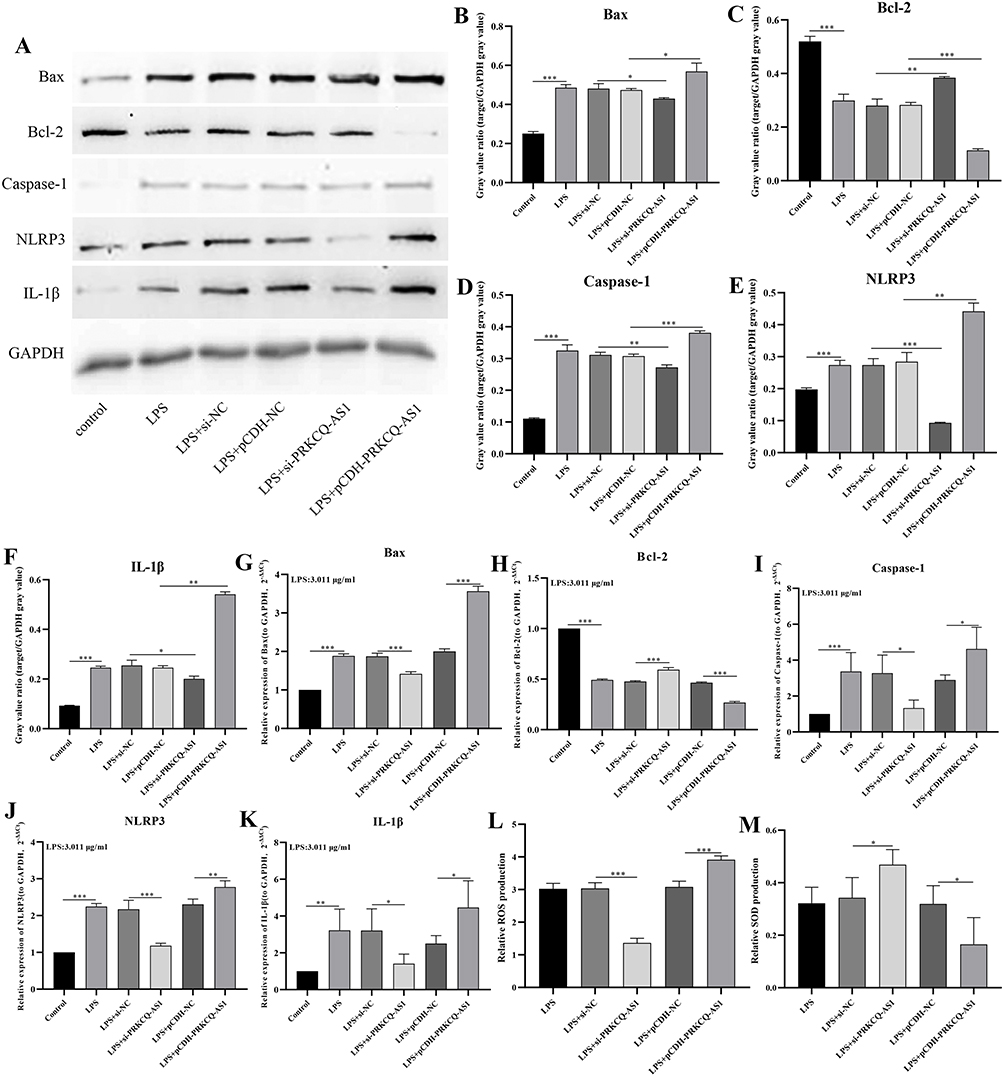 |
Figure 8 (A–F) Effects of PRKCQ-AS1 overexpression or knockout on protein expression levels of Bax (A and B), Bcl-2(A and C), caspase 1(A and D), NLRP3(A and E) and IL-1β (A and F) in the sepsis-related cell (LPS-induced HUVECs) by western bolt. ***p < 0.001.** p < 0.01. *p < 0.05.(G–K) Effects of PRKCQ-AS1 overexpression or knockout on expression levels of Bax (G), Bcl-2 (H), caspase 1 (I), NLRP3 (J) and IL-1β (K) in the sepsis-related cell (LPS-induced HUVECs) by RT-qPCR. The expression level of GAPDH was used as an internal reference for PRKCQ-AS1. The data are shown as the mean ± standard deviation. ***p<0.001. ** p<0.01. *p < 0.05.(L and M) Effects of PRKCQ-AS1 overexpression or knockout on ROS (L) and SOD (M) levels in the sepsis-related cell (LPS-induced HUVECs) by commercial kit. The data are shown as the mean ± standard deviation. ***p<0.001. *p < 0.05. |
Discussion
In this study, 2310 DElncs and 7310 DEMs were obtained by transcriptome sequencing. PCA results based on the expression levels of lncRNAs showed that the sepsis group and control group could be well distinguished, suggesting that lncRNAs may have the potential as a diagnostic biomarker of sepsis. It has been reported that lncRNA has a mechanism to directly regulate genes through cis- or trans-regulation.21 Therefore, we constructed the lncRNA-mRNA co-expression network, including 14 lncRNAs and 373 mRNAs. Enrichment analysis showed that these mRNAs were mainly involved in inflammatory and immune response. These results confirm that sepsis was a regulatory process of immune response. Subsequently, immune infiltration analysis, GSEA and GSVA results showed that the sepsis patients had high immune cell infiltration, and there were obvious differences, such as T cells, B cells, NK cells and Monocytes. And there were immune-related differential gene sets between sepsis patients and control group. All these further confirmed that immune response played an important role in the sepsis process. In addition, we obtained the key lncRNA PRKCQ-AS1 and 67 common key mRNAs (including 12 PRKCQ-AS1-targeted mRNAs) by WGCNA. Functional enrichment showed that these mRNAs were involved in immune response. Immune infiltrate analysis and GSEA results also showed that the expression of PRKCQ-AS1 was correlated with T cells, B cells, and Monocytes, which suggested that PRKCQ-AS1 might be a lncRNAs involved in immune regulation, which were consistent with literature reports.22,23
Protein kinase C theta antisense RNA 1(PRKCQ-AS1) was encoded by PRKCQ host gene and played a crucial role in T cell activation, and NF-κB transcription factor was its main target.24 It was reported that PRKCQ-AS1 was overexpressed in CRC tissues, which was related to the poor prognosis of CRC patients. Inhibition of PRKCQ-AS1 expression inhibits the proliferation and migration of colorectal cancer cells by regulating the miR-1287-5p/YBX1 axis.25 Some researchers have also reported that the low expression of PRKCQ-AS1 may further inhibit the IL-6/STAT3 pathway through up-regulation of miR-143-3p, thereby inhibiting the proliferation, migration and invasion of liver cancer cells and inducing cell apoptosis.26 Zhao et al reported that PRKCQ-AS1 was an immune-related lncRNA in periodontal tissues, which can regulate its inflammation and immune response through the NF-κB pathway.24 Li et al also found that PRKCQ-AS1 was an immune-related prognostic factor for glioblastoma.27 All these further confirmed the results that PRKCQ-AS1 was involved in the immune reaction process. However, although there have been a few studies of PRKCQ-AS1 in sepsis, they are all bioinformatics analysis data based on public datasets.22,23 Subsequently, we analyzed the clinical significance of PRKCQ-AS1 in sepsis and investigated its correlation with clinical features. In particular, it relates to the diagnostic potential of disease severity and prognosis. Kaplan–Meier curve, ROC analysis and Cox regression analysis showed that the expression level of PRKCQ-AS1 was correlated with the survival prognosis of sepsis patients and was an independent prognostic factor of sepsis patients with certain diagnostic and prognostic value. The constructed nomogram further corroborates the claim. Calibration curve, risk survival curve and ROC verified the accuracy and stability of nomogram. Moreover, univariate Cox logistic regression analysis result, except PRKCQ-AS1, showed that gender was also associated with the development of sepsis. It has been reported that there are differences in immune response to infection between women and men, such as the expression of pattern recognition receptors in innate immune response and the functional response of phagocytes and antigen presenting cells.28–30 However, Cox multivariate regression and nomogram analysis showed that gender had no statistical significance in the prognosis of sepsis. PRKCQ-AS1 as an immune-related factor in the progression of sepsis, Pearson correlation analysis showed that PRKCQ-AS1 was related to gender (p=0.049), indicating that factor mediating factors may interfere with the regulation of sepsis by PRKCQ-AS1, such as sex hormones. These results suggested that PRKCQ-AS1 was not only an immune-related factor, but also a prognostic biomarker. And it may also be a gender mediated regulatory factor. These needed to be further evaluated and studied using more clinical samples and advanced diagnostic methods in order to propose their clinical value.
To better understand the role of PRKCQ-AS1 in sepsis, we conducted a series of experiments. Firstly, we detected that PRKCQ-AS1 was significantly up-regulated in clinical and cell samples by RT-qPCR, which was consistent with the results of sequencing data and bioinformatics analysis. And in LPS-induced sepsis cells, its expression increased with the increase of LPS concentration, indicating that PRKCQ-AS1 may be involved in the deterioration of sepsis and mediate the occurrence and development of sepsis. Cell function experiments further confirmed that PRKCQ-AS1 not only inhibited the proliferation and migration of LPS-induced sepsis cells, but also promoted cell apoptosis, oxidative stress and inflammation. These results suggest that PRKCQ-AS1, as a pathogenic factor, may damage organs by promoting the release of inflammatory cytokines and the intensification of oxidative stress, leading to increased disease severity and thus increased mortality in patients with sepsis.
However, there are still some limitations in our research. Firstly, although this study screened sepsis-related lncRNA-mRNA coexpression pairs through transcriptome sequencing, public datasets and a series of bioinformatics methods, and discussed the relationship between PRKCQ-AS1 and immune cells and inflammation. In future studies, we can further study the effects of PRKCQ-AS1 on more inflammatory markers (including anti-inflammatory markers) and immune markers. Secondly, this study only evaluated the effects of PRKCQ-AS1 on proliferation, apoptosis, migration and oxidative stress in sepsis. The regulatory role and mechanism of PRKCQ-AS1 and its targeted mRNAs in sepsis are not clear and need to be verified by further functional experiments. Finally, the limited sample size may lead to a decrease in statistical power; therefore, more sample size and verification set will help to improve the accuracy of the results.
Conclusion
In conclusion, through RNA sequencing and series of methods, we obtained an immune-related lncRNA-mRNA regulatory network, including 14 immune-related key lncRNAs. Immune infiltration, GSEA and GSVA results further confirmed the correlation between lncRNAs and immune cells. The key immune-related lncRNA PRKCQ-AS1 was screened by WGCNA. Series of bioinformatics methods, RT-qPCR, Western blot and cell function assay confirm that PRKCQ-AS1 was not only an independent prognostic factor in sepsis patients but also inhibited the LPS-induced sepsis model cells viability and promote cell apoptosis, inflammatory damage and oxidative stress. These results suggested that PRKCQ-AS1 may play a key role in inflammation and oxidative stress processes in HUVECs, which may provide potential therapeutic and drug targets for sepsis patients.
Abbreviations
lncRNA, long non-coding RNA; mRNA, messenger RNA; WGCNA, weighted gene co-expression network analysis; GSEA, gene set enrichment analysis; GSVA, gene set variation analysis; ROC, receiver operator characteristic curve; CCK8, cell counting kit-8; ROS, Reactive Oxygen Species; SOD, superoxide dismutase; DElncRNAs, differential expression long noncoding RNAs; DEGs, differential expression genes; LPS, lipopolysaccharide; HUVECs, Human Umbilical Vein Endothelial Cells; GEO, Gene Expression Omnibus; MAD, Median Absolute Deviation; FC, fold change; FDR, False Discovery Rate; PCC, Pearson correlation coefficient; qRT-PCR, quantitative real-time polymerase-chain reaction; GO, Gene Ontology; KEGG, Kyoto Encyclopedia of Genes and Genomes.
Data Sharing Statement
The raw transcriptome sequencing data has been uploaded to Gene Expression Omnibus (GEO). These data can be found here: https://www.ncbi.nlm.nih.gov/geo/query/acc.cgi?acc=GSE217700. All original analysis data of this project has been uploaded to figshare: https://figshare.com/s/cae52655b193511177af.
Ethics Approval and Consent to Participate
This study was approved by the Ethics Committee of the third affiliated hospital of naval military medical university and was carried out in accordance with the Declaration of Helsinki. Written consents were obtained from each patient.
Acknowledgments
We thank all TCGA and GEO data builders and data contributors and thanks to Shanghai Ordovician Biotechnology Co., LTD. For providing the platform of biological information analysis.
Author Contributions
All authors made a significant contribution to the work reported, whether that is in the conception, study design, execution, acquisition of data, analysis and interpretation, or in all these areas; took part in drafting, revising or critically reviewing the article; gave final approval of the version to be published; have agreed on the journal to which the article has been submitted; and agree to be accountable for all aspects of the work.
Disclosure
The authors declare that they do not have any potential conflicts of interest in this work.
References
1. Purcarea A, Sovaila S. Sepsis, a 2020 review for the internist. Rom J Intern Med. 2020;58(3):129–137. doi:10.2478/rjim-2020-0012
2. Gauer R, Forbes D, Boyer N. Sepsis: diagnosis and management. Am Fam Physician. 2020;101(7):409–418.
3. Ackerman MH, Ahrens T, Kelly J, Pontillo A. Sepsis. Crit Care Nurs Clin North Am. 2021;33(4):407–418. doi:10.1016/j.cnc.2021.08.003
4. van der Poll T, Shankar-Hari M, Wiersinga WJ. The immunology of sepsis. Immunity. 2021;54(11):2450–2464. doi:10.1016/j.immuni.2021.10.012
5. Torres LK, Pickkers P, van der Poll T. Sepsis-induced immunosuppression. Annu Rev Physiol. 2022;84(1):157–181. doi:10.1146/annurev-physiol-061121-040214
6. Ren C, Yao RQ, Zhang H, Feng YW, Yao YM. Sepsis-associated encephalopathy: a vicious cycle of immunosuppression. J Neuroinflammation. 2020;17(1):14. doi:10.1186/s12974-020-1701-3
7. Hilarius KWE, Skippen PW, Kissoon N. Early recognition and emergency treatment of sepsis and septic shock in children. Pediatr Emerg Care. 2020;36(2):101–106. doi:10.1097/PEC.0000000000002043
8. Mirijello A, Tosoni A; On Behalf of The Internal Medicine Sepsis Study Group. New strategies for treatment of sepsis. Medicina. 2020;56(10):E527. doi:10.3390/medicina56100527
9. Hou X, Zhang X, Zhao W, et al. Vitamin lipid nanoparticles enable adoptive macrophage transfer for the treatment of multidrug-resistant bacterial sepsis. Nat Nanotechnol. 2020;15(1):41–46. doi:10.1038/s41565-019-0600-1
10. Colunga Biancatelli RML, Berrill M, Mohammed YH, Marik PE. Melatonin for the treatment of sepsis: the scientific rationale. J Thorac Dis. 2020;12(Suppl 1):S54–S65. doi:10.21037/jtd.2019.12.85
11. Liu X, Xu M, Li P, et al. Roles of lncRNAs in the transcription regulation of HIV-1. Biomed J. 2022;45(4):580–593. doi:10.1016/j.bj.2022.03.012
12. Wei H, Liao Q, Liu B. iLncRNAdis-FB: identify lncRNA-disease associations by fusing biological feature blocks through deep neural network. IEEE/ACM Trans Comput Biol Bioinform. 2021;18(5):1946–1957. doi:10.1109/TCBB.2020.2964221
13. Yang Y, Xue J, Qin L, Zhang J, Liu J, Yu J. LncRNA NEAT1 promotes inflammatory response in sepsis via the miR-31-5p/POU2F1 axis. Inflammation. 2021;44(4):1518–1528. doi:10.1007/s10753-021-01436-9
14. Zhang C, Li J, Li H, et al. lncRNA MIR155HG accelerates the progression of sepsis via upregulating MEF2A by sponging miR-194-5p. DNA Cell Biol. 2021;40(6):811–820. doi:10.1089/dna.2021.0038
15. Liu D, Sun W, Zhang D, et al. Long noncoding RNA GSEC promotes neutrophil inflammatory activation by supporting PFKFB3-involved glycolytic metabolism in sepsis. Cell Death Dis. 2021;12(12):1157. doi:10.1038/s41419-021-04428-7
16. Zhang G, Sun J, Zhang X. A novel cuproptosis-related LncRNA signature to predict prognosis in hepatocellular carcinoma. Sci Rep. 2022;12(1):11325. doi:10.1038/s41598-022-15251-1
17. Reitz KM, Kennedy J, Li SR, et al. Association between time to source control in sepsis and 90-day mortality. JAMA Surg. 2022;157(9):817–826. doi:10.1001/jamasurg.2022.2761
18. Yongyan P, Sijia C, Fengling Z, Tao X, Hua C. Construction and evaluation of Alzheimer’s disease diagnostic prediction model based on genes involved in mitophagy. Front Aging Neurosci. 2023;15:1146660. doi:10.3389/fnagi.2023.1146660
19. Hänzelmann S, Castelo R, Guinney J. GSVA: gene set variation analysis for microarray and RNA-seq data. BMC Bioinf. 2013;14:7. doi:10.1186/1471-2105-14-7
20. Liang S, Xing M, Chen X, Peng J, Song Z, Zou W. Predicting the prognosis in patients with sepsis by a pyroptosis-related gene signature. Front Immunol. 2022;13:1110602. doi:10.3389/fimmu.2022.1110602
21. Yan P, Luo S, Lu JY, Shen X. Cis- and trans-acting lncRNAs in pluripotency and reprogramming. Curr Opin Genet Dev. 2017;46:170–178. doi:10.1016/j.gde.2017.07.009
22. Liu X, Hong C, Jiang Y, et al. Co-expression module analysis reveals high expression homogeneity for both coding and non-coding genes in sepsis. BMC Genomics. 2023;24:418. doi:10.1186/s12864-023-09460-9
23. Wang T, Xu S, Zhang L, et al. Identification of immune-related lncRNA in sepsis by construction of ceRNA network and integrating bioinformatic analysis. BMC Genomics. 2023;24(1):484. doi:10.1186/s12864-023-09535-7
24. Zhao Q, Liu J, Ouyang X, et al. Role of immune-related lncRNAs--PRKCQ-AS1 and EGOT in the regulation of IL-1β, IL-6 and IL-8 expression in human gingival fibroblasts with TNF-α stimulation. J Dent Sci. 2023;18(1):184–190. doi:10.1016/j.jds.2022.06.006
25. Cui G, Zhao H, Li L. Long noncoding RNA PRKCQ-AS1 promotes CRC cell proliferation and migration via modulating miR-1287-5p/YBX1 axis. J Cell Biochem. 2020;121(10):4166–4175. doi:10.1002/jcb.29712
26. Shi X, Chen H, Wang W, Zhang JP. Experimental study of lncRNA PRKCQ-AS1 regulating miR-143-3p/ IL-6/STAT3 pathway to influence proliferation, migration, invasion and inducing apoptosis of liver cancer cells. Chin J Immunol. 2021;37:2986. doi:10.3969/j.issn.1000-484X.2021.24.010
27. Li X, Sun L, Wang X, et al. A five immune-related lncRNA signature as a prognostic target for glioblastoma. Front Mol Biosci. 2021;8:632837. doi:10.3389/fmolb.2021.632837
28. Ciesielski TH, Zhang X, Tacconelli A, et al. Late-onset neonatal sepsis: genetic differences by sex and involvement of the NOTCH pathway. Pediatr Res. 2023;93:1085–1095. doi:10.1038/s41390-022-02114-8
29. van Lunzen J, Altfeld M. Sex differences in infectious diseases-common but neglected. J Infect Dis. 2014;209(Suppl 3):S79–S80. doi:10.1093/infdis/jiu159
30. Jaillon S, Berthenet K, Garlanda C. Sexual dimorphism in innate immunity. Clin Rev Allergy Immunol. 2019;56(3):308–321. doi:10.1007/s12016-017-8648-x
 © 2024 The Author(s). This work is published and licensed by Dove Medical Press Limited. The
full terms of this license are available at https://www.dovepress.com/terms
and incorporate the Creative Commons Attribution
- Non Commercial (unported, 3.0) License.
By accessing the work you hereby accept the Terms. Non-commercial uses of the work are permitted
without any further permission from Dove Medical Press Limited, provided the work is properly
attributed. For permission for commercial use of this work, please see paragraphs 4.2 and 5 of our Terms.
© 2024 The Author(s). This work is published and licensed by Dove Medical Press Limited. The
full terms of this license are available at https://www.dovepress.com/terms
and incorporate the Creative Commons Attribution
- Non Commercial (unported, 3.0) License.
By accessing the work you hereby accept the Terms. Non-commercial uses of the work are permitted
without any further permission from Dove Medical Press Limited, provided the work is properly
attributed. For permission for commercial use of this work, please see paragraphs 4.2 and 5 of our Terms.