Back to Journals » Infection and Drug Resistance » Volume 14
Analysis of Factors Influencing Multidrug-Resistant Tuberculosis and Validation of Whole-Genome Sequencing in Children with Drug-Resistant Tuberculosis
Authors Zhang Y, Zhao R, Zhang Z, Liu Q, Zhang A, Ren Q, Li S, Long X, Xu H
Received 3 August 2021
Accepted for publication 30 September 2021
Published 24 October 2021 Volume 2021:14 Pages 4375—4393
DOI https://doi.org/10.2147/IDR.S331890
Checked for plagiarism Yes
Review by Single anonymous peer review
Peer reviewer comments 4
Editor who approved publication: Professor Suresh Antony
Ying Zhang, Ruiqiu Zhao, Zhenzhen Zhang, Quanbo Liu, Aihua Zhang, Qiaoli Ren, Siyuan Li, Xiaoru Long, Hongmei Xu
Department of Infection, Children’s Hospital of Chongqing Medical University, National Clinical Research Center for Child Health and Disorders, Ministry of Education Key Laboratory of Child Development and Disorders, Chongqing Key Laboratory of Child Infection and Immunity, The Children’s Hospital of Chongqing Medical University, Chongqing, People’s Republic of China
Correspondence: Xiaoru Long; Hongmei Xu Tel +86 2368370396
; +86 2368370385
Email [email protected]; [email protected]
Objective: Pediatric tuberculosis (TB) is one of the top ten causes of death in children. Our study was to analyze influencing factors of multidrug-resistant tuberculosis (MDR-TB) and validation of whole-genome sequencing (WGS) used in children with drug-resistant TB (DR-TB).
Methods: All Mycobacterium tuberculosis (Mtb) strains were isolated from patients aged below 18 years old of Children’s Hospital of Chongqing Medical University, China. A total of 208 Mtb isolates were tested for eight anti-TB drugs with phenotypic drug susceptibility test (DST) and for genetic prediction of the susceptible profile with WGS. The patients corresponding to each strain were grouped according to drug resistance and genotype. Influencing factors of MDR-TB and DR-TB were analyzed.
Results: According to the phenotypic DST and WGS, 82.2% of Mtb strains were susceptible to all eight drugs, and 6.3% were MDR-TB. Using the phenotypic DSTs as the gold standard, the kappa value of WGS to predict isoniazid, rifampin, ethambutol, rifapentine, prothionamide, levofloxacin, moxifloxacin and amikacin was 0.84, 0.89, 0.59, 0.86, 0.89, 0.82, 0.88 and 1.00, respectively. There was significant difference in the distribution of severe TB, diagnosis, treatment and outcome between MDR and drug-susceptible group (P< 0.05). The distribution of severe TB and treatment between DR and drug-susceptible group was statistically different (P< 0.05). The results of binary logistic regression showed that Calmette–Guérin bacillus (BCG) vaccine is the protective factor for MDR-TB (OR=0.19), and MDR-TB is the risk factor for PTB and EPTB (OR=17.98).
Conclusion: The BCG vaccine is a protective factor for MDR-TB, and MDR-TB might not be confined to pulmonary infection, spreading to extrapulmonary organs in children. MDR-TB had more severe cases and a lower recovery rate than drug-susceptible TB. WGS could provide an accurate prediction of drug susceptibility test results for anti-TB drugs, which are needed for the diagnosis and precise treatment of TB in children.
Keywords: tuberculosis, whole-genome sequencing, children, consistency test, multidrug-resistant tuberculosis, clinical feature
Introduction
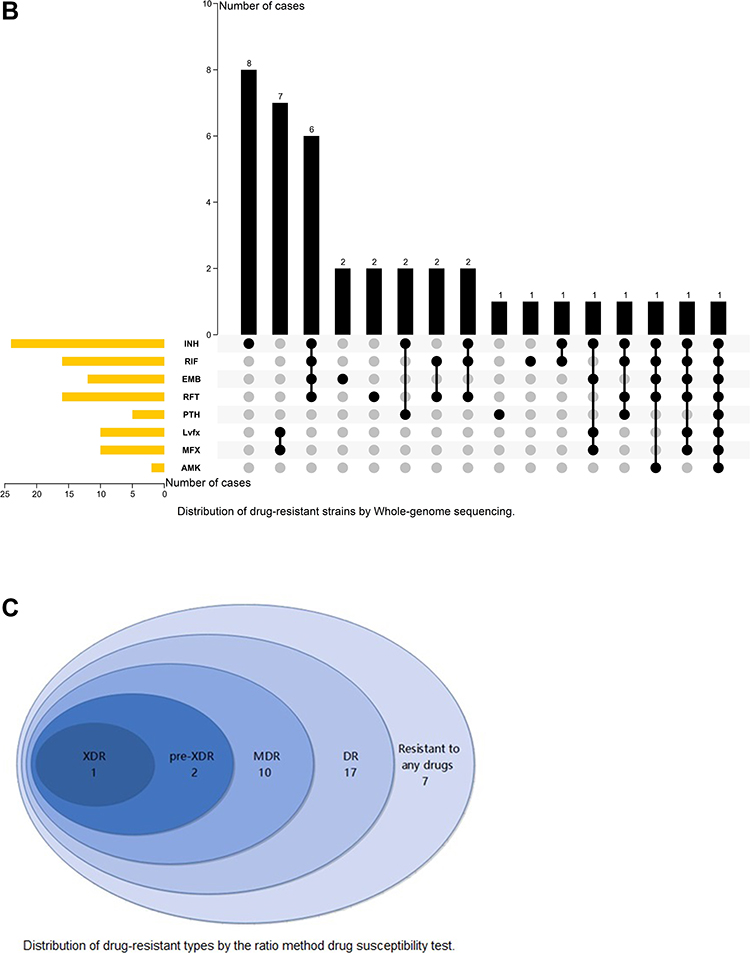
Pediatric tuberculosis (TB) is a significant global health threat and is one of the top ten causes of death in children.1 Globally, in 2019, an estimated 10.0 million people fell ill with TB, with children (aged under 15 years old) accounting for 12%, causing 1.4 million deaths.2 With the use of anti-TB drugs, the incidence of drug-resistant TB (DR-TB) cases has increased significantly. Worldwide, in 2019, close to half a million people developed rifampicin-resistant TB, of which 78% had multidrug-resistant (defined as resistance to rifampicin and isoniazid) TB (MDR-TB).2 Children are vulnerable to drug-resistant forms of TB, and it is estimated that between 25–33,000 children become sick with DR-TB each year, while fewer than 5% are ever diagnosed and treated for their disease.2,3 The data published to date show that children tolerate MDR-TB infection treatment with fewer adverse effects than adults and that failure to treat will result in potentially preventable cases of disease.4 Hence, urgently determining the drug resistance spectrum of Mycobacterium tuberculosis (Mtb) is very important for the accurate treatment of tuberculosis in children. Figure 1 Continue. Figure 1 Distribution of 37 drug-resistant Mycobacterium tuberculosis isolates. (A) Distribution of drug-resistant strains by ratio method drug susceptibility test. (B) Distribution of drug-resistant strains by Whole-genome sequencing. (C) Distribution of drug-resistant types by the ratio method drug susceptibility test. Abbreviations: AMK, Amikacin; DR, Drug-resistant; EMB, Ethambutol; XDR, Extensively drug-resistant; INH, Isoniazid; Lvfx, Levofloxacin; MFX, Moxifloxacin; MDR, Multidrug resistant; RIF, Rifampicin; pre-XDR, Pre-extensively drug-resistant; PTH, Prothionamide; RFT, Rifapentine; WGS, Whole-genome sequencing.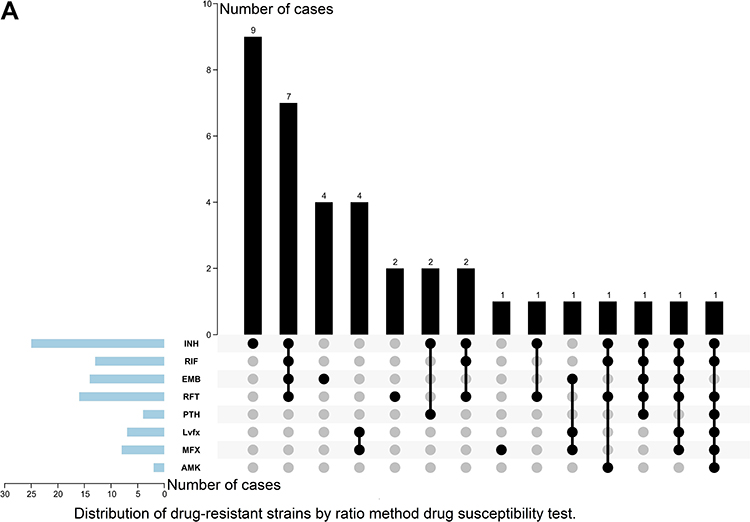
Smear microscopy and culture are still the gold standard, although the diagnosis of pediatric TB relies on a mix of epidemiological, clinical, radiological, and laboratory information. Children with TB tend to have a relatively low bacterial burden (paucibacillary disease), which makes detecting the organism difficult, even in patients with advanced disease.5 In a recent study of pulmonary tuberculosis (PTB) in children in mainland China, the positive rates of sputum smears and bacteriology tests were 21.5% and 21.7%, respectively, while the most positive cases based on sputum smears and bacteriology tests occurred in the 10~14 years age group (84.3% and 84.7%, respectively).6 The latest evidence reviewed supports the use of Xpert MTB/RIF and Xpert Ultra as initial diagnostic tests for PTB and extrapulmonary TB (EPTB) in children.7 For the detection of PTB via sputum specimens, the pooled sensitivity and specificity of Xpert MTB/RIF verified by culture were 64.6% (95% confidence interval, 95% CI: 55.3% to 72.9%) and 99.0% (95% CI: 98.1% to 99.5%), respectively.8 However, there are more adverse reactions to anti-TB drugs than to other antibiotics widely used in clinics, and compliance for injectable drugs is poor due to the prolonged treatment time.9 Xpert, which has been used to diagnose only rifampicin resistance, cannot completely meet the clinical needs of children.
The World Health Organization recommended that next-generation sequencing is a valuable tool for the surveillance of DR-TB.2 Compared with the conventional phenotypic drug susceptibility test (DST), it provides accurate and more rapid results for both first-line and second-line anti-TB drugs and offers valuable insights into molecular epidemiology, including phylogenetics, strain evolution and transmission.2 However, to date, whole-genome sequencing (WGS) has been used primarily in economically developed areas with a low TB burden.10 China is one of the three countries with a high burden of MDR-TB in the world, and WGS has not been applied in clinical practice. Herein, our study evaluated the performance of WGS in comparison with the phenotypic DST to predict drug susceptibility to eight first- and second-line anti-TB drugs. All the Mtb strains were isolated from specimens collected from children under 18 years old. Then, the clinical data of MDR, DR-TB and drug-susceptible TB patients were compared to analyze the clinical characteristics of children with DR-TB and MDR-TB.
Materials and Methods
Mtb Isolates
Between July 2015 and November 2020, Mtb isolates were collected from pulmonary and extrapulmonary specimens (n=428), which included those taken from patients during routine care in the Children’s Hospital of Chongqing Medical University, China. Mycobacterium strains were successfully recovered in 291 cases, and 73 isolates were excluded to ensure that each sample corresponded to only one patient.
Mtb Identification and Phenotypic DSTs
Phenotypic DSTs were performed by the ratio method for the recovered mycobacterial strains for this study. The cultivation, identification, and DST assessment of 218 Mtb isolates were performed with strict adherence to the provisions of the “The Test Procedures of Tuberculosis Diagnostic Laboratory”.11 Neutral Roche medium (ZhuHai Encode Medical Engineering Co., Ltd.) was manipulated to conventional DSTs with the ratio method.11 Thiophene-2-carboxylic acid hydrazide (TCH) and p-nitrobenzoic acid (PNB) were used to identify nontuberculosis mycobacteria and Mycobacterium bovis. The Mtb strains were tested with three first-line anti-TB drugs, isoniazid, rifampicin and ethambutol, and five second-line drugs, rifapentine, prothionamide, levofloxacin, moxifloxacin and amikacin. The critical concentrations of anti-TB drugs were 0.2 μg/mL for isoniazid, 40 μg/mL for rifampicin, 2.0 μg/mL for ethambutol, 40 μg/mL for rifapentine, 40 μg/mL for prothionamide, 2 μg/mL for levofloxacin, 2 μg/mL for moxifloxacin, 30 μg/mL for amikacin, 0.005 mg/mL for TCH and 0.5 mg/mL for PNB.11,12
Whole-Genome Sequencing and Data Analysis
All Mtb isolates were subjected to WGS performed by Shanghai Gene-optimal Science & Technology Co., Ltd. Genomic DNA was extracted for sequencing using the cetyltrimethylammonium bromide (CTAB) method of DNA purification.13 Each extracted DNA was quantified by a Qubit 2.0 Fluorometer (Invitrogen, Carlsbad, CA, USA). After the library was diluted, an Agilent 2100 bioanalyzer system (Agilent Technologies, Palo Alto, CA, USA) was used to detect the inserted fragments of the library. The quantitative polymerase chain reaction (Q-PCR) method was used to accurately quantify the effective concentration of the library to ensure the quality of the library after the size of the inserted fragments met the expectation. According to the requirements of effective concentration and target off-line data volume, different libraries were pooled into a flow cell. cBot was used to create clusters, which were then sequenced using the Illumina NovaSeq 6000 (Illumina, San Diego, CA, USA) high-throughput sequencing platform.
Fastp (version 0.20.0) was used to remove low-quality data to obtain clean data (minimum average depth of coverage: 10X; minimum genome coverage frequency≥95%).14 The sequence reads were aligned to the reference strain Mtb H37Rv (GenBank accession no. NC 000962.3). Single-nucleotide polymorphism (SNP) calling was performed by Freebayes (version 1.3.2).15 SnpEff (version 4.3t, snpeff.sourceforge.net) was used to annotate the mutations as synonymous, missense, unintentional, frameshift, and so on. Then, information on a series of variations such as SNPs and insertions/deletions (indels) of the target genome compared to the reference genome was obtained. The sequence comparison information of each drug resistance site was extracted from Bam files generated from mutation analysis, and the mutation of each drug resistance site was analyzed. The phenotype of drug resistance was predicted according to the mutation and drug resistance relationship in the database (https://github.com/jodyphelan/tbdb).
Epidemiological and Clinical Data Collection
We extracted epidemiological and clinical data, including sex, age, ethnicity, residential area, province of residence, admission time, previous TB history, history of contact with TB patients, history of Calmette–Guérin bacillus (BCG) vaccination, duration of symptoms before effective treatment, diagnosis, severe TB status, treatment, and outcome, for each patient. Patients were divided into MDR, DR and drug-susceptible (DS) groups according to the phenotypic DST results. If the phenotypic DST results were not consistent with the definition of DR-TB, these patients were not included in the DR group. Patients were divided into lineage 2 and 4 groups according to the genotype results detected by WGS.
Definitions
DR-TB was defined as isolates resistant to at least one first-line drug for TB treatment. MDR-TB was defined as isolates resistant to rifampicin and isoniazid, the two most powerful anti-TB drugs.2 The definition of severe TB was disease with any uncontrolled, disseminated, or complicated clinical syndromes, briefly, including PTB with cavitation representing local complications, PTB with empyema, TB pericarditis, abdominal TB (representing enteritis, solid organ disease, and peritoneal spread), TB arthritis, TB synovitis, TB osteitis, TB meningitis, genitourinary tract TB and miliary TB.2,16
Effective treatment was defined as anti-TB drugs covering more than three kinds of drug susceptibilities confirmed by phenotypic DST assessment.
Recovery was defined as a TB patient with bacteriologically confirmed TB at the beginning of treatment who was smear- or culture-negative,17 with their symptoms and CT or MRI imaging were restored. The duration of the anti-TB drug intensification period was more than 1 year, and approximately one-third of patients had not completed treatment. This trial evaluated the outcomes at 6 months according to the short-term treatment course of anti-TB drugs.
Statistical Analysis
Statistical analysis was performed with MedCalc online software (https://www.medcalc.org/calc/diagnostic_test.php) and SPSS 22.0 (SPSS Inc., Chicago, IL, USA). The sensitivity, specificity, positive predictive value (PPV), and negative predictive value (NPV) of WGS were calculated with a 95% CI using the ratio method DST as the gold standard. In addition, Cohen’s kappa was used to test interrater reliability. The kappa result was interpreted as follows: values 0–0.2 indicated no agreement, 0.21–0.39 indicated minimal agreement, 0.40–0.59 indicated weak agreement, 0.60–0.79 indicated moderate agreement, 0.80–0.90 indicated strong agreement, and above 0.9 indicated almost perfect agreement.18 Clinical characteristics were compared using the chi-square, Fisher’s exact, or Wilcoxon rank sum test with a significance level of p<0.05. Binary logistic regression was used to calculate odds ratios (ORs) and 95% CIs.
Results
Drug-Resistance Patterns of MTB Isolates
The ratio method DST and Mtb identification were performed with 218 isolated strains. Two isolates were identified as non-tuberculosis mycobacterium, 8 isolates were identified as Mycobacterium bovis, and 208 isolates were Mtb strains. The 208 Mtb strains were isolated from sputum specimens (n=79), gastric specimens (n=70), cerebrospinal fluid (n=22), bronchoalveolar lavage fluid (n=15), pleural effusion (n=14), subthoracic cold abscess pus puncture fluid (n=5), seroperitoneum specimens (n=2), and joint fluid (n=1) (Supplemental Table 1). Each specimen corresponds to one patient.
According to the phenotypic DST, 82.2% (171/208) were susceptible to all eight drugs, 17.8% (37/208) were resistant to at least one drug, 14.4% (30/208) were DR-TB, 6.3% (13/208) were MDR-TB, 1.4% (3/208) were pre-XDR-TB, and 0.5% (1/208) were XDR-TB, as shown in Figure 1. The total resistance rates were as follows: isoniazid (25, 12.0%), rifampin (13, 6.3%), ethambutol (14, 6.7%), rifapentine (16, 7.7%), amikacin (2, 1.0%), prothionamide (4, 2.0%), levofloxacin (7, 3.4%) and moxifloxacin (8, 3.9%) (Supplemental Table 2).
Mutations Associated with Drug Resistance
The mapping results of these 208 isolates showed that the average sequencing depth of the genome was from 50.21 to 410.28 (250.72±60.18), the genome 10X coverage was from 98.69 to 99.97 (99.36±0.23) (Supplemental Table 3).
There were 171 isolates (82.2%) without mutations in genes associated with resistance to all eight drugs. The distribution of 37 isolates with mutations in genes associated with resistance to at least one drug according to WGS results is shown in Figure 1B.
The strains were divided into drug-resistant strains and drug-susceptible strains based on the drug resistance properties for each drug according to the phenotypic DST results. The distribution of diverse mutation sites in drug-resistant isolates and drug- susceptible strains is shown in Table 1 and Supplemental Table 4).
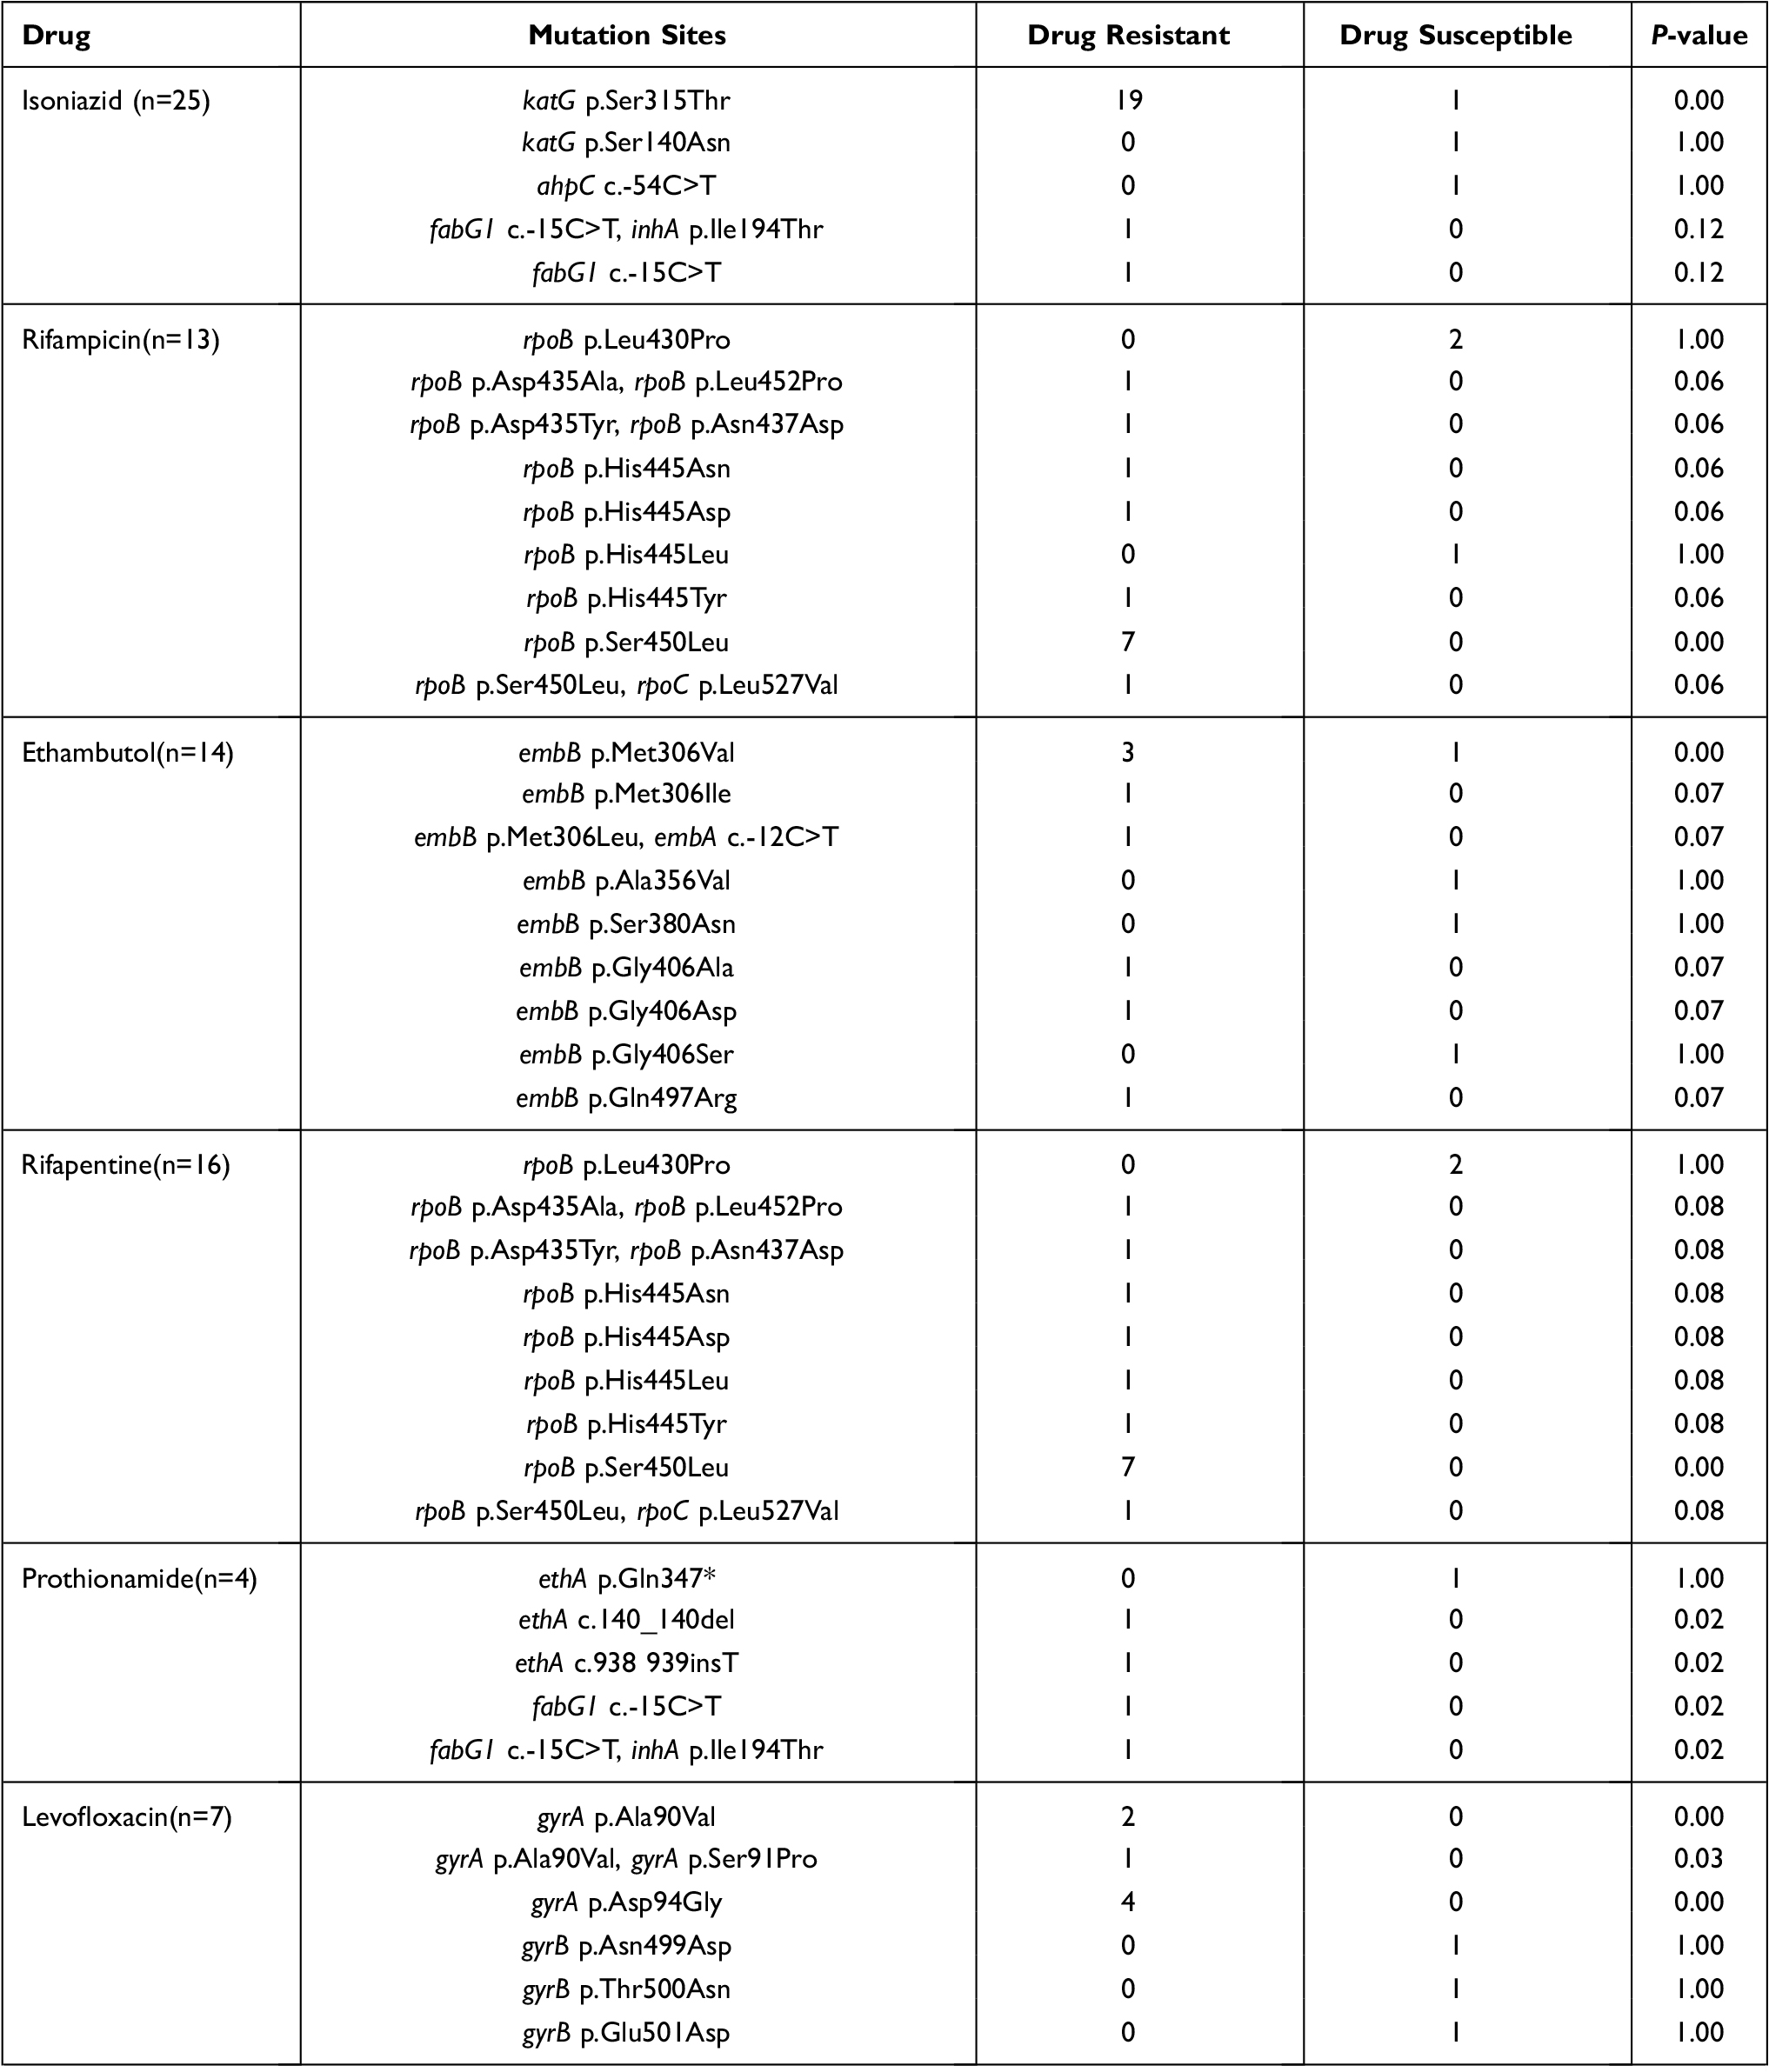 | 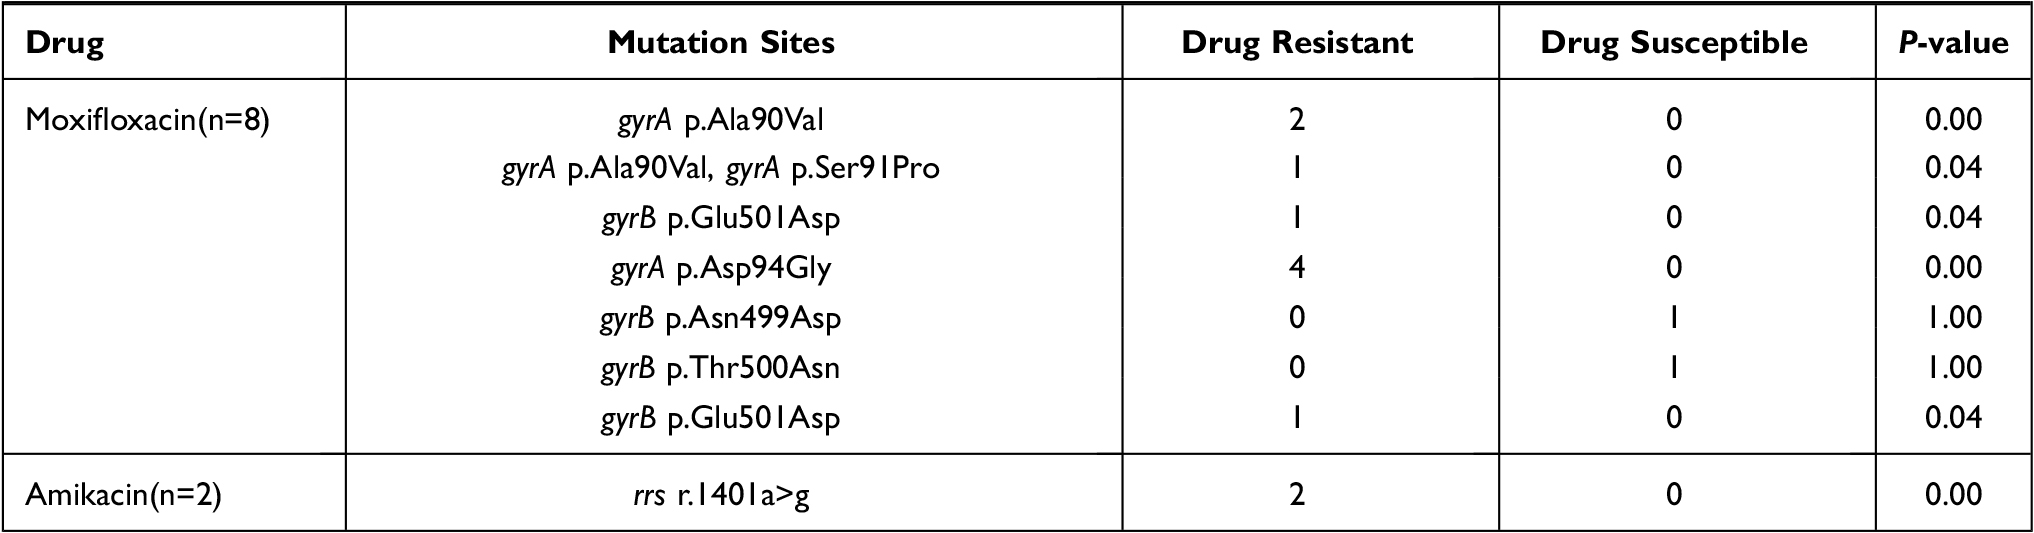 |
Table 1 Distribution of Mutation Sites in Drug Resistant Isolates and Drug Sensitivity Strains |
In 24 isoniazid-resistant strains, 3 mutations were found, including katG Ser315Thr (19/24, 79.2%), fabG1 c.-15C>T (2/24, 8.3%) and inhA Ile194Thr (1/24, 4.2%). One strain had two isoniazid resistance-associated mutations, fabG1 c.-15C>T and inhA Ile194Thr. In 184 isoniazid-susceptible strains, 2 mutations were found, namely, katG Ser140Asn (1/184, 0.5%) and ahpC c.-54C>T (1/184, 0.5%). The distributions of katG Ser315Thr and fabG1 c.-15C>T were different (P=0.00 and 0.01, respectively). There was no significant difference in the distribution of katG Ser140Asn, ahpC c.-54C>T and inhA Ile194Thr between the two groups of strains (P>0.05).
There were 9 mutations in 13 rifampicin-resistant strains, namely, rpoB Asp435Ala (1/13, 7.7%), Asp435Tyr (1/13, 7.7%), Asn437Asp (1/13, 7.7%), His445Asn (1/13, 7.7%), His445Asp (1/13, 7.7%), His445Tyr (1/13, 7.7%), Ser450Leu (8/13, 61.5%) and Leu452Pro (1/13, 7.7%) and rpoC Leu527Val (1/13, 7.7%). There was one isolate carrying rpoC Leu527Val in addition to rpoB Ser450Leu, and 2 strains had two rpoB gene mutations, Asp435Ala and Leu452Pro and Asp435Tyr and Asn437Asp. The mutations rpoB Leu430Pro (2/195, 1%) and rpoB His445Leu (1/195, 0.5%) were found in rifampicin-susceptible strains. There was a significant difference in the distribution of rpoB Ser450Leu between the two groups of strains (P=0.00). The results for rifapentine-resistant strains were roughly the same as those for rifampicin-resistant strains, except rpoB His445Leu was found in rifapentine-resistant strains.
In 14 ethambutol-resistant strains, 7 mutations were found, namely, embB Met306Val (3/14, 21.4%), embB Met306Ile (1/14, 7.1%), embB Met306Leu (1/14, 7.1%), embB Gly406Ala (1/14, 7.1%), embB Gly406Asp (1/14, 7.1%), embB Gln497Arg (1/14, 7.1%) and embA c.-12C>T (1/14, 7.1%). Among them, one isolate had both embA c.-12C>T and embB Met306Leu mutations. The mutations embB Ala356Val (1/194, 0.5%), embB Ser380Asn (1/194, 0.5%) and embB Gly406Ser (1/194, 0.5%) were found in ethambutol-susceptible strains. The distribution of embB Met306Val was different in the two groups of strains (P=0.00).
For prothionamide, one strain maintained both the fabG1 c.-15C>T and inhA Ile194Thr mutations. There was a significant difference in the distribution of ethA c.140_140del, ethA c.938_939insT, fabG1 c.-15C>T and inhA Ile194Thr between prothionamide-resistant strains and prothionamide-susceptible strains (P<0.05).
Three mutations were found in 7 levofloxacin-resistant strains, namely, gyrA Ala90Val (3/7, 42.9%), gyrA Ser91Pro (1/7, 14.3%), and gyrA Asp94Gly (4/7, 57.1%). One strain had both gyrA Ala90Val and gyrA Ser91Pro. The mutations gyrB Asn499Asp (1/201, 0.5%), gyrB Thr500Asn (1/201, 0.5%) and gyrB Glu501Asp (1/201, 0.5%) were found in the levofloxacin-susceptible strains. There was a significant difference in the distribution of gyrA Ala90Val, gyrA Ser91Pro, and gyrA Asp94Gly between the two groups of strains. The results for moxifloxacin-resistant strains were roughly the same as those for levofloxacin-resistant strains, except gyrB Glu501Asp was found in moxifloxacin-resistant strains. Two amikacin-resistant isolates had the same mutation in the rrs gene, 1401a>g (shown in Table 1).
Genotype Distributions of Mtb Isolates
The genotypes of 208 Mtb isolates were identified according to WGS results. There were two different lineages in our study, namely, lineage 2 (East Asian, n=154) and lineage 4 (Euro-American, n=54). Lineage 2 strains included two sublineages, lineage 2.2.1 (n=146, 70.2%) and lineage 2.2.2 (n=8, 3.9%), while lineage 4 strains included three sublineages, lineage 4.2.2 (n=7, 3.4%), lineage 4.4 (n=22, 10.6%), lineage 4.5 (n=22, 10.6%), and unclassified (n=3, 1.4%). Twelve isolates (92.3%) belonged to lineage 2 in the MDR group, and 27 isolates (90.0%) belonged to lineage 2 the DR group. The difference in genotype distribution between lineage 2 and lineage 4 in the DS and DR groups was statistically significant (P=0.03) (shown in Table 2 and Supplemental Table 4).
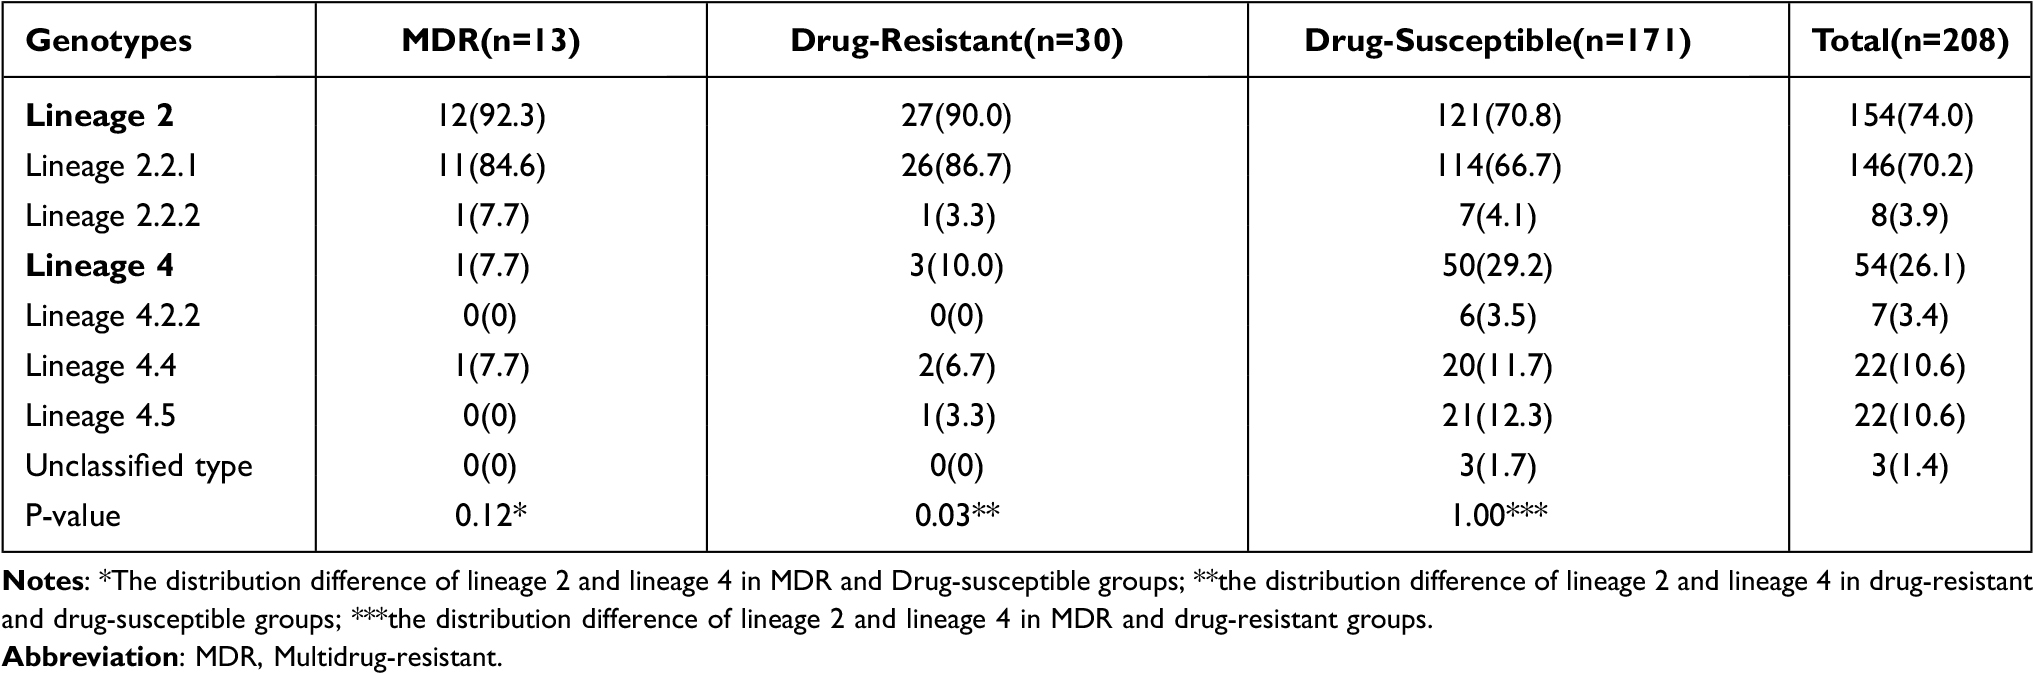 |
Table 2 Genotype Distributions in Different Groups (n, %) |
Agreement of Phenotypic and Genotypic DST Assessment
Using the ratio method DST as the gold standard, we evaluated the ability of WGS to predict drug resistance for eight drugs. The concordance, sensitivity, specificity, PPV, NPV and kappa value for each drug are shown in Table 3. For 208 isolates tested, we found an average concordance of 98.2% across all eight drugs, ranging from 95.2% to 100%. The sensitivity, specificity, PPV, NPV and kappa for WGS to predict Mtb drug resistant were 84.0% (95% CI: 63.1–94.8%), 98.4% (95% CI: 94.9–99.6%), 87.5% (95% CI: 66.5–96.7%), 97.8% (95% CI: 94.2–99.3%) and 0.84 for isoniazid, 100% (95% CI: 71.7–100%), 98.46% (95% CI: 95.2–99.6%), 81.3% (95% CI: 53.7–95.0%), 100% (95% CI: 97.6–100%) and 0.89 for rifampin, 57.1% (95% CI: 29.7–81.2%), 97.9% (95% CI: 94.5–99.3%), 66.7% (95% CI: 35.4–88.7%), 96.9% (95% CI: 93.2–98.8%) and 0.59 for ethambutol, 87.5% (95% CI: 60.4–97.8%), 99.0% (95% CI: 95.9–99.8%), 87.5% (95% CI: 60.4–97.8%), 99.0% (95% CI: 95.9–99.8%) and 0.86 for rifapentine, 100% (95% CI: 39.6–100%), 99.5% (95% CI: 96.9–100%), 80.0% (95% CI: 29.9–98.9%), 100% (95% CI: 97.7–100%) and 0.89 for prothionamide, 100% (95% CI: 56.1–100%), 98.50% (95% CI: 95.4–99.6%), 70.0% (95% CI: 35.4–91.9%), 100% (95% CI: 97.6–100%) and 0.82 for levofloxacin, 100% (95% CI: 59.8–100%), 99.0% (95% CI: 96.1–99.8%), 80.0% (95% CI: 44.2–96.5%), 100% (95% CI: 97.6–100%) and 0.88 for moxifloxacin, 100% (95% CI: 19.8–100%), 100% (95% CI: 97.7–100%), 100% (95% CI: 19.8–100%), 100% (95% CI: 97.7–100%) and 1.00 for amikacin, respectively. The consistency between phenotypic DST assessment and WGS for drug resistance prediction was strong for isoniazid, rifampin, rifapentine, amikacin, prothionamide, levofloxacin and moxifloxacin.
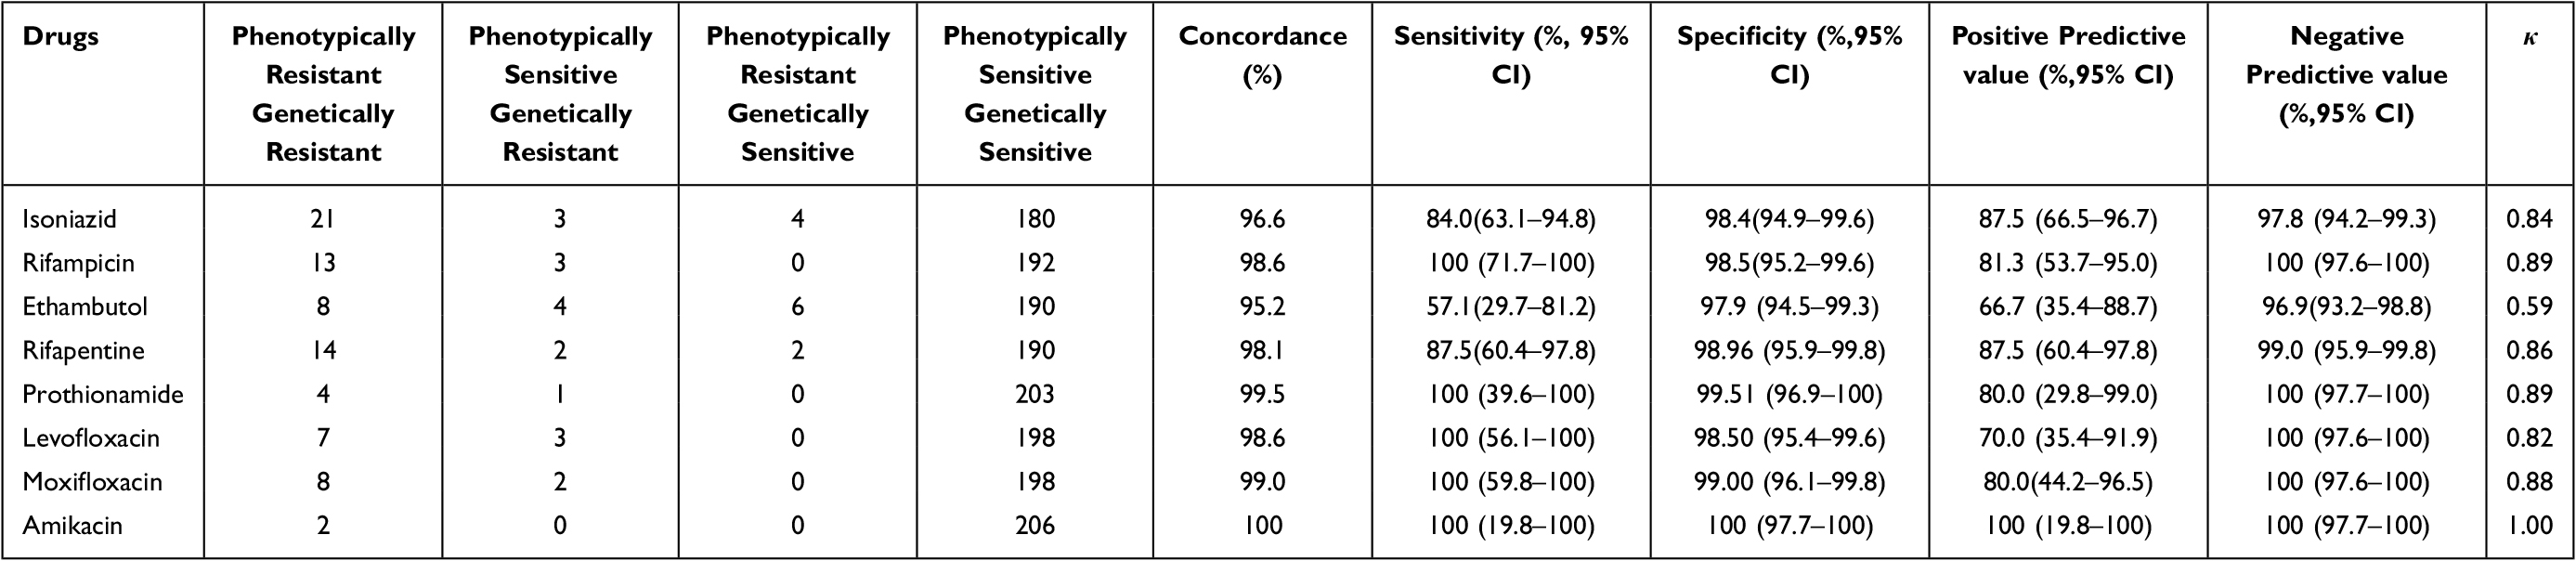 |
Table 3 Whole Genome Sequencing Compared with Phenotypic Drug Sensitivity Test in Drug Resistance Diagnosis of Mycobacterium tuberculosis Isolates |
Population Characteristics and Clinical Materials
In Table 4, the distribution of population characteristics and clinical materials is summarized for the MDR, DR, DS, and total groups, including sex, age, ethnicity, residential area, province of residence, admission time, previous TB history, history of contact with TB patients, history of BCG vaccination, duration of symptoms before effective treatment, diagnosis, severe TB status, treatment, and outcome. Seven patients were infected with Mtb strains resistant to rifapentine or fluoroquinolones (FQs), so they were not classified into the DR group. The different distributions were analyzed between the MDR, DR and DS groups. As shown in Table 4, no statistically significant differences were found between the MDR, DR and DS groups in the distribution of sex, age, ethnicity, residential area, province of residence, admission time, previous TB history, history of contact with TB patients, and duration of symptoms before effective treatment (P>0.05) (Supplemental Table 5).
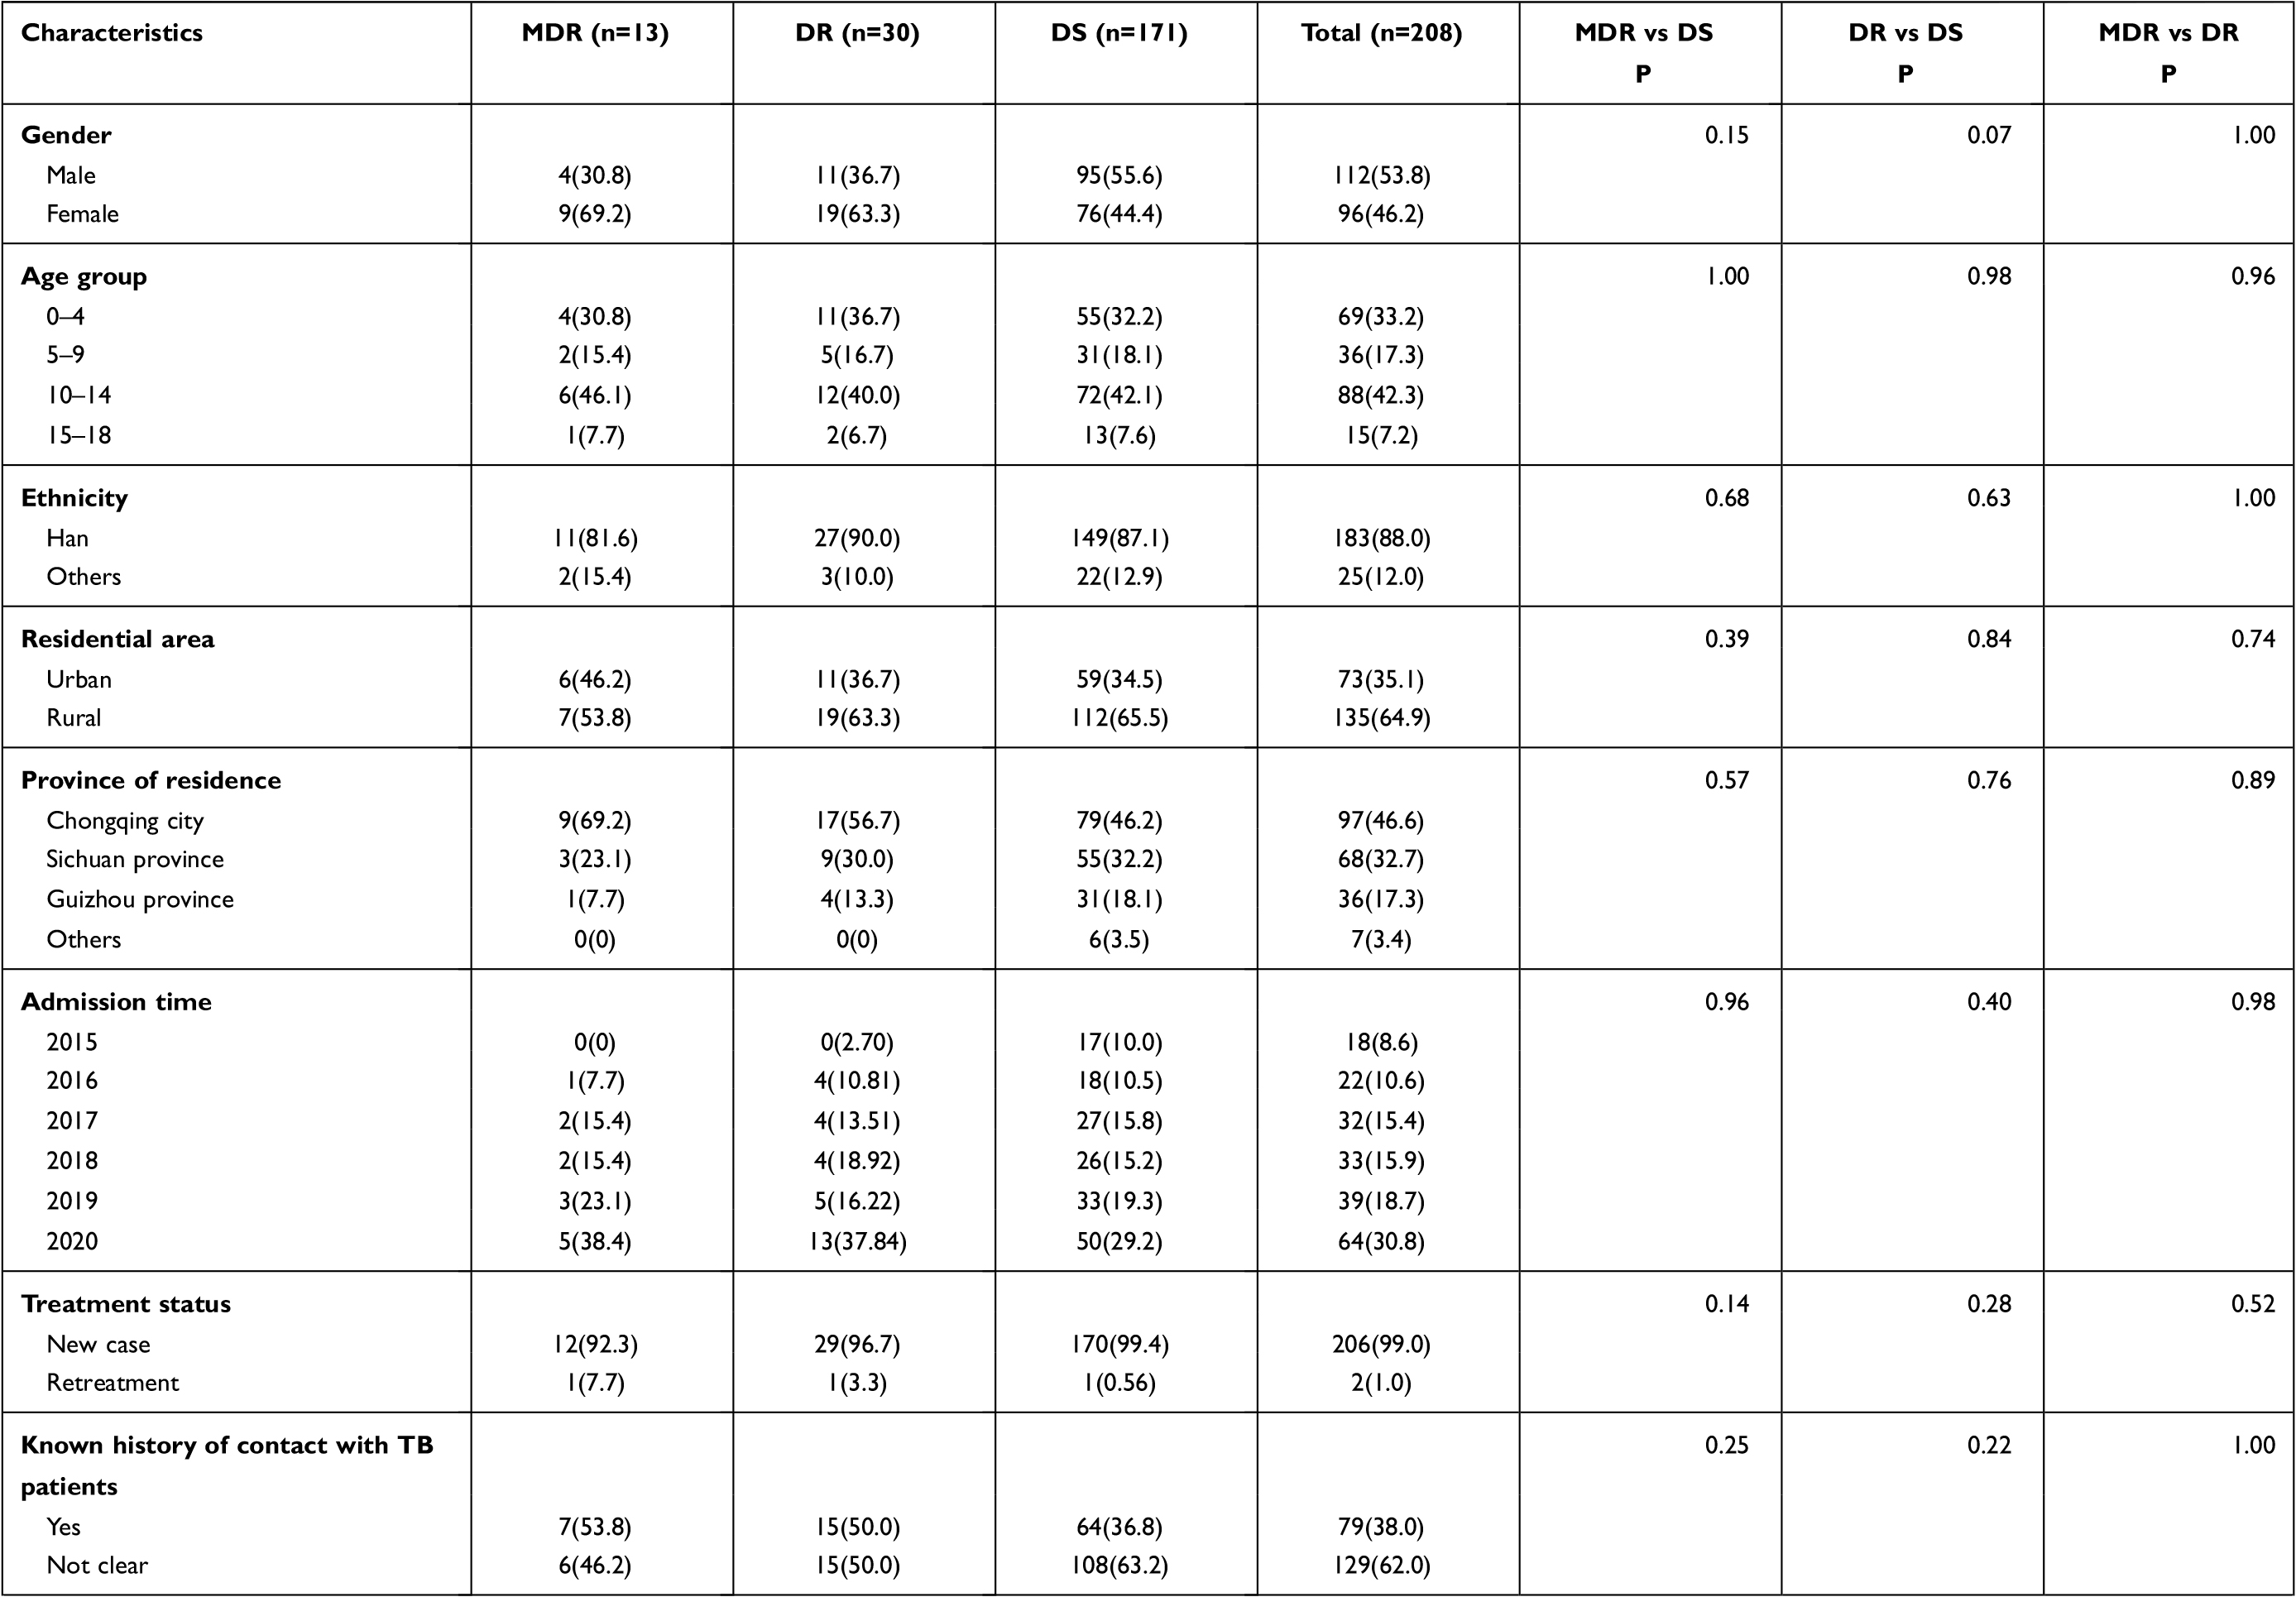 | 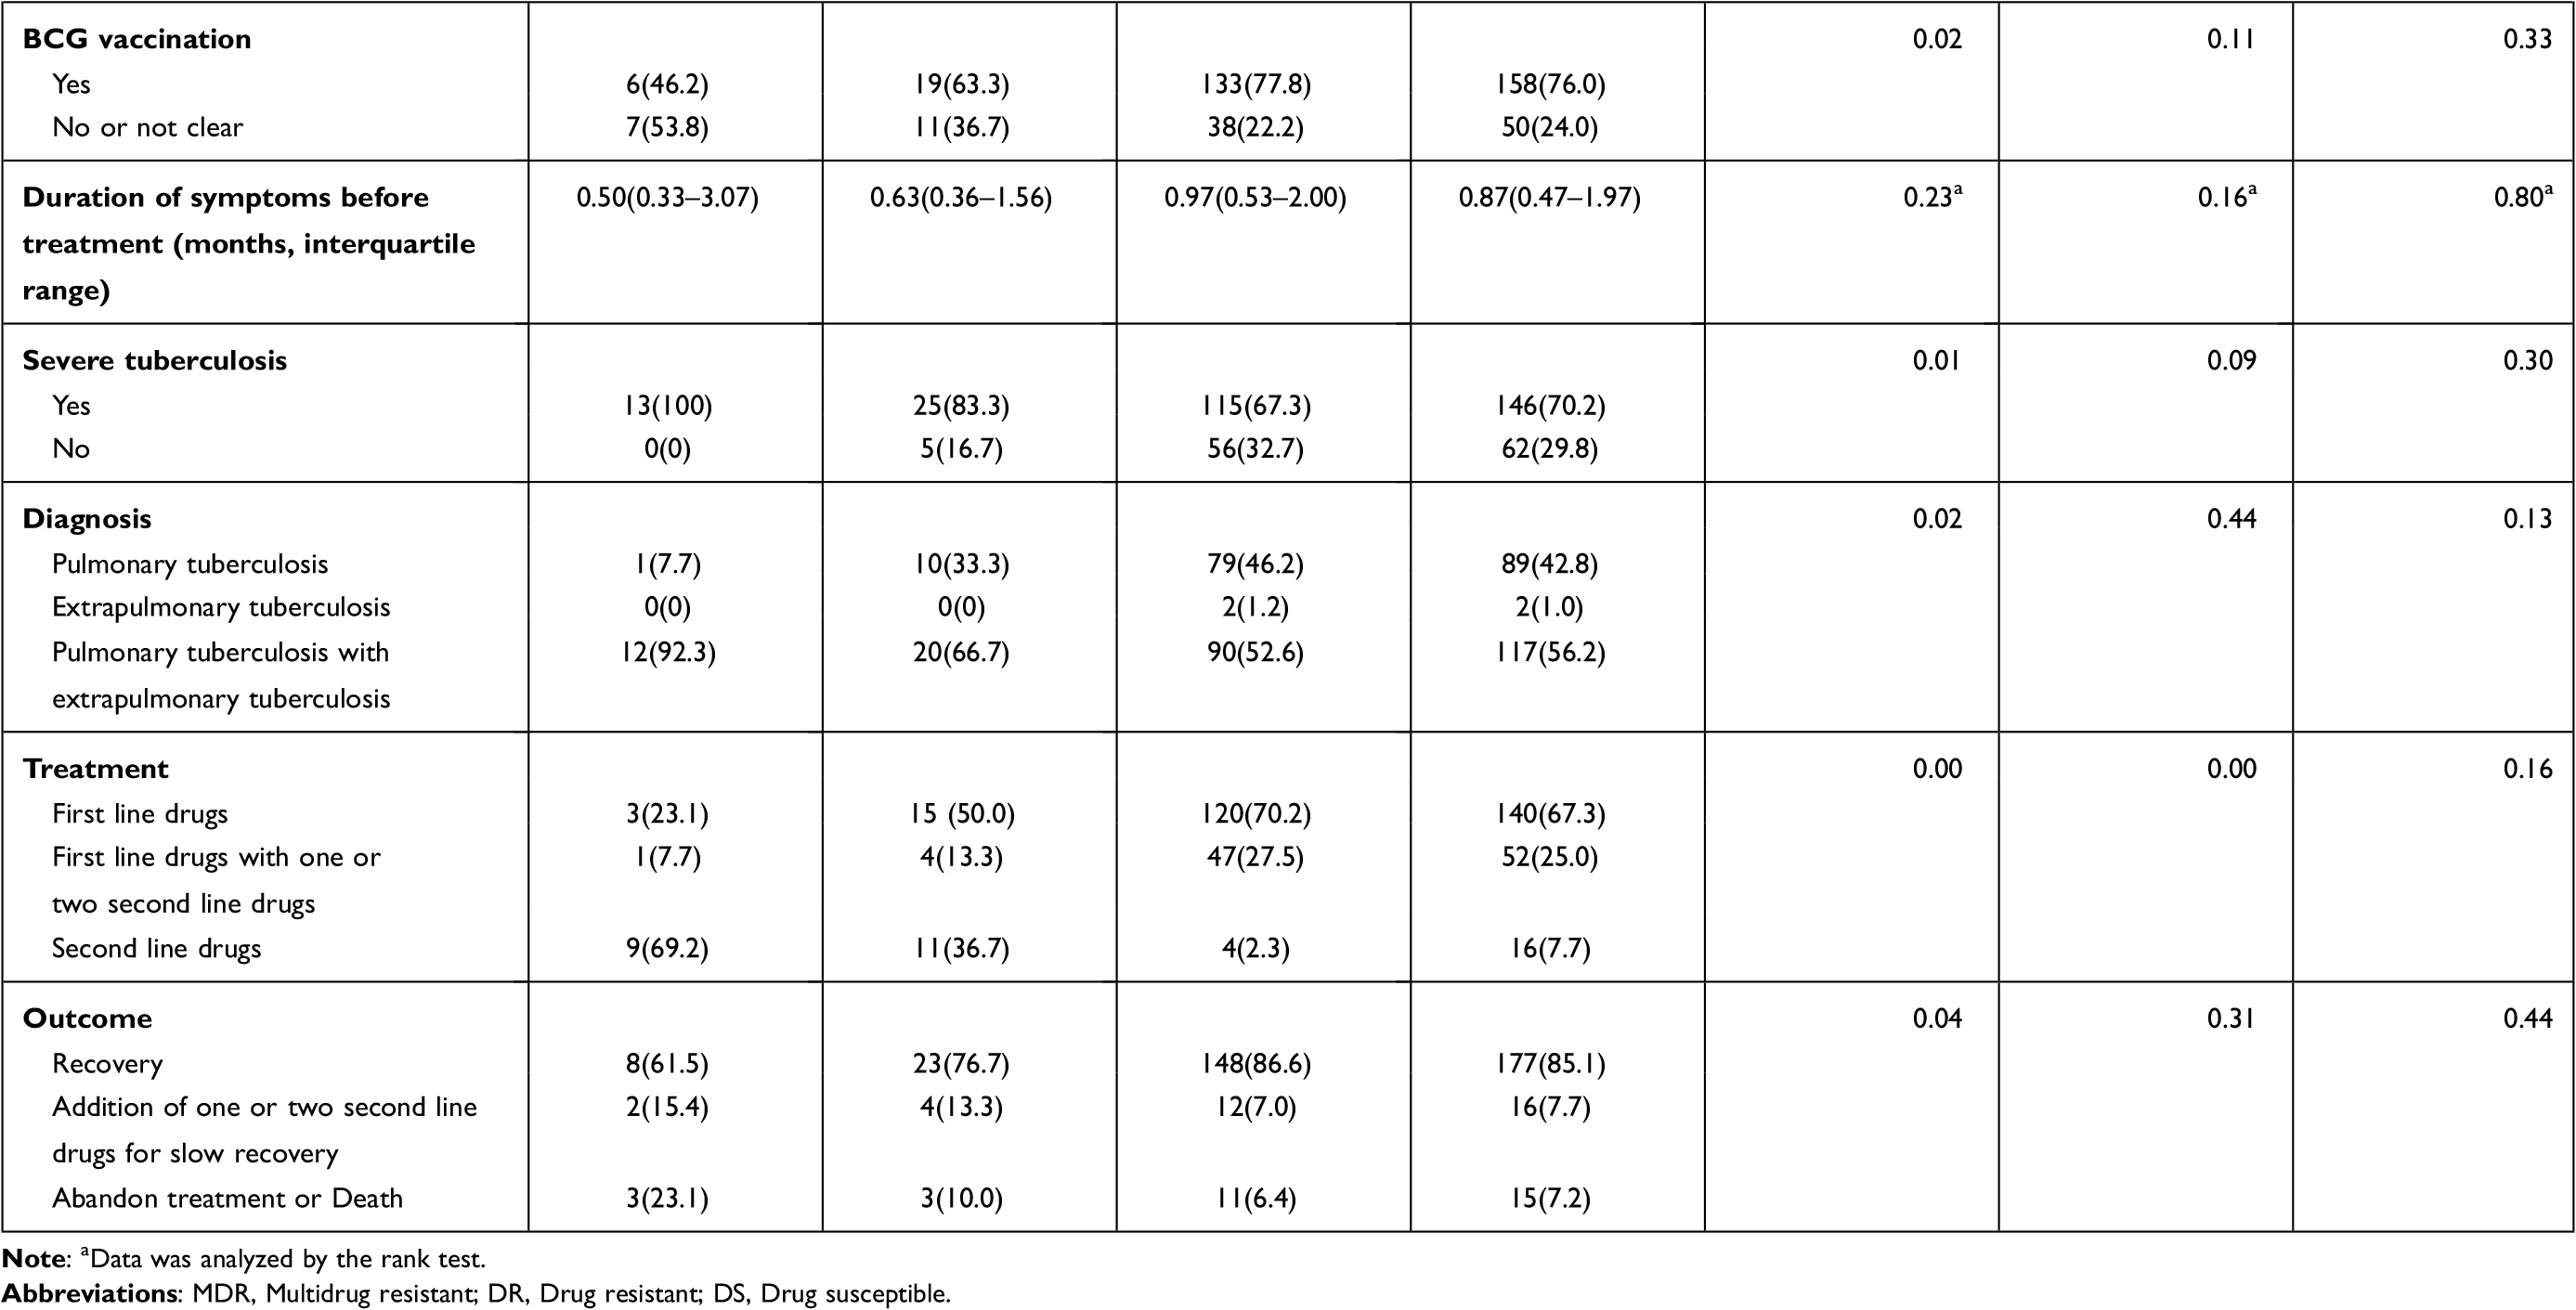 |
Table 4 Population Characteristics and Clinical Data of 208 Pediatric Tuberculosis Patients (n, %) |
In our study, all the patients were negative for HIV antigens in their serum. There were 112 (53.9%) males and 96 (46.2%) females. The overall male-to-female ratio was 1.17:1. Their ages ranged from 20 days to 17 years and 4 months, with a median of 9.78 years (the interquartile range was from 2.16 to 13.01 years). Moreover, 33.2% of the cases were in the 0–4 years age group, followed by 17.3% in the 5–9 years age group, 42.3% in the 10–14 years age group and 7.2% in the 15–18 years age group. Notably, the number of TB patients was relatively high among younger children (0–4 years old) and older children (10–14 years old). Additionally, 88.0% were of Han nationality, while 12.0% were of other nationalities including Tujia (n=10, 4.8%), Yi (n=5, 2.4%), Miao (n=5, 2.4%), Dong (n=2, 1.0%), Bouye (n=1, 0.5%), Dai (n=1, 0.5%) and Li (n=1, 0.5%). A total of 64.9% of patients lived in the countryside, and most of them (79.3%) came from Chongqing and Sichuan Provinces.
There was no significant difference in the distribution of admission time in each group, although approximately half of the patients (49.5%) were diagnosed in 2019 and 2020. A total of 36.8% of the DS group patients had a known history of contact with TB patients, compared to 53.8% of the MDR group patients, although no significant difference was found between the two groups. The median duration of symptoms before effective treatment was 26 days (ranging from 4 days to 15 months). In the MDR group, the median time was 15 days (ranging from 4 days to 6 months and 3 days).
In Table 4, it can be seen that there was a significant difference in the distribution of BCG vaccination history, severe TB status, diagnosis, treatment, and outcome between the MDR and DS groups and in treatment between the DR and DS groups. MDR patients had a lower BCG vaccination rate (46.15% in the MDR group vs 77.8% in the DS group). A total of 92.3% of MDR-TB patients were diagnosed with PTB and EPTB, which was higher than that in the DS group (52.6%). MDR-TB patients had a lower recovery rate than DS-TB patients (76.9% in the MDR group vs 93.6% in the DS group). There were more patients with severe TB in the MDR group than in the DS group (100% in the MDR group vs 67.3% in the DS group). Under the limited conditions, none of the positive mycobacterium strains were tested by phenotypic DST in a timely manner. The treatment plan of all patients was selected according to clinical experience. Fortunately, 10 patients in the DR group were treated with second-line drugs in time because of rifampicin resistance shown in Xpert results. Notably, 29.8% (51/171) of patients in the DS group were treated with second-line drugs for serious illness or serious side effects of drugs.
As shown in Table 5, no statistically significant difference was found in the distribution of sex, age, ethnicity, residential area, province of residence, admission time, previous TB history, history of contact with TB patients, history of BCG vaccination, duration of symptoms before effective treatment, severe TB status, diagnosis, and outcome between the lineage 2 and lineage 4 groups. However, the therapeutic schedule between the two groups was different (P=0.03).
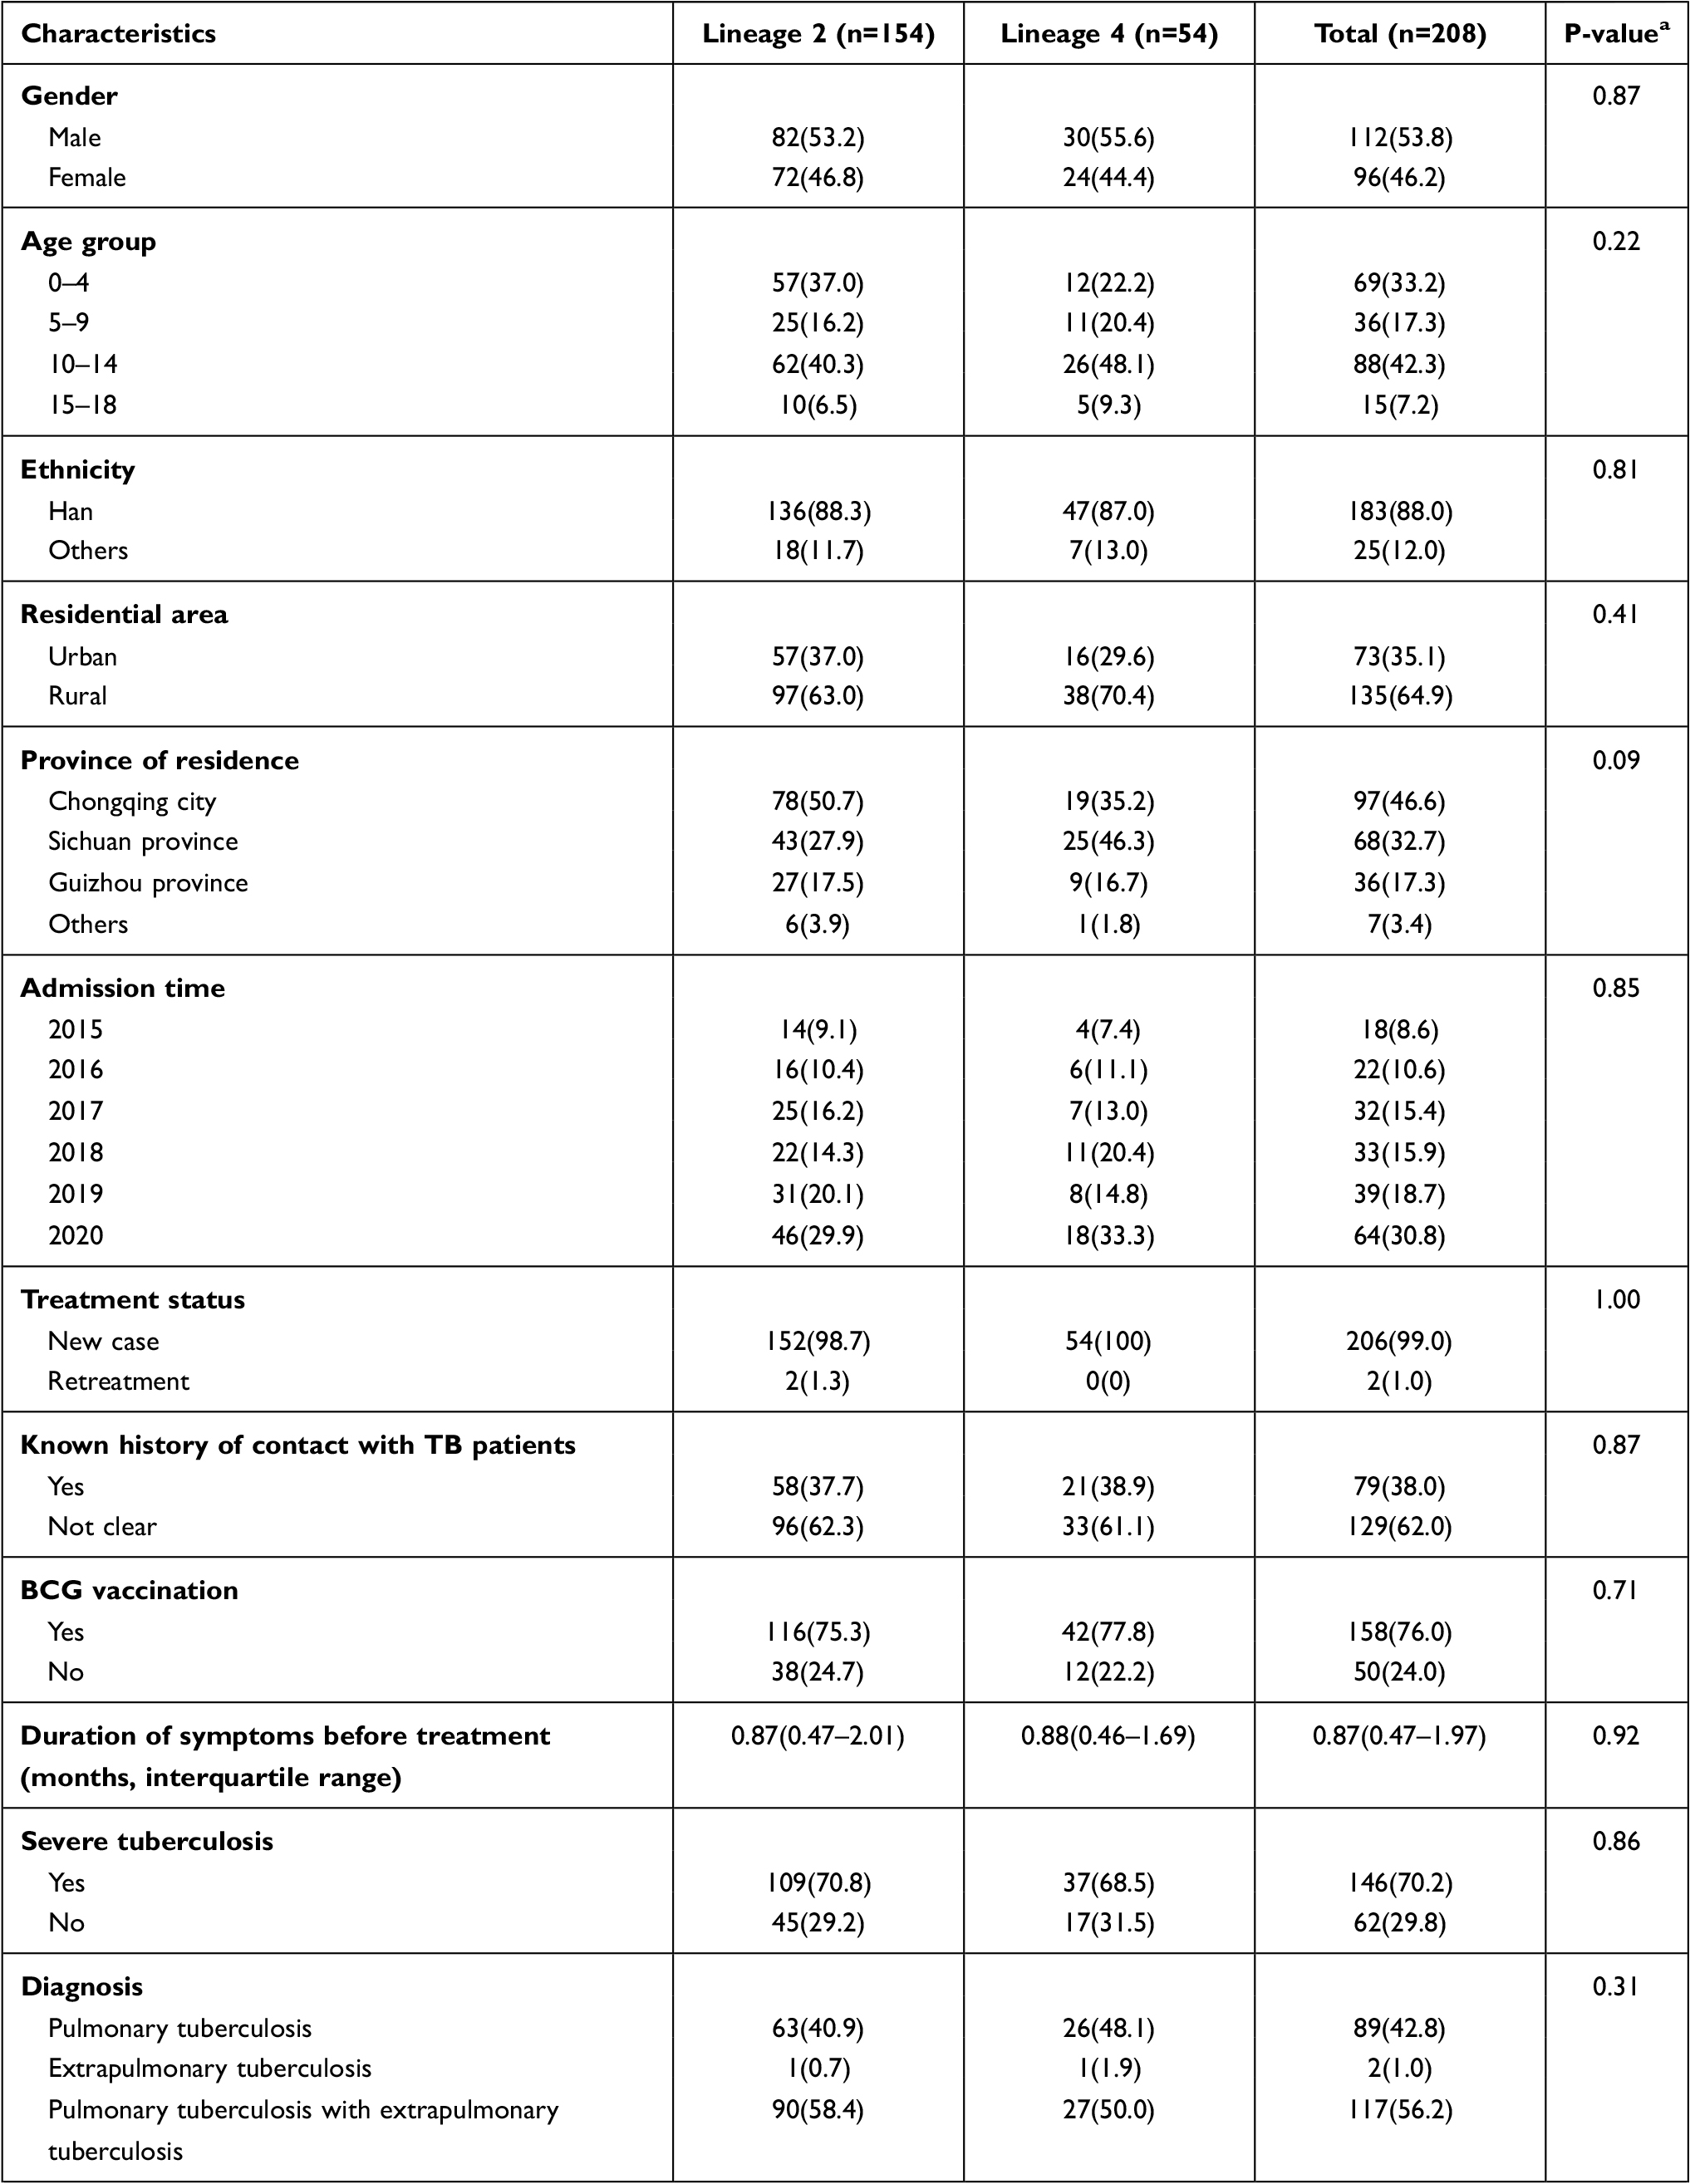 | 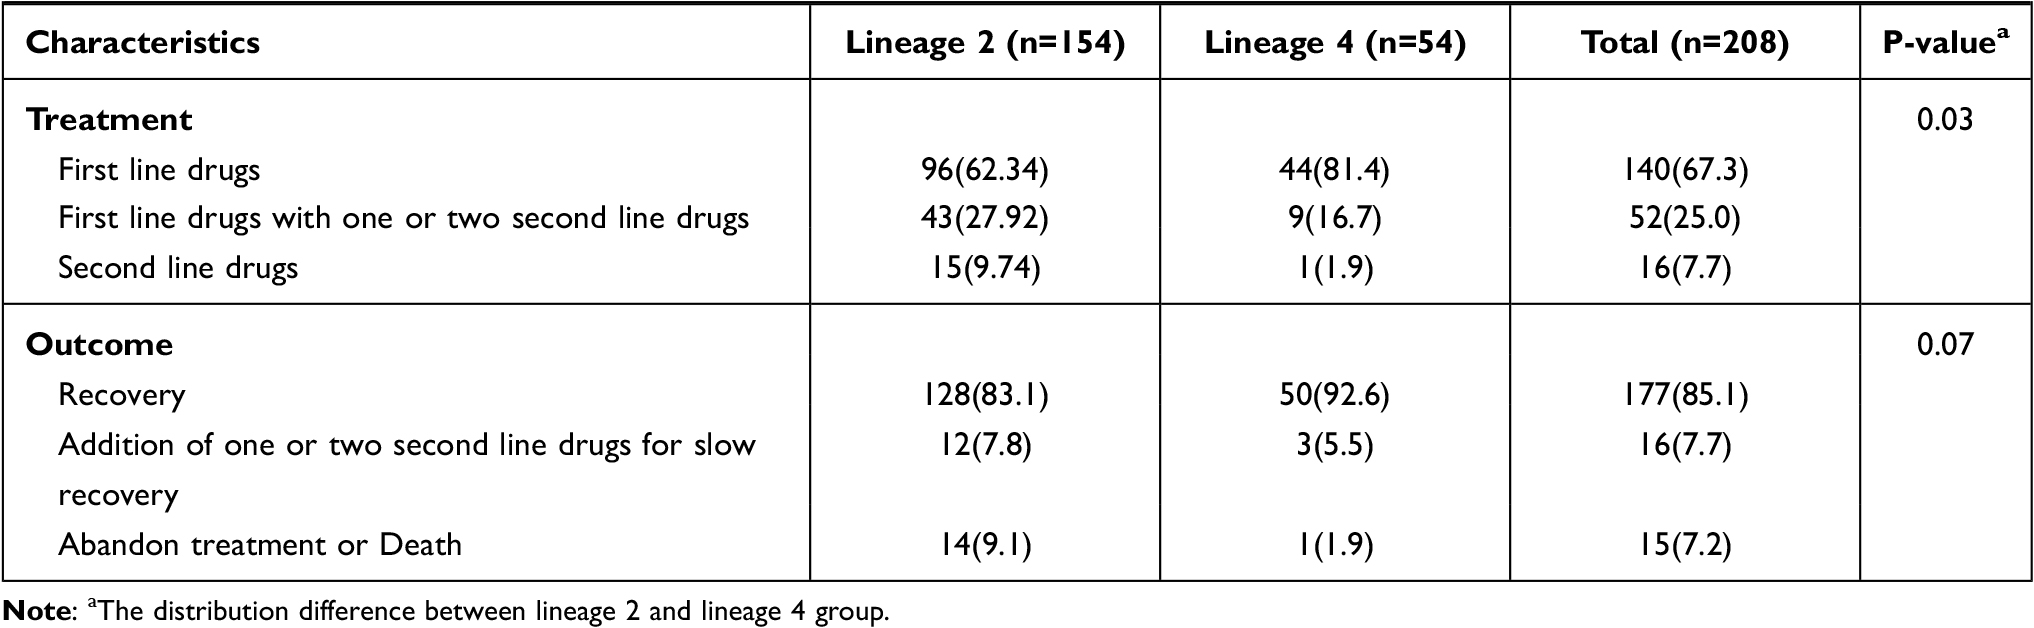 |
Table 5 The Distribution of Population Characteristics and Clinical Materials in Lineage 2 and Lineage 4 Groups (n, %) |
We further compared all the data between severe and nonsevere patients to further clarify the main reason for the different distributions of diagnosis, treatment and outcome. Significant differences were found in the distribution of diagnosis, treatment and outcome (P<0.05). A total of 76.0% of patients with severe TB were diagnosed with PTB and EPTB, which was more than the percentage of nonsevere patients (13.3%). Severe TB patients had a lower recovery rate than nonsevere TB patients (89.7% vs 100%). However, no significant difference was found in the distribution of the duration of symptoms before effective treatment between the two groups (shown in Table 6).
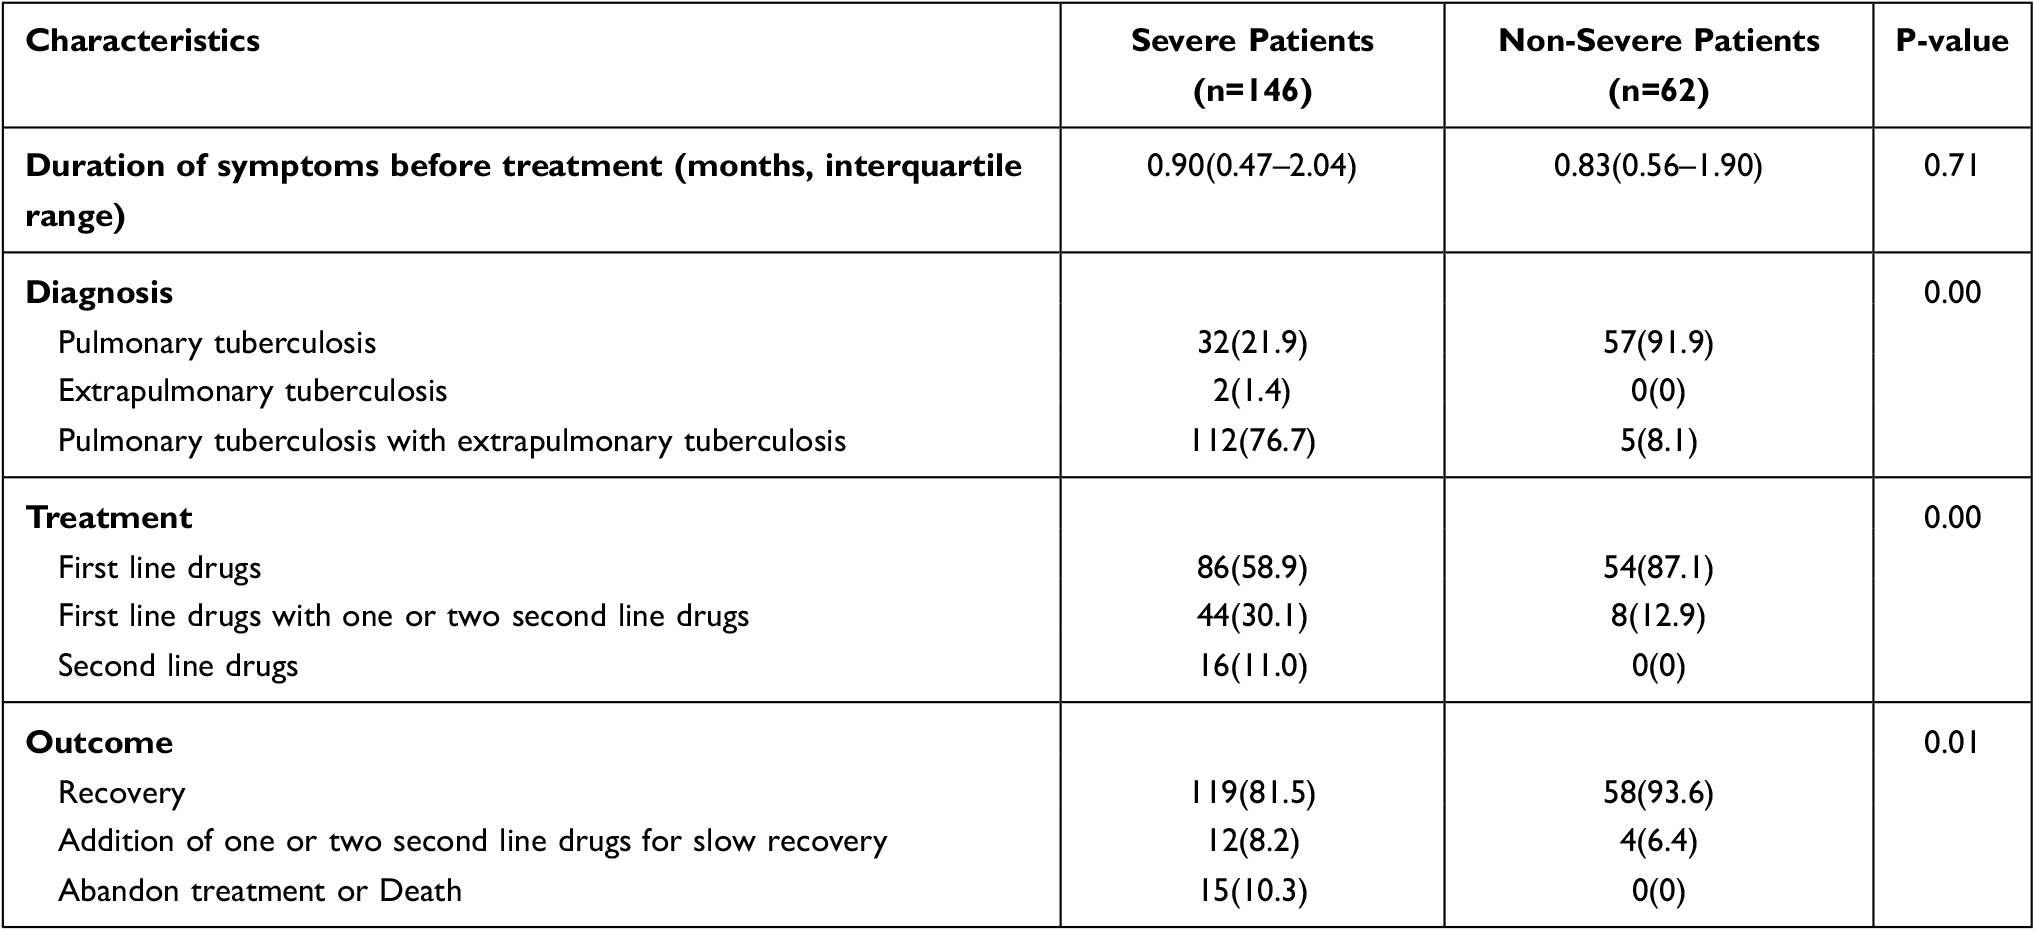 |
Table 6 The Distribution of Clinical Materials in Severe and Non-Severe Patients (n, %) |
Finally, a binary logistic regression model was constructed, with assignment descriptions: 1. MDR-TB (1=patients who met the definition of MDR-TB; 0= patients who did not meet the definition of MDR-TB); 2. DR-TB (1=patients who met the definition of DR-TB; 0= patients who did not meet the definition of DR-TB); and 3. PTB and EPTB (1=patients who met the definition of PTB and EPTB; 0= patients who did not meet the definition of PTB or EPTB). Lineage 2, sex, ethnicity, age, province of residence, residential area, admission time, known history of contact with TB patients, BCG vaccination, and treatment status were classified according to Table 4. As shown in Table 7, BCG vaccination was a protective factor against MDR-TB (OR=0.19), and MDR-TB was a risk factor for PTB and EPTB (OR=17.98).
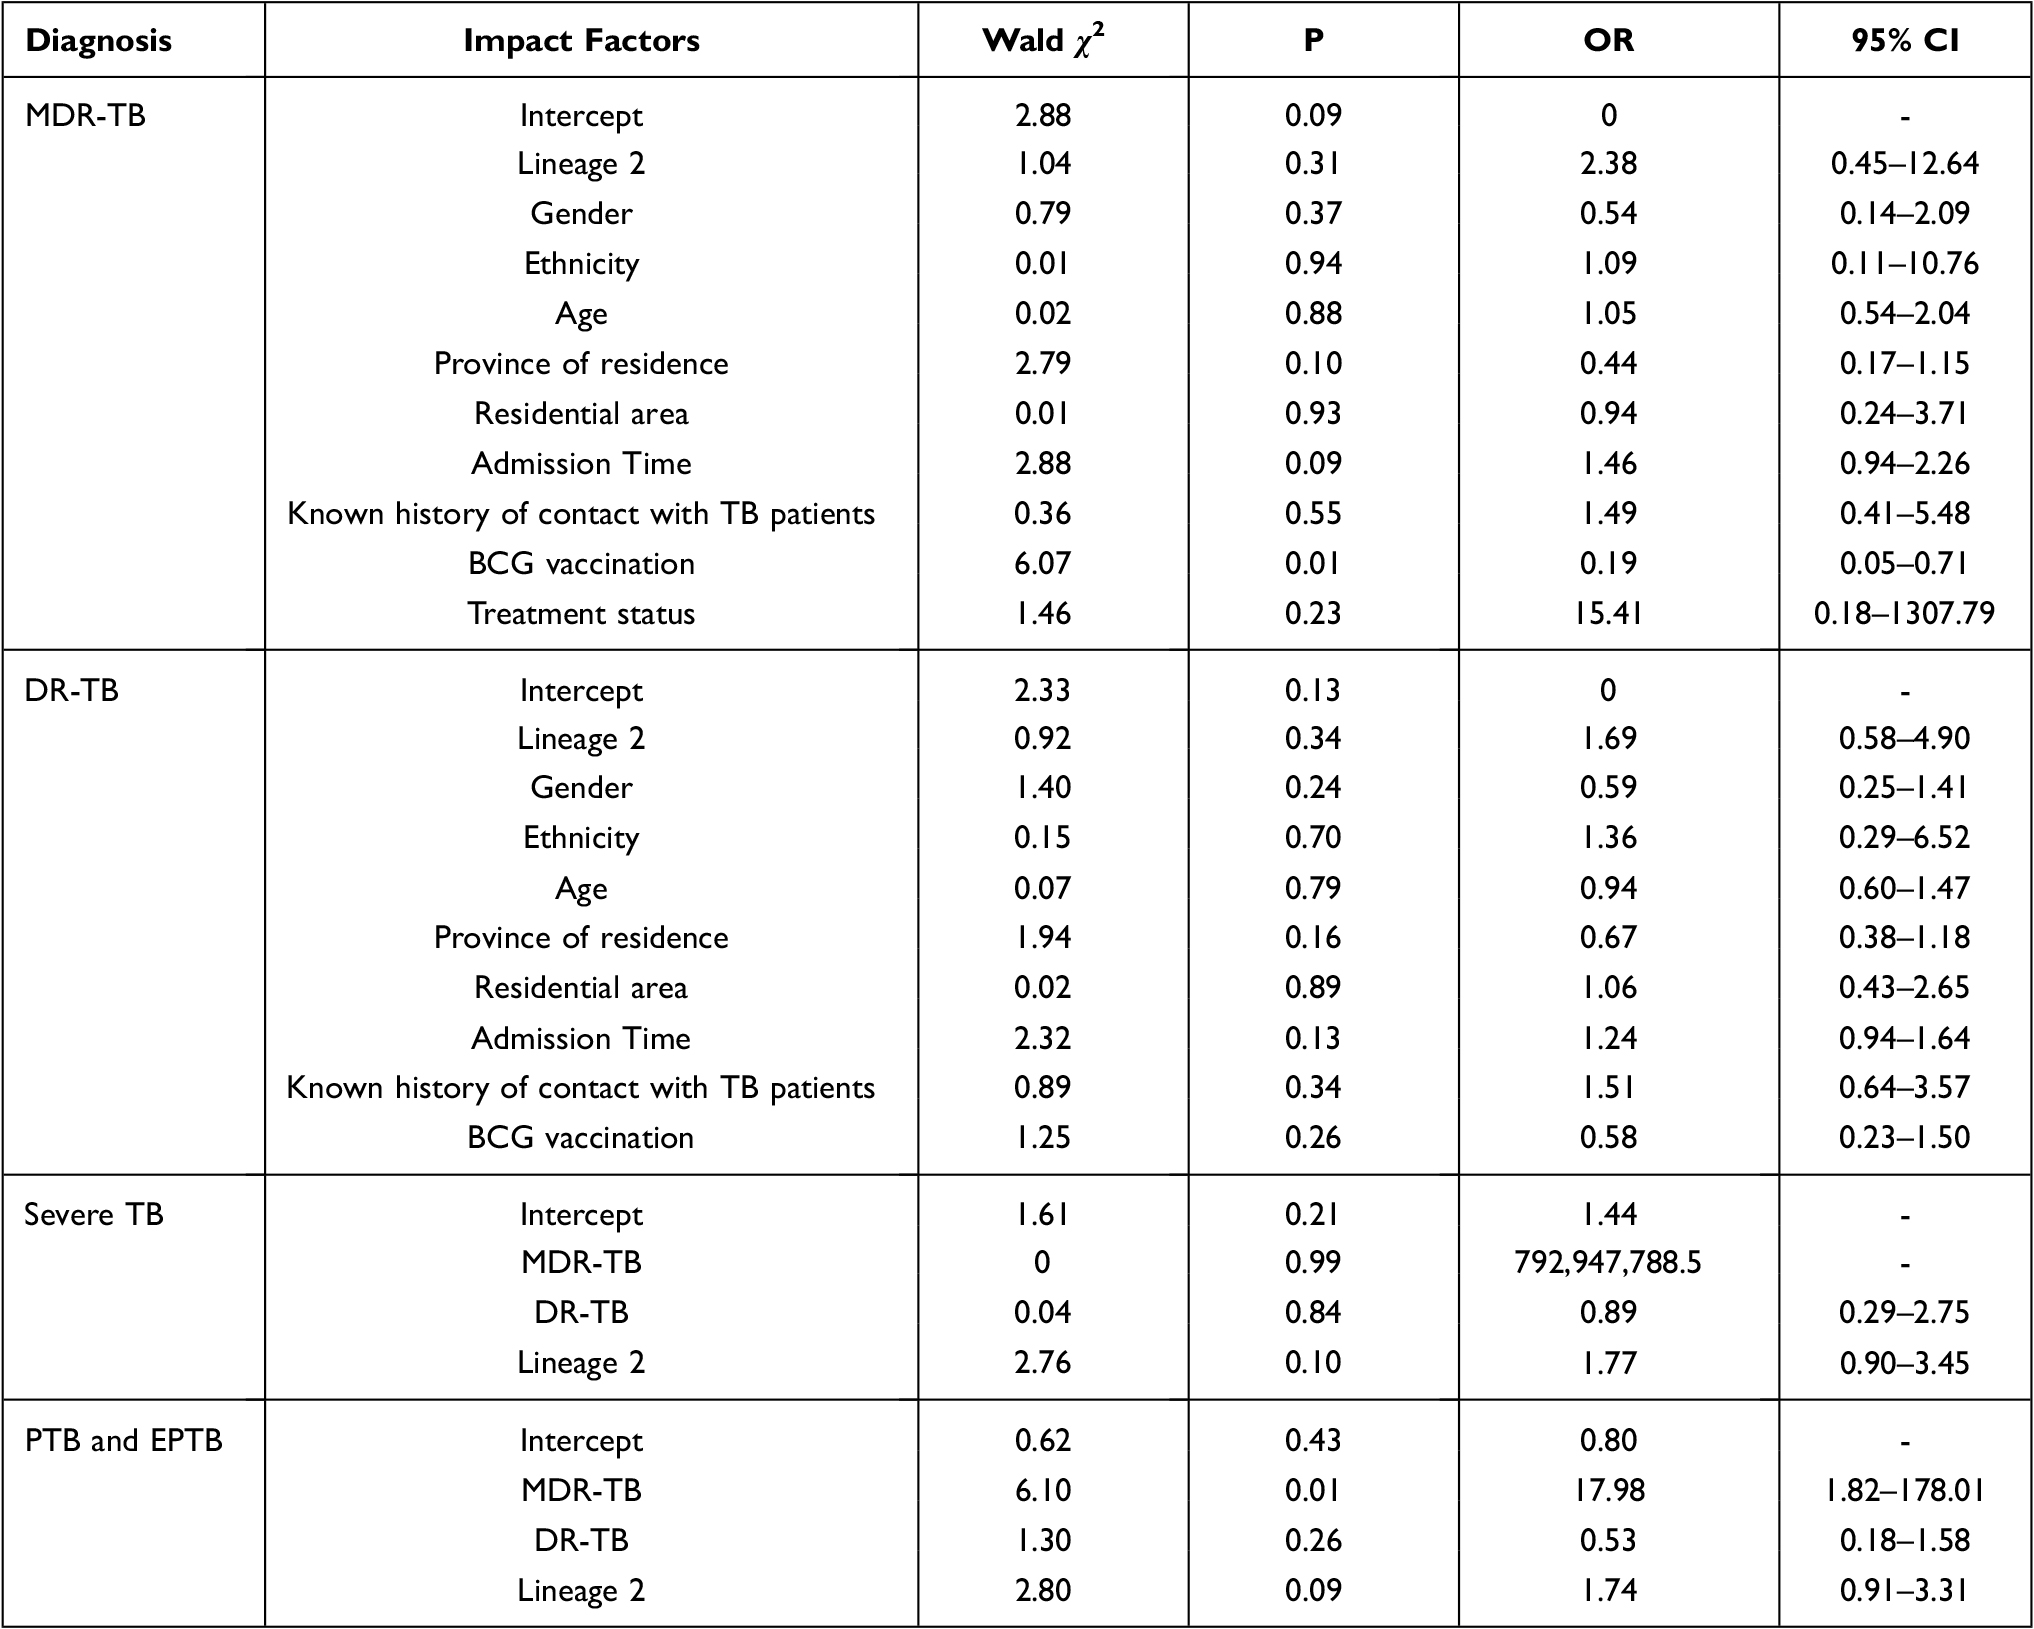 |
Table 7 Factors Associated with Different Diagnosis of Tuberculosis in Children |
Discussion
With the development of next-generation sequencing, WGS is widely used for Mtb diagnosis. Current WGS testing of most anti-TB drugs involves culturing the bacteria; however, recent work has shown that direct sequencing of respiratory samples has the potential to provide comprehensive resistance detection significantly faster than MGIT WGS or phenotypic testing of resistance from cultures in a clinical setting, with improved turnaround times enabling prompt appropriate treatment and associated patient and health service benefits.19,20 Current phenotypic pyrazinamide susceptibility testing in the BACTEC MGIT 960 system is unreliable, and false resistance is well documented, requiring genotypic methods in combination with phenotypic DSTs for confirmation of pyrazinamide-resistant Mtb isolates.21 Our study focused on the detection of Mtb resistance by WGS of samples from children.
In our study, the sensitivity and specificity for WGS to detect resistance to rifampicin and isoniazid was high, with sensitivity estimates of 100% (95% CI: 71.7–100%) and 84.0% (95% CI: 63.1–94.8%), while the specificity estimates of 98.5% (95% CI: 95.2–99.6%) and 98.4% (95% CI: 94.9–99.6%), respectively, were consistent with previous studies summarized by meta-analysis.22 WGS could well predict rifampicin and isoniazid resistance of Mtb in children. For second-line drugs, the kappa values of rifapentine, prothionamide, amikacin and FQs were higher than 0.80, indicating that the consistency of the ratio method and WGS was strong. WGS could also predict rifapentine, prothionamide, amikacin and FQ resistance of Mtb in children, and the results are basically consistent with previous studies.23 However, for rifapentine, prothionamide, amikacin and FQs, the 95% CI of sensitivity was wide because the Mtb isolates exhibiting resistance to these drugs represented a small sample size. The proportion of resistance attributed to transmission was highest among the ten commonly used first- and second-line drugs at 43% or more for isoniazid and 46% or more for rifamycin pooled across countries.24 Amplification of FQ and second-line injectable resistance among MDR isolates is estimated to have occurred very recently,24 leading to a low resistance rate of these drugs. Furthermore, levofloxacin is widely used for respiratory tract and other infections, and FQs are extensively used in adults who are subsequently diagnosed with TB, which might result in a high proportion of resistance to FQs in patients with TB.25 Mtb infection in children is mostly acquired from adult cases. Therefore, there were FQ-resistant strains in our cohort. For ethambutol, the PPV and the kappa value were low, in accordance with some past studies.22 Often, the phenotypes from conventional DSTs are assumed to be free from errors, and this can invariably confound the identification of resistance-conferring genomic sites, especially for ethambutol, where the DST error rates have been reported to be higher.12 As a result, the prediction of ethambutol resistance by WGS is controversial.
The molecular diagnostic techniques for TB drug resistance detection are based on the mutation sites of related drug resistance genes. Although next-generation sequencing produces mass data, several databases, such as PATRIC and ReSeqTB, possess both the genomic sequences and DST phenotypes of thousands of infectious Mtb isolates from different parts of the world, and these databases have facilitated the identification of genetic sites associated with drug resistance.26 Drug resistance prediction software such as TB Profiler, MyKrobe, KvarQ and PhyResSE rely on these genomic sites to predict the drug resistance profile of an Mtb genome for the range of anti-TB agents.26 In this study, we analyzed the differential distribution of mutation sites related to drug resistance in drug-resistant and drug-susceptible strains according to WGS. There were 3 strains resistant to isoniazid according to WGS but susceptible according to the ratio method DST. The mutations katG Ser315Thr, katG Ser140Asn, and ahpC −54C>T were found in these strains. A previous study indicated that katG codon 315 mutations are associated with high-level resistance to isoniazid, while mutations in the inhA regulatory region confer low-level resistance to isoniazid.27 The most common mutation linked to isoniazid resistance in our study was katG Ser315Thr (76.0%), suggesting that a high level of isoniazid might not be suitable for the treatment of isoniazid-resistant TB. The katG Ser315Thr mutation, conferring resistance to isoniazid, overwhelmingly arose before rifampicin resistance across all lineages, geographic regions, and time periods.28 Additional attention should be given to isoniazid-resistant mutations because the emergence of global multidrug resistance is due to the increase in rifampicin resistance in the context of isoniazid resistance.28 The katG Ser140Asn and ahpC −54C>T mutations were not associated with isoniazid resistance in our study; however, they were found in isoniazid-resistant strains in Anwaierjiang et al’s study.29 The sample size of our study was small, meaning that it could not fully confirm the function of many mutation sites. Prothionamide, an analog of ethionamide, is an orally available second-line agent frequently incorporated into regimens for MDR-TB.30 There were cross-resistance mutation sites between isoniazid and prothionamide. In our study, 50.0% of prothionamide-resistant isolates shared the same mutation sites as isoniazid-resistant isolates; hence, prothionamide susceptibility should be confirmed by DST for the treatment of MDR or isoniazid-resistant TB.
Rifampicin’s known mechanism of bacterial growth inhibition occurs through the suppression of RNA synthesis by binding of the drug to the β subunit of RNA polymerase, RpoB.31 Mtb gains rifampicin resistance primarily through rpoB mutations, and more than 95% of these mutations are present within an 81 bp rifampicin resistance-determining region (RRDR, corresponding to codons 426–452 in Mtb and codons 507–533 in E. coli).32 Mutations in codons 450, 445 and 435 are common among clinical rifampicin-resistant isolates; of these mutations, S450L occurs most frequently.32 The mutation site in the rpoB gene belongs to the 81 bp RRDR in our study. The mutations rpoB His445Leu and rpoB Leu430Pro were not associated with rifampicin resistance. However, the strain carrying rpoB His445Leu was resistant to rifapentine. In a recent study, rpoB Leu430Pro was found in rifampicin-resistant strains.29 This mutation may be related to the activity of the strain. Studies have shown that rpoB expression is upregulated in XDR-TB strains that are exposed to rifampicin.31 RNA expression needs to be further tested to explore the reason.
Although ethambutol resistance is phenotypically unstable in phenotypic DSTs, there were still differences in the distribution of embB mutation sites in our study. The mutations embB Gly406Ser, Ala356Val and Ser380Asn were not related to ethambutol resistance in our study. In recent studies, embB Gly406Ser was found in ethambutol-resistant Mtb strains.29,33 The mutations embB Ala356Val and Ser380Asn are rare, and their functions need to be verified via additional investigation.
FQs act by binding to DNA gyrase and preventing negative supercoiling of replicating DNA.34 Mutations in the gyrA and gyrB genes, particularly in the quinolone resistance-determining region (QRDR) of gyrA (codons 74 to 113) and gyrB (codons 500 to 540), are the main reason for FQ resistance in Mtb.35 In our study, all the mutations were present in FQ-resistant strains. gyrB Thr500Asp was found in levofloxacin- and moxifloxacin-resistant strains in a recent study.35 However, the function of gyrB Asn502Asp in Mycobacterium leprae (Asn499Asp in Mtb) has been proven to be associated with FQ resistance.36 In recent studies, the mutation was not found in FQ-resistant strains.34,35,37 Additional experiments are needed to verify the function of this mutation in Mtb.
Strain concordance between child contact and adult index cases has been reported to be as high as 88%.38 In our case, 37.98% of patients had a clear history of TB exposure with their family members, and 99.04% of patients were not previously treated with anti-TB drugs. In our study, 6.25% of Mtb strains were resistant to rifampicin, all of which were MDR-TB, conforming to 7.1% (5.6–8.7%) of new cases with MDR/RR-TB estimated in China.2 Our data should mainly reflect the current situation of drug resistance in Southwest China.
There were five sublineages in our study, namely, lineages 2.2.1 and 2.2.2, which both belong to the Beijing family; lineage 4.2.2, which belongs to the LAM7-TUR and T1 families; lineage 4.4, which belongs to the T1 and T2 families; and lineage 4.5, which belongs to the H3, H4, and T1 families.39 In total, 74.04% of strains belonged to the Beijing family. The difference in lineage distribution between lineage 2 and lineage 4 in the DS and DR groups was statistically significant. However, there was no significant difference between the MDR group and DS group. Binary logistic regression showed that lineage 2 was not a risk factor for MDR-TB and DR-TB in children. Previously, it has been reported that the most predominant MDR-TB strains in China were lineage 2 Beijing strains,40 although other surveys have indicated that the Beijing genotype was less associated with drug resistance.41,42 A meta-analysis found that Beijing was associated with higher drug resistance in 43.5% of all included studies.43 Further research is required to focus on the evolution mechanism of drug resistance in Beijing strains to clarify the relationship between the Beijing family and DR-TB.
Beijing strains have unique properties that explain their widespread distribution, such as efficient dissemination, increased virulence, and an increased chance of drug resistance.42 In a systematic review and meta-analysis study, 46 studies were included, containing 42,700 patients from 27 countries, which found that the Beijing lineage was the most predominant and highly clustered strain in 72.4% of the studies and had a higher likelihood of transmission than non-Beijing lineages.43 However, DS, DR and MDR strains did not show an obviously different distribution of provinces or admission times in our study. This result might be related to the single-center sample of this study. Nevertheless, the notification rate of TB has been substantially higher in rural communities in China than in urban communities, indicating that internal migration from rural communities increases notifications and transmission of TB in cities.44
Previous studies have indicated that BCG vaccination could decrease the risk of severe TB.45 In our study, the distribution of BCG vaccination was different in the MDR and DS groups, and BCG vaccination was a protective factor against MDR-TB in children. However, this result might be caused by 100% of patients in the MDR group having severe TB. Additional research is needed to confirm the relationship between BCG vaccination and MDR-TB.
There was a significant difference in the distribution of severe TB between the MDR, DR and DS groups and there were more patients with severe TB in the MDR and DR groups than in the DS group (P<0.05), but no statistically significant difference was found in the distribution of severe TB between lineages 2 and 4, indicating that MDR-TB might be more likely to cause severe TB in children, regardless of the genotype. However, MDR-TB, DR-TB and lineage 2 were not related to severe TB according to the logistic regression results. More research was needed to clarify the relationship between the MDR-TB and severe TB. In the diagnosis distribution, more patients were diagnosed with PTB and EPTB in the MDR group than in the DS group (P<0.05). MDR-TB is a risk factor for PTB and EPTB in children. The risk of PTB combined with EPTB in MDR-TB patients was 17.89 times higher than that in non-MDR-TB patients. MDR-TB is not limited to pulmonary infection and is more likely to infect children’s extrapulmonary organs. Consequently, MDR-TB might spread to and infect additional organs in children. It is now recognized that TB represents a dynamic continuum from a robust immunologic response, wherein all infecting bacteria are cleared sometimes even without stimulation of acquired immunity, to uncontrolled bacterial replication and fulminant (disseminated) disease.46 Additional research is required on the changes in immunity and the adaptation of MDR-TB in children.
In the absence of preventive therapy, young children have a high risk of rapid disease progression after primary infection and can develop severe forms of tuberculosis.46 In our study, there was a significant difference in the distribution of treatment and outcome between each group. Severe TB could be diagnosed at a median time of 27 days, similar to the time of diagnosis for non-severe TB patients, which might be the reason why patients with severe TB had a lower recovery rate. The median time of symptom duration before effective treatment was 27 days.
We acknowledge several limitations to this research. First, the Mtb strains were recovered for this study instead of clinical isolates. Nearly 80 strains were not recovered successfully, leading to an abundance of missing raw data. TB is normally caused by infection with a single strain of Mtb, but molecular genotyping methods have proven that a patient could be infected with multiple genetically distinct strains.47 Despite the small amount of Mtb in the sputum of children with TB, most of the culture-based results may identify a single species, and recovered Mtb strains may be biased for phenotypic DST assessment. Second, pyrazinamide and linezolid were missing in this trial because the ratio method could not have been used to identify drug sensitivity for these two commonly used anti-TB drugs in children. Third, the number of amikacin-resistant TB cases in this study was small, which may have caused bias in the results, although the sensitivity and specificity were high. Most pediatric TB patients received first-time treatment, causing a low drug resistance rate.
Conclusion
The BCG vaccine is a protective factor for MDR-TB, and MDR-TB might not be confined to pulmonary infection, spreading to extrapulmonary organs in children. MDR-TB had more severe cases and a lower recovery rate than drug-susceptible TB. WGS could provide an accurate prediction of drug sensitivity test results for anti-TB drugs, which are needed for the diagnosis and precise treatment of TB in children.
Data Sharing Statement
The raw data in this paper could be obtained in the Supplementary Tables 1–5. The raw data of Whole-genome sequencing used in this research are available from the corresponding author on reasonable request.
Ethical Approval Statement
The research received ethical approval from the Medical Ethics Committee of the Children’s Hospital of Chongqing Medical University [(2021)Year Lun Shen(Yan) Di (29)Hao)] and was conducted in accordance with the Declaration of Helsinki. As the study was based on a retrospective review of anonymous medical records and did not involve patient interaction, individual consent was not required.
Funding
This study was supported by the Outstanding young talents fund of Children’s Hospital of Chongqing Medical University (RC02017), the Natural Science Foundation of Chongqing City (cstc2020jcyj-msxmX0580), the General project of clinical medicine research of National Center for clinical medicine of child health and disease (NCRCCHD-2020-GP-06) and the Chongqing graduate scientific research innovation project (CYB20157).
Disclosure
The authors report no conflicts of interest in this work.
References
1. Furin J. Advances in the diagnosis, treatment, and prevention of tuberculosis in children. Expert Rev Respir Med. 2019;13(3):301–311. doi:10.1080/17476348.2019.1569518
2. World Health Organization. Global tuberculosis report 2020. Geneva: World Health Organization; 2020.
3. Jenkins HE, Yuen CM. The burden of multidrug-resistant tuberculosis in children. Int J Tuberc Lung Dis. 2018;22(5):3–6. doi:10.5588/ijtld.17.0357
4. Cruz AT, Garcia-Prats AJ, Furin J, Seddon JA. Treatment of multidrug-resistant tuberculosis infection in children. Pediatr Infect Dis J. 2018;37(10):1061–1064. doi:10.1097/INF.0000000000002135
5. Dunn JJ, Starke JR, Revell PA. Laboratory diagnosis of Mycobacterium tuberculosis infection and disease in children. J Clin Microbiol. 2016;54(6):1434–1441. doi:10.1128/JCM.03043-15
6. Yang R, Liu M, Jiang H, et al. The epidemiology of pulmonary tuberculosis in children in Mainland China, 2009–2015. Arch Dis Child. 2020;105(4):319–325. doi:10.1136/archdischild-2019-317635
7. World Health Organization. Rapid communication: molecular assays as initial tests for the diagnosis of tuberculosis and rifampicin resistance. Geneva: World Health Organization; 2020.
8. Kay AW, Gonzalez Fernandez L, Takwoingi Y, et al. Xpert MTB/RIF and xpert MTB/RIF ultra assays for active tuberculosis and rifampicin resistance in children. Cochrane Database Syst Rev. 2020;8:CD013359.
9. Jenkins HE, Yuen CM, Rodriguez CA, et al. Mortality in children diagnosed with tuberculosis: a systematic review and meta-analysis. Lancet Infect Dis. 2017;17(3):285–295. doi:10.1016/S1473-3099(16)30474-1
10. Gygli SM, Keller PM, Ballif M, et al. Whole-genome sequencing for drug resistance profile prediction in Mycobacterium tuberculosis. Antimicrob Agents Chemother. 2019;63(4). doi:10.1128/AAC.02175-18
11. Zhao Yan Lin PY. The test procedures of tuberculosis diagnostic laboratory. People’s Medical Publishing House. 2015:1–127.
12. World Health Organization. Companion handbook to the WHO guidelines for the programmatic management of drug-resistant tuberculosis. Geneva; 2014.
13. Otchere ID, Asante-Poku A, Osei-Wusu S, et al. Detection and characterization of drug-resistant conferring genes in Mycobacterium tuberculosis complex strains: a prospective study in two distant regions of Ghana. Tuberculosis. 2016;99:147–154. doi:10.1016/j.tube.2016.05.014
14. Chen S, Zhou Y, Chen Y, Gu J. fastp: an ultra-fast all-in-one FASTQ preprocessor. Bioinformatics. 2018;34(17):i884–i890. doi:10.1093/bioinformatics/bty560
15. Garrison E, Marth G. Haplotype-based variant detection from short-read sequencing. arXiv Preprint arXiv 1207 3907; 2012.
16. Wiseman CA, Gie RP, Starke JR, et al. A proposed comprehensive classification of tuberculosis disease severity in children. Pediatr Infect Dis J. 2012;31(4):347–352. doi:10.1097/INF.0b013e318243e27b
17. Avaliani Z, Gozalov O, Kuchukhidze G, et al. What is behind programmatic treatment outcome definitions for tuberculosis? Eur Respir J. 2020;56(1):2001751. doi:10.1183/13993003.01751-2020
18. McHugh ML. Interrater reliability: the kappa statistic. Biochem Med. 2012;22(3):276–282. doi:10.11613/BM.2012.031
19. Doyle RM, Burgess C, Williams R, et al. Direct whole-genome sequencing of sputum accurately identifies drug-resistant Mycobacterium tuberculosis faster than MGIT culture sequencing. J Clin Microbiol. 2018;56(8). doi:10.1128/JCM.00666-18
20. Votintseva AA, Bradley P, Pankhurst L, et al. Same-day diagnostic and surveillance data for tuberculosis via whole-genome sequencing of direct respiratory samples. J Clin Microbiol. 2017;55(5):1285–1298. doi:10.1128/JCM.02483-16
21. Mok S, Roycroft E, Flanagan PR, et al. Overcoming the challenges of pyrazinamide susceptibility testing in clinical Mycobacterium tuberculosis isolates. Antimicrob Agents Chemother. 2021;65(8). doi:10.1128/AAC.02617-20
22. Papaventsis D, Casali N, Kontsevaya I, Drobniewski F, Cirillo DM, Nikolayevskyy V. Whole genome sequencing of Mycobacterium tuberculosis for detection of drug resistance: a systematic review. Clin Microbiol Infect. 2017;23(2):61–68. doi:10.1016/j.cmi.2016.09.008
23. Walker TM, Kohl TA, Omar SV, et al. Whole-genome sequencing for prediction of Mycobacterium tuberculosis drug susceptibility and resistance: a retrospective cohort study. Lancet Infect Dis. 2015;15(10):1193–1202. doi:10.1016/S1473-3099(15)00062-6
24. Ektefaie Y, Dixit A, Freschi L, Farhat MR. Globally diverse Mycobacterium tuberculosis resistance acquisition: a retrospective geographical and temporal analysis of whole genome sequences. Lancet Microbe. 2021;2(3):e96–e104. doi:10.1016/S2666-5247(20)30195-6
25. Lu Z, Jiang W, Zhang J, et al. Drug resistance and epidemiology characteristics of multidrug-resistant tuberculosis patients in 17 provinces of China. PLoS One. 2019;14(11):e0225361. doi:10.1371/journal.pone.0225361
26. Ngo TM, Teo YY. Genomic prediction of tuberculosis drug-resistance: benchmarking existing databases and prediction algorithms. BMC Bioinform. 2019;20(1):68. doi:10.1186/s12859-019-2658-z
27. Huo F, Lu J, Zong Z, et al. Change in prevalence and molecular characteristics of isoniazid-resistant tuberculosis over a 10-year period in China. BMC Infect Dis. 2019;19(1):689. doi:10.1186/s12879-019-4333-4
28. Manson AL, Cohen KA, Abeel T, et al. Genomic analysis of globally diverse Mycobacterium tuberculosis strains provides insights into the emergence and spread of multidrug resistance. Nat Genet. 2017;49(3):395–402. doi:10.1038/ng.3767
29. Anwaierjiang A, Wang Q, Liu H, et al. Prevalence and molecular characteristics based on whole genome sequencing of Mycobacterium tuberculosis resistant to four anti-tuberculosis drugs from Southern Xinjiang, China. Infect Drug Resist. 2021;14:3379–3391. doi:10.2147/IDR.S320024
30. Hicks ND, Carey AF, Yang J, Zhao Y, Fortune SM. Bacterial genome-wide association identifies novel factors that contribute to ethionamide and prothionamide susceptibility in Mycobacterium tuberculosis. MBio. 2019;10(2):e00616–e00619.
31. Udhaya Kumar S, Saleem A, Thirumal Kumar D, et al. A systemic approach to explore the mechanisms of drug resistance and altered signaling cascades in extensively drug-resistant tuberculosis. Adv Protein Chem Struct Biol. 2021;127:343–364.
32. Ma P, Luo T, Ge L, et al. Compensatory effects of M. tuberculosis rpoB mutations outside the rifampicin resistance-determining region. Emerg Microbes Infect. 2021;10(1):743–752. doi:10.1080/22221751.2021.1908096
33. Wu X, Gao R, Shen X, et al. Use of whole-genome sequencing to predict Mycobacterium tuberculosis drug resistance in Shanghai, China. Int J Infect Dis. 2020;96:48–53. doi:10.1016/j.ijid.2020.04.039
34. Maruri F, Guo Y, Blackman A, van der Heijden YF, Rebeiro PF, Sterling TR. Resistance-conferring mutations on whole-genome sequencing of fluoroquinolone-resistant and -susceptible Mycobacterium tuberculosis isolates: a proposed threshold for identifying resistance. Clin Infect Dis. 2021;72(11):1910–1918. doi:10.1093/cid/ciaa496
35. Hameed HMA, Tan Y, Islam MM, et al. Phenotypic and genotypic characterization of levofloxacin- and moxifloxacin-resistant Mycobacterium tuberculosis clinical isolates in southern China. J Thorac Dis. 2019;11(11):4613–4625. doi:10.21037/jtd.2019.11.03
36. Yokoyama K, Kim H, Mukai T, Matsuoka M, Nakajima C, Suzuki Y. Impact of amino acid substitutions in B subunit of DNA gyrase in Mycobacterium leprae on fluoroquinolone resistance. PLoS Negl Trop Dis. 2012;6(10):e1838. doi:10.1371/journal.pntd.0001838
37. Momen G, Aainouss A, Lamaammal A, et al. Molecular characterization of mutations associated with resistance to second line drugs in Mycobacterium tuberculosis patients from Casablanca, Morocco. Rev Inst Med Trop Sao Paulo. 2021;63:e19. doi:10.1590/s1678-9946202163019
38. Parr JB, Mitnick CD, Atwood SS, Chalco K, Bayona J, Becerra MC. Concordance of resistance profiles in households of patients with multidrug-resistant tuberculosis. Clin Infect Dis. 2014;58(3):392–395. doi:10.1093/cid/cit709
39. Barbier M, Wirth T. The evolutionary history, demography, and spread of the Mycobacterium tuberculosis complex. Microbiol Spectr. 2016;4:4. doi:10.1128/microbiolspec.TBTB2-0008-2016
40. Huang H, Ding N, Yang T, et al. Cross-sectional whole-genome sequencing and epidemiological study of multidrug-resistant Mycobacterium tuberculosis in China. Clin Infect Dis. 2019;69(3):405–413. doi:10.1093/cid/ciy883
41. Liu H, Zhang Y, Liu Z, et al. Associations between Mycobacterium tuberculosis Beijing genotype and drug resistance to four first-line drugs: a survey in China. Front Med. 2018;12(1):92–97. doi:10.1007/s11684-017-0610-z
42. Zhao LL, Li MC, Liu HC, et al. Beijing genotype of Mycobacterium tuberculosis is less associated with drug resistance in south China. Int J Antimicrob Agents. 2019;54(6):766–770. doi:10.1016/j.ijantimicag.2019.08.005
43. Karmakar M, Trauer JM, Ascher DB, Denholm JT. Hyper transmission of Beijing lineage Mycobacterium tuberculosis: systematic review and meta-analysis. J Infect. 2019;79(6):572–581. doi:10.1016/j.jinf.2019.09.016
44. Yang C, Lu L, Warren JL, et al. Internal migration and transmission dynamics of tuberculosis in Shanghai, China: an epidemiological, spatial, genomic analysis. Lancet Infect Dis. 2018;18(7):788–795. doi:10.1016/S1473-3099(18)30218-4
45. Xu Y, Li Q, Zhu M, et al. The epidemiological characteristics and profile of drug-resistant tuberculosis among children with tuberculosis in Sichuan, China, 2015–2018: a retrospective study. Medicine. 2020;99(43):e22608. doi:10.1097/MD.0000000000022608
46. Khatami A, Britton PN, Marais BJ. Management of children with tuberculosis. Clin Chest Med. 2019;40(4):797–810. doi:10.1016/j.ccm.2019.08.003
47. Gan M, Liu Q, Yang C, Gao Q, Luo T. Deep whole-genome sequencing to detect mixed infection of Mycobacterium tuberculosis. PLoS One. 2016;11(7):e0159029. doi:10.1371/journal.pone.0159029
 © 2021 The Author(s). This work is published and licensed by Dove Medical Press Limited. The
full terms of this license are available at https://www.dovepress.com/terms
and incorporate the Creative Commons Attribution
- Non Commercial (unported, 3.0) License.
By accessing the work you hereby accept the Terms. Non-commercial uses of the work are permitted
without any further permission from Dove Medical Press Limited, provided the work is properly
attributed. For permission for commercial use of this work, please see paragraphs 4.2 and 5 of our Terms.
© 2021 The Author(s). This work is published and licensed by Dove Medical Press Limited. The
full terms of this license are available at https://www.dovepress.com/terms
and incorporate the Creative Commons Attribution
- Non Commercial (unported, 3.0) License.
By accessing the work you hereby accept the Terms. Non-commercial uses of the work are permitted
without any further permission from Dove Medical Press Limited, provided the work is properly
attributed. For permission for commercial use of this work, please see paragraphs 4.2 and 5 of our Terms.