Back to Journals » Diabetes, Metabolic Syndrome and Obesity » Volume 16
Analysis of Bulk Transcriptome Sequencing Data and in vitro Experiments Reveal SIN3A as a Potential Target for Diabetic Foot Ulcer
Received 14 October 2023
Accepted for publication 6 December 2023
Published 18 December 2023 Volume 2023:16 Pages 4119—4132
DOI https://doi.org/10.2147/DMSO.S439924
Checked for plagiarism Yes
Review by Single anonymous peer review
Peer reviewer comments 2
Editor who approved publication: Dr Konstantinos Tziomalos
Ran Chen, Haibo Deng, Lijun Zou
Department of Wound Repair Surgery, Liyuan Hospital, Tongji Medical College, Huazhong University of Science and Technology, Wuhan, Hubei, People’s Republic of China
Correspondence: Lijun Zou; Haibo Deng, Department of Wound Repair Surgery, Liyuan Hospital, Tongji Medical College, Huazhong University of Science and Technology, No. 39 Yanhu Avenue, Wuhan, Hubei, 430077, People’s Republic of China, Email [email protected]; [email protected]
Background: Diabetic foot ulcers (DFUs) represent a severe complication of diabetes associated with reduced quality of life, lower limb amputations, hospitalizations, increased incidence, and mortality. Importantly, a significant number of pathogenic genes remain unexplored in DFUs.
Methods: A series of bioinformatics analyses were performed on publicly available bulk transcriptome sequencing datasets GSE134431 and GSE80178 to explore the transcriptomic changes in DFUs and select core genes for in vitro functional validation. In a focused examination, the differential expression analysis unveiled distinctions in gene expression patterns between DFUs and non-ulcerated diabetic skin tissues. Enriched functional annotations of differentially expressed genes were explored using the DAVID online tool. Protein-protein interaction analysis was conducted to investigate interactions among differentially expressed genes and select core genes. Knockdown or overexpression of core genes in HaCaT keratinocytes was performed to assess their impact on cell proliferation and migration.
Results: Ten core genes were identified. Cell Counting Kit-8 (CCK-8) and scratch assays demonstrated that downregulation of the core gene SIN3A significantly inhibited the migration and proliferation of HaCaT keratinocytes, while overexpression of SIN3A reversed the high-glucose-induced suppression of HaCaT cell viability and migration.
Conclusion: SIN3A expression is downregulated in DFUs. In vitro, SIN3A promotes the proliferation and migration of HaCaT keratinocytes, suggesting it may be a potential therapeutic target for DFUs.
Keywords: diabetic foot ulcers, SIN3A, bioinformatics, cell proliferation, cell migration, histone modification
Introduction
The incidence of diabetes, particularly type 2 diabetes, has been increasing annually and has become a serious global public health issue.1 Diabetic foot ulcers (DFUs) represent a severe complication in the later stages of diabetes, imposing a significant burden on patients. This is manifested by a decline in quality of life, a high rate of limb amputations, increased hospitalization, elevated morbidity, and mortality rates.2,3
In recent years, significant progress has been made in the treatment of DFUs, primarily encompassing blood glucose control, vascular interventions, local wound management, infection control, and other potential adjunctive therapies.4 In the realm of basic research, targeted treatment studies for DFUs have revealed promising avenues, although these investigations are predominantly confined to animal studies or preliminary preclinical research. For instance, the inhibition of the IL-1β pathway has exhibited the capacity to enhance wound healing in murine models, prompting a transition from a pro-inflammatory state to a reparative phenotype in macrophages.5 In a similar vein, the silencing of murine neutrophil PAD4 expression, facilitating the inhibition of neutrophil recruitment, holds the potential to bolster the process of wound healing in diabetic conditions.6 Furthermore, localized overexpression of HIF-1α, achieved through the introduction of the stable and active form of HIF-1α via gene transfer, has demonstrated the ability to expedite wound healing in diabetic mice.7–9 Additionally, within the context of diabetic wounds, the targeted inhibition of matrix metalloproteinase-9 in murine models has exhibited an acceleration in the healing process.10 In the realm of animal models, interventions involving miRNA-26a inhibitors and miRNA-27b upregulation have both proven efficacious in promoting wound healing.11,12 However, it remains imperative to acknowledge that the landscape of potential therapeutic targets within DFUs remains rich with unexplored possibilities.
Bioinformatics analyses have become one of the most effective tools for analyzing human diseases.13 It is widely applied in molecular biology experiments and clinical practice.14 It integrates extensive biological data, encompassing genomics, transcriptomics, proteomics, and metabolomics, to provide a comprehensive understanding of molecular-level variations and interactions within the biological system. This wealth of information aids in the elucidation of underlying biological patterns and mechanisms. For instance, it can be employed to construct biological networks, such as protein-protein interaction networks and gene regulatory networks, to investigate intermolecular interactions and pathways. It can also be utilized to unearth patterns and trends within biological data, including the identification of correlated genes, biomarkers, disease patterns, and biological processes. In this context, we leveraged publicly available transcriptomic sequencing data to conduct bioinformatics analyses aimed at elucidating the biological patterns of DFUs, uncovering potential disease biomarkers and targets, and conducting preliminary in vitro validation of key genes.
Materials and Methods
Datasets Selection and Data Preprocessing
The GSE 13443115 and GSE 8017816 datasets were downloaded from the Gene Expression Omnibus (GEO) database. The GSE 80178 dataset contains six diabetic foot ulcer samples (Full cortical skin tissue at the margin of the ulcer), three diabetic foot skin samples (Full skin tissue of the foot in patients with diabetes mellitus but without foot ulcers), and three non-diabetic foot skin samples. Only six diabetic foot ulcer samples and three diabetic foot skin samples were selected for bioinformatics analyses in this study. GSE134431 includes eight diabetic foot skin samples, six diabetic foot ulcer (healed) skin samples, and seven diabetic foot ulcer (unhealed) samples. Only eight diabetic foot skin samples and seven diabetic foot ulcer (unhealed) samples were selected for bioinformatics analyses in this study. The RNA-seq data GSE134431 were based on the GPL18573 Illumina NextSeq 500 (Homo sapiens), and the microarray data of GSE80178 were based on the GPL16686 [HuGene-2_0-st] Affymetrix Human Gene 2.0 ST Array [transcript (gene) version]. For GSE134431, data matrix were downloaded from the GSE134431 data set and were revised by Excel to remove irrelevant values and to meet the NetworkAnalyst file upload requirements (Table S1). For GSE80178, the gene expression matrix was downloaded from “Download family” section and organized according to the file upload requirements on the NetworkAnalyst website (Table S2).
Identification of Differentially Expressed Genes (DEGs)
RNA-seq data (GSE134431) and microarray (GSE80178) were analyzed by NetworkAnalyst 3.0, a visual analytics platform for comprehensive gene expression profiling and meta-analysis.17 The above collated expression matrix files were submitted separately to the NetworkAnalyst website and the differential genes were analyzed using the website’s built-in limma package. DEGs were screened according to the following screening criteria: |LogFC|≥1, corrected for adjusting P-value (adj.P) < 0.05. Analysis results were downloaded from the “download” module in the website. The intersections of upregulated or downregulated DEGs from the two datasets were considered candidate DEGs for further analyses.
Enrichment Analysis
To gain deeper insights into the roles played by these DEGs in the progression of DFUs, we conducted Gene Ontology (GO) functional enrichment analysis, encompassing biological pathways (BP), molecular functions (MF), and cellular components (CC). This analysis was executed employing the widely utilized DAVID tool version 6.8.18 DAVID offers a comprehensive suite of functional annotation utilities, enabling researchers to unravel the biological significance underpinning extensive gene lists. The outcomes of the enrichment analysis were graphically represented with the aid of R packages such as ggplot219 and Hmisc within RStudio software (version 3.6.3).20 The selection criteria for GO term inclusion entailed the top 10 terms with a significance level of P < 0.05.
Construction of Protein-Protein Interactions (PPI) Network and Identification of Key Genes
To explore the interplay among these distinct genes, we systematically assembled a protein interaction network comprising those genes displaying substantial overlap. This network was meticulously crafted employing the STRING application, version 1.5.0,21 seamlessly integrated within the Cytoscape platform, version 3.8.2.22 Subsequently, we harnessed the CytoHubba plug-in23 to pinpoint pivotal hub genes within this intricate network. In this network representation, nodes were emblematic of genes, while edges denoted their interactions. To gain further insights into the biological functions of these central hub genes, we carried out GO enrichment analysis, leveraging the “Enrichment” function embedded within the STRING application.
Cell Culture
The Human skin keratinocyte HaCaT cells (ZQ0044, Shanghai, China) were employed in this study. These cells are widely utilized for preliminary investigations prior to in vivo applications. The HaCaT cells were nurtured in Dulbecco’s modified Eagle medium (DMEM), supplemented with 2-mM L-glutamine (Invitrogen), 10% fetal bovine serum (FBS) from Sigma-Aldrich (St. Louis, MO, USA), and 100 units of penicillin and 100 μg/mL of streptomycin (Sigma-Aldrich). Culturing was performed in a humidified atmosphere comprising 5% CO2 and 95% air, maintained at a temperature of 37°C.
To explore the cellular responses, the cells were exposed to distinct conditions, including 400-μg/mL bovine serum albumin (BSA), or varying concentrations of advanced glycation end-products derived from BSA (AGEs-BSA) (0, 50, 100, 200, or 400 μg/mL), in combination with glucose concentrations of 5.5-mM (designated as normal glucose, NG), 25-mM (high glucose, HG), or 30-mM (high glucose plus, HGP). The condition of the cells was assessed daily, with medium replacement every two days.
For functional assays, NG HaCaT cells underwent transfection with either negative control small interfering RNA (si-NC) or small interfering RNA targeting SIN3A (si-SIN3A). In the case of HGP HaCaT cells, they were transfected with a SIN3A over-expression (OE) vector or a corresponding control vector.
Transfection
The small interfering RNAs, denoted as si-NC and si-SIN3A, were custom-synthesized by DesignGene, located in Shanghai, China. The sequences are detailed below for reference: H-si-SIN3A-1 sense: 5’-GGUCUAAGAGCUUACUCAA-3’, antisense: 5’-UUGAGUAAGCUCUUAGACC-3’. H-si-SIN3A-2 sense: 5’-ACUGCUGAGAAGGUUGAUU-3’, antisense: 5’-AAUCAACCUUCUCAGCAGU-3’. H-si-SIN3A-3 sense: 5’-CUGGUCACUCGAGCACAUCUA-3’, antisense: 5’-UAGAUGUGCUCGAGUGACCAG-3’. H-si-NC sense: 5’-UUCUCCGAA CGU GUC ACG UTT-3’, antisense: 5’-ACGUGACACGUUCGGAGAATT-3’. For the purpose of overexpression experiments, the pcDNA 3.1 plasmid harboring the complete SIN3A sequence (referred to as pcDNA‐SIN3A) and an empty pcDNA 3.1 plasmid (designated as pcDNA‐vector) were meticulously engineered by Genechem, a laboratory based in Shanghai, China. The pcDNA‐vector was employed as the negative control. Transfection procedures were executed using Lipofectamine 3000 reagent, sourced from Invitrogen, situated in Carlsbad, USA, in strict accordance with the manufacturer’s prescribed protocol. The efficiency of transduction was verified through quantitative reverse transcription-PCR (qRT-PCR) analysis.
Cell Counting Kit-8 (CCK8) Assay
Cell proliferation was assessed using a CCK8 assay, with the CCK8 reagent sourced from Servicebio (G4103, Wuhan, China). In each well of a 96-well plate, we seeded a total of 1×10⁴ HaCaT cells in 100 µL of DMEM, followed by a 24-hour incubation at 37°C. Subsequently, the cells underwent exposure to different experimental conditions, encompassing NG, HG, HGP, 400-μg/mL BSA, and AGE-BSA at concentrations of 0, 50, 100, 200, and 400 μg/mL. In a parallel experiment, NG cells were subjected to treatment with si-NC and si-SIN3A, while HGP cells were subjected to oe-NC and oe-SIN3A, each maintained for 24 hours within a 5% CO2 incubator at 37°C. After the respective treatments, we prepared a working solution by adding 10 μL of CCK8 reagent to 90 μL of DMEM, and subsequently introduced 100 μL of this working solution to each well, allowing for an additional 1.5-hour incubation. This CCK8 assay was conducted at four time points: 0, 24, 48, and 72 hours.
Scratch Assay
HaCaT cells were initially seeded in 6-well plates at a density of 1.2×10⁵ cells/mL and allowed to cultivate until they reached full confluence. Subsequently, the following experimental groups were established: the NG group, HG group, HGP group, 400-μg/mL BSA group, and AGE-BSA groups at concentrations of 50, 100, 200, and 400 μg/mL, along with the NG+si-NC group, NG+si-SIN3A group, HG+oe-NC group, and HG+oe-SIN3A group. To initiate the wound healing assay, we created five parallel scratches within each well using a 200-μL pipette tip, measuring the width of each scratch to establish the baseline values. Following the scratch creation, cells were incubated with the designated reagents within a 5% CO2 incubator for 0 and 24 hours. Ultimately, the width of the scratch was visualized under a light microscope (Leica®, Germany) and quantified through a wound closure assay conducted with ImageJ software, avoiding potential zone overlaps.
RNA Extraction and qRT-PCR
The total RNA was isolated using RNA Isolation Reagent (R701-01, Vazyme). qRT-PCR was performed with Line Gene 9660 FQD-96A (Bioer) using the SYBR Green detection system according to the manufacturer’s instructions. GAPDH was used as an internal control. The primers used in this study were as follows: (Homo sapiens) GAPDH: forward, 5′-AGGTCGGTGTGAACGGATTTG-3′; reverse, 5′-TGTAGACCATGTAGTTGAGGTCA-3′; SIN3A: forward, 5′-TTAAATCTCAGAGCATCGACAC-3′; reverse, 5′-AGGAGTTGTCACATTCACCA-3′.
Statistical Analysis
The data were expressed as the mean ± standard deviation (SD). Statistical evaluations were conducted utilizing either one-way analysis of variance (ANOVA) or a t-test, employing GraphPad Prism 8.0 statistical software (GraphPad Software, CA, United States). Statistical significance was defined as a P-value less than 0.05.
Results
The Workflow Diagram of This Study
Figure 1 illustrates the bioinformatics analysis workflow applied to the accessible datasets obtained from GEO.
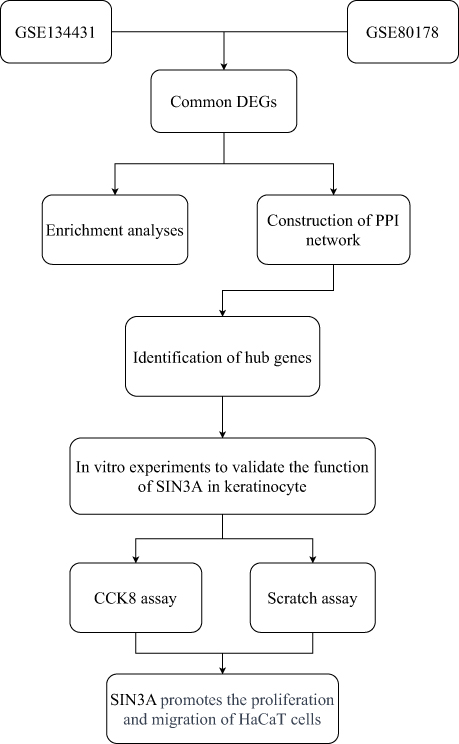 |
Figure 1 Flowchart for bioinformatics analysis of publicly available data from GEO databases and in vitro experiments. |
Identification of DEGs
In the GSE80178 dataset, a total of 1796 Differentially Expressed Genes (DEGs) were discerned, comprising 363 genes exhibiting upregulation and 1433 displaying downregulation (Table S3). Furthermore, GSE134431 unveiled 526 DEGs, encompassing 148 that were upregulated and 378 that were downregulated (see Table S4). Following the meticulous examination of overlapping DEGs within both the upregulated and downregulated gene subsets in each dataset, we successfully identified 33 DEGs that were consistently upregulated and 104 DEGs that exhibited consistent downregulation. These DEGs were subsequently designated as potential candidates for more comprehensive investigations (Figure 2).
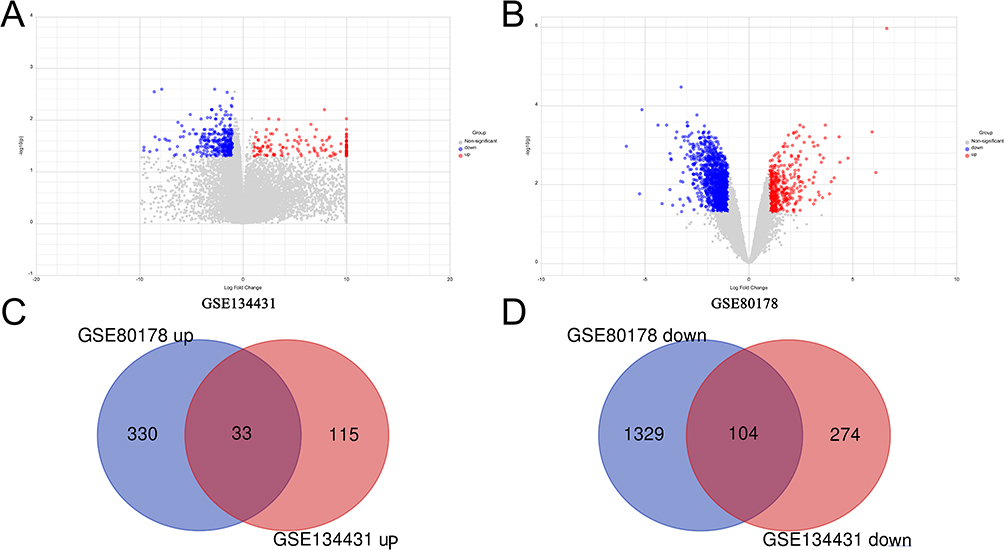 |
Figure 2 Screening for DEGs. (A and B) The volcano plot of DEGs in GSE134431 (A) and GSE80178 (B). Blue dots represent downregulated genes and red dots represent up-regulated genes. (C and D) The data of the Venn diagram about upregulated (C) and downregulated DEGs (D) were extracted from the two GSE datasets (GSE80178 and GSE134431). |
Enrichment Analysis
We conducted a comprehensive functional enrichment analysis using DAVID to investigate the biological functions that were overrepresented among the upregulated and downregulated Differentially Expressed Genes (DEGs). The outcomes of this analysis were subsequently visually represented using the R programming language.
Regarding Biological Process (BP) Gene Ontology (GO) terms, the upregulated genes exhibited predominant involvement in processes related to keratinocyte differentiation, peptide cross-linking, and keratinization, as illustrated in Figure 3A. Conversely, the downregulated genes were primarily enriched in processes associated with transcriptional DNA-templated events, melanocyte differentiation, and the negative regulation of transcription from RNA polymerase II promoter, as depicted in Figure 3B.
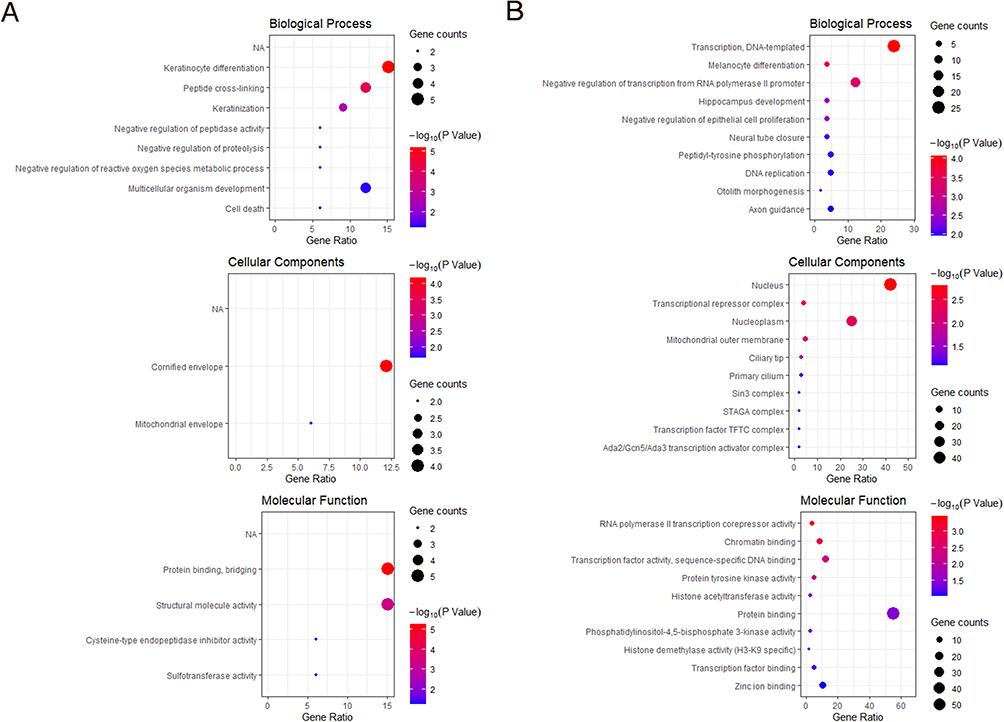 |
Figure 3 Enrichment results of DEGs. (A) Up-regulated DEG enrichment analysis results. (B) Down-regulated DEG enrichment analysis results. The color of bubbles represents the P-value, and the size of bubbles represents the number of gene counts. |
In terms of Cellular Component (CC) GO terms, the upregulated genes were predominantly linked to the cornified envelope (Figure 3A), while the downregulated genes were notably associated with cellular components such as the nucleus, transcriptional repressor complex, and nucleoplasm, as portrayed in Figure 3B.
Within the domain of Molecular Function (MF) GO terms, the upregulated genes were primarily associated with functions encompassing protein binding, bridging, and structural molecule activity, illustrated in Figure 3A. On the other hand, the downregulated genes were primarily associated with protein binding functions, as shown in Figure 3B.These findings collectively suggest the presence of a dysregulation in epithelialization processes and aberrant transcriptional behavior in the context of Diabetic Foot Ulcers (DFUs).
Construction of PPI Network of DEGs and Identification of Hub Genes
To establish a PPI network for the expression products of DEGs within DFUs, we harnessed the STRING app (Version 1.7.0) integrated within Cytoscape software (Version 3.8.2), as visually depicted in Figure 4A. Furthermore, the identification of the top 10 hub genes within the PPI network was carried out employing the degree algorithm, and the selection process was facilitated through the cytoHubba app, both within the Cytoscape framework. The distinguished top 10 hub genes are as follows: SIN3A, KAT2A, KIT, WDR59, EREG, TRRAP, GLI3, THADA, PHF8, and KAT7. Further, 10 hub genes were analyzed for GO enrichment within the STRING app. Genes related to histone modification are SIN3A, PHF8, KAT2A, KAT7, and TRRAP; genes related to the regulation of histone acetylation are SIN3A, KAT2A, and KAT7; genes related to histone H4 acetylation are KAT2A, KAT7, and TRRAP; genes related to the regulation of chromatin organization are SIN3A, PHF8, KAT2A, and KAT7; genes related to the regulation of cell differentiation are SIN3A, GLI3, KAT2A, KAT7, KIT, and EREG (Figure 4B). The above results indicate that histone modification may play a significant role in the pathological and physiological processes of DFUs.
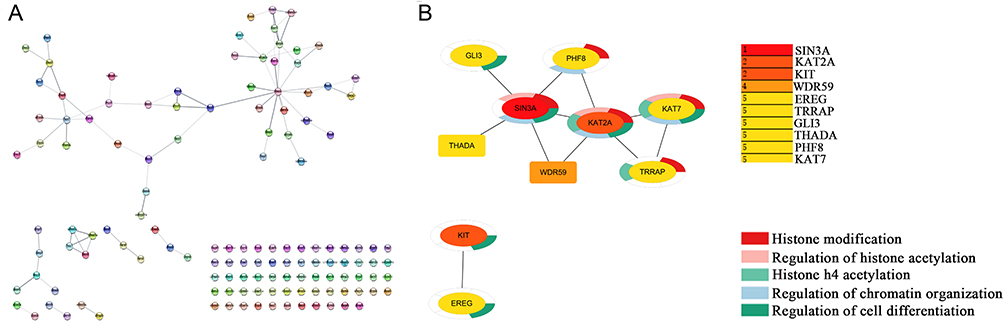 |
Figure 4 Construction of PPI network of DEGs, obtaining 10 hub genes, and enrichment analysis of hub genes. (A) The PPI network of the DEGs. The network contained 132 nodes and 79 edges. (B) Top 10 hub genes by degree and the enrichment analysis of hub genes. |
High Glucose or AGEs Inhibited Cell Proliferation and Migration
To verify the effects of different concentrations of glucose and AGEs on the proliferation and migration of HaCaT cells, we conducted CCK8 and scratch assays. The results showed that 25mM glucose and 400 μg/mL AGE-BSA significantly inhibited cell viability at the respective time points (Figure 5A and B). The data also indicated that after 24 hours of treatment, 25mM and 30mM glucose, as well as AGE-BSA (100 μg/mL, 200 μg/mL, and 400 μg/mL), inhibited cell migration in vitro (Figure 5C–F).
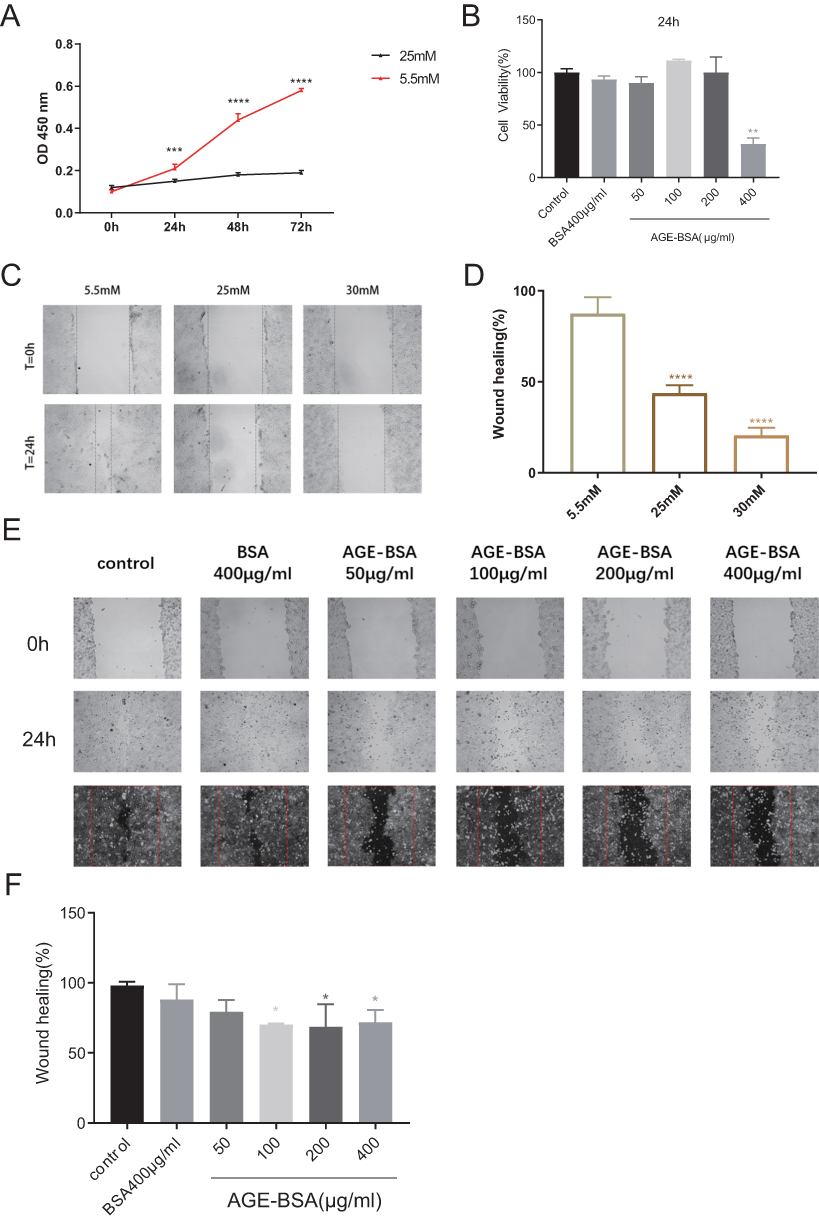 |
Figure 5 HaCaT viability and migration were inhibited by high glucose or AGEs. (A) 25mM glucose treatment suppressed HaCaT viability in 24, 48 and 72 hours. ***P<0.001, ****P<0.0001 compared to 5.5mM glucose group. (B) 400-μg/mL AGE-BSA treatment also suppressed HaCaT cell viability in 24 hours. **P<0.01, compared to control group. (C and D) 25mM and 30mM glucose inhibited HaCaT cell migration. ****P<0.0001 compared to 5.5mM glucose group. (E and F) AGEs (100, 200, and 400 μg/mL) inhibited HaCaT cell migration. *P<0.05 compared to control group. Typical scratch assay images and quantifications are shown. The data were expressed as the means ± S.E.M. of three independent experiments. |
High Glucose Downregulated the Expression of SIN3A in HaCaT Cells
The above results indicate that the core gene ranked first by Degree value in the PPI network is SIN3A, and the expression of SIN3A is downregulated in DFUs. SIN3A is involved in histone modification and transcription factor regulation. To validate the expression levels of SIN3A in HaCaT keratinocytes under high glucose conditions in vitro, we conducted qRT-PCR analysis. The results showed that 25 mM glucose significantly reduced the expression of SIN3A (Figure 6).
 |
Figure 6 Downregulation of SIN3A expression in HaCaT cells under 25 mM glucose. qRT-PCR analysis demonstrating a significant difference in SIN3A mRNA levels between the 25 mM glucose group (n = 3) and the 5.5 mM glucose control group (n = 3). **P < 0.01, compared to the control group. |
Knocking Down SIN3A Inhibits the Proliferation and Migration of HaCaT Cells
To determine the functional role of SIN3A, we knocked down SIN3A in HaCaT cells. The knockdown efficiency of SIN3A is shown in Figure 7A. The results indicated that the SIN3A-1 sequence had a better knockdown efficiency, and therefore, the sequence 1 was used as the primary sequence for subsequent functional validation. Knocking down SIN3A reduced cell viability (at 24, 48, and 72 hours) and migratory ability (at 24 hours) (Figure 7B–D).
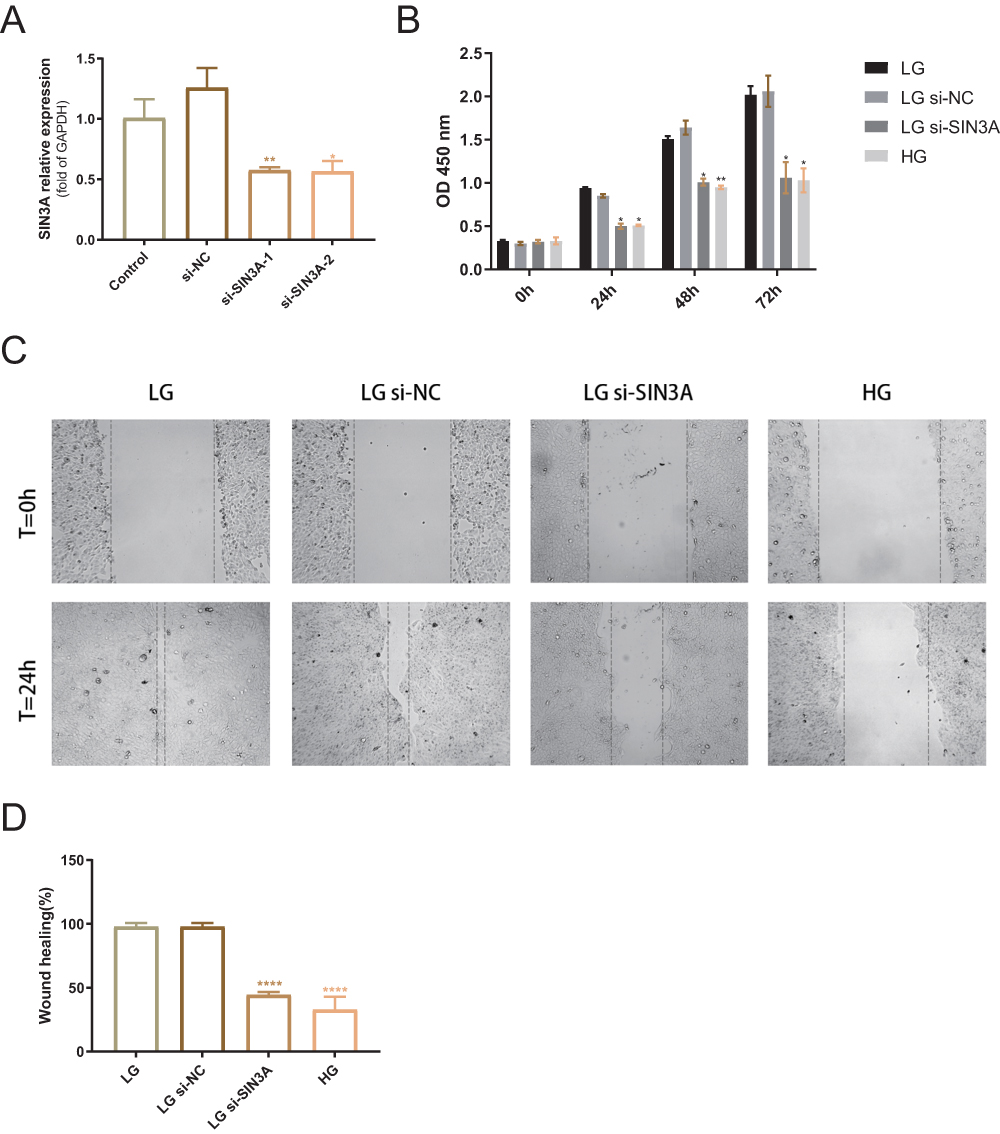 |
Figure 7 Knockdown of SIN3A reduces cell viability and impairs cell migration. (A) mRNA level validation of SIN3A knockdown efficiency. NC, negative control. (B) Optical density differences between LG group (5.5 mM glucose), LG+si-NC group, LG+si-SIN3A group, and HG group (20 mM glucose) at 0 h, 24 h, 48 h, and 72 h. *P < 0.05. **P < 0.01, compared to the LG group. (C) Representative images of scratch assays for the four groups. (D) Comparison of scratch closure rates among the four groups. ****P < 0.0001, compared to the LG group. The data were expressed as the means ± S.E.M. of three independent experiments. |
Overexpression of SIN3A Reverses the Inhibitory Effect of High Glucose on HaCaT Cell Viability and Migration
To validate whether high glucose inhibits cell proliferation and migration through downregulating SIN3A, we initially overexpressed SIN3A in HaCaT cells prior to high glucose treatment. The efficiency of SIN3A overexpression is shown in Figure 8A. The results indicated that overexpression of SIN3A reversed the inhibitory effect of high glucose on cell proliferation and migration (Figure 8B–D). This suggests that high glucose hinders the migration and proliferation of HaCaT cells, at least in part, through the downregulation of SIN3A.
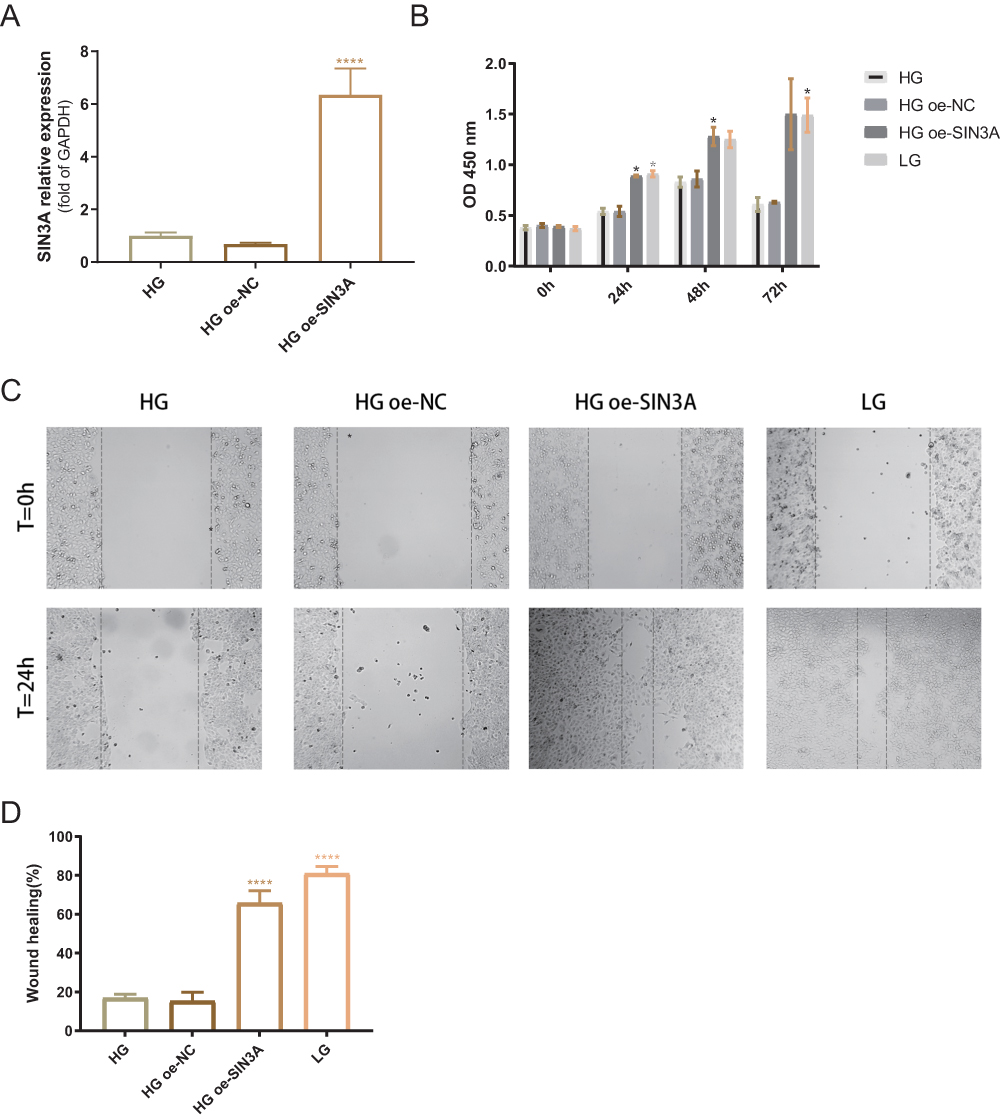 |
Figure 8 SIN3A overexpression reverses the inhibitory effect of high glucose on cell proliferation and migration. (A) mRNA level validation of SIN3A overexpression efficiency. NC, negative control group. (B) Optical density differences between the HG group (25 mM glucose), HG+oe-NC group, HG+oe-SIN3A group, and LG group (2.5 mM glucose) at 0 hours, 24 hours, 48 hours, and 72 hours. *P < 0.05, compared to the HG group. (C) Representative images of scratch assays for the four groups. (D) Comparison of scratch closure rates among the four groups. ****P < 0.0001, compared to the HG group. Data are presented as the means ± standard error of the mean from three independent experiments. |
Discussion
DFUs are characterized by the slow healing of wounds, primarily attributed to compromised re-epithelialization, a crucial process in epidermal repair involving keratinocyte migration, proliferation, and differentiation for epidermal regeneration. In this study, we identified 137 differentially expressed genes (104 upregulated and 33 downregulated) from two gene expression profile datasets comparing diabetic foot skin to DFUs. GO enrichment analysis revealed that upregulated genes were primarily associated with keratinocyte differentiation and cornification, highlighting the urgent need for re-epithelialization in DFUs. PPI network analysis of these differentially expressed genes, including SIN3A among the top 10 central genes, suggested a profound influence of histone modifications on wound healing.
Emerging evidence has demonstrated the impact of histone modifications on the activity of several genes involved in diabetic wound healing.24–26 For instance, the JmjC domain-containing protein 3 (JMJD3) serves as an enzyme regulating histone demethylation, influencing the expression of interferon regulatory factor 4 (IRF-4), crucial for macrophage polarization from M1 to M2 states, thereby playing a vital role in immune and inflammatory responses.27,28 JMJD3 expression appears indispensable for re-epithelialization, as it stimulates Notch1 expression, promoting keratinocyte migration to the injured site.29,30 Additionally, epigenetic regulation via histone acetylation was found to be pivotal in wound healing. Global decreases in H3K9 and H3K23 acetylation were observed in diabetic mice.31 Histone deacetylases (HDACs) were implicated in angiogenesis, with HDAC7 silencing in HUVEC cells inhibiting capillary formation in vitro and altering cellular morphology.32 Furthermore, experimental evidence from a diabetic wound model indicated enhanced healing processes with class I HDAC inhibitors, leading to increased cell proliferation and improved wound closure in mice.33,34
Enrichment analysis results indicate that SIN3A is involved in histone modification. SIN3A, known for its involvement in breast cancer cell invasion and migration,35 as well as its role in mouse embryonic development and maintaining embryonic stem cell pluripotency,36,37 was significantly downregulated in DFUs tissue. The protein encoded by SIN3A is a transcriptional regulatory protein that contains paired amphipathic helix (PAH) domains, which are crucial for protein-protein interactions.38 As a transcriptional co-repressor, SIN3A regulates cell cycle progression by cooperating with FOXK1.39 SIN3A also interacts with OGT (via TPR 1–6) and mediates transcriptional repression concurrently with histone deacetylases such as HDAC1 and HDAC2.38,40 In vitro studies revealed that elevated glucose levels downregulated SIN3A expression in keratinocytes. Transfection with si-SIN3A suppressed proliferation and migration capabilities of HaCaT cells, implying a positive role for SIN3A in keratinocyte functions. Notably, the inhibitory effects of high glucose levels on HaCaT cell proliferation and migration could be reversed through SIN3A overexpression. Collectively, these findings suggest that high glucose levels, at least partially, hinder keratinocyte proliferation and migration by downregulating SIN3A expression. Nevertheless, further experiments are needed to elucidate the impact of SIN3A on HaCaT keratinocyte functions, particularly whether it affects cell behavior through the regulation of histone modifications, and the role of high glucose in regulating SIN3A expression.
Conclusion
In conclusion, this study indicates that there is dysregulation in the expression of genes related to re-epithelialization and genes related to histone modifications in DFUs. High glucose partially inhibits the proliferation and migration of HaCaT cells by downregulating the expression of SIN3A.
Abbreviation
DFUs, Diabetic foot ulcers; GEO, Gene Expression Omnibus; SIN3A, SIN3 Transcription Regulator Family Member A; DM, Diabetes mellitus; DEGs, Differentially expressed genes; ATCC, American Type Culture Collection; DMEM, Dulbecco’s modified Eagle medium; GO, Gene ontology; PPI, Protein-protein interaction; FBS, Fetal bovine serum; qRT-PCR, quantitative reverse transcription -PCR; NG, Normal glucose; HG, High glucose; HGP, High glucose plus; SD, Standard deviation; BP, Biological process; CC, Cellular component; MF, Molecular function; si-NC, Negative control small interfering RNA; si-SIN3A, SIN3A small interfering RNA; OE, Over-expression; BSA, Bovine serum albumin; CCK8, Cell counting kit-8; GAPDH, Glyceraldehyde 3-phosphate dehydrogenase; HDACs, Histone deacetylases; JMJD3, JmjC domain-containing protein 3; IRF-4, Interferon regulatory factor −4; HIF-1α, Hypoxia-inducible factor 1-alpha.
Data Sharing Statement
The datasets scrutinized in the present investigation are accessible via the GEO repository (https://www.ncbi.nlm.nih.gov/geo/). The specific repository names and corresponding accession number(s) are detailed within the article and Supplementary Material.
Ethics Approval and Consent to Participate
This study has obtained approval from the Medical Ethics Committee of Liyuan Hospital, Tongji Medical College, Huazhong University of Science and Technology, with approval number [2021] IEC(YJ004). All research involving human data adheres to the ethical guidelines and regulations of this ethics committee.
Consent to Release Statement
All authors of this study agree to release any detailed information related to this study, including images, videos, recordings, and are mutually aware of the content to be published in the article.
Acknowledgments
We extend our heartfelt gratitude to Dr. Wenzhuo Cheng for her invaluable contributions in providing experimental and technical assistance to this endeavor. We also express our sincere appreciation to Mogo Edit for their meticulous scientific editing support on this manuscript. Furthermore, our sincere thanks are extended to Professor Binghui Li and Professor Gongchi Li for their generous financial support, which has significantly contributed to the realization of this research.
Funding
The financial support for this study was graciously furnished by the Young Scientists Fund of the National Natural Science Foundation of China (Grant No. 81801922) and the Natural Science Foundation of Hubei Province (Grant No. 2020CFB696 and 2017CKB892).
Disclosure
The authors report that no competing interests exist.
References
1. Chen Z, Drouin-Chartier JP, Li Y, et al. Changes in plant-based diet indices and subsequent risk of type 2 diabetes in women and men: three U.S. prospective cohorts. Diabetes Care. 2021;44(3):663–671. doi:10.2337/dc20-1636
2. El-Salamouni NS, Gowayed MA, Seiffein NL, Abdel-Moneim RA, Kamel MA, Labib GS. Valsartan solid lipid nanoparticles integrated hydrogel: a challenging repurposed use in the treatment of diabetic foot ulcer, in-vitro/in-vivo experimental study. Int J Pharm. 2021;592:120091. doi:10.1016/j.ijpharm.2020.120091
3. Yovera-Aldana M, Sáenz-Bustamante S, Quispe-Landeo Y, et al. Nationwide prevalence and clinical characteristics of inpatient diabetic foot complications: a Peruvian multicenter study. Prim Care Diabetes. 2021;15(3):480–487. doi:10.1016/j.pcd.2021.02.009
4. Doğruel H, Aydemir M, Balci MK. Management of diabetic foot ulcers and the challenging points: an endocrine view. World J Diabetes. 2022;13(1):27–36. doi:10.4239/wjd.v13.i1.27
5. Mirza RE, Fang MM, Ennis WJ, Koh TJ. Blocking interleukin-1β induces a healing-associated wound macrophage phenotype and improves healing in type 2 diabetes. Diabetes. 2013;62(7):2579–2587. doi:10.2337/db12-1450
6. Wong SL, Demers M, Martinod K, et al. Diabetes primes neutrophils to undergo NETosis, which impairs wound healing. Nat Med. 2015;21(7):815–819. doi:10.1038/nm.3887
7. Botusan IR, Sunkari VG, Savu O, et al. Stabilization of HIF-1alpha is critical to improve wound healing in diabetic mice. Proc Natl Acad Sci USA. 2008;105(49):19426–19431. doi:10.1073/pnas.0805230105
8. Sunkari VG, Lind F, Botusan IR, et al. Hyperbaric oxygen therapy activates hypoxia-inducible factor 1 (HIF-1), which contributes to improved wound healing in diabetic mice. Wound Repair Regen. 2015;23(1):98–103. doi:10.1111/wrr.12253
9. Liu L, Marti GP, Wei X, et al. Age-dependent impairment of HIF-1alpha expression in diabetic mice: correction with electroporation-facilitated gene therapy increases wound healing, angiogenesis, and circulating angiogenic cells. J Cell Physiol. 2008;217(2):319–327. doi:10.1002/jcp.21503
10. Gooyit M, Peng Z, Wolter WR, et al. A chemical biological strategy to facilitate diabetic wound healing. ACS Chem Biol. 2014;9(1):105–110. doi:10.1021/cb4005468
11. Icli B, Nabzdyk CS, Lujan-Hernandez J, et al. Regulation of impaired angiogenesis in diabetic dermal wound healing by microRNA-26a. J Mol Cell Cardiol. 2016;91:151–159. doi:10.1016/j.yjmcc.2016.01.007
12. Wang JM, Tao J, Chen DD, et al. MicroRNA miR-27b rescues bone marrow-derived angiogenic cell function and accelerates wound healing in type 2 diabetes mellitus. Arterioscler Thromb Vasc Biol. 2014;34(1):99–109. doi:10.1161/ATVBAHA.113.302104
13. Oliver GR, Hart SN, Klee EW. Bioinformatics for clinical next generation sequencing. Clin Chem. 2015;61(1):124–135. doi:10.1373/clinchem.2014.224360
14. Shao N, Zhu Y, Wan FN, Ye DW. Identification of seven long noncoding RNAs signature for prediction of biochemical recurrence in prostate cancer. Asian J Androl. 2019;21(6):618–622. doi:10.4103/aja.aja_118_18
15. Sawaya AP, Stone RC, Brooks SR, et al. Deregulated immune cell recruitment orchestrated by FOXM1 impairs human diabetic wound healing. Nat Commun. 2020;11(1):4678. doi:10.1038/s41467-020-18276-0
16. Ramirez HA, Pastar I, Jozic I, et al. Staphylococcus aureus Triggers Induction of miR-15B-5P to Diminish DNA repair and deregulate inflammatory response in diabetic foot ulcers. J Invest Dermatol. 2018;138(5):1187–1196. doi:10.1016/j.jid.2017.11.038
17. Zhou G, Soufan O, Ewald J, Hancock REW, Basu N, Xia J. NetworkAnalyst 3.0: a visual analytics platform for comprehensive gene expression profiling and meta-analysis. Nucleic Acids Res. 2019;47(W1):W234–W241. doi:10.1093/nar/gkz240
18. Huang da W, Sherman BT, Lempicki RA. Systematic and integrative analysis of large gene lists using DAVID bioinformatics resources. Nat Protoc. 2009;4(1):44–57. doi:10.1038/nprot.2008.211
19. Wickham H. ggplot2: Elegant Graphics for Data Analysis. springer; 2016.
20. R Core Team R. R: a language and environment for statistical computing. In: R Foundation for Statistical Computing. Vienna, Austria: R Core Team R; 2013.
21. Doncheva NT, Morris JH, Gorodkin J, Jensen LJ. Cytoscape StringApp: network analysis and visualization of proteomics data. J Proteome Res. 2019;18(2):623–632. doi:10.1021/acs.jproteome.8b00702
22. Shannon P, Markiel A, Ozier O, et al. Cytoscape: a software environment for integrated models of biomolecular interaction networks. Genome Res. 2003;13(11):2498–2504. doi:10.1101/gr.1239303
23. Chin C-H, Chen S-H, H-H W, C-W H, M-T K, Lin C-Y. cytoHubba: identifying hub objects and sub-networks from complex interactome. BMC Syst Biol. 2014;8(4):S11. doi:10.1186/1752-0509-8-S4-S11
24. Zullo A, Sommese L, Nicoletti G, Donatelli F, Mancini FP, Napoli C. Epigenetics and type 1 diabetes: mechanisms and translational applications. Transl Res. 2017;185:85–93. doi:10.1016/j.trsl.2017.05.002
25. Sommese L, Zullo A, Mancini FP, Fabbricini R, Soricelli A, Napoli C. Clinical relevance of epigenetics in the onset and management of type 2 diabetes mellitus. Epigenetics. 2017;12(6):401–415. doi:10.1080/15592294.2016.1278097
26. Picascia A, Grimaldi V, Pignalosa O, De Pascale MR, Schiano C, Napoli C. Epigenetic control of autoimmune diseases: from bench to bedside. Clin Immunol. 2015;157(1):1–15. doi:10.1016/j.clim.2014.12.013
27. De Santa F, Totaro MG, Prosperini E, Notarbartolo S, Testa G, Natoli G. The histone H3 lysine-27 demethylase Jmjd3 links inflammation to inhibition of polycomb-mediated gene silencing. Cell. 2007;130(6):1083–1094. doi:10.1016/j.cell.2007.08.019
28. Gallagher KA, Joshi A, Carson WF, et al. Epigenetic changes in bone marrow progenitor cells influence the inflammatory phenotype and alter wound healing in type 2 diabetes. Diabetes. 2015;64(4):1420–1430. doi:10.2337/db14-0872
29. Na J, Shin JY, Jeong H, et al. JMJD3 and NF-κB-dependent activation of Notch1 gene is required for keratinocyte migration during skin wound healing. Sci Rep. 2017;7(1):6494. doi:10.1038/s41598-017-06750-7
30. Shaw T, Martin P. Epigenetic reprogramming during wound healing: loss of polycomb-mediated silencing may enable upregulation of repair genes. EMBO Rep. 2009;10(8):881–886. doi:10.1038/embor.2009.102
31. Tu P, Li X, Ma B, et al. Liver histone H3 methylation and acetylation may associate with type 2 diabetes development. J Physiol Biochem. 2015;71(1):89–98. doi:10.1007/s13105-015-0385-0
32. Mottet D, Bellahcène A, Pirotte S, et al. Histone deacetylase 7 silencing alters endothelial cell migration, a key step in angiogenesis. Circ Res. 2007;101(12):1237–1246. doi:10.1161/CIRCRESAHA.107.149377
33. Spallotta F, Cencioni C, Straino S, et al. Enhancement of lysine acetylation accelerates wound repair. Commun Integr Biol. 2013;6(5):e25466. doi:10.4161/cib.25466
34. Melchionna R, Bellavia G, Romani M, et al. C/EBPγ regulates wound repair and EGF receptor signaling. J Invest Dermatol. 2012;132(7):1908–1917. doi:10.1038/jid.2012.51
35. Li W, Zhang Z, Liu X, et al. The FOXN3-NEAT1-SIN3A repressor complex promotes progression of hormonally responsive breast cancer. J Clin Invest. 2017;127(9):3421–3440. doi:10.1172/JCI94233
36. Zhao P, Li S, Wang H, et al. Sin3a regulates the developmental progression through morula-to-blastocyst transition via Hdac1. FASEB j. 2019;33(11):12541–12553.
37. Zhu F, Zhu Q, Ye D, et al. Sin3a-Tet1 interaction activates gene transcription and is required for embryonic stem cell pluripotency. Nucleic Acids Res. 2018;46(12):6026–6040.
38. Saunders A, Huang X, Fidalgo M, et al. The SIN3A/HDAC corepressor complex functionally cooperates with NANOG to promote pluripotency. Cell Reports. 2017;18(7):1713–1726. doi:10.1016/j.celrep.2017.01.055
39. Shi X, Garry DJ. Sin3 interacts with Foxk1 and regulates myogenic progenitors. Mol Cell Biochem. 2012;366(1–2):251–258. doi:10.1007/s11010-012-1302-2
40. Yang X, Zhang F, Kudlow JE. Recruitment of O-GlcNAc transferase to promoters by corepressor mSin3A: coupling protein O-GlcNAcylation to transcriptional repression. Cell. 2002;110(1):69–80. doi:10.1016/S0092-8674(02)00810-3
 © 2023 The Author(s). This work is published and licensed by Dove Medical Press Limited. The
full terms of this license are available at https://www.dovepress.com/terms
and incorporate the Creative Commons Attribution
- Non Commercial (unported, 3.0) License.
By accessing the work you hereby accept the Terms. Non-commercial uses of the work are permitted
without any further permission from Dove Medical Press Limited, provided the work is properly
attributed. For permission for commercial use of this work, please see paragraphs 4.2 and 5 of our Terms.
© 2023 The Author(s). This work is published and licensed by Dove Medical Press Limited. The
full terms of this license are available at https://www.dovepress.com/terms
and incorporate the Creative Commons Attribution
- Non Commercial (unported, 3.0) License.
By accessing the work you hereby accept the Terms. Non-commercial uses of the work are permitted
without any further permission from Dove Medical Press Limited, provided the work is properly
attributed. For permission for commercial use of this work, please see paragraphs 4.2 and 5 of our Terms.
Recommended articles
Effects of Human Fibroblast-Derived Multi-Peptide Factors on the Proliferation and Migration of Nitrogen Plasma-Treated Human Dermal Fibroblasts
Lee SY, Kim DY, Suh SB, Suh JY, Cho SB
Clinical, Cosmetic and Investigational Dermatology 2022, 15:2465-2475
Published Date: 15 November 2022
Network Analysis of Osteoarthritis Progression Using a Steiner Minimal Tree Algorithm
Xie Y, Shao F, Ji Y, Feng D, Wang L, Huang Z, Wu S, Sun F, Jiang H, Miyamoto A, Wang H, Zhang C
Journal of Inflammation Research 2024, 17:3201-3209
Published Date: 18 May 2024
Regulatory Role and Mechanism of lncRNA RNF217-AS1 in the Proliferation and Migration of Esophageal Cancer Cells
Liang J, Niu X, Wang G, Wang M
Cancer Management and Research 2025, 17:1329-1337
Published Date: 7 July 2025
AC067930.4/miR-375 Axis Regulates the Malignant Progression of Colon Adenocarcinoma Through the Cuproptosis-Related Gene SLC6A6
Hou B, Liu Q, Li Z
Cancer Management and Research 2026, 18:585644
Published Date: 27 May 2026