Back to Journals » Journal of Inflammation Research » Volume 19
An Integrated Risk Prediction Model for Gout Using Clinical Data, Ultrasound Features, and Deep Learning: A Retrospective Multicenter Study
Authors Xiao L, Zhao Y, Li Y, Yan M, Liu Y, Li C, Liu M, Ning C
Received 28 May 2025
Accepted for publication 24 December 2025
Published 8 January 2026 Volume 2026:19 543363
DOI https://doi.org/10.2147/JIR.S543363
Checked for plagiarism Yes
Review by Single anonymous peer review
Peer reviewer comments 2
Editor who approved publication: Dr Ujjwol Risal
Lishan Xiao,1,* Yizhe Zhao,2,3,* Yuchen Li,1 Mengmeng Yan,1 Yongming Liu,4 Changgui Li,5,6 Manhua Liu,2,3 Chunping Ning1
1Department of Ultrasound, The Affiliated Hospital of Qingdao University, Qingdao, Shandong, People’s Republic of China; 2The School of Electronic Information and Electrical Engineering, Shanghai Jiao Tong University, Shanghai, People’s Republic of China; 3MoE Key Laboratory of Artificial Intelligence, Shanghai Jiao Tong University, Shanghai, People’s Republic of China; 4Department of Ultrasound, Shandong Province Chronic Disease Hospital, Qingdao, Shandong, People’s Republic of China; 5Shandong Provincial Key Laboratory of Metabolic Diseases and Qingdao Key Laboratory of Gout, The Affiliated Hospital of Qingdao University, Qingdao, Shandong, People’s Republic of China; 6Department of Endocrinology and Metabolism, The Affiliated Hospital of Qingdao University, Qingdao, Shandong, People’s Republic of China
*These authors contributed equally to this work
Correspondence: Chunping Ning, Department of Ultrasound, The Affiliated Hospital of Qingdao University, Qingdao, Shandong, People’s Republic of China, Email [email protected]
Purpose: To develop and validate a combined model for predicting gout risk by integrating ultrasound (US) features as novel risk factors with clinical data and predictions from deep learning (DL) models.
Patients and Methods: This retrospective study included 609 cases who underwent first metatarsophalangeal (MTP1) joint US at two centers. Data from Center 1 were divided into a training group (70%, n = 355) and an internal testing cohort (ITC) (30%, n = 162). Data from Center 2 served as an external testing cohort (ETC) (n = 92). A DL diagnostic model based on MTP1 US images was developed to obtain diagnostic predictions. Clinical data, US features, and DL predictions were integrated, and logistic regression analysis was performed to identify independent risk factors. Various models were constructed (clinical, US, clinical-US, clinical-DL, and combined), and the best model was interpreted with a nomogram. Multicollinearity was assessed using the variance inflation factor. Model performance was evaluated using the receiver operating characteristic (ROC) curves, calibration plots, and decision curve analysis (DCA).
Results: The combined model, incorporating clinical data (gender, serum uric acid [SUA]), US features (tophus, double contour sign (DCs), bone erosion), and DL predictions, exhibited the best performance. For the ITC, the area under the curve (AUC) and Brier scores were 0.904 (95% CI: 0.843~0.965) and 0.100 (0.066~0.140), respectively. For the ETC, they were 0.881 (95% CI: 0.815~0.947) and 0.160 (0.107~0.221). DCA confirmed the clinical utility of the combined nomogram.
Conclusion: A nomogram was constructed based on seven risk predictors (gender, SUA, estimated glomerular filtration rate (eGFR), tophus, bone erosion, DCs, and DL prediction) to predict and quantify gout risk.
Plain Language Summary: We developed a new method to predict gout risk by combining clinical data, ultrasound features, and deep learning technology.We created a simple-to-use scoring tool that doctors can use to assess the likelihood of patients developing gout.Three key ultrasound features (tophus, double contour sign, and bone erosion) can help predict gout risk.
Keywords: gout, first metatarsophalangeal joint, ultrasonography, risk assessment, nomogram
Introduction
Gout is a crystalline inflammatory arthritis characterized by recurrent flares and joint deformities. The first metatarsophalangeal (MTP1) joint is the most commonly affected site in gouty arthritis (GA).1,2 Its increasing prevalence, particularly among younger populations, poses significant challenges to patients’ quality of life and healthcare systems.3,4
Ultrasound (US) has become the preferred imaging tool for diagnosing GA due to its low cost, lack of radiation, ability to perform real-time dynamic scanning, and high repeatability. It effectively distinguishes gout from other inflammatory joint diseases by identifying four key features: double contour sign (DCs), tophus, aggregates, and bone erosion.5–7 The updated 2018 recommendations from the European League Against Rheumatism (EULAR) emphasize the important role of US in gout diagnosis while urging clinicians to focus on the potential risk factors associated with the disease.8
Recent advances in artificial intelligence (AI) have shown promise in improving gout diagnosis and risk stratification. Several approaches have been explored: Shay et al9 developed machine learning (ML) models using clinical and laboratory data to identify gout risk in hyperuricemic patients, while metabolomics-based approaches by Wang et al10 and Shen et al11 demonstrated the potential of biochemical markers for disease prediction and differentiation. Jatuworapruk et al12 focused on predicting gout flares in hospitalized patients using clinical parameters. More recently, Lin et al13 developed a US radiomics-based nomogram combining imaging features with clinical data, achieving promising diagnostic performance (the area under the curve, AUC 0.905) in a single-center study. While this radiomics approach successfully demonstrated the feasibility of quantitative image analysis for gout diagnosis, it had several important limitations that restrict its clinical translation. First, the radiomics methodology relied on high-dimensional feature extraction that lacked direct clinical interpretability, making it difficult for clinicians to understand which specific imaging characteristics contributed to the diagnostic decision. Second, the clinical parameter assessment was limited to basic laboratory markers, without incorporating comprehensive risk factors such as renal function (estimated Glomerular Filtration Rate, eGFR), medication history, and lifestyle factors that are known to influence gout development. Third, validation was restricted to a single center, raising questions about generalizability across different patient populations and healthcare settings. In our team’s previous research endeavors, we developed a deep learning (DL)-based automated diagnostic model for gout using US images of the MTP1 joint, which achieved excellent diagnostic performance.14 However, this initial study was limited by its small sample size and single-center design, raising questions about generalizability. Subsequently, we developed an interpretable ML model that successfully integrated clinical and US features for gout diagnosis, demonstrating the feasibility of multimodal feature integration with good clinical interpretability.15 Despite providing valuable insights through feature importance analysis, this approach utilized traditional ML algorithms and lacked comprehensive integration of clinical parameters, particularly missing key factors such as eGFR, medication history, and lifestyle factors that are known to influence gout development and risk stratification.
Therefore, this study addresses these limitations by developing an integrated gout risk prediction model that combines automated DL predictions from MTP1 joint images, comprehensive clinical parameters, and explicit US diagnostic features. This integrated approach aims to improve diagnostic accuracy and clinical applicability, with results presented as an interpretable nomogram to support clinical decision-making, while ensuring robust validation through evaluation of external datasets.
Materials and Methods
Study Population and Data Preparation
This study was conducted in accordance with the Declaration of Helsinki. All experimental protocols were approved by the Ethics Committee of the Affiliated Hospital of Qingdao University (QYFY WZLL 28151). Due to the retrospective nature of the study, the Ethics Committee of the Affiliated Hospital of Qingdao University waived the need for obtaining informed consent.
To assess model generalizability across distinct settings, we included two centers with differing geographical locations and patient populations. All data were collected from Center 1 (the Affiliated Hospital of Qingdao University) and Center 2 (Shandong Province Chronic Disease Hospital). A retrospective analysis was conducted on the clinical data and US images of the MTP1 joint from patients who underwent US examinations at Center 1 from February 2023 to June 2024, and Center 2 from March 2024 to June 2024. Center 1 represents a general hospital serving a more diverse population, while Center 2 represents a municipal tertiary hospital with high gout prevalence. Sample size was determined through power analysis using G*Power 3.1.9.7 (α = 0.05, power = 0.80), which indicated a minimum requirement of 82 patients for the external testing cohort (ETC) to detect a moderate effect size (Cohen’s d = 0.5) in model performance metrics. In Center 1, cohorts were divided based on the data collection period: the first 70% were allocated to the training cohort (TC) and the remaining 30% to the internal testing cohort (ITC). Patients from Center 2 were designated as the ETC. Each cohort was classified into gout and non-gout groups according to the 2015 ACR/EULAR gout classification criteria.
The inclusion criteria were as follows: Patients suspected of gout who underwent US examinations of the MTP1 and had laboratory test results. The exclusion criteria were as follows: (1) Time interval between US examination and laboratory test exceeding 7 days; (2) US images that were blurry, of poor quality, or did not adequately display the MTP1 joint anatomical structures; (3) Incomplete clinical data (>20% missing values). The patient recruitment process is illustrated in Figure 1.
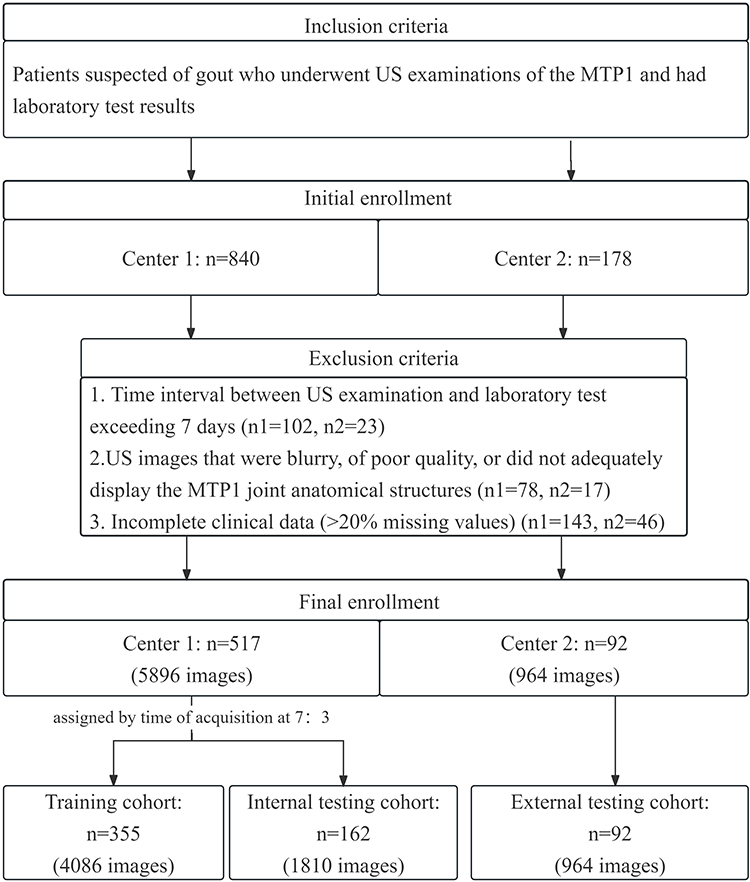 |
Figure 1 The workflow diagram of patient recruitment. Abbreviations: MTP1, first metatarsophalangeal. |
US Examination Protocol and Image Annotation
All US examinations were independently performed and diagnosed by one experienced radiologist from Center 1 and one from Center 2. At Center 1, the US examination was conducted using an ARIETTA 70 device with a 12L6 linear array transducer (frequency range 9–14 MHz). At Center 2, the examination was performed using a Mindray device with an L12-4s linear array transducer (frequency range 6.6–13 MHz). All the scanning and acquisition followed the 2017 EULAR standardized procedures for US imaging in rheumatology and the US imaging acquisition methods for assessing the MTP1 outlined by Molyneux et al16,17 All US examinations were independently performed following standardized protocols (Supplementary Methods S1). At least 9 static images were captured for each patient to comprehensively illustrate the changes in anatomical details. All US images were stored in DICOM format for subsequent analysis.
Two radiologists annotated the MTP1 joint images using Micro DICOM Viewer (32-bit) software. The radiologists jointly reviewed and recorded image characteristics for each joint and created an index table as the foundational data for training and evaluating DL models. The evaluation content included: location (dorsum, medial and sole of the toe) and lesions (aggregates, DCs, tophus, bone erosion, synovial thickening, and joint effusion), as illustrated in Figure S1. To ensure accuracy, any uncertainties in the annotations were discussed and agreed upon with a radiologist with over 10 years of experience. Inter-observer agreement analysis and bias control measures were implemented to minimize potential biases (Supplementary Methods S2).
Clinical Baseline Factors Collection and Selection
Baseline clinical factors were derived from the patients’ electronic medical records and standardized questionnaire. Before constructing the model, all available predictive factors underwent preliminary screening, followed by a literature review and expert consultation to identify potential candidate predictors. Factors with over 20% missing values were excluded in the following analyses to minimize the bias resulting from missing data. Finally, 22 factors, including age, gender, body mass index (BMI), eGFR, alanine aminotransferase (ALT), aspartate aminotransferase (AST), AST/ALT ratio, blood glucose (GLU), triglycerides (TG), cholesterol (CH), blood urea nitrogen (BUN), creatinine (CREA), serum uric acid (SUA), and creatinine clearance rate (CCR), diuretics, allopurinol, diabetes, hypertension, cardiovascular disease (CVD), smoking status, alcohol consumption, dietary habits, were utilized to develop models.
Development and Validation of DL Models
In this study, we compared four DL networks with distinct architectures—DenseNet121,18 Alexnet,19 ResNet1820 and VGG1121—to develop a US diagnostic model for GA based on MTP1 joint US images. These four DL architectures were selected based on their proven performance in medical image analysis tasks and complementary strengths: DenseNet121 for efficient feature reuse, ResNet18 for deep architecture training, AlexNet and VGG11 as established benchmarks. Each architecture offers unique advantages in handling different aspects of US image features. By comparing these networks with different architectures, we aimed to identify the model with optimal diagnostic performance.
We set the learning rate to 1e-4, the batch size to 16, and trained each network for 50 epochs. DenseNet121 consists of four dense blocks and one linear layer, where each layer in a block is connected to all preceding layers, enhancing feature map reuse. For gout diagnosis, we applied the softmax function to convert the feature maps into probabilities, using cross-entropy loss and backpropagation for training. Similarly, AlexNet was built with five convolutional layers and three fully connected layers, incorporating ReLU activation, max pooling, and dropout layers to reduce overfitting. ResNet18 consists of eight residual blocks with skip connections, processing input images through ReLU activation and batch normalization. VGG11 uses small 3 × 3 convolution kernels, eight convolutional layers, fully connected layers, and max pooling, all with ReLU activation. Each model was trained with cross-entropy loss, a learning rate of 1e-4, and a batch size of 16.
For input data, US images were collected from three different positions of the MTP1 joint (dorsal, medial, and plantar views). For each subject, we randomly selected three images from each position, resulting in nine images as inputs to the network. These images were cropped to 700 × 320 pixels from the central area and normalized for consistency in pixel value distribution. Data augmentation, including translation, was applied to increase the diversity of training data and improve the model’s generalization capabilities. After training, we evaluated the models using both ITC and ETC. Additionally, Gradient-weighted Class Activation Mapping (Grad-CAMs)18,22 was used to generate heatmaps that highlight regions of interest in the images, aiding in the interpretation of the model’s decision-making process and identifying key biomarkers for gout diagnosis.
This experiment was conducted on the Linux 4.4.0 operating system with an x86_64 processor, using the Pytorch 1.13.1 framework and Python 3.8. The hardware included an Intel(R) Xeon(R) CPU E5-2620 v4 @ 2.10 GHz and an NVIDIA GeForce RTX 3090 GPU, with 24GB of memory. All programs were implemented through the open-source framework PyTorch.
Development of the Risk Prediction Models and Nomogram
Univariate logistic regression analysis was performed on TC, and variables with significance (p < 0.05) were included in the multivariate logistic regression analysis using the forward likelihood ratio method to determine independent risk factors for gout. Based on the results of the multivariate logistic regression analysis, clinical characteristics, US features, and DL model were separately or jointly included in the model. Five models were constructed: clinical model (C model), US model, clinical- US model (C-U model), clinical-DL model (C-DL model), and combined nomogram (including clinical data, US features and DL). The variance inflation factor (VIF) was then used to assess whether collinearity existed among the variables within each predictive model. A VIF >5 was considered indicative of collinearity between two variables.
Statistical Analysis
Statistical analyses were conducted using SPSS version 27.0, R version 4.3.3, and Python version 3.8. Continuous variables were expressed as mean ± SD or median (interquartile range) based on distribution normality. Categorical variables were presented as numbers (percentages) and compared using chi-square test or Fisher’s exact test.
Missing data patterns were evaluated across 22 candidate variables (excluding US features and DL model predictions which had complete data). Multiple imputation using chained equations (MICE) was implemented for variables with less than 20% missingness, using 10 imputations with 20 iterations each. Missing Data Analysis and Imputation Procedures are detailed in Supplementary Methods S3. Convergence was confirmed through trace plots and potential scale reduction factors below 1.03 (Figure S2 A and B). Sensitivity analyses were conducted to evaluate the robustness of our findings, with detailed methods and results provided in Supplementary Methods S4.
Univariate logistic regression analysis was performed to identify potential risk factors, with Benjamini–Hochberg false discovery rate (FDR) correction applied to control for multiple comparisons (q = 0.05). Variables with FDR-adjusted p < 0.05 and established clinical relevance were included in multivariate analysis using forward likelihood ratio method. Multicollinearity was assessed using variance inflation factors (VIF), with VIF >5.0 indicating problematic collinearity.
Based on multivariate results, five prediction models were constructed: clinical model (C), US model, clinical-US model (C-U), clinical-DL model (C-DL), and combined nomogram incorporating all significant predictors. Model performance was evaluated using sensitivity, specificity, accuracy, the receiver operating characteristic (ROC) curve, and F1 score. Optimal cut-off values were determined using maximum Youden index. AUC comparisons were performed using DeLong test.
Model goodness of fit was assessed using R-squared, Akaike Information Criterion (AIC), root mean square error (RMSE), and mean absolute error (MAE). Calibration performance was evaluated using calibration curves with 1000 bootstrap resamples and Brier scores. The Brier score ranges from 0 to 1, where 0 indicates perfect prediction and 1 indicates the worst prediction, with models achieving a Brier Score <0.2 typically regarded as exhibiting satisfactory performance, while those with a Brier Score >0.3 require further optimization. Decision curve analysis (DCA) was performed to evaluate clinical utility at different threshold probabilities. All statistical tests were two-sided, with p < 0.05 considered statistically significant.5
Results
Baseline Characteristics
The study encompassed a total of 609 joints from Center 1 and Center 2, comprising 6860 images of MTP1 from 551 patients. TC includes 355 joints (4,086 images) from 340 patients, comprising 250 gout and 105 non-gout cases; ITC includes 162 joints (1,810 images) from 154 patients, comprising 122 gout and 40 non-gout cases; ETC includes 92 joints (964 images) from 57 patients, comprising 57 gout and 35 non-gout cases.
Missing data analysis revealed that 563 patients (92.4%) had complete data across all 22 variables, with remaining cases showing predominantly survey-related missing patterns (Table S1 and Figure S2 C and D). Detailed clinical parameters and US features of the three cohorts were presented in Table 1.
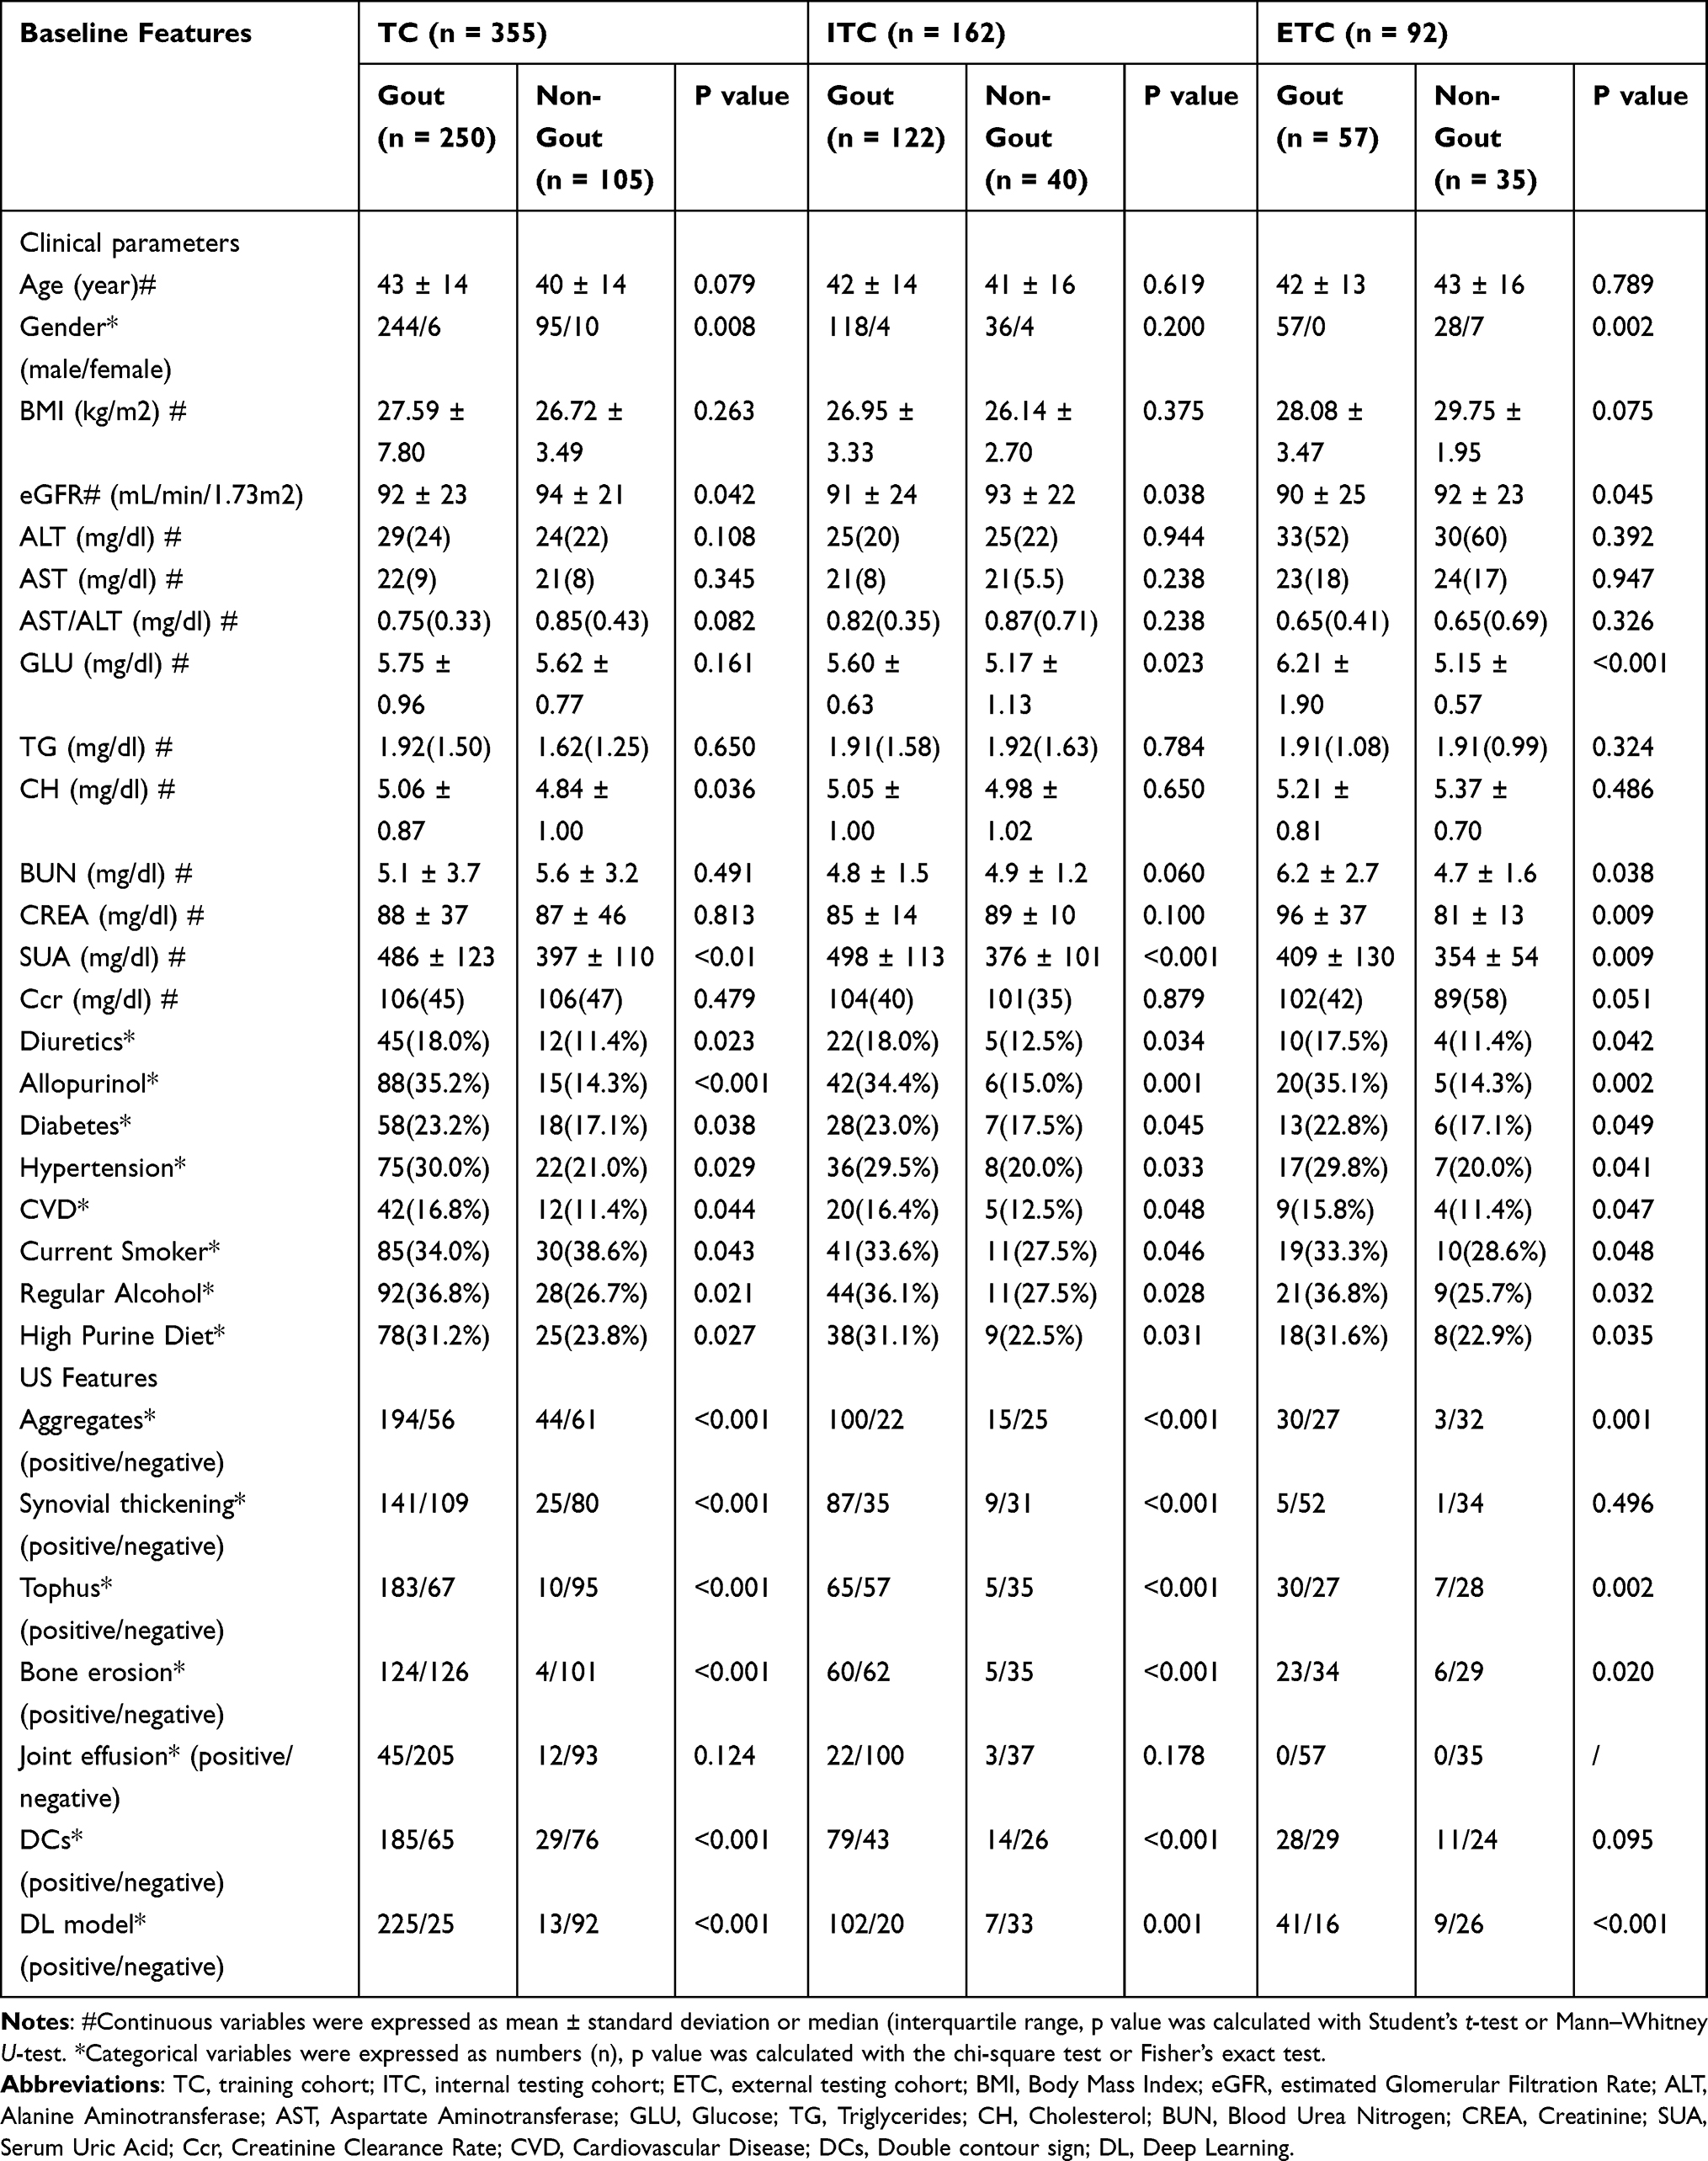 |
Table 1 Baseline Features of the Cohorts |
Performance of Different DL Networks and Visualization
In this study, diagnostic results of our Densenet121 were compared with other DL networks including Alexnet,19 ResNet1820 and VGG11.21 These DL networks are widely used to learn features for image classifications and we replace the Densenet121 with these networks to learn the features of US images. The results were compared in Table 2 and Figure 2. In both the ITC and ETC, DenseNet121 demonstrated superior overall performance compared to other DL networks, achieving the highest diagnostic efficacy. In the ITC, DenseNet121 achieved an AUC of 0.939 (95% CI: 0.898, 0.973), with an accuracy of 0.878, sensitivity of 0.875, and specificity of 0.885. In the ETC, the corresponding values were 0.881 (95% CI: 0.779, 0.947), 0.821, 0.727, and 0.889. Delong’s test revealed statistically significant differences in AUC values between DenseNet121 and both AlexNet and VGG11 in the ITC (P = 0.014, P = 0.002). In the ETC, DenseNet121’ s AUC was higher than those of the other networks, although this difference was not statistically significant. Additionally, Grad-CAM visualizations produced by the DL networks highlighted regions within the images that contributed significantly to feature generation outputs. These heterogeneous signal areas are critical for feature extraction. Each DL network exhibited distinct attention regions (Figure 3). Grad-CAM visualizations generated by DenseNet121 showed that the model primarily focused on important anatomical structures within and around joints, as well as areas of crystal deposition or lesions. This alignment with radiologists’ attention patterns suggested the model learned meaningful feature representations rather than spurious correlations. In summary, we selected DenseNet121 as the foundational network for our DL diagnostic model.
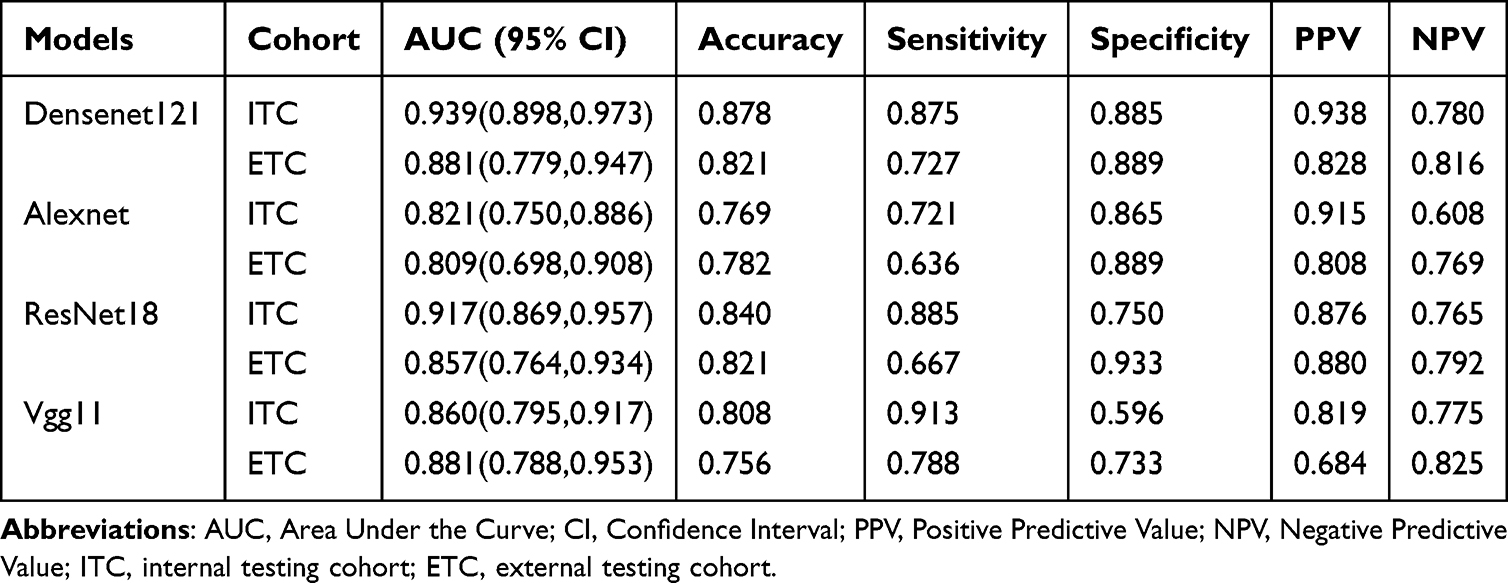 |
Table 2 The Performance Comparison of Different DL Networks |
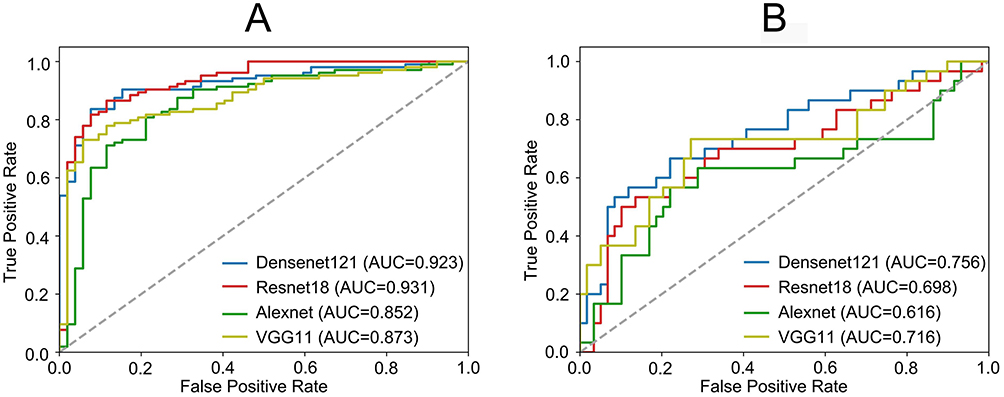 |
Figure 2 ROC curves of different DL networks in the ITC (A) and ETC (B), respectively. Abbreviations: ROC, Receiver operating characteristic; DL, deep learning; ITC, internal testing cohort; ETC, external testing cohort. |
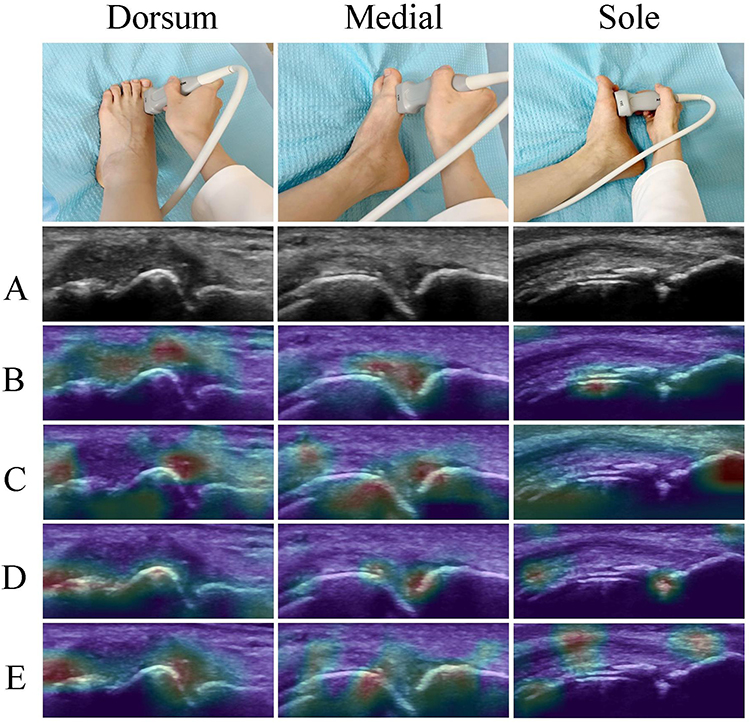 |
Figure 3 Grad-CAM visualization results of different DL networks in analyzing MTP1 ultrasound images. The color intensity represents the contribution of each region to the model’s decision - red indicates higher importance while blue indicates lower importance. (A) Original ultrasound image with lesion indicated by arrow (B) DenseNet121 (C) ResNet18 (D) VGG11 (E) AlexNet. Abbreviations: DL, deep learning; MTP1, first metatarsophalangeal. |
Development and Validation of the Risk Prediction Models
Univariate analysis revealed significant associations after FDR correction (adjusted P < 0.05) between gender, eGFR, SUA, regular alcohol, high purine diet, aggregates, synovial thickening, tophus, bone erosion, DCs, and the DL model predicted value with gout (Table S2). Multivariate analysis identified gender, SUA, eGFR, tophus, bone erosion, DCs, and the DL model as independent predictors of gout (Table 3). The clinical characteristics, US features, and DL model from the multivariate analysis were included separately or in combination into five risk prediction models. Collinearity diagnostics for the variables in the five models showed no multicollinearity, as indicated by VIF values.
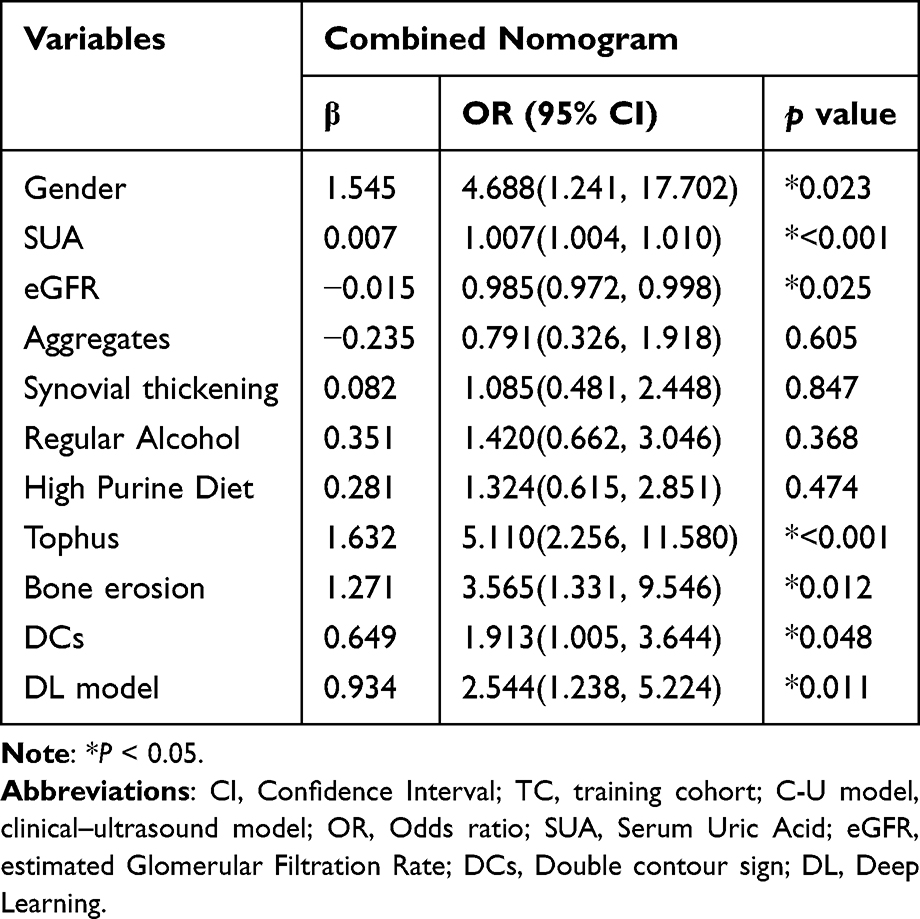 |
Table 3 Multivariate Logistic Regression Analysis of Combined Nomogram in the TC |
In both the ITC and the ETC, the combined nomogram, constructed from clinical characteristics, US features, and the DL model, outperformed the C model, US model, C-U model, and C-DL model in predicting gout risk. Specifically, the AUC values for the combined nomogram in the ITC and ETC were 0.904 (95% CI: 0.843, 0.965) and 0.881 (95% CI: 0.815, 0.947), respectively. DeLong tests showed that in the ITC, the combined nomogram’ s AUC was significantly higher than that of the C model, US model, and C-DL model (P < 0.001, P = 0.001, P = 0.042). In the ETC, the combined nomogram’ s AUC was significantly higher than that of the C model, US model and C-U model (P = 0.003, P < 0.001, P = 0.018). In the TC, the combined nomogram’ s Youden index was 0.884, with an optimal cutoff point of 0.569 (95% CI: 0.886~0.952). A Youden index of 0.884 indicated excellent performance in distinguishing true positive from true negative cases, reflecting high classification accuracy. The optimal cutoff of 0.569 suggested a well-balanced trade-off between sensitivity and specificity at this threshold. This threshold signified that patients with a risk score exceeding 0.569 were classified as high-risk for gout. As depicted in the nomogram (Figure 4), clinical characteristics, US features, and the DL model can be calculated using the obtained features. Each feature was assigned a score on a scale from 0 to 100. By summing the scores of each feature, a total score was obtained. Projecting this score onto the bottom risk axis allows prediction of gout risk in suspicious patients. Performance comparisons of the five models across the three cohorts were shown in Table 4, Figure 5A and B, with confusion matrices in Figure S3.
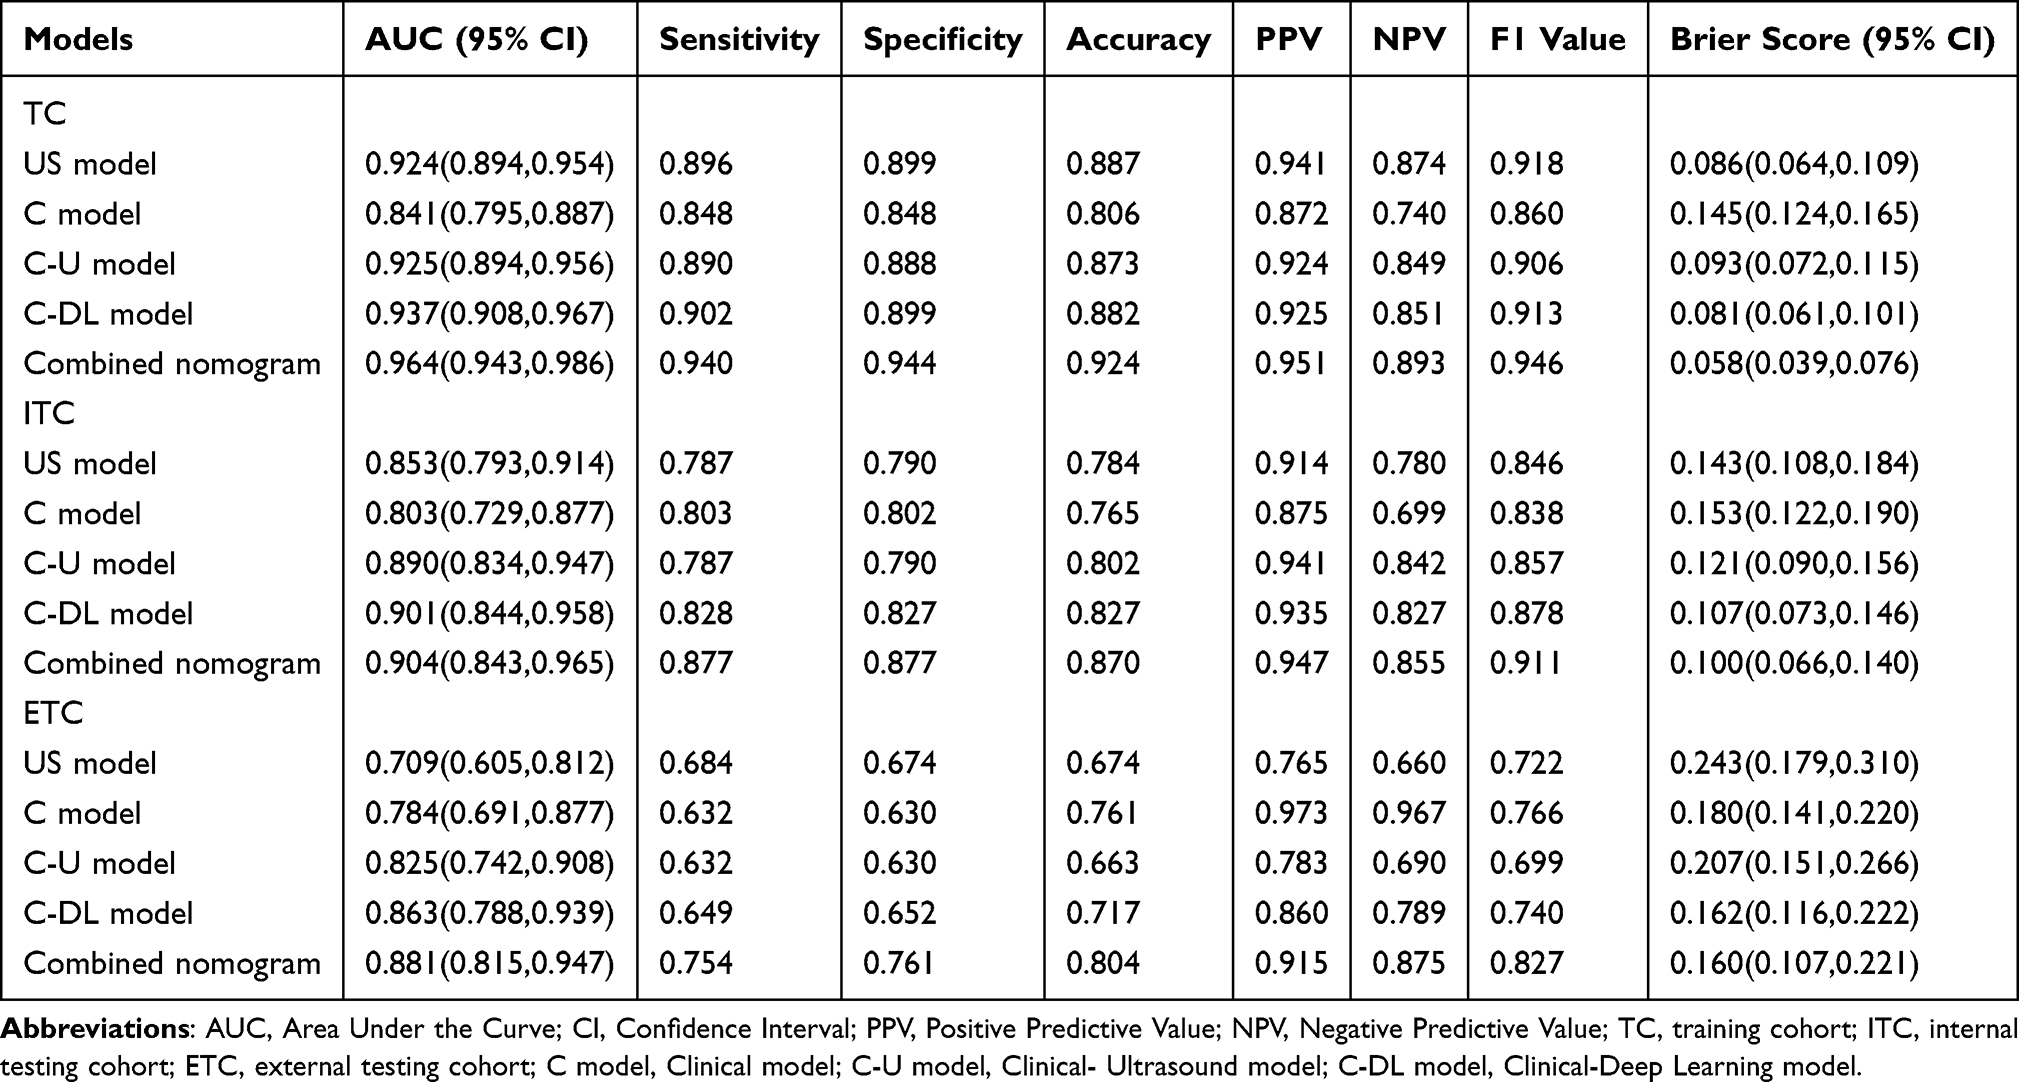 |
Table 4 The Performance of the Different Risk Prediction Models |
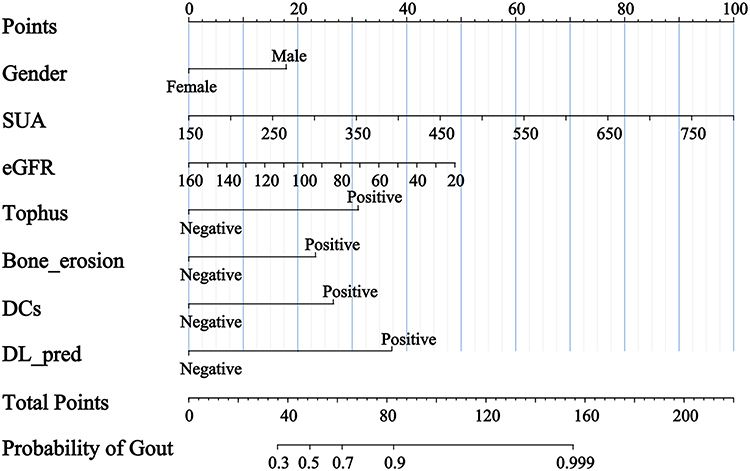 |
Figure 4 A combined nomogram based on DL integrated with clinical data and US features. It incorporates gender, SUA, eGFR, tophus, DCs, bone erosion, and DL. Abbreviations: DL, Deep Learning; SUA, Serum Uric Acid; eGFR, estimated Glomerular Filtration Rate; DCs, Double contour sign. |
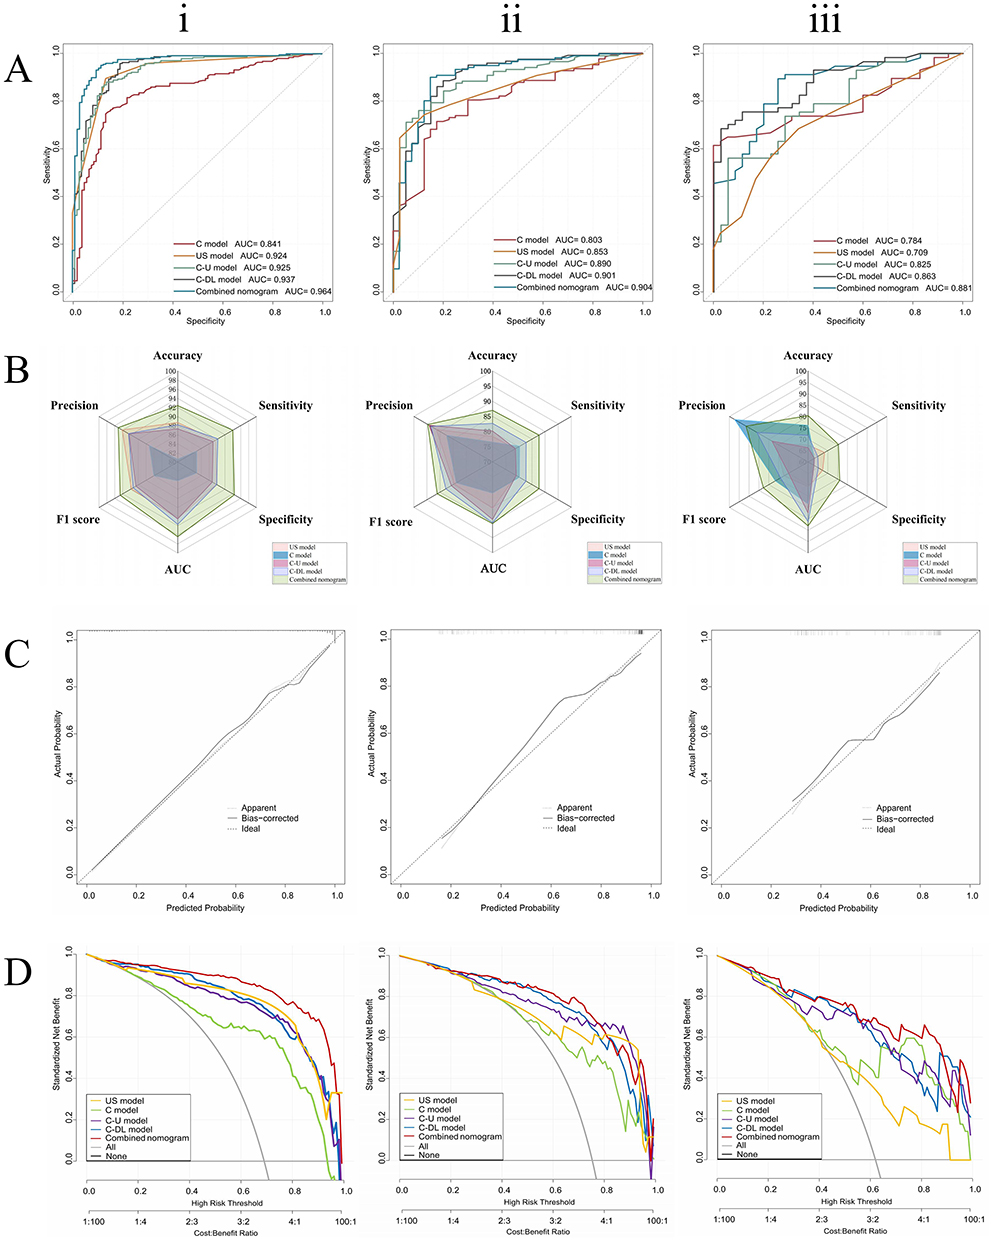 |
Figure 5 Comparison of the clinical model, US model, clinical-ultrasound model, clinical-DL model, and combined nomogram performance based on the (i) TC, (ii) ITC, and (iii) ETC. (A) The receiving operating characteristic curves. (B) The radar chart visualization of prediction performance. (C) Calibration plot of the combined nomogram. (D) Decision curves analysis. Abbreviations: DL, Deep Learning; SUA, Serum Uric Acid; DCs, Double contour sign; TC, training cohort; ITC, internal testing cohort; ETC, external testing cohort. |
Among the five risk prediction models, the combined nomogram had the lowest AIC value (162.12), followed by the C-DL model (214.45) and US model (215.63), while the C-U model (321.41) and C model (328.25) having the highest AIC values. The combined nomogram also had the highest R2 (0.713), the lowest MSE and RMSE values (0.057, 0.240). Considering AIC, MSE, and RMSE together, the combined nomogram demonstrated good goodness of fit. Additionally, the calibration curve for the combined nomogram indicated a good match between predicted and observed outcomes (Figure 5C). Among the five models, the combined nomogram achieved the lowest Brier scores of 0.058(0.039, 0.076) in the TC, 0.100(0.066, 0.140) in the ITC, and 0.160(0.107, 0.221) in the ETC. This indicates that the combined nomogram outperformed the other models across all datasets, exhibiting the smallest prediction errors and the highest accuracy. Notably, its Brier score of only 0.058(0.039,0.076) in the TC further underscores the model’s superiority. This suggests that the combined nomogram not only demonstrates excellent predictive performance in the TC but also possesses relatively strong generalization capabilities in both ITC and ETC, highlighting its significant clinical application potential. DCA validated the clinical decision utility of the five models. DCA showed that the combined nomogram provided more net benefit than the “all” or “none” intervention strategies across all threshold probabilities in the three cohorts (Figure 5D). Furthermore, the combined nomogram exhibited a larger area compared to the other four models.
Discussion
This study integrated DL models with clinical data and US features to develop a comprehensive nomogram for predicting gout risk, which was subsequently validated using an independent ETC. The results showed that: (1) The DL model could effectively distinguish patient with gout from non-gout, demonstrating excellent performance with AUC values of 0.939 and 0.881 in the ITC and ETC, respectively. (2) The combined nomogram, integrating clinical data, US features, and the DL model, outperformed models basing on single or dual features in predicting gout risk, showing the best performance in both the ITC and ETC. The DCA validated the clinical decision utility of the combined nomogram.
GA is the most common type of inflammatory arthritis, with a significantly higher incidence in males than females, and the prevalence increases with advancing age. During acute flares, it is characterized by severe erythema, swelling, and pain in one or multiple joints, which may progress to chronic destructive arthropathy. In severe cases, it can involve other vital organs such as kidneys, substantially impairing patients’ quality of life and potentially affecting life expectancy.23
In recent years, US examination has gained widespread recognition and application in gout detection.24 Han et al25 conducted a single-center prospective cohort study investigating patients initiating urate-lowering therapy, exploring the value of musculoskeletal US in predicting gout flares. This study employed conventional statistical methods to achieve moderate predictive accuracy (AUC = 0.72) for forecasting gout flares. With the rapid advancement of AI technology in the medical field, it has demonstrated significant value in US-assisted diagnosis through automated image analysis, precise feature recognition, and intelligent decision support, effectively enhancing diagnostic efficiency and accuracy. Lin et al13 developed a gout prediction model in the form of a nomogram by integrating clinical information and US imaging features, achieving excellent diagnostic performance (AUC = 0.905). However, their nomogram lacked specific clinical indicators and imaging features, contained incomplete clinical predictive factors, and the radiomics-derived features had low clinical interpretability, making it difficult for clinicians to understand and accept features lacking biological significance. Additionally, the single-center design limited the model’s generalizability. In our previous research,15 we developed a gout joint prediction model based on ML (incorporating clinical and US features). However, ML models are highly dependent on data quality, lack interpretability and causal reasoning capabilities, are prone to bias, and have limited generalization ability in new environments. Furthermore, the clinical factors included lacked key information crucial for gout prediction (laboratory parameters, lifestyle, and dietary habits), and the visualization method (SHapley Additive exPlanations) could not quantify gout risk. To our knowledge, DL technology can automatically learn high-level feature representations from large volumes of complex data and demonstrate superior performance in processing unstructured data such as images and text.26 Therefore, to address the aforementioned limitations, this study constructed a comprehensive model for predicting gout risk based on DL technology, incorporating more comprehensive clinical predictive factors. Moreover, nomograms, as statistical tools, can predict individual-specific outcomes by transforming complex regression equations into intuitive graphical representations, thereby assisting clinicians in identifying high-risk patients while enabling quantification of gout risk.27 Consequently, we performed visualization and quantification in nomogram format.
In this study, four DL networks were employed for the differential diagnosis between gout and non-gout cases. DenseNet121 demonstrated superior overall performance when multiple metrics were considered simultaneously. It achieved the highest AUC values in both cohorts (ITC: 0.939, ETC: 0.881) while maintaining a balanced sensitivity-specificity profile (ITC: 0.875/0.885, ETC: 0.727/0.889). Most importantly, it exhibited consistent performance across both test cohorts, indicating superior generalization capability. In contrast, other models showed significant limitations: AlexNet achieved the lowest AUC values (0.821 and 0.809, respectively) and demonstrated lower sensitivity (0.721 and 0.636, respectively), potentially resulting in numerous true gout cases being missed. Although ResNet18 showed excellent internal performance (AUC: 0.917), its performance declined markedly in ETC. VGG11 exhibited unstable performance with extremely low specificity in the ITC (0.596), leading to a high rate of false-positive results. From a clinical application perspective, the balanced performance characteristics of DenseNet121 are crucial. Its consistent sensitivity-specificity balance across different populations indicates reliability in various clinical settings, while its excellent negative predictive value (NPV) performance (0.780 and 0.816) is of significant importance for ruling out gout in low-risk patients. Furthermore, Grad-CAM visualization of DenseNet121 shows that the generated heatmap is overlaid on the MTP1 joint US images. The red regions mainly concentrated on the lesion areas. The high activation areas correspond to the regions of interest for radiologist, partially validating the effectiveness of the model.
Risk factors for gout have been reported in many studies.3,28–30 In this study, we integrated the features identified as independent risk factors in the multivariate regression analysis to construct a nomogram for the comprehensive assessment of gout risk in suspected patients, quantifying the risk into specific values to enhance the objectivity of the prediction to some extent. Similar with previous works,28–30 the multivariate regression analysis identified gender, SUA, eGFR, tophus, bone erosion, and DCs, as independent risk factors in our study. First, our study identified decreased eGFR as an independent risk factor for gout, which is consistent with the complex pathophysiological relationship between renal function and uric acid metabolism. The kidney plays a crucial role in uric acid homeostasis, with approximately two-thirds of uric acid excretion occurring through renal pathways.31 Reduced eGFR reflects impaired renal function, which can lead to decreased uric acid excretion and subsequent hyperuricemia. This creates a bidirectional relationship where hyperuricemia may further compromise renal function, establishing a vicious cycle.32 The nomogram in our study assigned significant points to decreased eGFR levels, highlighting its importance in gout risk assessment. This finding is particularly relevant for clinical practice as it suggests that patients with compromised renal function, even those with moderately reduced eGFR, may benefit from more rigorous monitoring for gout development. Furthermore, the inclusion of eGFR in our prediction model emphasizes the need for a comprehensive approach to gout management that considers both the inflammatory aspects of the disease and the underlying metabolic and renal functions. Second, this study’ s multivariate regression analysis found that tophus, DCs, and bone erosion can be considered independent risk factors for gout, with tophus showing the highest score (approximately 30 points), followed by DCs (around 25 points). Though aggregates, tophus, DCs, and bone erosion were typical indication of GA on US, in clinical practice patients often exhibit only one or two of these suspicious signs. Currently, no guidelines explicitly state the weight of different signs in diagnosing GA. Therefore, this study helps guide radiologist in diagnosing GA to some extent. Previous studies28 suggested that age and BMI were independent risk factors for gout, however, in our study no significant differences in age or BMI were found between the gout and non-gout groups. This may be attributed to the fact that our study was conducted in a region with high gout prevalence, prompting patients to seek medical care at an earlier stage. This is evidenced by the finding that the mean age of gout patients in our study was lower than that reported in previous studies.33–35 Additionally, Karlsson et al36 found that the impact of higher BMI on increased gout risk is more pronounced in female, while large-scale epidemiological surveys show that the ratio of male to female gout patients can be as high as 20:1 before menopause, with the proportion of females gradually increasing after menopause. In this study, the male-to-female ratio in the TC was 21:1, while in the gout group, this ratio was 40:1, which further attenuated the effect of BMI on gout risk and explained the validity of our findings. The observed differences in baseline characteristics between cohorts, particularly in gender ratio and serum uric acid levels, reflect the real-world heterogeneity in patient populations. Despite these differences, our model maintained robust performance in the ETC, suggesting good generalizability across diverse clinical settings.
Recent developments in nomograms emphasize their predictive values in disease assessment, diagnosis, and therapy effectiveness.37–39 Therefore, we developed a simple and practical combined nomogram that integrates clinical data, US features, and DL prediction values for accurate, personalized gout risk prediction. In this study, the combined nomogram constructed based on gender, SUA, eGFR, tophus, DCs, bone erosion, and DL prediction values showed good calibration and satisfactory discrimination in ITC and ETC (AUC = 0.904, AUC = 0.881). The combined nomogram yielded a Youden index of 0.884, indicating strong diagnostic performance. The optimal cutoff point for risk prediction was determined to be 0.569 (95% CI: 0.886–0.952). This threshold signifies that patients with a risk score exceeding 0.569 are classified as high-risk for gout. This nomogram serves as a quantitative risk assessment tool for gout that integrates multiple risk factors to provide individualized risk scores for patients. For clinicians, it can assist in developing precision treatment strategies, while for patients, it provides intuitive visualization of disease risk, enhances health awareness, improves treatment adherence, and facilitates shared decision-making.
Our study has several limitations that need to be addressed in future work. First, while this is a retrospective analysis with a large sample size and strong model performance, prospective implementation studies are required to validate its long-term effectiveness and establish its practical utility across different healthcare settings, particularly in primary care and resource-limited environments. Second, the use of different US equipment between centers might introduce technical variations, although we implemented standardized protocols to minimize this impact. Third, the DL model was developed using only conventional static US images; integrating multimodal US information would help capture more data and improve clinical utility. Future studies incorporating dynamic US features and automated image acquisition protocols could enhance model performance.
Conclusion
In conclusion, our findings demonstrate that gender, SUA, eGFR, and US features (tophus, DCs, bone erosion, and DL predictions) serve as effective risk predictors for gout. Based on these predictors, we developed and validated a nomogram that quantifies gout risk, demonstrating excellent predictive performance in gout risk assessment. However, given the retrospective nature of this study, future prospective validation and real-world implementation research are essential to establish the clinical utility of this nomogram prior to widespread clinical adoption.
Abbreviations
US, Ultrasound; GA, gouty arthritis; DCs, Double contour sign; AI, Artificial Intelligence; MTP1, first metatarsophalangeal; ML, Machine Learning; DL, Deep Learning; TC, Training cohort; ITC, Internal testing cohort; ETC, External testing cohort; BMI, Body Mass Index; eGFR, estimated Glomerular Filtration Rate; ALT, Alanine Aminotransferase; AST, Aspartate Aminotransferase; GLU, Glucose; TG, Triglycerides; CH, Cholesterol; BUN, Blood Urea Nitrogen; CREA, Creatinine; SUA: Serum Uric Acid; Ccr: Creatinine Clearance Rate; CVD, Cardiovascular Disease; VIF, variance inflation factor; PPV, positive predictive value; NPV, negative predictive value; ROC, receiver operating characteristic; AUC, area under the curve; RMSE, Root Mean Square Error; MAE, Mean Absolute Error; AIC, Akaike information criterion; DCA, Decision curve analysis.
Data Sharing Statement
The data that support the findings of this study are available from the corresponding author Chunping Ning upon reasonable request.
Ethics Approval and Informed Consent
This study was approved by the Ethics Committee of the Affiliated Hospital of Qingdao University (QYFY WZLL 28151). This study was conducted according to the Declaration of Helsinki and institutional guidelines.
Acknowledgments
We thank the Shandong Province Chronic Disease Hospital for providing the necessary data for this study and thank all the participants in this study.
Author Contributions
All authors made a significant contribution to the work reported, whether that is in the conception, study design, execution, acquisition of data, analysis and interpretation, or in all these areas; took part in drafting, revising or critically reviewing the article; gave final approval of the version to be published; have agreed on the journal to which the article has been submitted; and agree to be accountable for all aspects of the work.
Funding
This work was supported by the National Key Research and Development Program of China (Grant No. 2022YFC2503302 and No. 2022YFC2503305), the Clinical Medicine and X Research Program of Affiliated Hospital of Qingdao University (QDFY+X2024133) and Shanghai Municipal Science and Technology Major Project (Grant 2021SHZDZX0102).
Disclosure
The authors declare that they have no competing interests in this work.
References
1. Dehlin M, Jacobsson L, Roddy E. Global epidemiology of gout: prevalence, incidence, treatment patterns and risk factors. Nat Rev Rheumatol. 2020;16(7):380–16. doi:10.1038/s41584-020-0441-1
2. McCormick N, Lin K, Yokose C, Lu N, Zhang Y, Choi HK. Unclosing premature mortality gap among patients with gout in the us general population, independent of serum urate and atherosclerotic cardiovascular risk factors. Arthritis Care Res. 2024;76(5):691–702. doi:10.1002/acr.25292
3. Mikuls TR. Gout. N Engl J Med. 2022;387(20):1877–1887. doi:10.1056/NEJMcp2203385
4. El-Mallah R, Ibrahim RA, El Attar EA. The role of ultrasound in evaluating the effect of urate-lowering drugs in gout patients. Curr Rheumatol Rev. 2022;18(4):338–345. doi:10.2174/1573397118666220429092312
5. Neogi T, Jansen TL, Dalbeth N, et al. 2015 Gout classification criteria: an American College of Rheumatology/European League Against Rheumatism collaborative initiative. Ann Rheum Dis. 2015;74(10):1789–1798. doi:10.1136/annrheumdis-2015-208237
6. Li S, Xu G, Liang J, Wan L, Cao H, Lin J. The role of advanced imaging in gout management. Front Immunol. 2021;12:811323. doi:10.3389/fimmu.2021.811323
7. Mihra S, Taljanovic M, David M. High-Resolution US of rheumatologic diseases. Radiographics. 2015;35(7):2026–2048. doi:10.1148/rg.2015140250
8. Richette P, Doherty M, Pascual E, et al. 2018 updated European League Against Rheumatism evidence-based recommendations for the diagnosis of gout. Ann Rheum Dis. 2020;79(1):31–38. doi:10.1136/annrheumdis-2019-215315
9. Brikman S, Serfaty L, Abuhasira R, Schlesinger N, Bieber A, Rappoport N. A machine learning-based prediction model for gout in hyperuricemics: a nationwide cohort study. Rheumatology (Oxford). 2024;63(9):2411–2417. doi:10.1093/rheumatology/keae273
10. Wang M, Li R, Qi H, et al. Metabolomics and machine learning identify metabolic differences and potential biomarkers for frequent versus infrequent gout flares. Arthritis Rheumatol. 2023;75(12):2252–2264. doi:10.1002/art.42635
11. Shen X, Wang C, Liang N, et al. Serum metabolomics identifies dysregulated pathways and potential metabolic biomarkers for hyperuricemia and gout. Arthritis Rheumatol. 2021;73(9):1738–1748. doi:10.1002/art.41733
12. Jatuworapruk K, Grainger R, Dalbeth N, Taylor WJ. Development of a prediction model for inpatient gout flares in people with comorbid gout. Ann Rheum Dis. 2020;79(3):418–423. doi:10.1136/annrheumdis-2019-216277
13. Lin M, Yan L, He M, Chen S. Development and validation of an ultrasound-based clinical radiomics nomogram for diagnosing gouty arthritis. Ultrasound Med Biol. 2025;51(4):650–660. doi:10.1016/j.ultrasmedbio.2024.12.009
14. Xiao L, Zhao Y, Li Y, Yan M, Liu M, Ning C. Deep learning-based automated detection and diagnosis of gouty arthritis in ultrasound images of the first metatarsophalangeal joint. Med Ultrason. 2025;27(3): 268–275. doi:10.11152/mu-4495
15. Xiao L, Zhao Y, Li Y, et al. Developing an interpretable machine learning model for diagnosing gout using clinical and ultrasound features. Eur J Radiol. 2025;184:111959. doi:10.1016/j.ejrad.2025.111959
16. Moller I, Janta I, Backhaus M, et al. The 2017 EULAR standardised procedures for ultrasound imaging in rheumatology. Ann Rheum Dis. 2017;76(12):1974–1979. doi:10.1136/annrheumdis-2017-211585
17. Molyneux P, Bowen C, Ellis R, Rome K, Jackson A, Carroll M. Ultrasound imaging acquisition procedures for evaluating the first metatarsophalangeal joint: a scoping review. Ultrasound Med Biol. 2022;48(3):397–405. doi:10.1016/j.ultrasmedbio.2021.11.009
18. Huang G, Liu Z, van der Maaten L, Weinberger KQ. Densely connected convolutional networks.
19. Krizhevsky A, Sutskever I, Hinton GE. ImageNet classification with deep convolutional neural networks. Commun ACM. 2012;60:84–90. doi:10.1145/3065386
20. He K, Zhang X, Ren S, Sun J. Deep residual learning for image recognition.
21. Simonyan K, Zisserman A. Very deep convolutional networks for large-scale image recognition Proc. Int. Conf. Learn. Represent. (ICLR). 2014. doi:10.48550/arXiv.1409.1556
22. Selvaraju RR, Cogswell M, Das A, Vedantam R, Parikh D, Batra D. Grad-CAM: visual Explanations from Deep Networks via Gradient-Based Localization. Int J Comput Vis. 2019;128(2):336–359. doi:10.1007/s11263-019-01228-7
23. Collaborators GBDG. Global, regional, and national burden of gout, 1990-2020, and projections to 2050: a systematic analysis of the global burden of disease study 2021. Lancet Rheumatol. 2024;6(8):e507–e517. doi:10.1016/S2665-9913(24)00117-6
24. Tao H, Mo Y, Liu W, Wang H. A review on gout: looking back and looking ahead. Int Immunopharmacol. 2023;117:109977. doi:10.1016/j.intimp.2023.109977
25. Han L, Li R, Dalbeth N, et al. The value of musculoskeletal ultrasound in predicting gout flares in index joints: a prospective cohort study of people with gout starting urate-lowering therapy. Semin Arthritis Rheum. 2024;67:152418. doi:10.1016/j.semarthrit.2024.152418
26. LeCun Y, Bengio Y, Hinton G. Deep learning. Nature. 2015;521(7553):436–444. doi:10.1038/nature14539
27. Zhao L, Zhang T, Li X, et al. Development and validation of a nomogram for predicting acute kidney injury in septic patients. J Inflamm Res. 2024;17:5653–5662. doi:10.2147/jir.S470773
28. Oka P, Chong WM, Ng DX, Aau WK, Tan NC. Epidemiology and risk factors associated with gout control among adult Asians: a real-world retrospective cohort study. Front Med Lausanne. 2023;10:1253839. doi:10.3389/fmed.2023.1253839
29. Lee JY, Park SY, Sohn SY. Increased risk of incident gout in patients with hyperthyroidism: a nationwide retrospective cohort study. Rheumatol Int. 2023;44:451–458. doi:10.1007/s00296-023-05423-1
30. Punzi L, PG RL, Scanu A, Ramonda R, Oliviero F. Gout: one year in review 2023. Clin exp rheumatol. 2024;42(1):1–9. doi:10.55563/clinexprheumatol/uhyzcr
31. Yanai H, Adachi H, Hakoshima M, Katsuyama H. Molecular biological and clinical understanding of the pathophysiology and treatments of hyperuricemia and its association with metabolic syndrome, cardiovascular diseases and chronic kidney disease. Int J Mol Sci. 2021; 22(17): 9221. doi:10.3390/ijms22179221
32. Barman Z, Hasan M, Miah R, et al. Association between hyperuricemia and chronic kidney disease: a cross-sectional study in Bangladeshi adults. BMC Endocr Disord. 2023;23(1):45. doi:10.1186/s12902-023-01304-7
33. Wang Q, Bao H, Guo LH, et al. Quantitative assessment of crystal dissolution in gout during urate-lowering therapy with computer-aided MicroPure imaging: a cohort study. Ann Transl Med. 2021;9(18):1444. doi:10.21037/atm-21-4059
34. Hammam N, Tharwat S, ME A, et al. Unsupervised cluster analysis of clinical and ultrasound features reveals unique gout subtypes: results from the Egyptian College of Rheumatology (ECR). Diabetes Metab Syndr. 2023;17(12):102897. doi:10.1016/j.dsx.2023.102897
35. Wang Q, Guo LH, Li XL, et al. Differentiating the acute phase of gout from the intercritical phase with ultrasound and quantitative shear wave elastography. Eur Radiol. 2018;28(12):5316–5327. doi:10.1007/s00330-018-5529-5
36. Karlsson T, Hadizadeh F, Rask-Andersen M, Johansson A, Ek WE. Body mass index and the risk of rheumatic disease: linear and nonlinear mendelian randomization analyses. Arthritis Rheumatol. 2023;75(11):2027–2035. doi:10.1002/art.42613
37. Huang YQ, Liang CH, He L, et al. Development and validation of a radiomics nomogram for preoperative prediction of lymph node metastasis in colorectal cancer. J Clin Oncol. 2016;34(18):2157–2164. doi:10.1200/JCO.2015.65.9128
38. Du Y, Cai M, Zha H, et al. Ultrasound radiomics‑based nomogram to predict lymphovascular invasion in invasive breast cancer: a multicenter, retrospective study. Eur Radiol. 2023;34:136–148. doi:10.1007/s00330-023-09995-1
39. Ugras S, Stempel M, Patil S, Morrow M. Estrogen receptor, progesterone receptor, and HER2 status predict lymphovascular invasion and lymph node involvement. Ann Surg Oncol. 2014;21(12):3780–3786. doi:10.1245/s10434-014-3851-y
 © 2026 The Author(s). This work is published and licensed by Dove Medical Press Limited. The
full terms of this license are available at https://www.dovepress.com/terms
and incorporate the Creative Commons Attribution
- Non Commercial (unported, 4.0) License.
By accessing the work you hereby accept the Terms. Non-commercial uses of the work are permitted
without any further permission from Dove Medical Press Limited, provided the work is properly
attributed. For permission for commercial use of this work, please see paragraphs 4.2 and 5 of our Terms.
© 2026 The Author(s). This work is published and licensed by Dove Medical Press Limited. The
full terms of this license are available at https://www.dovepress.com/terms
and incorporate the Creative Commons Attribution
- Non Commercial (unported, 4.0) License.
By accessing the work you hereby accept the Terms. Non-commercial uses of the work are permitted
without any further permission from Dove Medical Press Limited, provided the work is properly
attributed. For permission for commercial use of this work, please see paragraphs 4.2 and 5 of our Terms.
Recommended articles
Nomogram Model for Predicting Minimal Breast Cancer Based on Clinical and Ultrasonic Characteristics
Cheng LL, Ye F, Xu T, Li HJ, Li WM, Fan XF
International Journal of Women's Health 2024, 16:2173-2184
Published Date: 18 December 2024
Analysis of Risk Factors and Development of a Predictive Model for Prognosis in Early-Stage Rectal Cancer Patients
Zhang CT
International Journal of General Medicine 2025, 18:3961-3968
Published Date: 16 July 2025