Back to Journals » Nature and Science of Sleep » Volume 14
An Exploration of Self-Reported Sleep Inertia Symptoms Using Network Analysis
Authors Ma Z ![]() , Tao Y
, Tao Y ![]() , Chen H, Zhang Y, Pan Y, Meng D, Fan F
, Chen H, Zhang Y, Pan Y, Meng D, Fan F
Received 2 November 2021
Accepted for publication 30 March 2022
Published 13 April 2022 Volume 2022:14 Pages 661—674
DOI https://doi.org/10.2147/NSS.S347419
Checked for plagiarism Yes
Review by Single anonymous peer review
Peer reviewer comments 2
Editor who approved publication: Prof. Dr. Ahmed BaHammam
Zijuan Ma,1,2 Yanqiang Tao,3 Huilin Chen,4 Yifan Zhang,1,2 Ye Pan,1,2 Dongjing Meng,1,2 Fang Fan1,2
1School of Psychology, Center for Studies of Psychological Application, and Guangdong Key Laboratory of Mental Health and Cognitive Science, South China Normal University, Guangzhou, People’s Republic of China; 2Key Laboratory of Brain, Cognition and Education Sciences, Ministry of Education, Guangzhou, People’s Republic of China; 3Beijing Key Laboratory of Applied Experimental Psychology, Faculty of Psychology, Beijing Normal University, Beijing, People’s Republic of China; 4Department of Psychology, University of Bath, Bath, UK
Correspondence: Fang Fan, Email [email protected]
Purpose: Sleep inertia (SI) is the transitional state accompanied by compromised cognitive and physical performance and sleepiness. Network analysis offers a potential new framework to conceptualize a complex network of symptom–symptom interactions, and the network structure is analyzed to reveal the core characteristics. However, no previous study examined the network structure of SI symptoms. Thus, this study aimed to elucidate characteristics and compare sex differences of SI symptom networks in the general population.
Materials and Methods: A total of 1491 participants from China were recruited from 30 May to 17 June, 2021. SI symptoms were assessed by using the Sleep Inertia Questionnaire (SIQ). The network structures were estimated and compared using network analytic methods in the R version 4.1.1.
Results: Centrality properties analysis of the expected influence suggested that symptoms of “Feel sleepy”, “Groggy, fuzzy or hazy mind”, and “Dread starting your day” exerted greatest influences. The weighted adjacency matrix revealed that the “Dread starting your day” and “Anxious about the upcoming day” edge showed the strongest connection (edge weight value = 0.70). The network comparison test found no significant difference in network global strength (p=0.928), distribution of edge weights (p=0.194) and individual edge weights (all p values > 0.05 after Holm–Bonferroni corrections) between males and females.
Conclusion: Symptoms of “Feel sleepy”, “Groggy, fuzzy or hazy mind”, and “Dread starting your day” were central in the SI symptom network. Intervention, such as the artificial dawn and change in body temperature, for symptoms of “Feel sleepy”, “Groggy, fuzzy or hazy mind”, and “Dread starting your day” might be crucial to hasten the dissipation of SI in the general population who may need to perform tasks upon waking.
Keywords: sleep inertia, Sleep Inertia Questionnaire, network analysis, general population
Introduction
Sleep inertia (SI) is defined as the transitional state between sleep and wake, accompanied by compromised cognitive and physical performance, reduced vigilance, and a desire to return to sleep (sleepiness).1,2 The adverse effects of SI are evident in various scenarios such as the need to perform safety-critical tasks or to make important decisions soon after waking, drive to the emergency site just minutes after waking, and nap during work hours.3,4 Indeed, impairments of SI have been officially implicated in several real-world accidents, injuries, and fatalities.5,6 Furthermore, exaggerated SI, also known as confusional arousals, is highly prevalent in the general population (ie, ~ 15.2%;7). SI tends to be a normal physiological phenomenon in healthy individuals.1 Although SI in the general population could take the time to dissipate and would not necessarily need interventions to reduce SI, SI is mostly problematic for people who need to perform important tasks soon after waking.3 Therefore, it is essential to understand the psychological phenomena mechanisms underlying SI to provide targeted interventions and potential countermeasures for people who need to perform important tasks soon after waking to lessen the adverse impact of SI.
The traditional theory of psychopathology implicitly assumes that symptoms of psychiatric disorders are manifestations of an underlying disease.8,9 Likewise, from a traditional perspective, psychological phenomena may also be secondary to an underlying common cause. In this way, SI would be hypothesized to cause impaired performance, reduced vigilance, and increased sleepiness upon awaking in the same fashion that a lung tumor causes shortness of breath, chest pain and coughing up blood.8 However, previous studies showed that SI symptoms might differ in their underlying biological mechanisms,10–12 risk factors,7,13,14 and resulting performance impairments.15,16 For example, individuals with later chronotype have longer-lasting impairments in morning performance due to SI,14,17 suggesting that late chronotype might be a risk factor for SI. Additionally, individuals with anticipating a high-stress task experienced less sleepiness upon waking when on-call than people who have anticipated a low-stress task; however, cognitive performance on the Spatial Task after waking did not differ between individuals with anticipating a high-stress task and individuals with anticipating a low-stress task,13 implying that SI symptoms such as sleepiness and cognitive impairments may be caused by the different potential mechanism but they active and maintain SI phenomenon. According to emerging network theory, SI phenomena arise from direct interactions between symptoms; therefore, there are calls for a novel theory to fully capture and articulate the critical differences between symptoms and relationships among symptoms.18
In recent decades, network analysis has been advanced as an alternative way for conceptualizing psychological phenomena in many fields,8 such as health psychology.19 The network theory holds that symptoms are mutually interactive and reinforcing components of a network rather than clusters stemmed from underlying latent causes.8,9 To investigate the complex patterns of symptom–symptom interactions, a novel and powerful methodological approach – network analysis – has been developed. From a network analysis perspective, the network of psychological phenomena is a graph consisting of nodes and edges. Nodes represent individual SI symptoms, and edges represent the relationships between these nodes.19 The network analysis approach allows for identification of the central nodes which are more likely to trigger other symptoms and play a major role in causing the onset of and maintaining a syndrome.8 Notably, targeting central symptoms with biological or psychosocial interventions could lead to knock-on improvements in other symptoms.20 For example, Cramer et al20 pointed out that insufficient sleep may lead to a lack of concentration via fatigue; as fatigue leads to a loss of concentration, it may lead to worry, which may in turn cause insufficient sleep night, thereby reinforcing fatigue. Based on the above loop, insufficient sleep may be a key symptom in its network. Therefore, providing more time can ensure enough sleep, which may relieve fatigue and promote concentration. In addition, the network analysis can be used to understand symptom–symptom interactions, which are potentially helpful in streamlining interventions that are effective in treating individual symptoms.18,21–23
To the best of our knowledge, despite the increasing attention paid to SI over the past 20 years, few studies utilized the network analysis to examine the important differences between symptoms and symptom-to-symptom relationships in SI among the general population. Hence, we used network analysis in the present study to examine the relationships between SI symptoms in the general population.
In addition, sex differences in SI symptomatology have been documented in previous studies;24,25 Illustratively, a study found that 81% of females felt sleepiness after waking, while 70% of males reported sleepiness upon awakening (p < 0.001).24 Another study suggested that females reported higher alertness after waking than males (Mann–Whitney Z = 3.16, p < 0.001).25 In addition, females make up the majority in the health professions, while males are a larger population in emergency services such as firefighters.3,26 Given the above differences on sex, therefore, the network structure of SI across sex would be examined separately.
Materials and Methods
Participants and Procedure
A total of 1491 college students participated in this online survey. To be eligible, individuals were included based on the following inclusion criteria: (1) being undergraduate students of the eleven universities; (2) having the ability to understand Chinese and the content of the questionnaire; (3) completing the questionnaire with more than or equal to 144 seconds that refers to the reaction time of M-SD for all subjects to complete the questionnaire. Finally, 1240 individuals have indeed been included in the present study based on the aforementioned selection criteria, with 251 deemed ineligible as they did not meet all the inclusion criteria (effective rate: 83.17%).
This cross-sectional study was conducted across eleven colleges and universities in China from May 30 to June 17, 2021, using the convenience sampling. Eleven universities are located in Nanjing (4 universities) and Suzhou (1 university), Jiangsu Province; Guangzhou (2 universities), Guangdong Province; Shangqiu (1 university), Henan Province; Yichang (1 university), Hubei Province; Wenzhou (1 university), Zhejiang Province; and Qinhuangdao (1 university), Hebei Province. Detailed procedures were as follows: Firstly, advertisement that describes the purpose, research process, and significance of this survey and online questionnaire was designed using the QuestionnaireStar application; Then, the teachers of eleven colleges and universities distributed the advertisement and the Quick Response code of online questionnaire to the students on May 30, 2021, via the WeChat platform. Next, the students in the target universities were invited to participate in the online survey voluntarily from May 30 to June 17, 2021. All subjects were assured of the confidentiality and anonymity of their data, and their rights to withdraw. Other details of the procedures have been described in our previous study.27
This study protocol was carried out in accordance with the Helsinki Declaration as revised in 1989 and approved by the human research ethics committee of South China Normal University. Electronic informed consent was obtained from all participants or their guardians (if necessary).
Measurements
Demographic characteristics, including sex, age, college year, and name of school, were collected. SI symptoms were assessed by the self-report the Chinese version of Sleep Inertia Questionnaire (SIQ).28 Each item of the SIQ is rated on a 5-point Likert scale ranging from 1 (not at all) to 5 (all the time). The total scores ranged from 21 to 105, with a higher score indicating more severe SI symptoms. The Cronbach alpha in this study was 0.95.
The Chinese version of SIQ was translated and validated for the first time after getting permission from the corresponding author and the copyright holder,28 and it showed good reliability and validity. The paper on the reliability and validity of the Chinese version of SIQ is under review, and more information about the formation of the Chinese version of the SIQ could see our previous study.27
Statistical Analysis
All statistical analyses were performed in R version 4.1.1 (R Core Team, 2021; https://www.r-project.org/). Specifically, the R-packages qgraph, networktools, and mgm were used to perform network estimation and network inference; the R-packages boonet were used to estimate network accuracy and stability; and the R-packages NetworkComparisonTest were used to conduct Network comparison. For more details see the following subsection. Statistical significance was considered for a two-sided test with P < 0.05.
Network Estimation
We first inspected mean, standard deviation (SD), skewness, and kurtosis for all the SIQ items using R-package psych (Version 2.1.9).29 Then, item informativeness was evaluated by mean of SD of all the item using the describe function in R-package psych.29 Items should be excluded if they display low informativeness (2.5 SDs less than MSD).21,30 Next, item redundancy was checked by the goldbricker function in the R-package networktools (Version 1.3.0).31 Items would be considered as redundant if the polychoric correlations between two target variables were statistically different only in <25% of the cases.21
The SI symptom network structure was estimated using functions of the Extended Bayesian Information Criterion graphical least absolute shrinkage and selection operator (EBICglasso) and cor_auto in R-package qgraph (Version 1.6.9).32 In the network analysis, each SI symptom was defined as a “node”, and association among these symptoms was depicted as an “edge” in the network. The SI networks were visualized based on the Fruchterman-Reingold algorithm in R-package qgraph (Version 1.6.9).32,33 In the network layout, the thickness of edges indicated the strength of associations among nodes. The edges of blue and orange represented positive and negative correlations, respectively.32 Nodes/Symptoms that are stronger were preferentially depicted by larger circle.
Local network properties were estimated with four centrality indices and predictability. The centrality indices including expected influence, node strength, closeness, and betweenness were computed using the centralityPlot function in the R-package qgraph (Version 1.6.9).34 Expected influence is defined as the summed weight of all edges extending from a given node, also known as one-step expected influence.35 Expected influence could adequately estimate the nature and strength of a node’s cumulative influence in the network with positive edges and negative edges.35 Node strength, the sum of the absolute edge weights connected to a node (between a node and all other nodes), is used to quantify how strongly a node is directly connected to other nodes in the network.34 Note strength was also emphasized in networks with exclusively positive edges, as it is proportional to the extent to which a given node uniquely explains variance in nodes to which it is connected.35 Closeness is defined as the inverse of the sum of all the shortest path length (SPL) from one node to all other nodes in the network, which could quantify how well a node is indirectly connected to other nodes in the network.34 Betweenness, quantifying how important a node is in the average path between two other nodes, is calculated by the frequency of a node lying on all the shortest paths between other nodes.34 The above centrality indices were shown as standardized z-scores. Additionally, predictability, which quantifies how well a certain node is predicted by all its neighboring nodes, was estimated using R-package mgm (version 1.2-12).36,37
Network Accuracy and Stability
The accuracy and stability of the SI network were assessed following three steps in the R-package boonet (Version 1.4.3).38 First, the accuracy of edge-weights was estimated by bootstrapping the 95% Confidence Intervals (CIs) using non-parametric bootstrap method (1000 iterations). The adoption of narrower CIs helped identify a more trustworthy network, whilst the adoption of bootstrapping aimed to minimize the effect of unrepresentative sampling of data and thus reducing random errors in analytic outputs. Second, the stability of node strength was assessed by computing the correlation stability coefficient (CS-C) using case-dropping bootstrap procedure (1000 iterations). The CS-C values represent the maximum proportion of cases that could be dropped from the sample without significantly affecting centrality indices. With 95% certainty, a correlation of 0.7 or above was achieved between original centrality indices and centrality of subset networks.38 As recommended previously,38 the CS-C should not be less than 0.25 and be preferably above 0.5. Third, differences in network’s properties (ie, edge weights, node strengths) were assessed by bootstrapped difference tests.38
Comparison of Network Characteristics Between Males and Females
The differences of network characteristics were estimated using the Network Comparison Test (NCT), a permutation test that assesses the difference between two networks in R-package NetworkComparisonTest (Version 2.2.1).39 In the current study, the NCT was conducted on subsamples defined by the sex (females vs males) with 1000 permutations as recommended previously. First, we compared the absolute sum of all edge weights between the networks to assess the global strength of the network. Next, the distributions of edge weights within each network were compared in order to characterize the structure of the network. Finally, we compared the differences in strength for each edge between the two networks after controlling for multiple tests (Holm–Bonferroni correction of p values, p<0.05).
Results
Sample Characteristics
A total of 1240 participants who fulfilled the study entry criteria were included in the present study. Among them, 565 is males (45.6%). The demographic characteristics of participants are shown in Table 1.
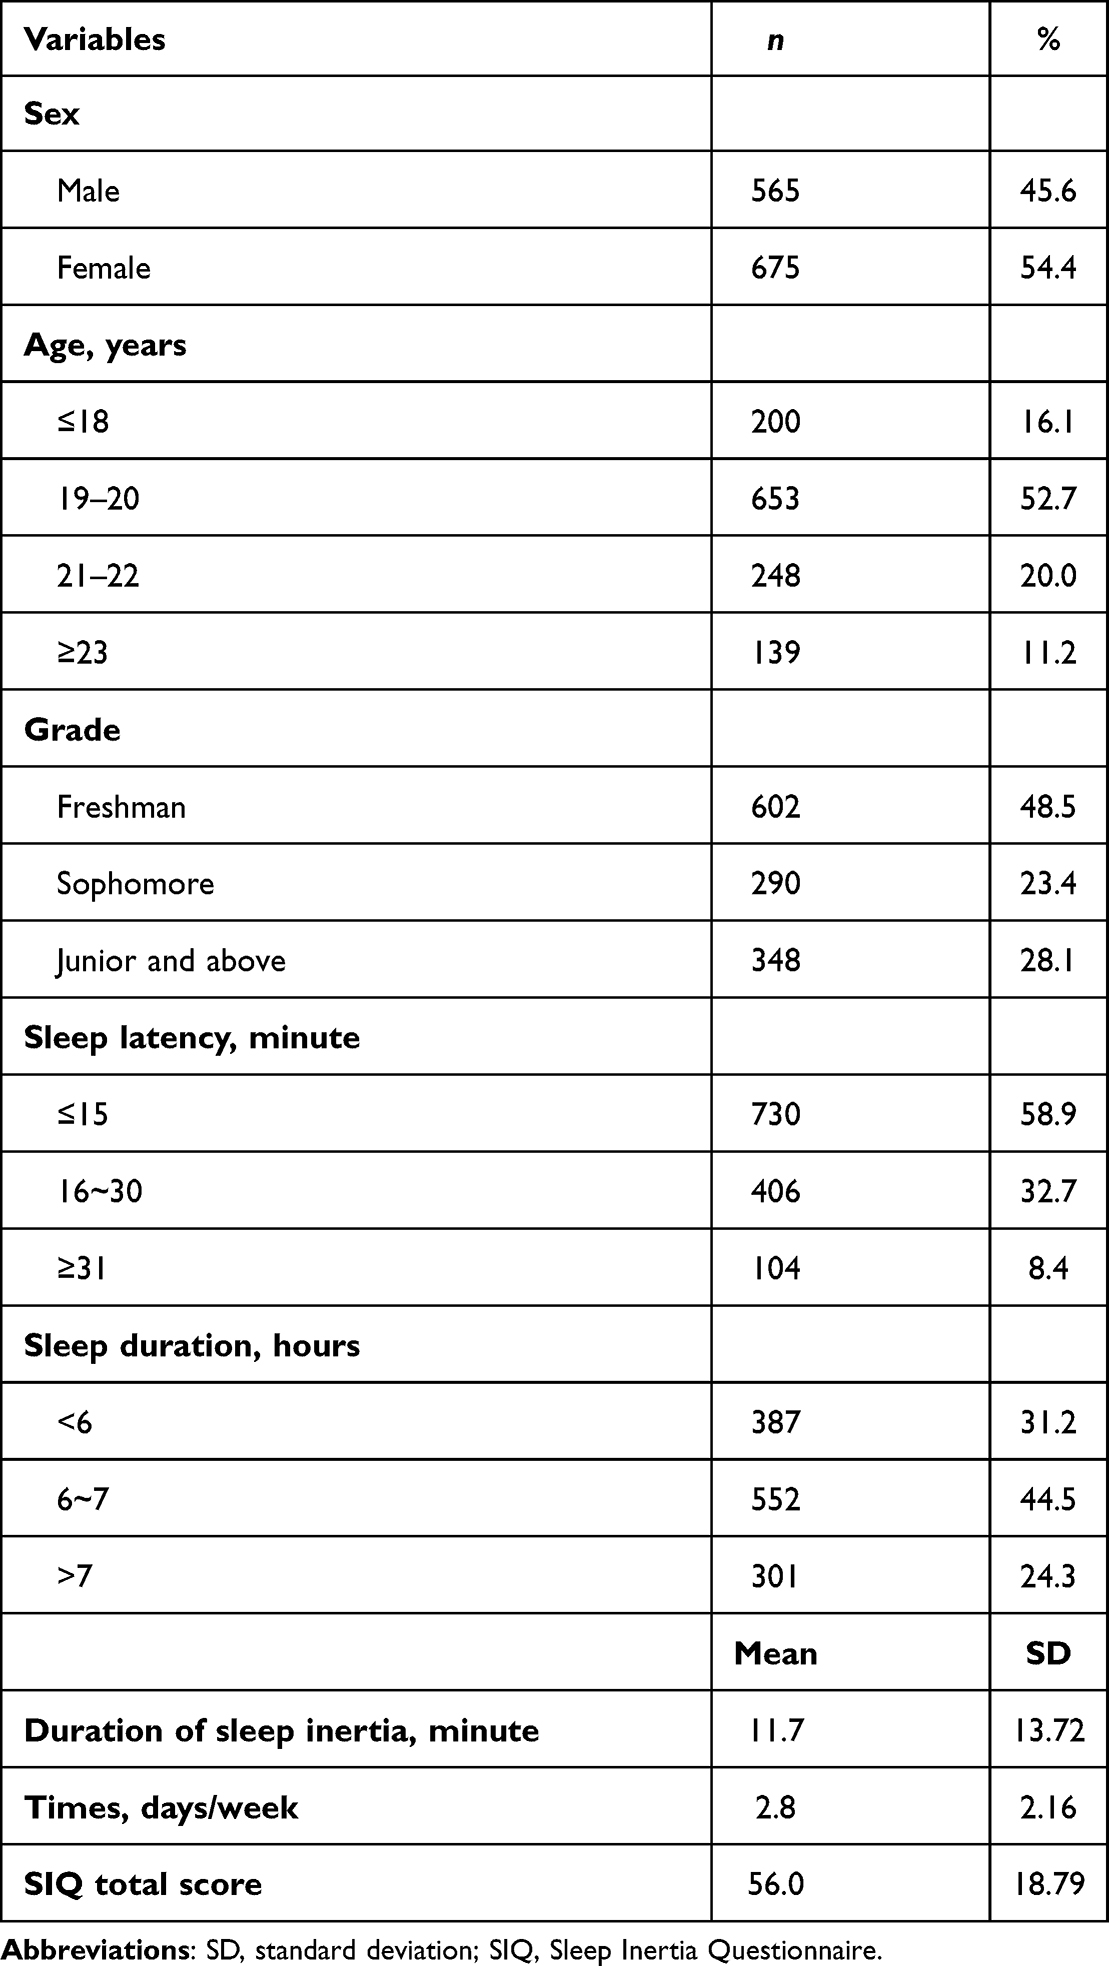 |
Table 1 Demographic Characteristics of the Current Sample (N=1240) |
Mean, standard deviation, skewness, and kurtosis for the SIQ items are summarized in Table 2. The symptom of SIQ_15 (“Wish to sleep more”) had the highest mean rating, while the symptom of SIQ_4 (“Bump into and drop things”) had the lowest mean rating.
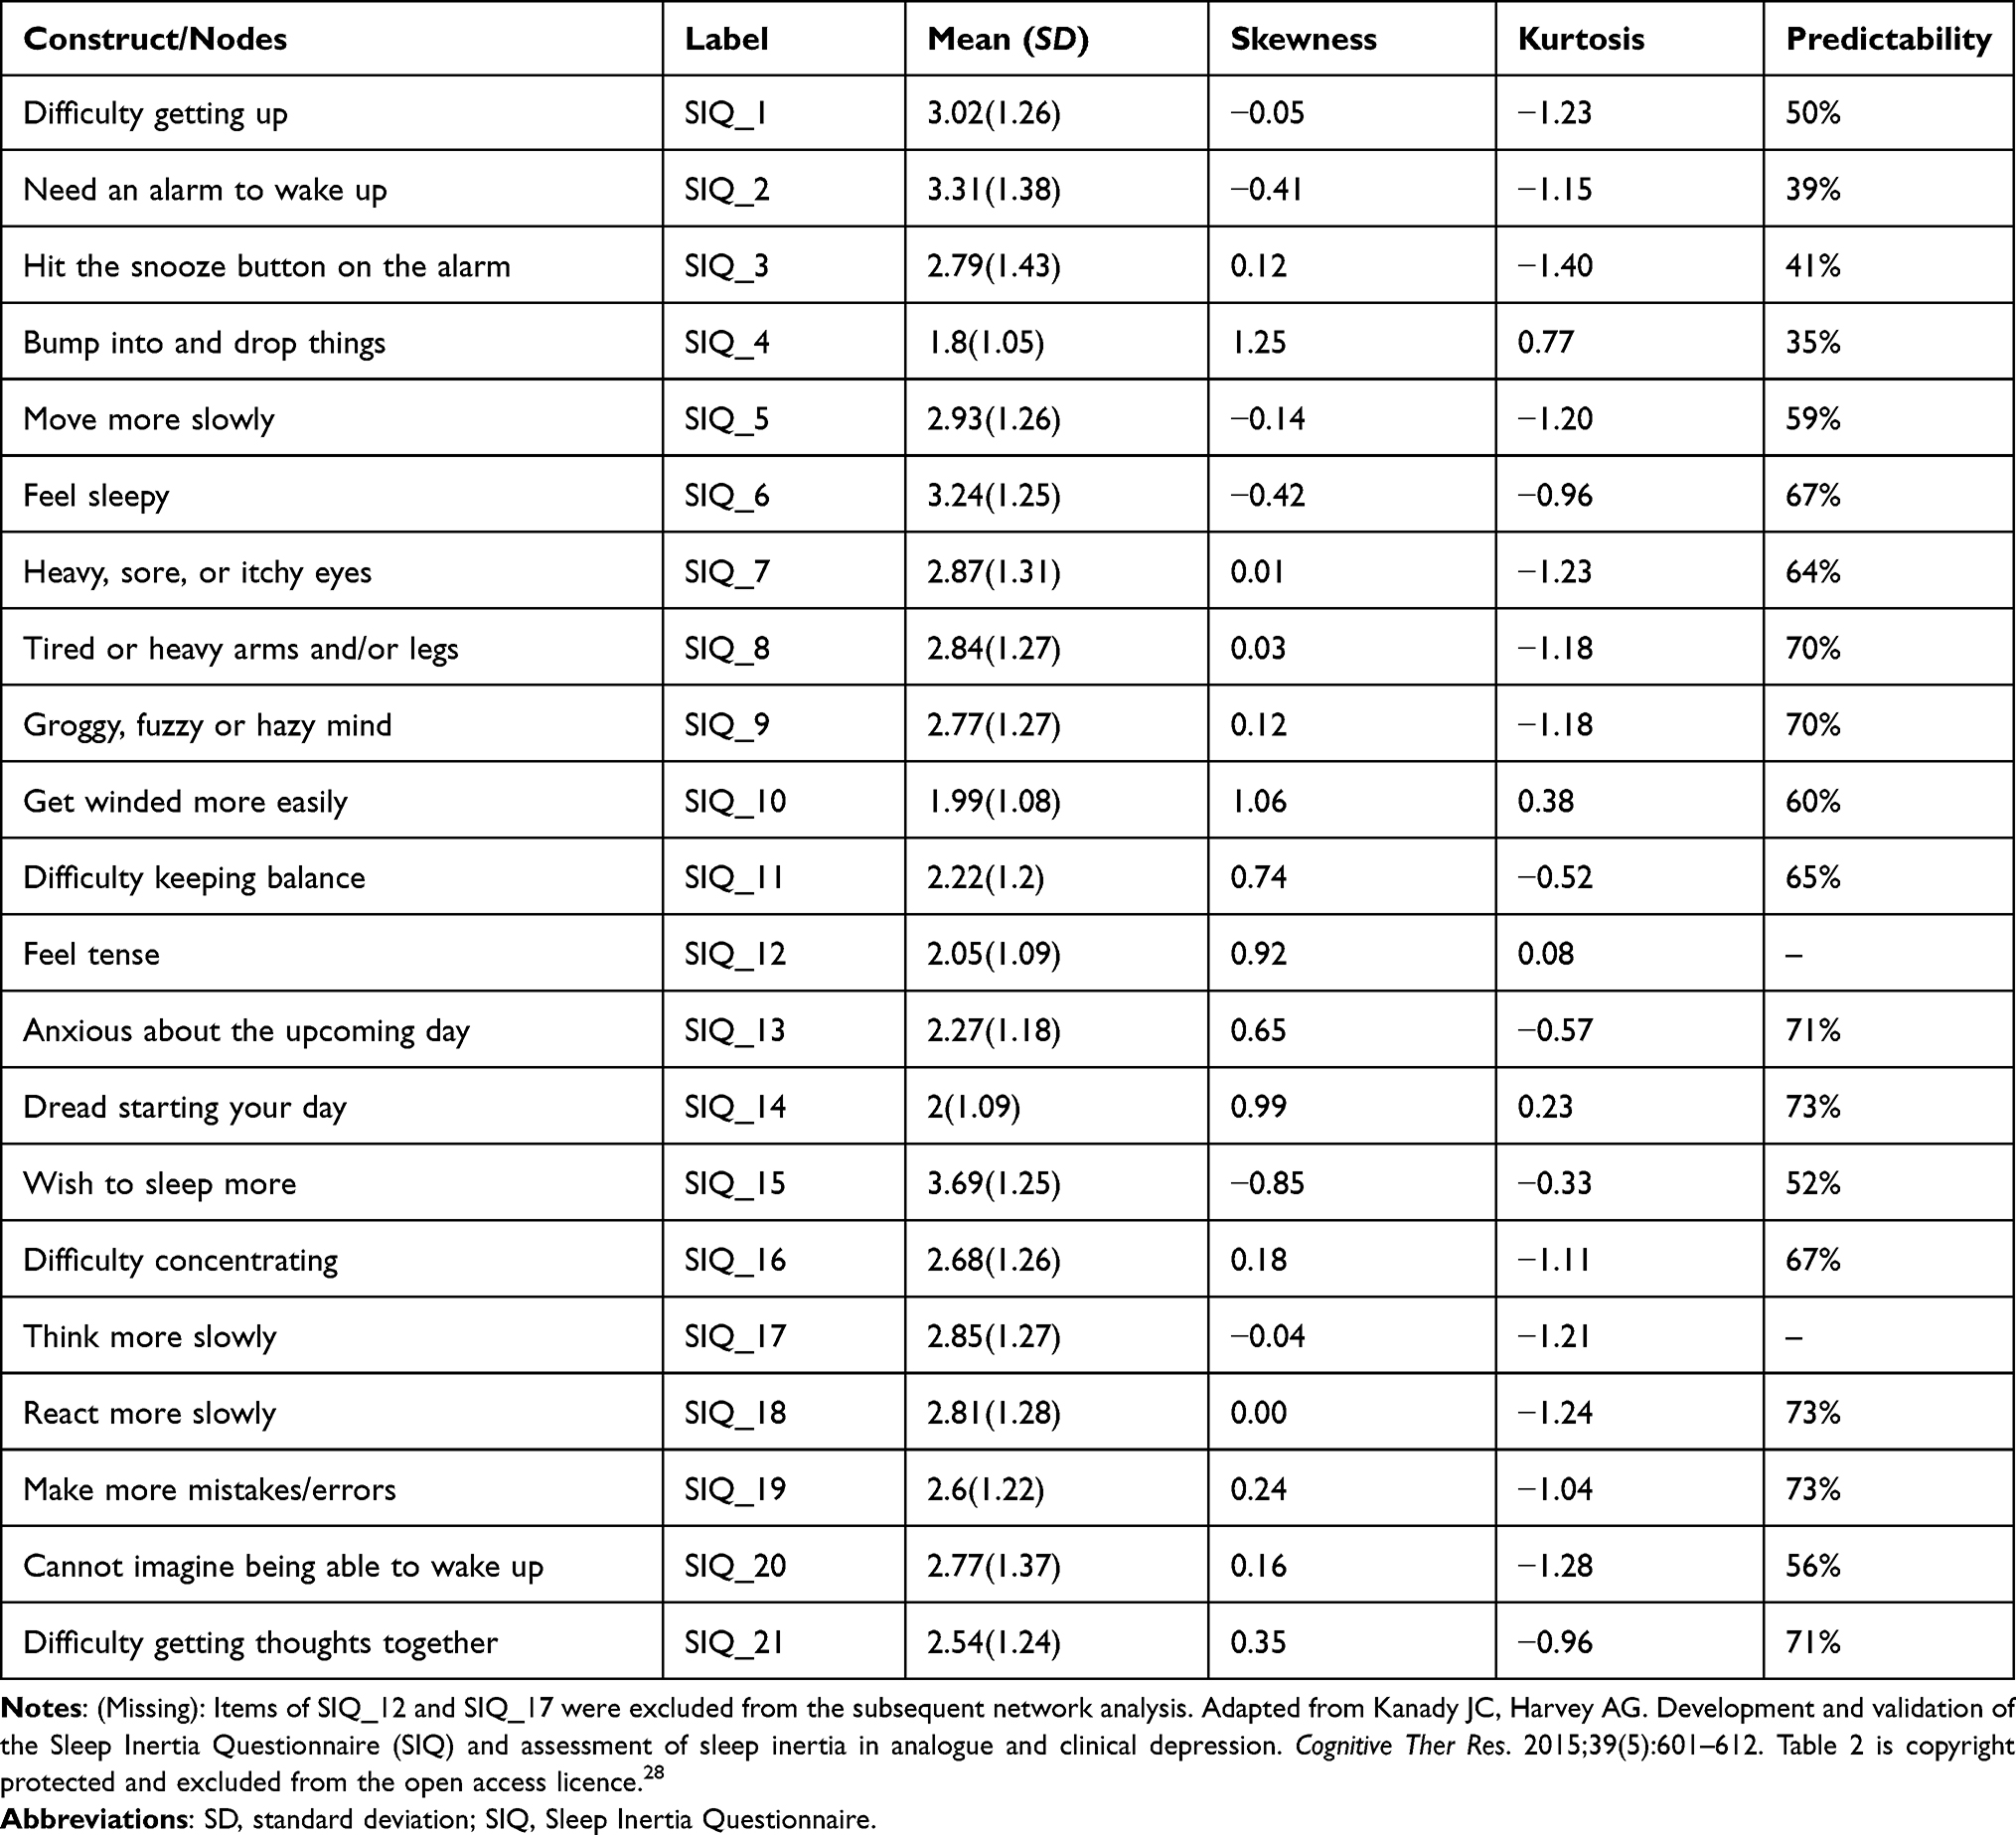 |
Table 2 Mean, Standard Deviation, Skewness, and Kurtosis for the SIQ Items (N=1240) |
Network Structure, Centrality and Predictability Measures Analysis
No item was poorly informative (2.5 SD below the mean level of informativeness, MSD=1.24±0.10). Two “bad pairs” (SIQ_10 and SIQ_12: 21%; SIQ_17 and SIQ_18: 11%) had less than 25% of significantly different correlations. For physiological and cognitive symptoms of SI in the context of Chinese can be better expressed by the items of SIQ_10 (Get winded more easily) and SIQ_18 (React more slowly), respectively. Therefore, the items of SIQ_12 and SIQ_17 were excluded from the subsequent network analysis.
Figure 1 shows the network structure of the SI symptoms in the total sample. Several points are worth emphasizing. First, in the SI symptoms network, 90 of the 171 edges were above zero, indicating positive associations; 13 of the 171 edges were below zero, suggesting negative associations. The weighted adjacency matrix was used to detest the numerical interactions between SI symptoms (Supplementary Table 1). The SIQ_13 and SIQ_14 edge showed the strongest connection (edge weight value = 0.70), followed by edges for SIQ_10 and SIQ_11 (edge weight value = 0.47), and SIQ_18 and SIQ_19 (edge weight value = 0.43).
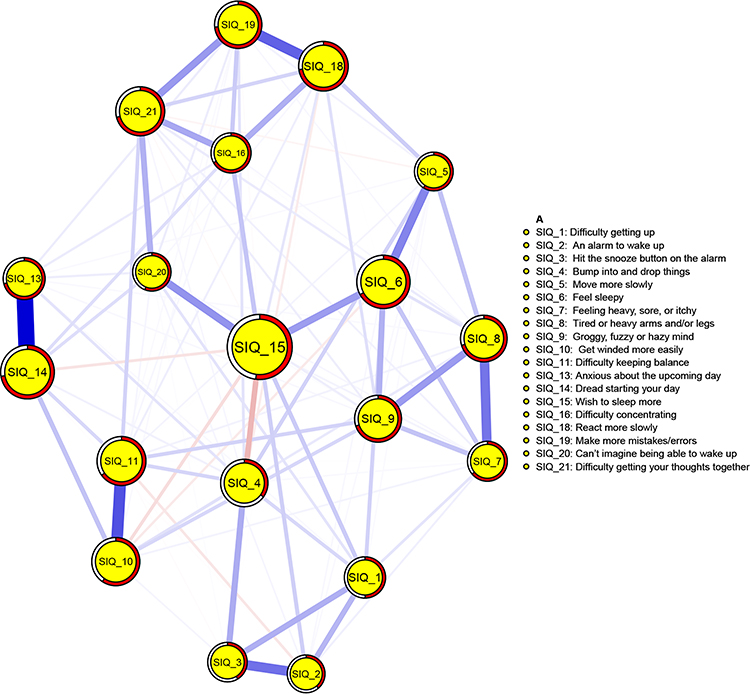 |
Figure 1 Network structure of the sleep inertia symptoms in the total sample (N= 1240). Blue lines indicate positive associations, and orange lines indicate negative associations. The thickness of an edge represents the association strength, the size of a circle represents the node strength, and the area of red ring indicates the predictability. Note: SIQ questionnaires are adapted from Kanady JC, Harvey AG. Development and validation of the Sleep Inertia Questionnaire (SIQ) and assessment of sleep inertia in analogue and clinical depression. Cognitive Ther Res. 2015;39(5):601–612. Table 2 is copyright protected and excluded from the open access licence.28 |
Second, centrality properties analysis showed that, SIQ_6 (“Feel sleepy”) had the highest expected influence index, followed by SIQ_9 (“Groggy, fuzzy or hazy mind”), SIQ_14 (“Dread starting your day”), and SIQ_19 (“Make more mistakes/errors”); SIQ_15 (“Wish to sleep more”) had the highest strength, followed by SIQ_14, SIQ_6, and SIQ_18 (“React more slowly”); SIQ_15 had the highest closeness, followed by SIQ_6, SIQ_20 (“Can’t imagine being able to wake up”), and SIQ_4 (“Bump into and drop things”); SIQ_15 had the highest betweenness, followed by SIQ_6, SIQ_9, and SIQ_4. Figure 2 depicts centrality indices of expected influence index, node strength, betweenness, and closeness (z-scores) for all the SI symptoms within the network. Because expected influence could better represent observed node influence in network with positive and negative edges, and the SI symptoms network consisted of positive and negative edges. Hence, we would give priority to expected influence in the subsequent discussion.
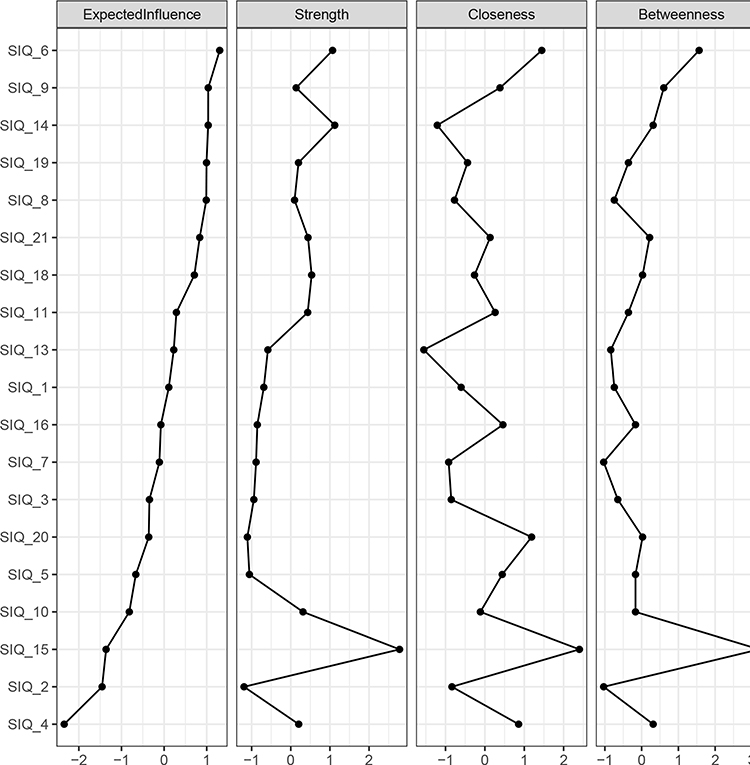 |
Figure 2 Centrality indices of network structure of sleep inertia symptoms, shown as standardized values z-scores. |
Third, the predictability index found that, on average, 61% of each node’s variance could potentially be accounted for by the neighboring nodes (Mpredictability = 0.61±0.12), while 39% of variance in each node was unexplained. SIQ_14 (“Dread starting your day”, predictability index = 73%), SIQ_18 (“React more slowly”, predictability index = 73%), and SIQ_19 (“Make more mistakes/errors”, predictability index = 73%) had the highest predictability indexes within the network, while SIQ_4 (“Bump into and drop things”, predictability index = 35%) was poorly explained by neighboring symptoms, indicating potential extraneous influence (see Table 2).
Fourth, expected influence, strength, closeness, betweenness, and predictability were not related to variability (item SD; rs=0.08[−0.39, 0.52]; rs=−0.45[−0.75, 0.01], rs=0.01[−0.44, 0.47], rs=−0.19[−0.59, 0.29], rs=−0.18[−0.58, 0.30], respectively) or item mean (rs=0.01[−0.45, 0.46], rs=0.08[−0.39, 0.52], rs=0.31[−0.17, 0.67], rs=0.34[−0.13, 0.69], rs=−0.14[−0.56, 0.34], respectively).
Network Accuracy and Stability
Supplementary Figure 1 presents accuracy of the edge weights in the current sample. Results found that the edge weights were consistent with the bootstrapped sample, especially the connections with larger weights, indicating that the SI network structure was reliable.
The values of strength, closeness, and betweenness remained stable even after dropping different proportions of the sample were computed using the case-dropping bootstrap procedure (Figure 3). The CS-C for expected influence was 0.75, suggesting that 75% of the sample could be dropped while still maintaining a high correlation (r=0.7) with the original centrality indices for the whole sample. Similarly, 67%, 67% and 44% of the sample could be dropped without significantly affecting the values of strength, closeness and betweenness, respectively. Given the expected influence index was robust and trustworthy in the current sample, we primarily focused on the interpretation of symptom expected influence in the subsequent network analysis.
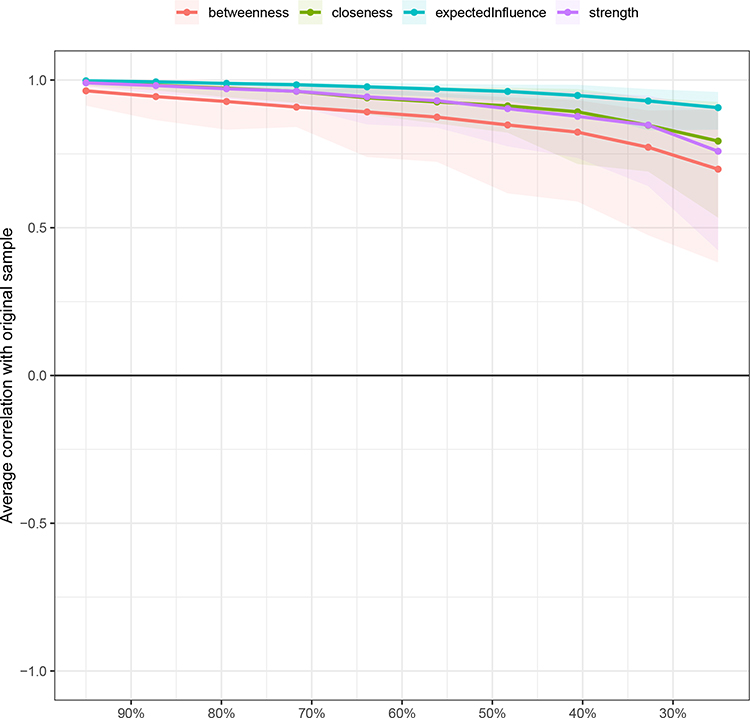 |
Figure 3 Stability of centrality indices as assessed using the case-dropping bootstrap method. The x-axis represents the percentage of cases of the original sample used at each step. The y-axis represents the average of correlations between the centrality indices from the original network and the centrality indices from the networks that were re-estimated after excluding increasing percentages of cases. Each line indicates the correlations among betweenness, closeness, and strength, while areas indicate 95% CI. |
Moreover, the bootstrapped difference tests suggested consistently that a large proportion of the comparisons among edge weights were statistically significant (Supplementary Figure 2). Also, the node strength was statistically different from one another in individual comparisons (Figure 4).
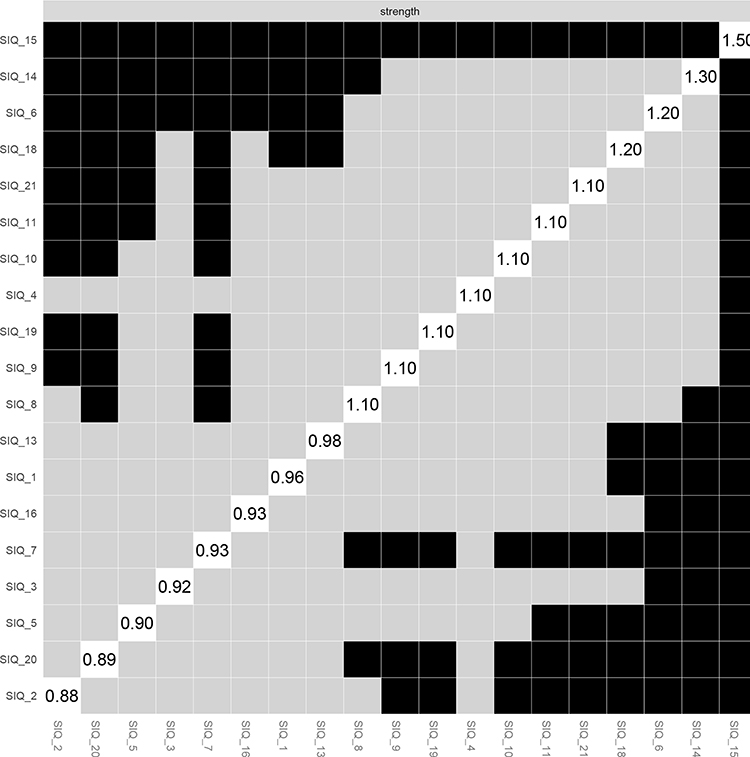 |
Figure 4 Estimation of node strength difference by bootstrapped difference test. Bootstrapped difference tests between node strength of factors. Gray boxes indicate nodes that do not significantly differ from one-another. Black boxes represent nodes that differ significantly from one another (α = 0.05). White boxes show the values of node strength. |
Comparison of Network Characteristics by Sex
Mean and standard deviation for SIQ items across sex are summarized in Supplementary Table 2. Figure 5 and Supplementary Figure 3 present the estimated network models and network centrality indices for SI symptoms between females (n=675) and males (n=565), respectively. There were no significant differences between males and females in network global strength (females: 9.28 vs males: 9.30; S = 0.02, p=0.928), distribution of edge weights (M=0.17, p=0.194), and individual edges weights (all p values >0.05 after Holm–Bonferroni correction, Supplementary Figure 4).
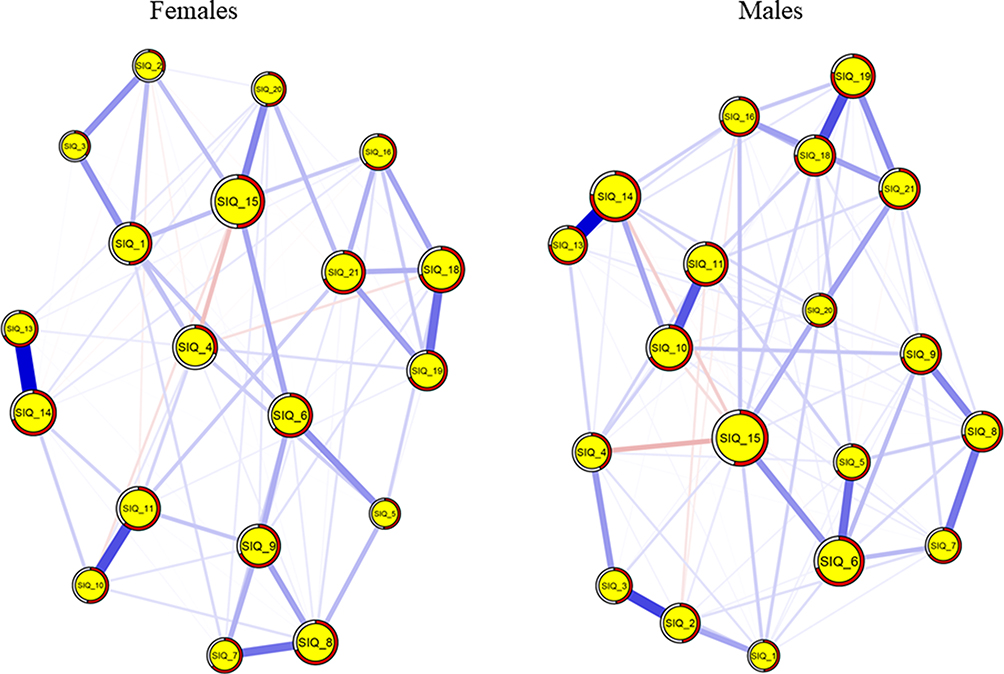 |
Figure 5 Estimated network models for sleep inertia symptoms between females and males. Left panel: network structure in females (n = 675); right panel: network structure in males (n = 565). |
Discussion
To the best of our knowledge, this exploratory study is the first to characterize the network structure of SI symptoms among the general population in China, which would help to deepen the symptom-to-symptom interplay from the network perspective. The principal findings of this study are summarised below. Firstly, “Feel sleepy”, “Groggy, fuzzy or hazy mind”, and “Dread starting your day” were the central symptoms in the SI symptom network structure, and the top 2 central symptoms were consistent with the previous results,1,40 demonstrating the external validity of the SI network. Secord, “Dread starting your day” had the strongest and direct association with “Anxious about the upcoming day”. Third, there were no significant gender differences in the network structures of SI symptoms. Notably, although the general population would not necessarily need interventions to reduce SI, people who need to perform important tasks soon after waking need to provide interventions to lessen the adverse impact of SI. To sum up, intervention for symptoms of “Feel sleepy”, “Groggy, fuzzy or hazy mind”, and “Dread starting your day” might be crucial to hasten the dissipation of SI for people who need to perform important tasks soon after waking.
“Feel sleepy” was the most central symptom within the network of SI symptoms, which is consistent with the previous studies that SI subjectively manifests as feeling sleepy.1,13,16,40 Evidences suggested that SI is a residual drowsiness after waking up, which tend to be accompanied by a high sleep propensity.40,41 The underlying electrophysiology mechanism may be that increased sleepiness could promote a shift of cortical activity from a low-amplitude high-frequency to a high-amplitude low-frequency, which could lead to a deactivated state to maintain sleep.42 However, sleepiness is often accompanied by diminished attention and increased reaction times leading to reduced vigilance and impaired performance during SI.43,44 Therefore, SI countermeasures, such as a single exposure to 30-min artificial dawn signal (50 lux) prior to the alarm sounded,45 should be used to reduce the subjective sleepiness in the general population who may need to perform tasks upon waking. Specifically, they may put on light 30 minutes prior to getting up by using a digital timing light.
Consistent with previous results that SI subjectively manifests as grogginess,1,13,16,40 “Groggy, fuzzy or hazy mind” is top 2 central symptom that emerged in SI network. Symptoms of feeling “Groggy, fuzzy or hazy mind” are associated with differences in characteristic changes in cerebral blood flow.46,47 Specifically, “groggy” is associated with global brain deactivation. The possible reason of “fuzzy or hazy mind” may be that, for all brain regions function interdependently, cerebral blood flow was most rapidly re-established in centrencephalic regions and then in anterior cortical regions. Although “Groggy, fuzzy or hazy mind” is a typical somatic symptom upon awakening, it is still an accompanying symptom of cognitive impairment upon waking in specific situations such as making important decisions or implementing potentially dangerous tasks just minutes after waking.3 Recent study found that the disappearance of SI was significantly associated with the decay in distal temperature (vasoconstriction),48 indicating that change in body temperature would reduce the severity of “Groggy, fuzzy or hazy mind”. Therefore, strategies to cool the extremities (eg, a cool water bottle at the feet) can help to evoke distal vasoconstriction, resulting in faster sleep inertia dissipation.4 Furthermore, “Dread starting your day” was also a central symptom in SI network, and had the strongest and direct association with “Anxious about the upcoming day”. This finding is consistent with previous non-network-analysis studies that found that the emergence of anxiety or irritability when individuals are instantly aroused from sleep.49.50.51 Additionally, individual with emotional problems often have associated sleep symptomatology, including difficulty with awakening (mild SI), and confusion upon awakening (severe SI).1 Hence, the negative emotions, such as anxiety and fear, should be targeted to refile the symptoms of “Dread starting your day” and “Anxious about the upcoming day”. Recently, a study found that the presence of the artificial dawn prior to waking can significantly improve individuals’ mood,45 suggesting that an intervention of the artificial dawn should be performed.
The current findings revealed that there was no significant gender difference in the network structures of SI symptoms, which could serve as the first evidence from network analyses that support the notion that there is no significant gender difference in SI prevalence.7 However, two studies from Adan & Natale and Amaral et al reported contradicting findings.24,25 Specifically, Amaral et al found that a majority of females referred waking up tired (females: males = 80.8%: 70.1%; p < 0.001);24 Adan & Natale based on an item of alertness found that alertness after waking up for males was significantly lower than that for females (Mmales: Mfemales = 2.43: 2.56, p<0.001).25 The inconsistent results between our findings and those of abovementioned studies could be explained by several reasons. First, previous studies on epidemiology features of SI were based on single item,25 which would inevitably limit the ability to detect the important differences between individual symptoms and the relationships among symptoms. In contrast, the network approach assesses interactions between individual symptoms.9 Second, the possible explanation is that the sex differences in network analysis may be partly masked by the impact of neurophysiological mechanism. To the best of our knowledge, previous studies have pointed out that SI is not merely a subjective experience, but it is closely linked with differences in distinct EEG frequency bands and characteristic changes in cerebral blood flow.46,47
A strength of this study is that it captured the idiosyncratic experience of SI to understand symptom-to-symptom relationships from network perspective. Moreover, the large sample size and the homogenous study sample contributed to accuracy, stability, and robustness of the network estimates. Despite these possible applied implications, several limitations of this study needed to be addressed. First, this is a cross-sectional study; therefore, the causality relationships and the dynamic changes between SI symptoms over time cannot be estimated. Second, since this study was conducted in a college students’ sample, the findings may not be generalized to special populations such as adolescents, the elderly, and patients with idiopathic hypersomnia. Third, to ensure the feasibility and effectiveness of online survey, we have intentionally designed the smallest number of items possible to address our key questions, which only include part of demographic information such as age group, gender, and grade. The present study may be limited the ability to be more detailed in the sample’s sociodemographic characteristics. Future studies are suggested to collect more precise demographic information such as age and cities of the participants. Fourth, the estimated networks only included SI symptoms, which lacked data from additional validated scales for measuring other aspects of importance, might bias estimates of network parameters. Finally, SI symptoms were assessed by self-reported SIQ rather than a clinical interview; therefore, atypical features and objective symptoms of SI could not be identified and captured, which may bias the results to an uncertain extent.
Conclusion
In conclusion, this network analysis revealed that “Feel sleepy”, “Groggy, fuzzy or hazy mind”, and “Dread starting your day” were the most central symptoms of SI within the current network. As such, three central symptoms may constitute the “backbone” that sustained the SI symptom structure in the general population. Timely, multilevel interventions, such as the artificial dawn and change in body temperature,45,48 targeting central symptoms may help to alleviate SI symptoms in the general population who may need to perform tasks upon waking.
Abbreviations
SI, sleep inertia; SIQ, Sleep Inertia Questionnaire; SD, standard deviation; EBICglasso, Extended Bayesian Information Criterion graphical least absolute shrinkage and selection operator; SPL, shortest path length; Cis, confidence intervals; CS-C, correlation stability coefficient; NCT, Network Comparison Test.
Ethics Approval
This study protocol was approved by the human research ethics committee of South China Normal University (Approval No.: SCNU-PSY-2021-247).
Acknowledgments
The work was supported by National Natural Science Foundation of China (Grant No. 31871129, 31671165). The authors would like to thank all participants, and schools for their supports.
Disclosure
The authors declare no conflicts of interest in this work.
References
1. Trotti LM. Waking up is the hardest thing I do all day: sleep inertia and sleep drunkenness. Sleep Med Rev. 2017;35:76–84. doi:10.1016/j.smrv.2016.08.005
2. Tassi P, Muzet A. Sleep inertia. Sleep Med Rev. 2000;4(4):341–353. doi:10.1053/smrv.2000.0098
3. Dawson D, Ferguson SAV, Grace E. Safety implications of fatigue and sleep inertia for emergency services personnel. Sleep Med Rev. 2021;55:101386. doi:10.1016/j.smrv.2020.101386
4. Hilditch CJ, Dorrian J, Banks S. Time to wake up: reactive countermeasures to sleep inertia. Ind Health. 2016;54(6):528–541. doi:10.2486/indhealth.2015-0236
5. Branch MAI. Heavy Contact by Skandi Foula with OMS Resolution, Aberdeen Harbour 29 May 2010. London: UK Department for Transport: UK Department for Transport; 2011.
6. Armentrout JJ, Holland DA, O’Toole KJ, Ercoline WR. Fatigue and related human factors in the near crash of a large military aircraft. Aviat Space Environ Med. 2006;77(9):963–970.
7. Ohayon MM, Mahowald MW, Leger D. Are confusional arousals pathological? Neurology. 2014;83(9):834–841. doi:10.1212/wnl.0000000000000727
8. Borsboom D, Cramer AO. Network analysis: an integrative approach to the structure of psychopathology. Annu Rev Clin Psychol. 2013;9:91–121. doi:10.1146/annurev-clinpsy-050212-185608
9. Borsboom D. Psychometric perspectives on diagnostic systems. J Clin Psychol. 2008;64(9):1089–1108. doi:10.1002/jclp.20503
10. Asaoka S, Masaki H, Ogawa K, Murphy TI, Fukuda K, Yamazaki K. Performance monitoring during sleep inertia after a 1-h daytime nap. J Sleep Res. 2010;19(3):436–443. doi:10.1111/j.1365-2869.2009.00811.x
11. Ferrara M, De Gennaro L, Ferlazzo F, Curcio G, Barattucci M, Bertini M. Auditory evoked responses upon awakening from sleep in human subjects. Neurosci Lett. 2001;310(2–3):145–148. doi:10.1016/s0304-3940(01)02107-3
12. Broughton RJ. Sleep disorders: disorders of arousal? Science. 1968;159(3819):1070–1078. doi:10.1126/science.159.3819.1070
13. Kovac K, Vincent GE, Jay SM, et al. The impact of anticipating a stressful task on sleep inertia when on-call. Appl Ergon. 2020;82:102942. doi:10.1016/j.apergo.2019.102942
14. Ritchie HK, Burke TM, Dear TB, McHill AW, Axelsson J, Wright KP
15. Burke TM, Scheer F, Ronda JM, Czeisler CA, Wright KP
16. Santhi N, Groeger JA, Archer SN, Gimenez M, Schlangen LJ, Dijk DJ. Morning sleep inertia in alertness and performance: effect of cognitive domain and white light conditions. PLoS One. 2013;8(11):e79688. doi:10.1371/journal.pone.0079688
17. Roenneberg T, Wirz-Justice A, Merrow M. Life between clocks: daily temporal patterns of human chronotypes. J Biol Rhythm. 2003;18(1):80–90. doi:10.1177/0748730402239679
18. Bai W, Xi H-T, Zhu Q, et al. Network analysis of anxiety and depressive symptoms among nursing students during the COVID-19 pandemic. J Affect Disord. 2021;294:753–760. doi:10.1016/j.jad.2021.07.072
19. Hevey D. Network analysis: a brief overview and tutorial. Health Psychol Behav. 2018;6(1):301–328. doi:10.1080/21642850.2018.1521283
20. Cramer AO, Waldorp LJ, van der Maas HL, Borsboom D. Comorbidity: a network perspective. Behav Brain Sci. 2010;33(2–3):
21. Cheung T, Jin Y, Lam S, Su Z, Hall BJ, Xiang Y-T. Network analysis of depressive symptoms in Hong Kong residents during the COVID-19 pandemic. Transl Psychiatry. 2021;11(1). doi:10.1038/s41398-021-01543-z
22. Belvederi Murri M, Amore M, Respino M, Alexopoulos GS. The symptom network structure of depressive symptoms in late-life: results from a European population study. Mol Psychiatry. 2020;25(7):1447–1456. doi:10.1038/s41380-018-0232-0
23. Beard C, Millner AJ, Forgeard MJ, et al. Network analysis of depression and anxiety symptom relationships in a psychiatric sample. Psychol Med. 2016;46(16):3359–3369. doi:10.1017/S0033291716002300
24. Amaral O, Garrido A, Pereira C, Veiga N, Serpa C, Sakellarides C. Sleep patterns and insomnia among Portuguese adolescents: a cross-sectional study. Aten Primaria. 2014;46:191–194. doi:10.1016/s0212-6567(14)70090-3
25. Adan A, Natale V. Gender differences in morningness-eveningness preference. Chronobiol Int. 2002;19(4):709–720. doi:10.1081/cbi-120005390
26. Querstret D, O’Brien K, Skene DJ, Maben J. Improving fatigue risk management in healthcare: a scoping review of sleep-related/ fatigue-management interventions for nurses and midwives (reprint). Int J Nurs Stud. 2020;112:103745. doi:10.1016/j.ijnurstu.2020.103745
27. Ma Z, Chen XY, Wang D, et al. Who is the hardest to wake up from sleep? An investigation of self‐reported sleep inertia using a latent profile analysis. J Sleep Res. 2022. doi:10.1111/jsr.13552
28. Kanady JC, Harvey AG. Development and validation of the Sleep Inertia Questionnaire (SIQ) and assessment of sleep inertia in analogue and clinical depression. Cognitive Ther Res. 2015;39(5):601–612. doi:10.1007/s10608-015-9686-4
29. PMC lab. Procedures for psychological, psychometric, and personality research. Northwestern University; 2020. Available from: https://CRAN.r-project.org/package=psych.
30. Mullarkey MC, Marchetti I, Beevers CG. Using network analysis to identify central symptoms of adolescent depression. J Clin Child Adolesc. 2019;48(4):656–668. doi:10.1080/15374416.2018.1437735
31. Jones P. Networktools: assorted tools for identifying important nodes in networks. R package version 100; 2017. Available from: https://CRANR-projectorg/package=networktools.
32. Epskamp S, Cramer AOJ, Waldorp LJ, Schmittmann VD, Borsboom D. qgraph: network visualizations of relationships in psychometric data. J Stat Softw. 2012;48(4). doi:10.18637/jss.v048.i04
33. Fruchterman TMJ, Reingold EM. Graph drawing by force-directed placement. Softw Pract Exp. 1991;21(11):1129–1164. doi:10.1002/spe.4380211102
34. Opsahl T, Agneessens F, Skvoretz J. Node centrality in weighted networks: generalizing degree and shortest paths. Soc Networks. 2010;32(3):245–251. doi:10.1016/j.socnet.2010.03.006
35. Robinaugh DJ, Millner AJ, McNally RJ. Identifying highly influential nodes in the complicated grief network. J Abnorm Psychol. 2016;125(6):747–757. doi:10.1037/abn0000181
36. Haslbeck J, Waldorp L J. mgm: estimating time-varying mixed graphical models in high-dimensional data. J Stat Softw. 2020;93. doi:10.18637/jss.v093.i08
37. Haslbeck JMB, Waldorp LJ. How well do network models predict observations? On the importance of predictability in network models. Behav Res Methods. 2018;50(2):853–861. doi:10.3758/s13428-017-0910-x
38. Epskamp S, Borsboom D, Fried EI. Estimating psychological networks and their accuracy: a tutorial paper. Behav Res Methods. 2018;50(1):195–212. doi:10.3758/s13428-017-0862-1
39. Van Borkulo C, Van Bork R, Boschloo L, Kossakowski J, Waldorp L. Comparing network structures on three aspects: a permutation test; 2017. Available from: https://www.researchgate.net/publication/314750838.
40. Hilditch CJ, McHill AW. Sleep inertia: current insights. Nat Sci Sleep. 2019;11:155–165. doi:10.2147/nss.S188911
41. Peter-Derex L, Magnin M, Bastuji H. Heterogeneity of arousals in human sleep: a stereo-electroencephalographic study. NeuroImage. 2015;123:229–244. doi:10.1016/j.neuroimage.2015.07.057
42. Berger M, Hirotsu C, Haba-Rubio J, et al. Risk factors of excessive daytime sleepiness in a prospective population-based cohort. J Sleep Res. 2021;30(2):e13069. doi:10.1111/jsr.13069
43. Radun I, Levitski A, Wahde M, et al. Sleepy drivers on a slippery road: a pilot study using a driving simulator. J Sleep Res. 2021;31:e13488. doi:10.1111/jsr.13488
44. Giménez MC, Hessels M, van de Werken M, de Vries B, Beersma DG, Gordijn MC. Effects of artificial dawn on subjective ratings of sleep inertia and dim light melatonin onset. Chronobiol Int. 2010;27(6):1219–1241. doi:10.3109/07420528.2010.496912
45. Balkin TJ, Braun AR, Wesensten NJ, et al. The process of awakening: a PET study of regional brain activity patterns mediating the re-establishment of alertness and consciousness. Brain. 2002;125(Pt 10):2308–2319. doi:10.1093/brain/awf228
46. Vyazovskiy VV, Cui N, Rodriguez AV, Funk C, Cirelli C, Tononi G. The dynamics of cortical neuronal activity in the first minutes after spontaneous awakening in rats and mice. Sleep. 2014;37(8):1337–1347. doi:10.5665/sleep.3926
47. Kräuchi K, Knoblauch V, Wirz-Justice A, Cajochen C. Challenging the sleep homeostat does not influence the thermoregulatory system in men: evidence from a nap vs. sleep-deprivation study. AM J Physiol-Reg I. 2006;290(4):R1052–1061. doi:10.1152/ajpregu.00381.2005
48. Rusterholz T, Tarokh L, Van Dongen HP, Achermann P. Interindividual differences in the dynamics of the homeostatic process are trait-like and distinct for sleep versus wakefulness. J Sleep Res. 2017;26(2):171–178. doi:10.1111/jsr.12483
49. Hou Y, Huangfu E, Zhang L, Miao D. Changes in cognition and mood due to sleep inertia after 30-hour sleep deprivation. Internet J Ment Health. 2007;4:1–11.
50. Weissbluth M, Weissbluth L. Colic, sleep inertia, melatonin and circannual rhythms. Med Hypotheses. 1992;38(3):224–228. doi:10.1016/0306-9877(92)90099-X
 © 2022 The Author(s). This work is published and licensed by Dove Medical Press Limited. The
full terms of this license are available at https://www.dovepress.com/terms
and incorporate the Creative Commons Attribution
- Non Commercial (unported, 3.0) License.
By accessing the work you hereby accept the Terms. Non-commercial uses of the work are permitted
without any further permission from Dove Medical Press Limited, provided the work is properly
attributed. For permission for commercial use of this work, please see paragraphs 4.2 and 5 of our Terms.
© 2022 The Author(s). This work is published and licensed by Dove Medical Press Limited. The
full terms of this license are available at https://www.dovepress.com/terms
and incorporate the Creative Commons Attribution
- Non Commercial (unported, 3.0) License.
By accessing the work you hereby accept the Terms. Non-commercial uses of the work are permitted
without any further permission from Dove Medical Press Limited, provided the work is properly
attributed. For permission for commercial use of this work, please see paragraphs 4.2 and 5 of our Terms.