Back to Journals » Clinical Ophthalmology » Volume 20
Alterations in Macular and Peripapillary Vessel Density Following Implantable Collamer Lens Surgery in Highly Myopic Eyes and Their Potential Association with 2-Year Axial Length Changes
Authors Meng L, Liu X, Chen Y, Luo Y, Yang Z, Chen H ![]()
Received 6 November 2025
Accepted for publication 25 February 2026
Published 18 March 2026 Volume 2026:20 579505
DOI https://doi.org/10.2147/OPTH.S579505
Checked for plagiarism Yes
Review by Single anonymous peer review
Peer reviewer comments 2
Editor who approved publication: Dr Scott Fraser
Lihui Meng,1– 3,* Xinyu Liu,1– 4,* Youxin Chen,1– 3 Yan Luo,1– 3 Zhikun Yang,1– 3 Huan Chen1– 3
1Department of Ophthalmology, Peking Union Medical College Hospital, Chinese Academy of Medical Sciences, Beijing, People’s Republic of China; 2Beijing Key Laboratory of Fundus Diseases Intelligent Diagnosis & Drug/Device Development and Translation, Beijing Municipal Science & Technology Commission, Beijing, People’s Republic of China; 3Key Laboratory of Ocular Fundus Diseases, Chinese Academy of Medical Sciences & Peking Union Medical College, Beijing, People’s Republic of China; 4Graduate School, Peking Union Medical College, Chinese Academy of Medical Sciences, Beijing, People’s Republic of China
*These authors contributed equally to this work
Correspondence: Huan Chen; Zhikun Yang, Department of Ophthalmology, Peking Union Medical College Hospital, Chinese Academy of Medical Sciences, No. 1 Shuaifuyuan, Wangfujing Street, Beijing, 100730, People’s Republic of China, Email [email protected]; [email protected]
Purpose: To investigate early postoperative microvascular and structural changes in the macular and peripapillary regions after posterior chamber phakic intraocular lens (ICL) implantation in high myopia.
Patients and Methods: This prospective cohort included 122 eyes of 61 patients with high myopia undergoing ICL implantation. Optical coherence tomography (OCT) and OCT angiography (OCTA) were performed preoperatively and at 1 day, 1 week, 1 month, and 3 months postoperatively. Outcomes included corrected distance visual acuity (CDVA), spherical equivalent (SE), intraocular pressure (IOP), axial length (AL), macular and peripapillary vessel density parameters, retinal thickness, choroidal thickness (CT), and choroidal vascularity index (CVI), analyzed globally and by sector.
Results: At 3 months, SE and CDVA improved significantly (both P< 0.05), while IOP remained stable (P> 0.05). Global macular perfusion decreased, including total macular vessel density (MVD; Δ=− 4.11, 95% CI − 5.78 to − 2.44; P< 0.0001) and macular small-vessel density (MSmVD; Δ=− 3.56, 95% CI − 4.22 to − 2.90; P< 0.0001), with similar reductions across macular subregions. Layer-specific analysis showed reduced superficial vessel density (SVD; Δ=− 3.61, 95% CI − 4.51 to − 2.70; P< 0.0001), whereas deep vessel density (DVD) showed no significant global change (Δ=0.78, 95% CI − 0.63 to 2.18; P=0.279), with regional heterogeneity. Peripapillary vessel density also decreased (OVD: Δ=− 4.21, 95% CI − 5.30 to − 3.11; P< 0.0001; OSmVD: Δ=− 2.11, 95% CI − 2.85 to − 1.36; P< 0.0001), with sectoral variation. AL was negatively correlated with several macular and peripapillary vascular parameters (all P< 0.05). In an exploratory sub-analysis (32 patients, 64 eyes) with 2-year AL follow-up, mean AL change was not significant, but greater 3-month foveal CT reduction was associated with longer AL at 2 years (estimate=− 0.003 mm/μm; P=0.008).
Conclusion: ICL implantation significantly improved visual and refractive outcomes and was accompanied by early macular and peripapillary microvascular and structural changes. Early postoperative CT changes may be associated with longer-term axial length outcomes.
Keywords: high myopia, intraocular lens implantation, optical coherence tomography angiography, macular vessel density, peripapillary vessel density, axial length
Introduction
The global burden of myopia continues to escalate at an alarming rate. In 2000, approximately 1.4 billion individuals were affected by myopia, and projections estimate this figure will rise to 4.7 billion by 2050. Of these, nearly 10% are expected to develop high myopia, representing a fivefold increase compared to levels observed at the turn of the century.1 The management of high myopia remains a formidable challenge in contemporary ophthalmology, particularly due to its association with progressive axial elongation and sight-threatening complications. For patients with significant refractive errors or inadequate corneal thickness, conventional corneal refractive surgeries such as small incision lenticule extraction (SMILE) may not be suitable due to excessive stromal tissue removal and potential biomechanical instability.2 In such cases, implantation of a posterior chamber phakic intraocular lens, specifically the implantable collamer lens (ICL), offers a viable alternative. This procedure avoids corneal excision and has demonstrated high refractive accuracy and predictability across a broad range of myopic corrections.3
Robust longitudinal data have demonstrated that ICL is both safe and effective in the long-term, with follow-up studies extending up to 10 years confirming stable visual outcomes and minimal complications.4,5 Nevertheless, high myopia is often linked with structural alterations in the retina and choroid, including thinning of these tissues and reduced microvascular perfusion.6 Axial elongation induces mechanical stretching of the ocular wall, resulting in straighter, narrower vessels with reduced perfusion and oxygen demand, ultimately leading to a decline in microvascular density.7,8 Several investigations have reported a negative association between increasing axial length (AL) or refractive error and capillary density within the retina and choriocapillaris.9–11 Based on these findings, although ICL implantation is a relatively non-invasive intraocular procedure, it is not entirely devoid of risk. Like other intraocular surgeries, it may trigger mild intraocular inflammation, compromise vascular endothelial integrity, and transiently disrupt the blood–aqueous barrier.12,13 These changes raise important questions regarding the potential impact of this procedure on posterior segment perfusion and retinal or choroidal homeostasis in eyes with high myopia.
Advances in imaging, including optical coherence tomography (OCT) and OCT angiography (OCTA), have enabled non-invasive, high-resolution assessment of retinal and choroidal microstructures.14,15 While a growing body of literature has utilized OCTA to examine the microvascular consequences of ICL surgery, most studies to date have reported minimal or no significant postoperative alterations in vessel density (VD).16–20 However, these findings may be limited by methodological constraints, such as small sample sizes, lack of power, and inadequate control for inter-eye correlation when both eyes are included, which may introduce bias and obscure meaningful associations. To address these limitations, our study incorporated a relatively large cohort and utilized linear mixed-effects models to properly account for within-subject inter-eye correlation. Additionally, we employed the OCTA system’s intrinsic image processing features to exclude large-vessel signals, allowing for more precise capillary-level quantification of small vessel density (SmVD). We analyzed SmVD separately from total VD because large-vessel contributions can dominate total VD and mask subtle capillary-level rarefaction or dropout, whereas SmVD is more sensitive to microvascular change. This approach enhances the sensitivity and reliability of microvascular assessments, especially when investigating subtle perfusion changes post-ICL implantation.
Here, the structural and microvascular alterations in the macular, peripapillary, and choroidal regions of highly myopic eyes following ICL implantation, were comprehensively investigated using OCT and OCTA. By characterizing these changes and their associations with baseline ocular characteristics and long-term axial elongation, our findings aim to deepen the understanding of the impact of ICL implantation on posterior segment physiology and guide clinical monitoring strategies in high-risk patients.
Materials and Methods
Study Subjects
This prospective observational study was undertaken at Peking Union Medical College Hospital (PUMCH) between November 2021 and November 2022. The study followed the guidelines of the Declaration of Helsinki and was approved by the Institutional Ethics Committee of PUMCH (Approval No. I-25PJ0034). All participants provided written informed consent.
Eligible participants met the following inclusion criteria: (1) a clinical diagnosis of high myopia, represented by a spherical equivalent (SE) ≤ −6.00 diopters or AL > 26 mm; (2) age ≥ 18 years; (3) stable refractive status over the preceding year, with a change in SE ≤ 0.50 D; (4) central anterior chamber depth (ACD) ≥ 2.8 mm; (5) corneal endothelial cell density (ECD) ≥ 2000 cells/mm2; and (6) no evidence of progressive corneal irregularity, cataract progression, or posterior segment pathology apart from retinal breaks that had undergone laser photocoagulation.
Exclusion criteria consisted of: (1) pathologic myopia, representing myopic maculopathy greater or equal to diffuse chorioretinal atrophy, including patchy atrophy, lacquer cracks, myopic choroidal neovascularization (CNV), and CNV-related macular atrophy; (2) age ≥ 45 years; (3) intraocular pressure (IOP) > 21 mmHg; (4) presence of other ocular conditions, including glaucoma, uveitis, diabetic retinopathy, or retinal vein occlusion; and (5) systemic conditions potentially affecting retinal or choroidal circulation, such as diabetes mellitus, hypertension, or autoimmune disease.
Data
Baseline information on demographics and clinical features, including age, sex, and medical history, were recorded. Comprehensive ophthalmic examinations were performed before ICL implantation; these included measurement of AL, subjective and objective refraction, uncorrected distance visual acuity (UDVA), corrected distance visual acuity (CDVA), corneal topography, IOP, slit-lamp biomicroscope, and dilated fundus examination.
OCTA imaging was performed using a swept-source OCT/OCTA system (VG200S; SVision Imaging, Henan, China) at five time points: baseline (preoperatively) and postoperative day 1, week 1, month 1, and month 3. The system operates at 200,000 A-scans/s with a 1050-nm light source (axial/lateral resolution: 5/13 μm). To minimize diurnal variation, all scans were acquired between 13:30 and 15:30. Macular and peripapillary imaging were obtained using 6×6 mm scans centered on the fovea and optic nerve head, respectively.
OCTA images were acquired under a standardized protocol. Scans with Signal Strength Index (SSI) < 6 were deemed unacceptable and were repeated immediately. Scans with SSI ≥ 6 subsequently underwent independent quality review by two experienced ophthalmologists (LHM and XYL) for centration, motion artifacts (eg, streaks/blink lines), and segmentation accuracy; disagreements were resolved by consensus with the corresponding authors (HC and ZKY). If a scan failed visual quality review (eg, residual artifacts or uncorrectable segmentation errors), it was repeated even if SSI ≥ 6. For each visit, the first scan meeting both criteria (SSI ≥ 6 and passing visual review) was retained for analysis, and no image averaging was performed. To document acquisition-level quality control, we recorded the number of repeat scans required before an acceptable scan was obtained.
All OCTA-derived vascular metrics were generated automatically using the device’s built-in analysis software under default manufacturer settings applied consistently across all visits (software version V3.1.431T1125). VD and SmVD were computed from en face angiograms via proprietary flow-signal processing and flow-pixel classification/binarization with identical settings across visits. Large-vessel exclusion was applied only to SmVD-derived metrics using the embedded algorithm, whereas total VD metrics were quantified without large-vessel exclusion. Magnification related to AL variations was corrected using Bennett’s formula. Two experienced ophthalmologists (LHM and XYL) primarily verified scan quality (centration, artifacts, and segmentation accuracy) and exported the software-generated quantitative outputs; no manual vessel thresholding/binarization, manual tracing, or image averaging was performed.
Measurement of Angiography Parameters
Retinal thickness (RT) was defined as the mean distance from the inner limiting membrane (ILM) to the retinal pigment epithelium (RPE)–Bruch’s membrane complex. Choroidal thickness (CT) was calculated as the average distance between the outer boundary of the RPE–Bruch’s complex and the choroid–sclera junction. The choroidal vascularity index (CVI) was computed as the ratio of the luminal area to the total choroidal area within a given region.
VD was expressed as the proportion of a selected area containing blood vessels. SmVDwas calculated using the same principle but excluded large-caliber vessels via an automated algorithm embedded in the system software. Superficial vessel density (SVD) referred to the layer extending from 5 μm beyond the ILM to the outer third interface of the ganglion cell and inner plexiform layers (GCL+IPL). Deep vessel density (DVD) spanned from the outer third interface of GCL+IPL to 25 μm beneath the lower boundary of the inner nuclear layer (INL). Macular vessel density (MVD) represented the combined values of SVD and DVD.21 Peripapillary optic disc vessel density (OVD) was assessed within the radial peripapillary capillary (RPC) layer, located in the retinal nerve fiber layer (RNFL), using an elliptical annulus of 2 mm width surrounding the optic disc.22 SmVD were further categorized into macular SmVD (MSmVD) and optic disc SmVD (OSmVD), respectively.
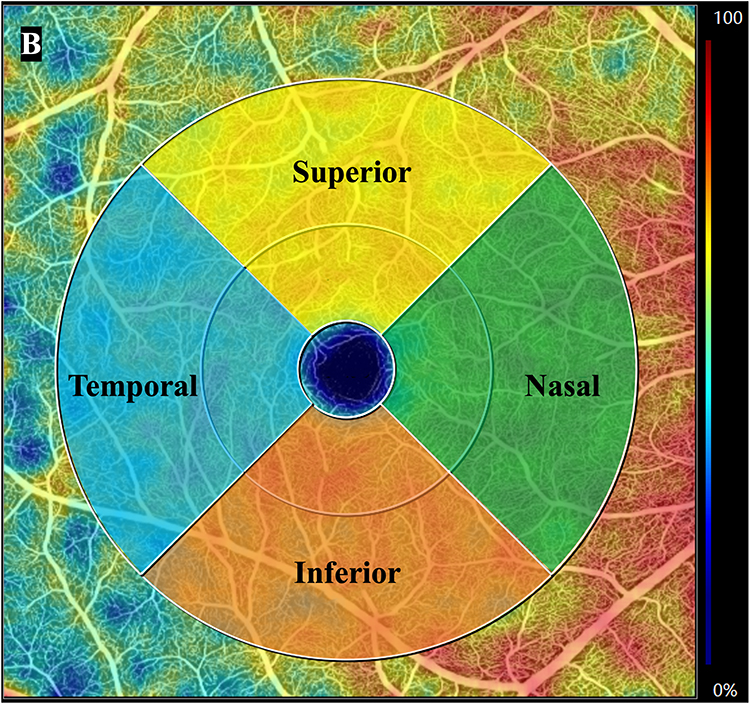
The 6×6 mm macular scan was segmented into three concentric regions surrounding the fovea: the foveal (1.0 mm diameter), parafoveal (1.0–3.0 mm annulus), and perifoveal (3.0–6.0 mm annulus) regions (Figure 1A). The parafoveal and perifoveal rings were each subdivided into four quadrants: superior, inferior, nasal, and temporal (Figure 1B). The OVD region was divided into eight sectors: superotemporal, superonasal, inferotemporal, inferonasal, temporal-superior, temporal-inferior, nasal-superior, and nasal-inferior (Figure 2).
Figure 1 continued. Figure 1 (A) Segmentation of the 6×6 mm macular scan into three concentric zones. Analyzed zones included the central foveal area (1.0 mm diameter), the parafoveal region (annular zone spanning 1.0–3.0 mm), and the perifoveal region (annular zone spanning 3.0–6.0 mm). (B) Segmentation of the 6×6 mm macular scan into four quadrants. The annular area extending from 1.0 to 6.0 mm around the foveal center is divided into superior, temporal, inferior, and nasal quadrants.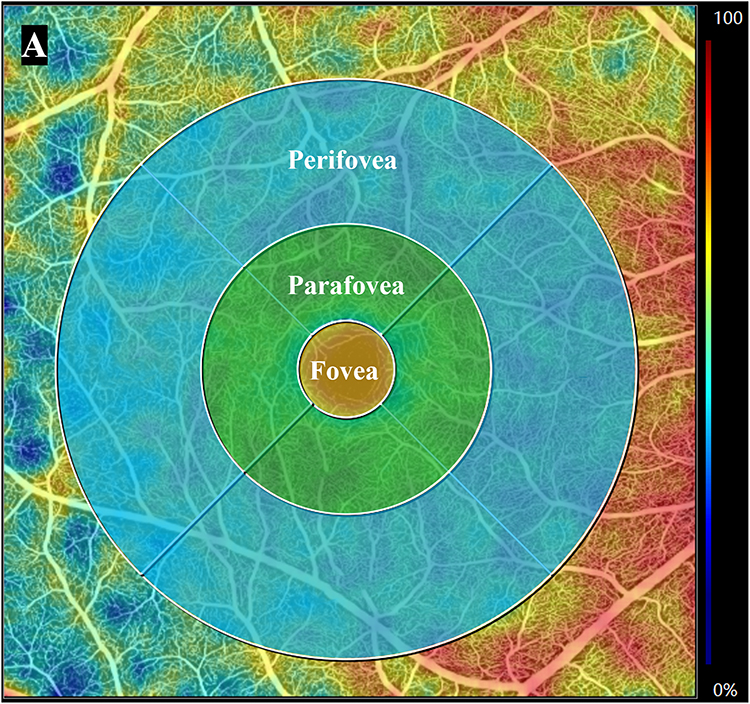
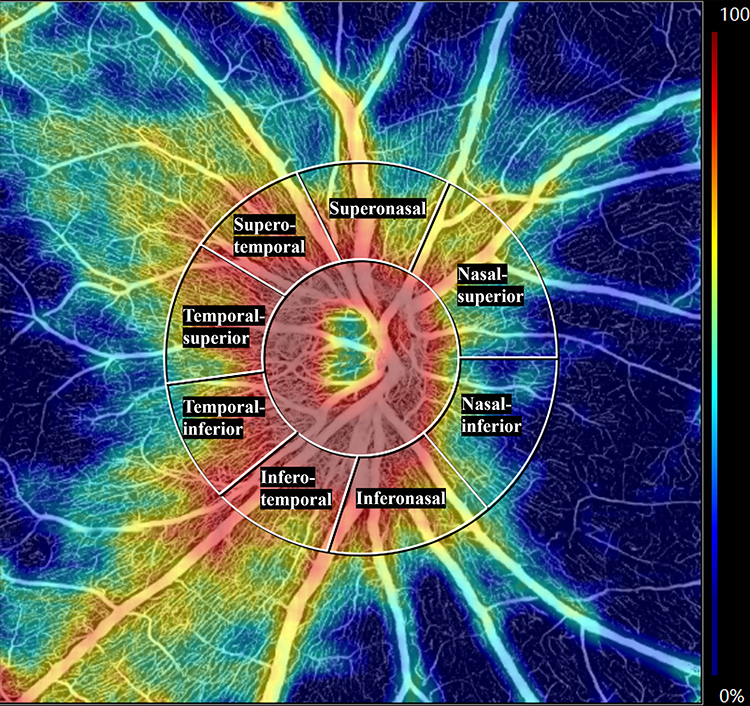 |
Figure 2 Sectoral segmentation of the peripapillary optic disc vessel density (OVD) region into eight sectors. Analyzed sectors included superotemporal, superonasal, inferotemporal, inferonasal, temporal-superior, temporal-inferior, nasal-superior, and nasal-inferior. |
Surgical Technique
All ICL V4c implantations were performed under standardized conditions by two senior surgeons (YL and ZKY). Preoperative mydriasis was induced with four doses of topical mydriatics at 10-minute intervals. Following topical anesthesia, a 3.2-mm temporal corneal incision was created, a small amount of viscoelastic was injected into the anterior chamber, and the ICL was inserted and positioned with the four haptics placed in the ciliary sulcus; residual viscoelastic was thoroughly irrigated with balanced salt solution. Postoperatively, patients were prescribed topical loteprednol etabonate ophthalmic suspension 0.5% (Ludashu®), 1 drop in the operated eye four times daily for 1 week; this was followed by topical diclofenac sodium eye drops (Difei®), 1 drop three times daily for 2 weeks. In addition, topical levofloxacin ophthalmic solution (Cravit®) was administered as 1 drop four times daily for 3 weeks. When multiple eye drops were used, an interval of at least 5 minutes was maintained between instillations. No routine postoperative mydriatics were administered during follow-up. Any additional IOP-lowering medication or steroid adjustment was prescribed only when clinically indicated and was documented. Postoperative ICL vault was measured at 1 week using anterior-segment OCT (CASIA2; Tomey Corporation, Nagoya, Japan) without pharmacologic mydriasis, with one measurement per eye obtained using the built-in caliper tool. For participants undergoing bilateral implantation, the two eyes were operated on separate surgical days.
Statistical Analyses
All statistical analyses were conducted using R (R Foundation for Statistical Computing, Vienna, Austria) and GraphPad Prism 5.0 (GraphPad Software Inc., CA, USA). Continuous variables were summarized as mean ± standard deviation (SD). To assess changes in OCT and OCTA parameters over time, linear mixed-effects models were constructed for each parameter. Time was included as a fixed effect, while laterality (left or right eye) was modeled as a random intercept to account for intra-subject correlation due to bilateral data. Bonferroni correction was utilized for pairwise comparisons to control for multiple testing. Linear mixed-effects models were also employed to examine associations between changes in OCTA parameters and relevant clinical variables. A two-tailed P < 0.05 represented significance.
Results
Baseline Information
Sixty-one patients with high myopia (122 eyes) who received ICL implantation were enrolled and analyzed. The average age of the participants was 30.00 ± 5.22 years. Among them, 10 were male (16%) with a mean age of 31.2 ± 4.00 years, and 52 were female (84%) with a mean age of 29.76 ± 5.40 years. The mean preoperative AL was 27.29 ± 1.59 mm (Table 1). All 61 participants (122 eyes) completed OCT/OCTA assessments at baseline and at 1 day, 1 week, 1 month, and 3 months postoperatively; therefore, longitudinal OCT/OCTA analyses included 122 eyes at each time point. The 2-year AL analysis was exploratory and was performed in the subset with available follow-up (32 participants, 64 eyes).
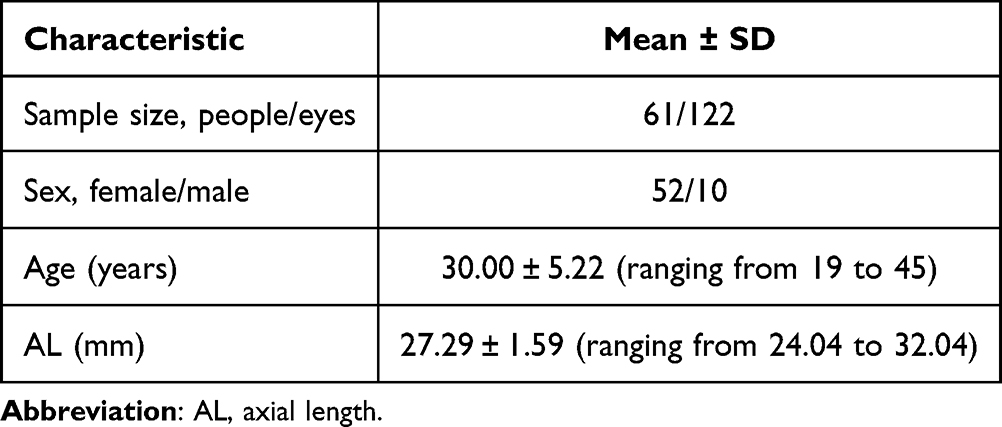 |
Table 1 Basic Characteristics of the Subjects |
Preoperative and Postoperative Changes in SE, CDVA, and IOP
Both SE, UDVA and CDVA demonstrated statistically significant improvements at all postoperative time points relative to baseline (P < 0.0001). The IOP remained constant over the follow-up period, with no marked changes detected relative to the preoperative values (P > 0.05) (Table 2). Exact P-values for all time points are provided in Supplementary Tables 1.1 and 1.2.
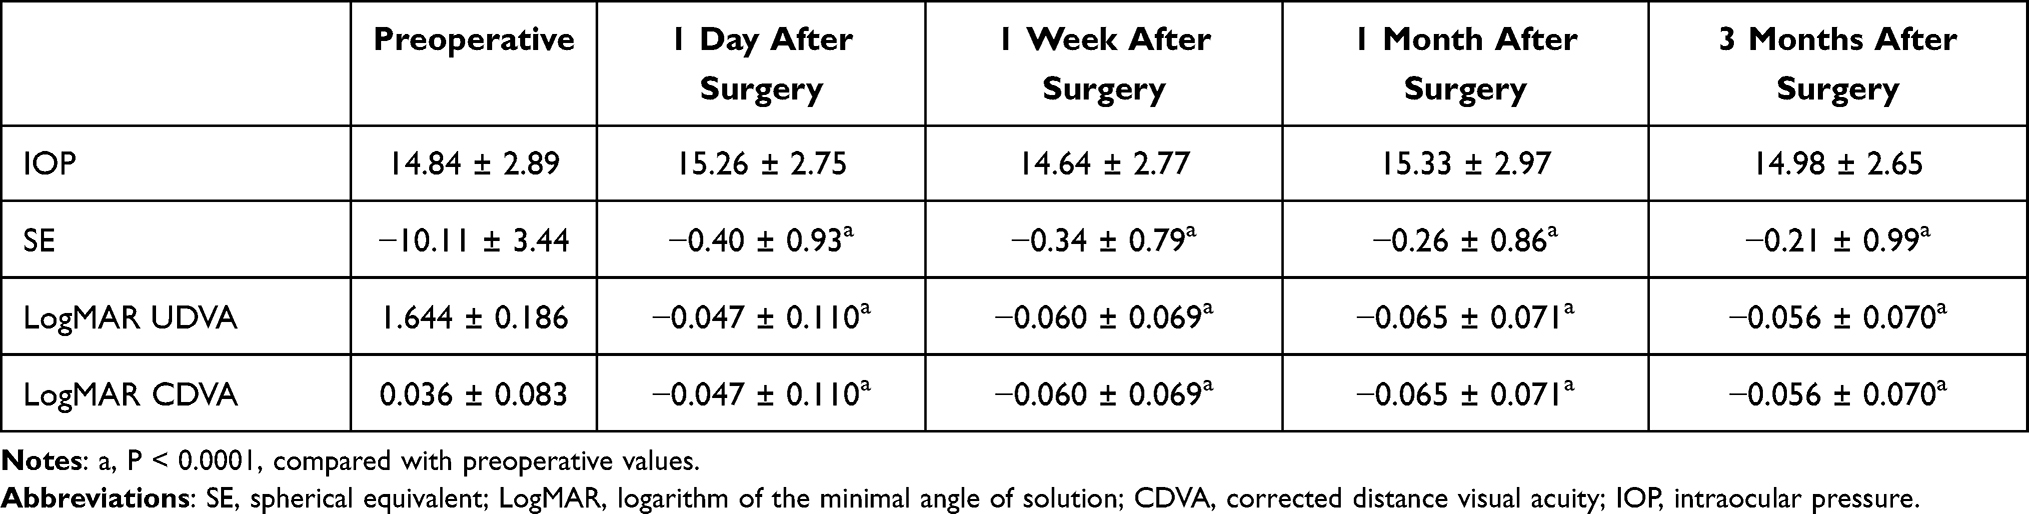 |
Table 2 Comparison of SE, CDVA, and IOP of Patients Before and After Surgery |
Image Quality Control
Image quality was consistently high across all visits. A total of 244 OCTA scans per time point (122 eyes × 2 scan types) were included for analysis, with scan-level SSI ranging from 7 to 10 (overall mean SSI, 9.05 ± 0.74). Importantly, SSI did not differ across preoperative and postoperative visits (linear mixed-effects model time effect: P = 1.00; Friedman test: P = 0.97). During acquisition, scans with SSI < 6 were repeated until meeting the predefined threshold (SSI ≥ 6); consequently, only a small proportion of scans required at least one repeat (3.3–7.4% across visits; maximum repeats for a single scan, 3), and no manual segmentation correction was performed for the final analysis set.
Alterations in Retinal Thickness and Vascular Density in the Macular Region
Following ICL implantation, RT exhibited a progressive increase. Significant thickening was observed in the global macular region, as well as in the parafoveal and perifoveal areas and all four quadrants (superior, inferior, nasal, and temporal) beginning at 1 week following surgery and persisting through 1 and 3 months (P < 0.05). No notable changes in RT were detected on postoperative day 1. In contrast, significant increases in foveal thickness were only seen at 1 and 3 months (P < 0.05) (Table 3). Exact P-values for all regions and time points are provided in Supplementary Tables 2.1 and 2.2.
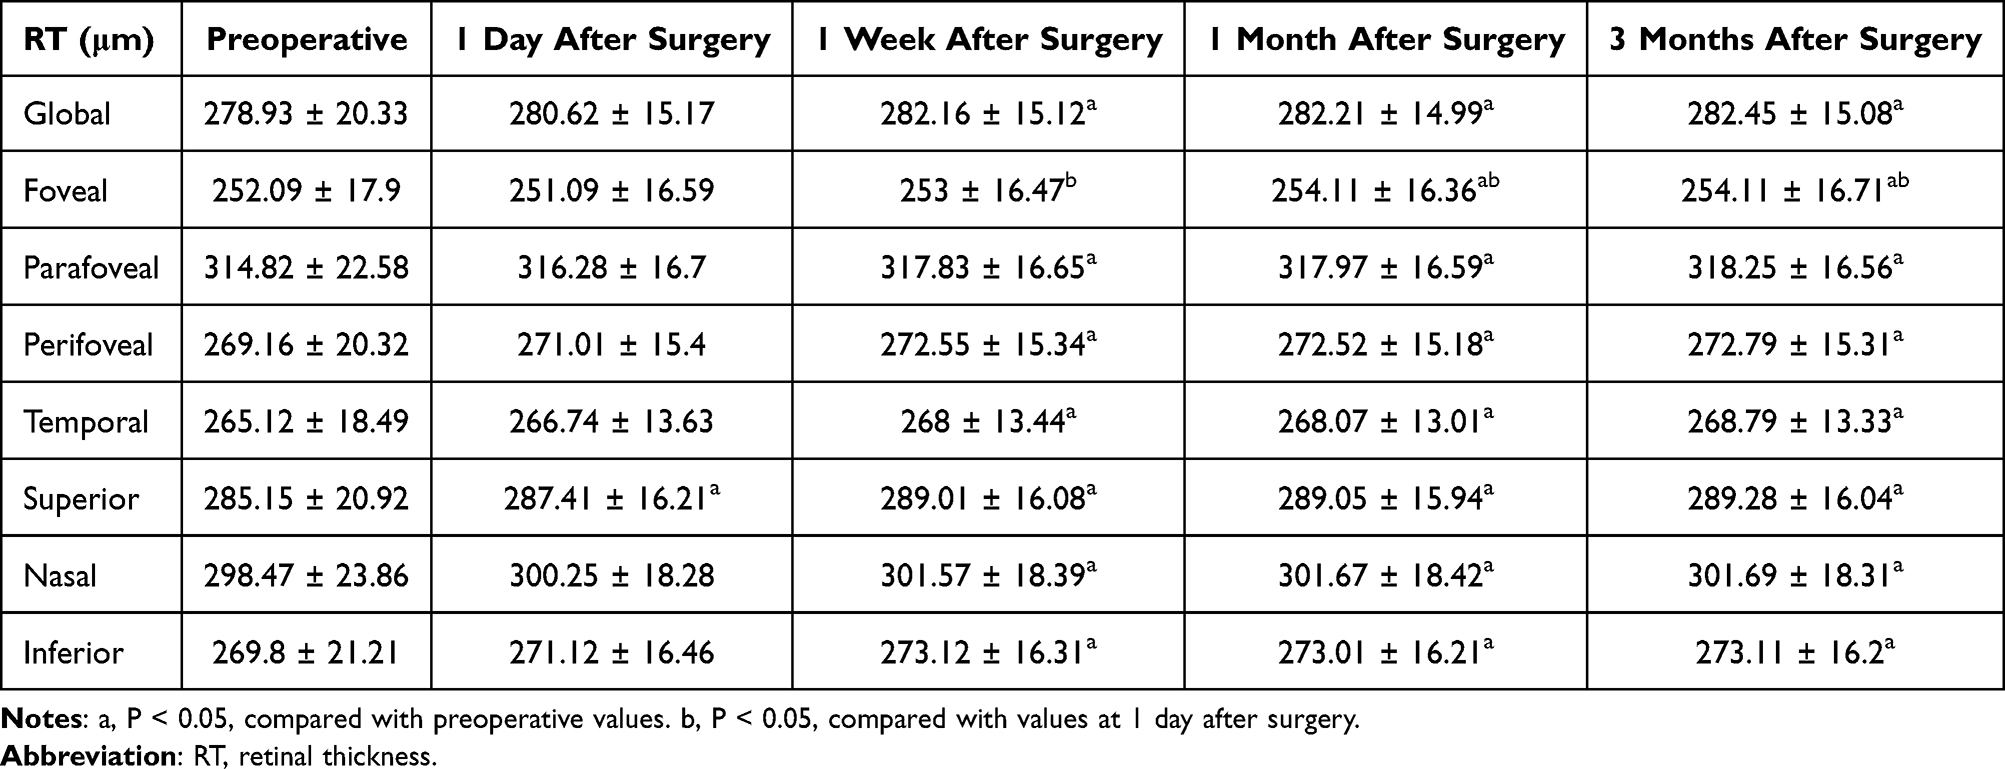 |
Table 3 Comparison of RT Before and After Surgery |
From baseline to 3 months, global macular MVD decreased (Δ = −4.11, 95% CI −5.78 to −2.44; P < 0.0001). During the early postoperative period (day 1 to 1 month), MVD remained unchanged across all macular regions (including the fovea, parafovea, perifovea, and four quadrants) (P > 0.05). By the 3-month follow-up, MVD had significantly decreased across all evaluated subregions and quadrants compared to baseline (P < 0.05) (Table 4 and Figure 3). Exact P-values for baseline-to–3-month comparisons are provided in Supplementary Tables 2.1 and 2.2, and exact P-values for all regions and time points are provided in Supplementary Tables 3.1 and 3.2. A similar pattern was observed for MSmVD. From baseline to 3 months, global macular MSmVD decreased (Δ = −3.56, 95% CI −4.22 to −2.90; P < 0.0001). At 1 month, perifoveal MSmVD and values in the superior and nasal quadrants had significantly declined from baseline (P < 0.05). These reductions became more widespread by 3 months, with significant decreases seen across all macular regions and quadrants (P < 0.05) (Table 5). Exact P-values for all regions and time points are provided in Supplementary Tables 4.1 and 4.2.
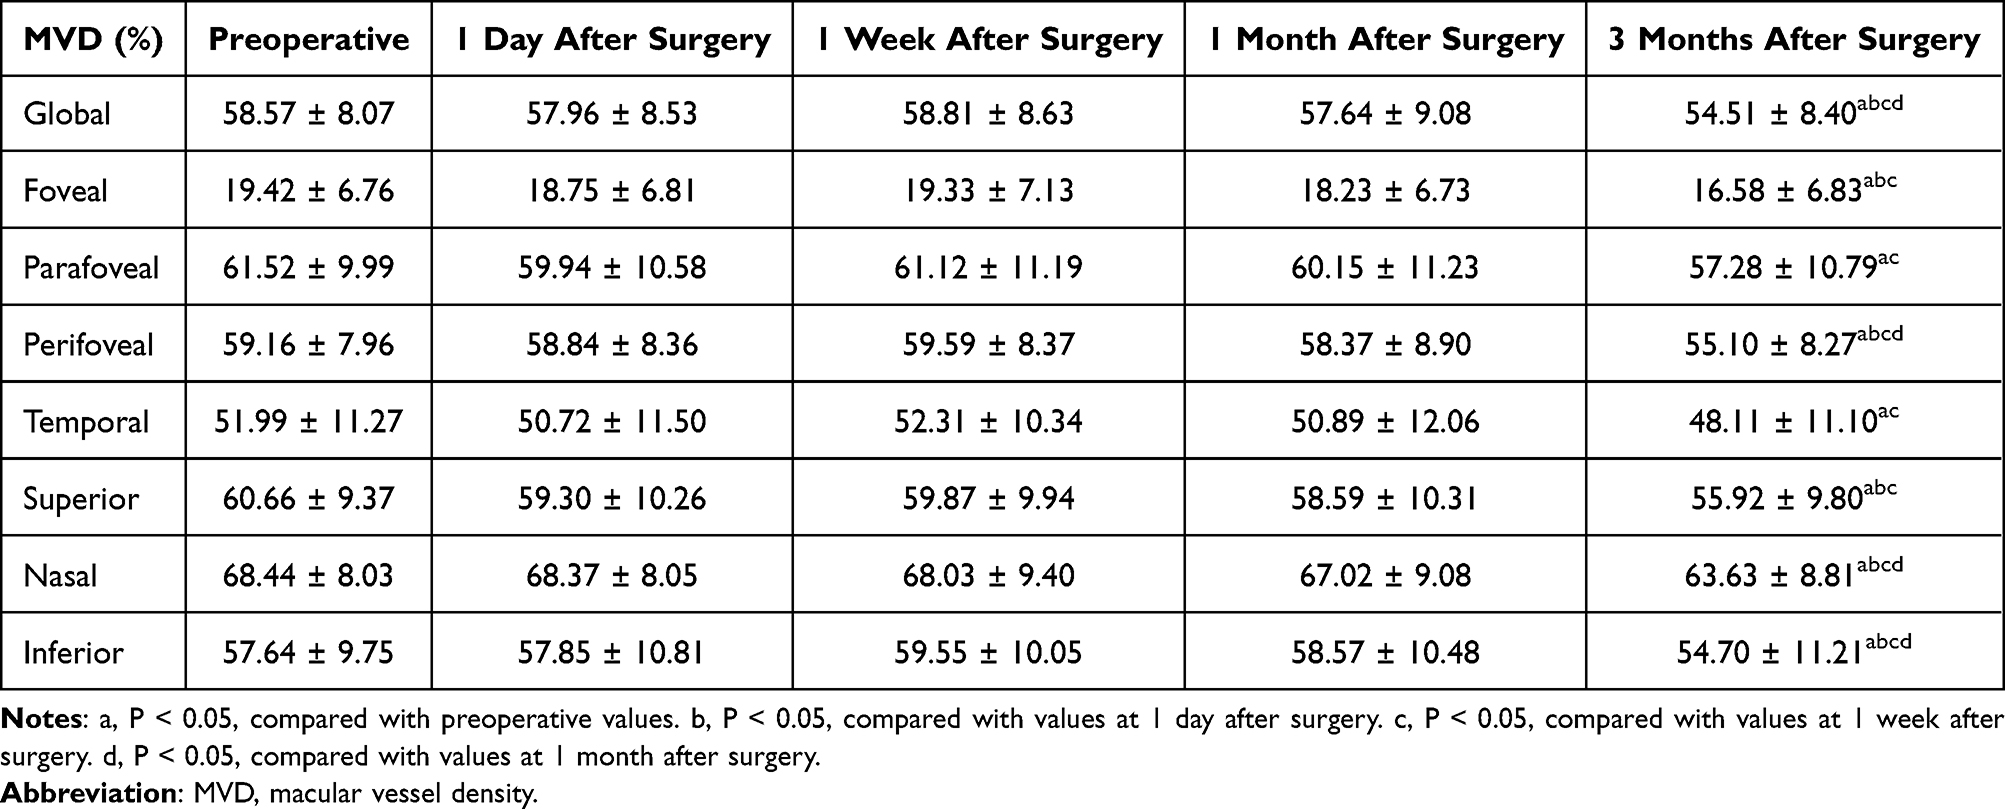 |
Table 4 Comparison of MVD Before and After Surgery |
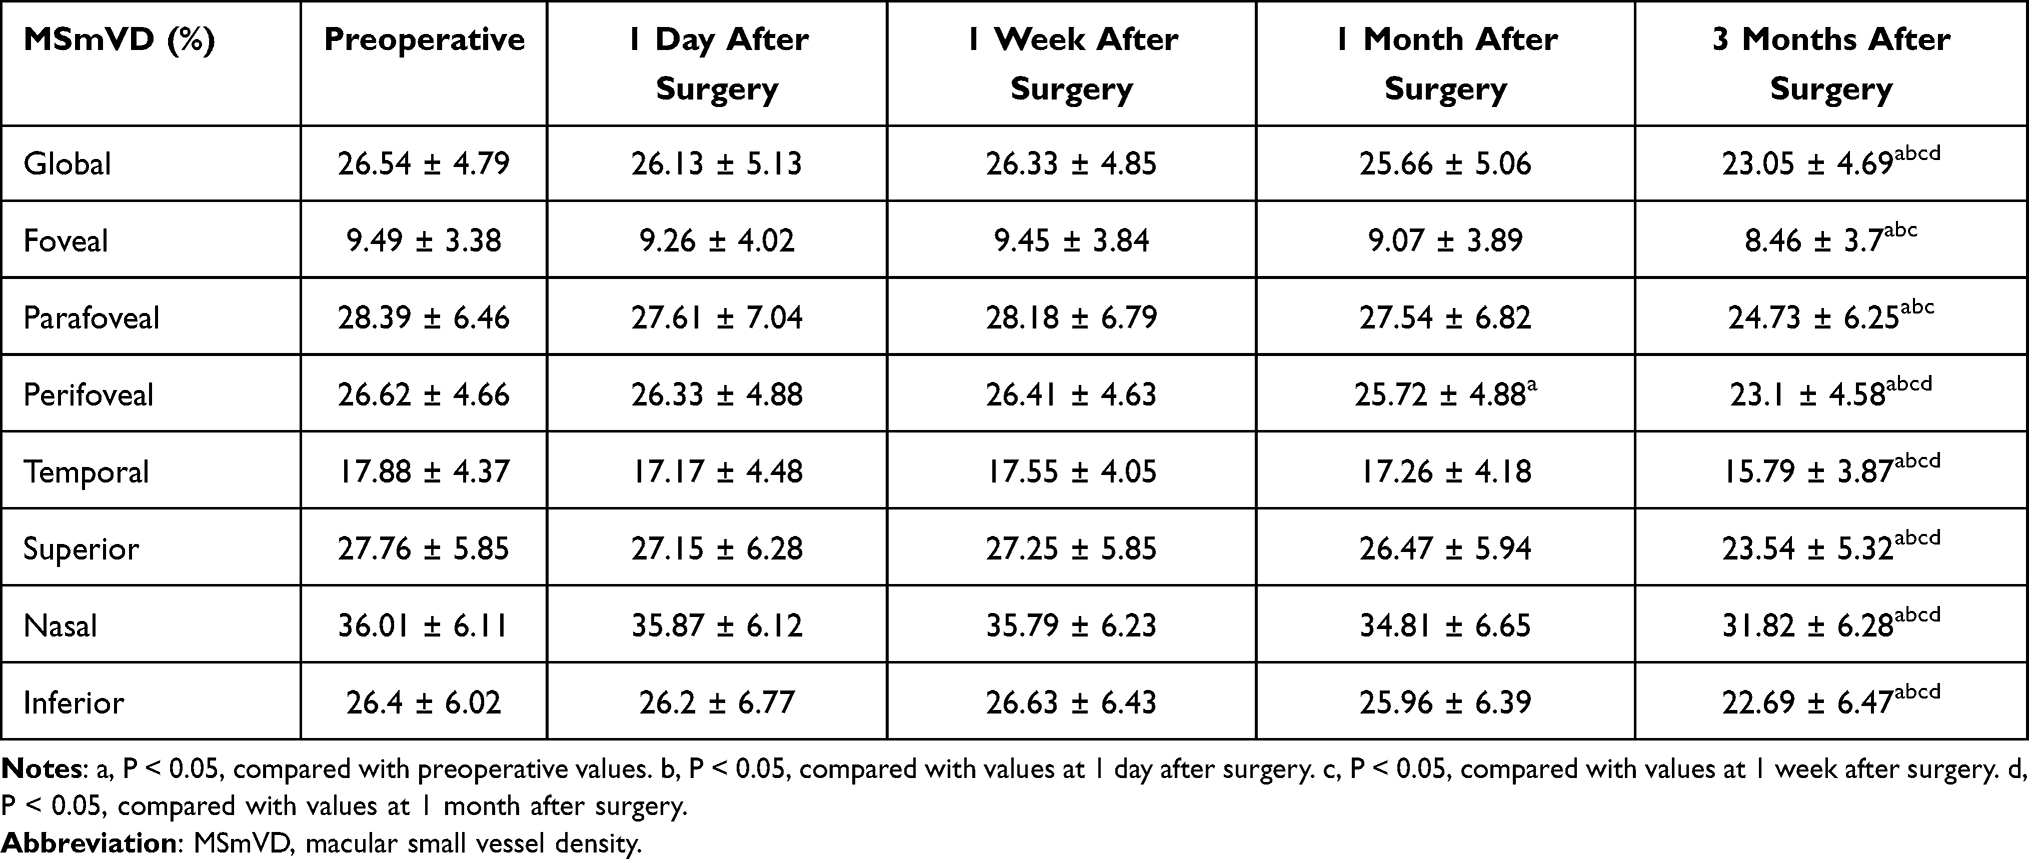 |
Table 5 Comparison of MSmVD Before and After Surgery |
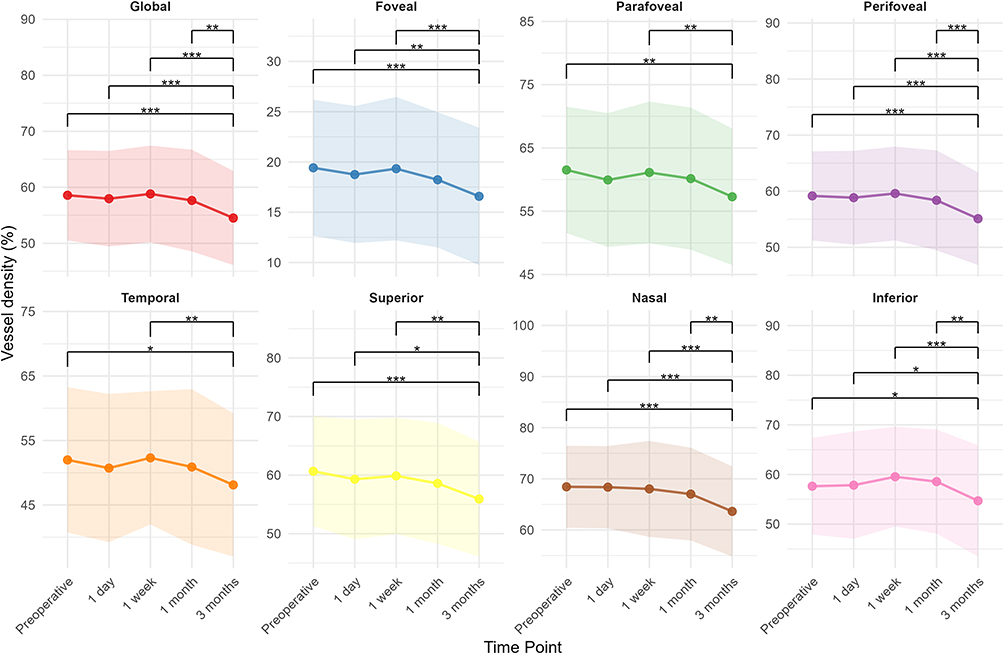 |
Figure 3 Postoperative changes in macular vessel density (MVD) assessed globally, as well as across defined macular subregions and quadrants. *P < 0.05, **P < 0.01, ***P < 0.001. |
From baseline to 3 months, total SVD decreased (Δ = −3.61, 95% CI −4.51 to −2.70; P < 0.0001). Regionally, SVD within the fovea remained stable at all postoperative time points (P > 0.05). In contrast, SVD decreased significantly at 3 months in the parafoveal and perifoveal regions and all four quadrants (P < 0.05) (Table 6 and Figure 4). Exact P-values for all regions and time points are provided in Supplementary Tables 5.1 and 5.2. Global macular DVD did not change significantly from baseline to 3 months (Δ = 0.78, 95% CI −0.63 to 2.18; P = 0.279). DVD in the fovea showed a marked reduction at the 3-month time point (P < 0.05). No substantial changes were noted in the parafoveal and perifoveal subregions at 3 months (P > 0.05), except for the inferior quadrant, which exhibited a significant increase at both 1 and 3 months following surgery (P < 0.05) (Table 7 and Figure 5). Exact P-values for all regions and time points are provided in Supplementary Tables 6.1 and 6.2.
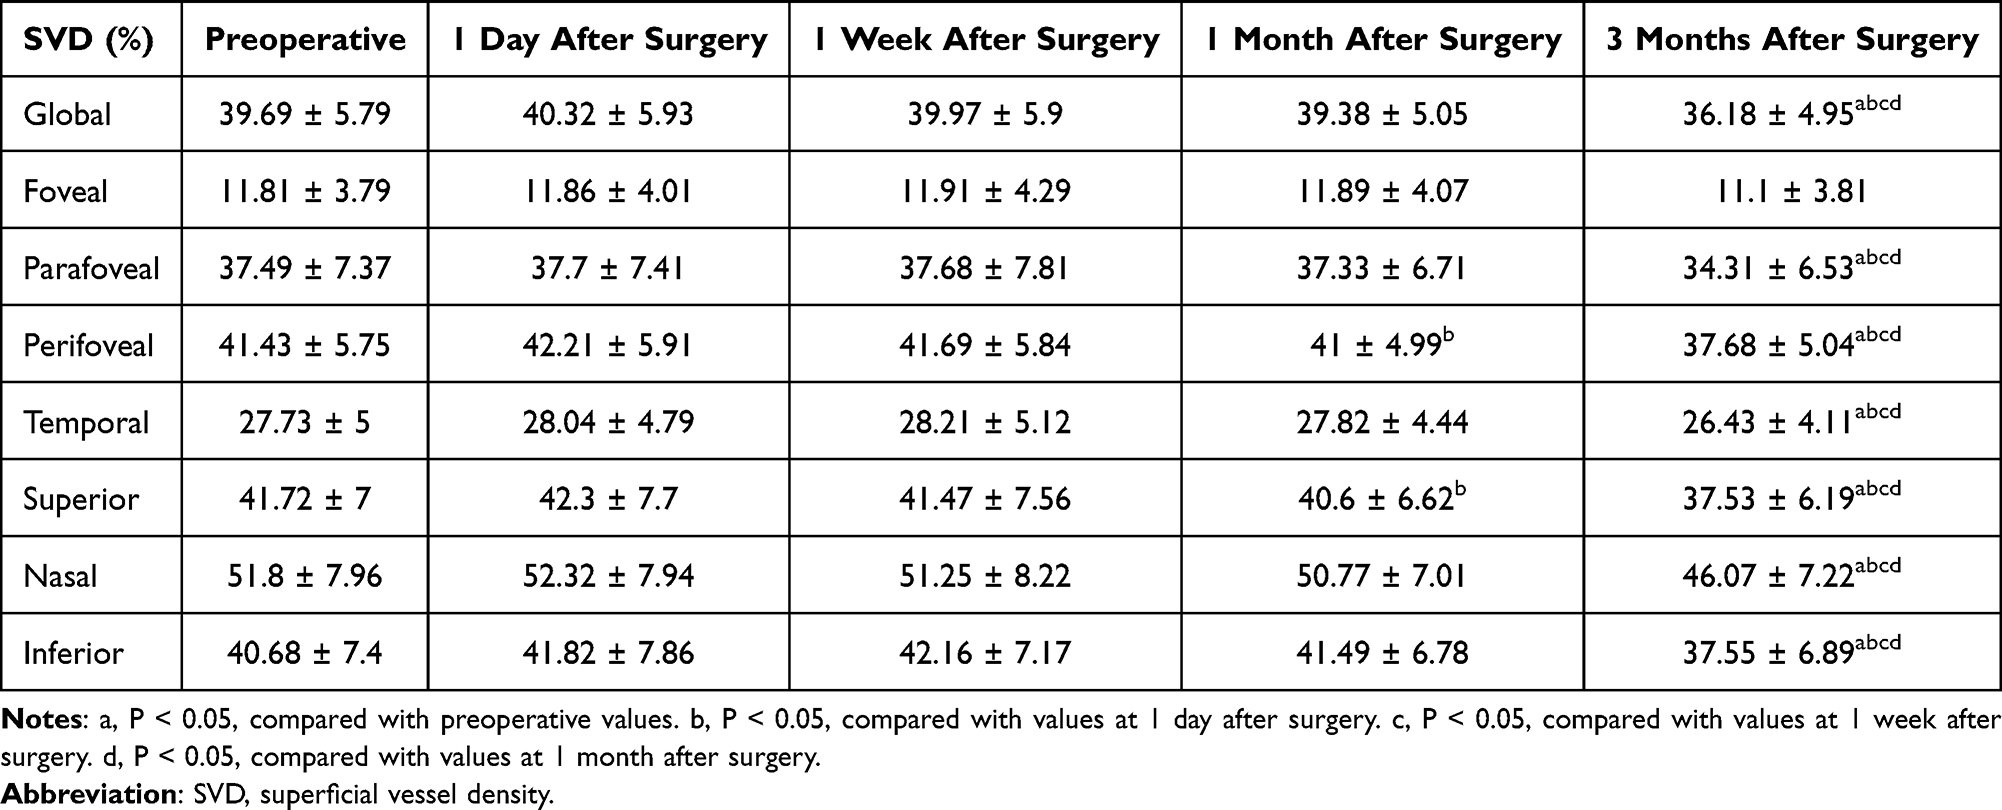 |
Table 6 Comparison of Macular SVD Before and After Surgery |
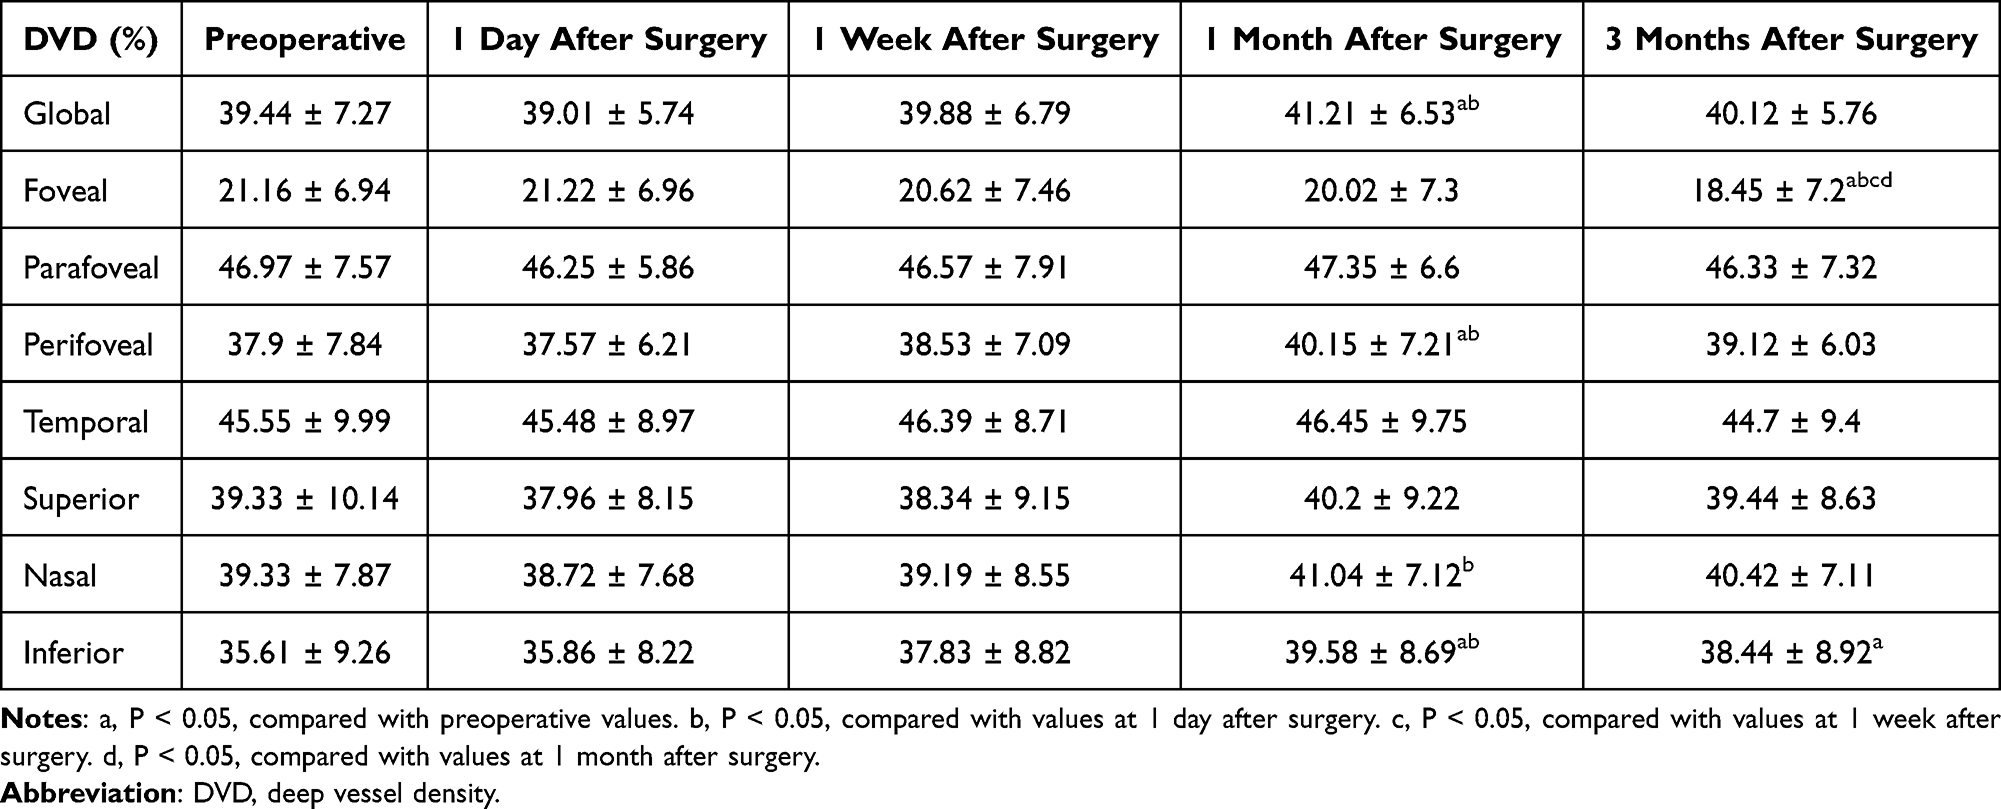 |
Table 7 Comparison of Macular DVD Before and After Surgery |
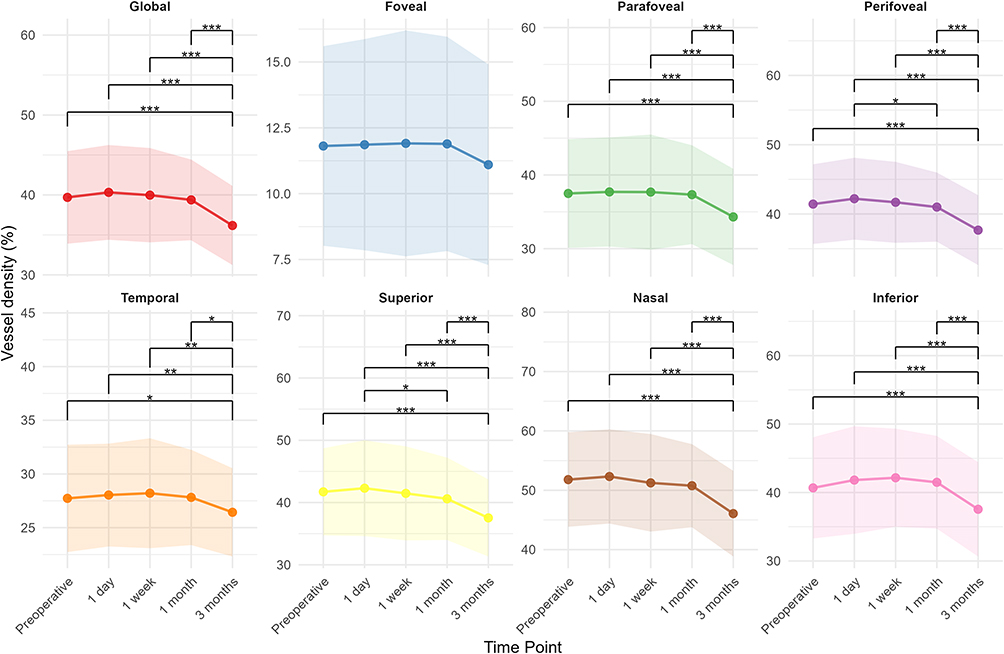 |
Figure 4 Postoperative changes in macular superficial vessel density (SVD) assessed globally, as well as across defined macular subregions and quadrants. *P < 0.05, **P < 0.01, ***P < 0.001. |
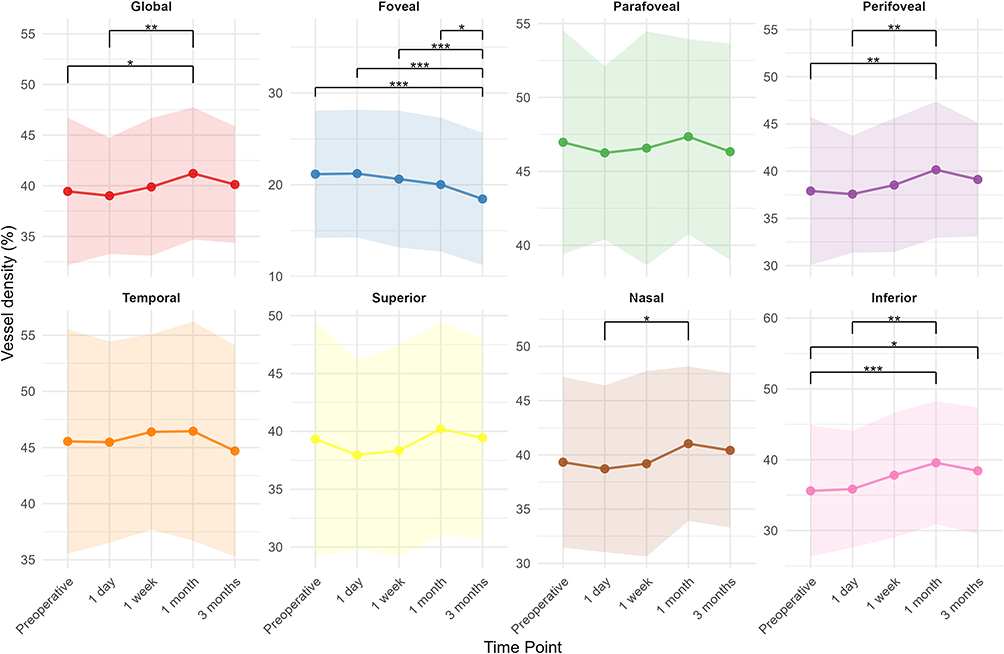 |
Figure 5 Postoperative changes in macular deep vessel density (DVD) assessed globally, as well as across defined macular subregions and quadrants. *P < 0.05, **P < 0.01, ***P < 0.001. |
Changes in Choroidal Thickness and Vascularity
CT significantly increased at 1 day and 1 week following surgery across all macular regions (fovea, parafovea, and perifovea) as well as in each quadrant (superior, inferior, nasal, and temporal) (P < 0.05). Over time, CT gradually declined and by 3 months had significantly decreased relative to its early postoperative peak (P < 0.05). When compared to baseline, however, only the temporal quadrant demonstrated a marked reduction in CT at the 3-month time point (P < 0.05); other regions showed no meaningful difference from preoperative values (P > 0.05) (Table 8). Exact P-values for all regions and time points are provided in Supplementary Tables 7.1 and 7.2.
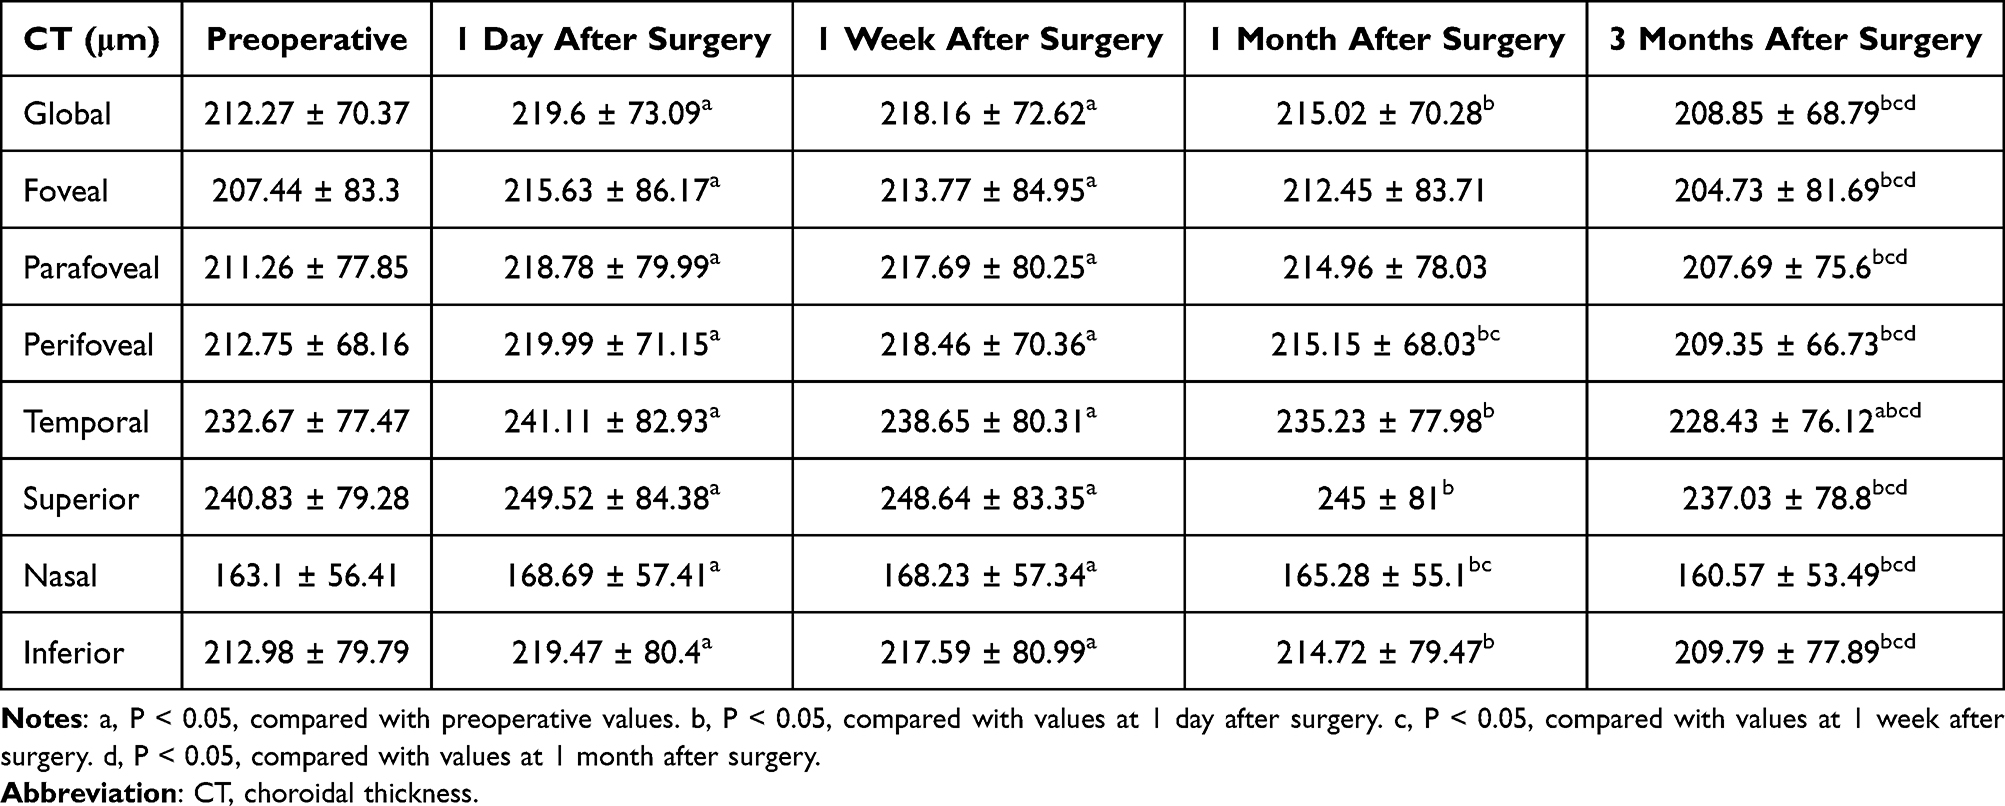 |
Table 8 Comparison of CT Before and After Surgery |
The CVI remained unchanged during the early postoperative period (1 day to 1 month) in the foveal, parafoveal, and perifoveal areas (P > 0.05). At the 3-month mark, however, the CVI in the foveal region declined markedly compared to baseline (P < 0.05) (Table 9). Exact P-values for all regions and time points are provided in Supplementary Tables 8.1 and 8.2.
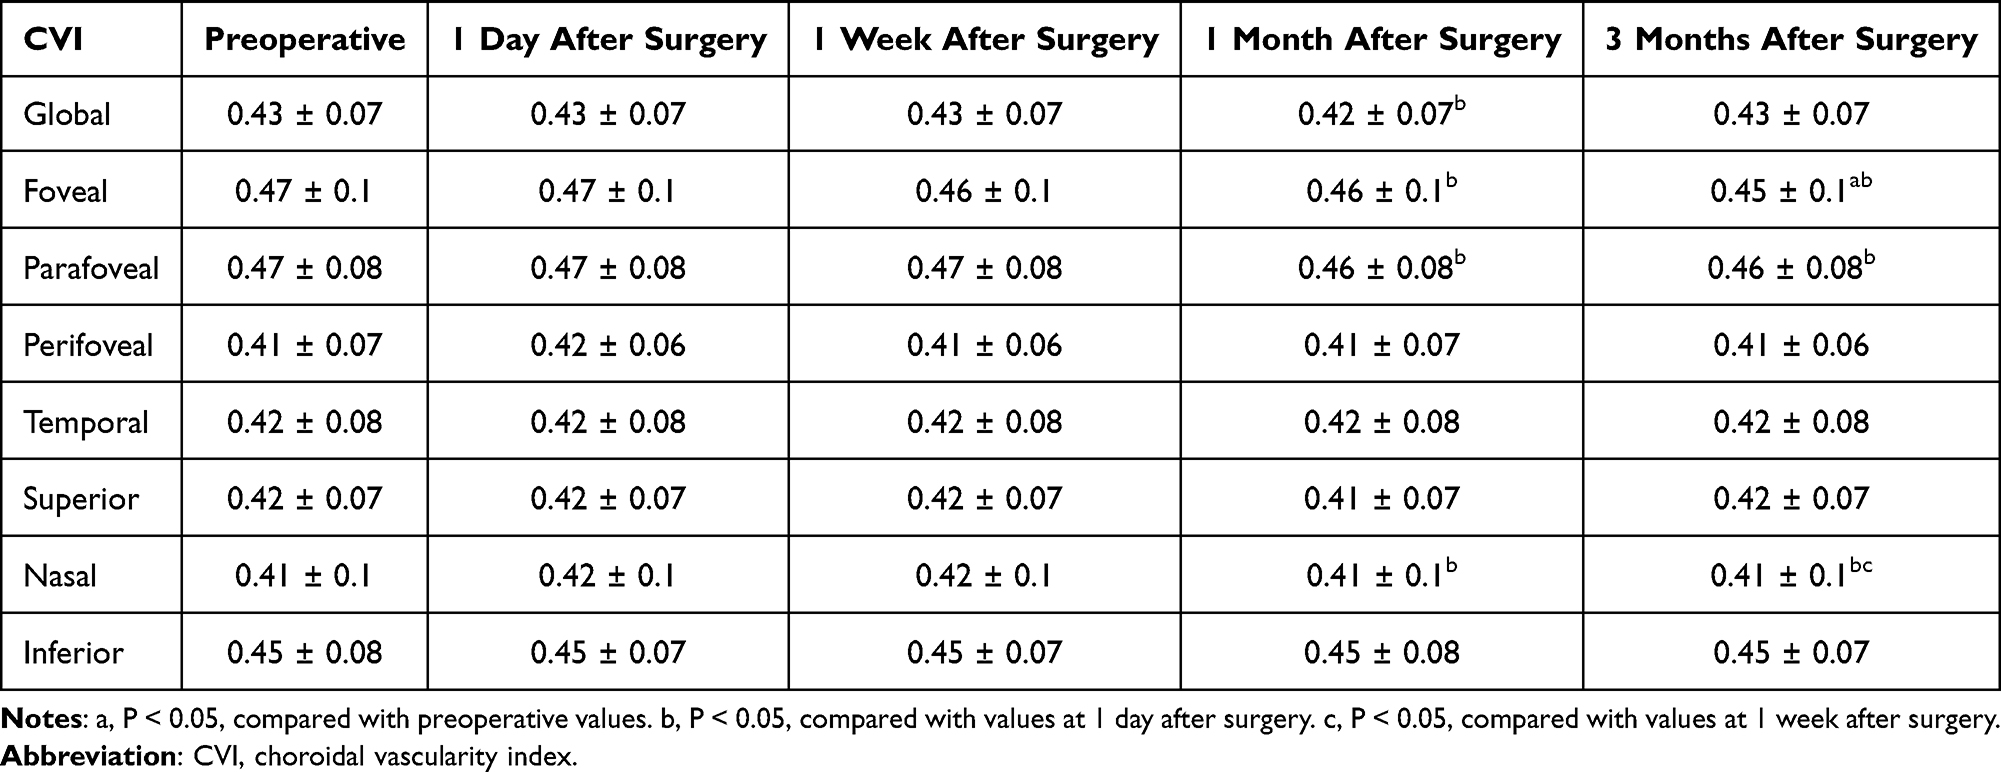 |
Table 9 Comparison of CVI Before and After Surgery |
Changes in Peripapillary Vascular Density
From baseline to 3 months, global peripapillary OVD decreased (Δ = −4.21, 95% CI −5.30 to −3.11; P < 0.0001). Sectoral OVD reductions were observed in all quadrants except the superonasal sector at 3 months (P < 0.05) (Table 10 and Figure 6). Several temporal sectors including the superotemporal, temporal-superior, temporal-inferior, and inferotemporal regions showed significant reductions as early as 1 month post-surgery (P < 0.05), whereas no other time points demonstrated significant changes (P > 0.05). Exact P-values for all regions and time points are provided in Supplementary Tables 9.1 and 9.2.
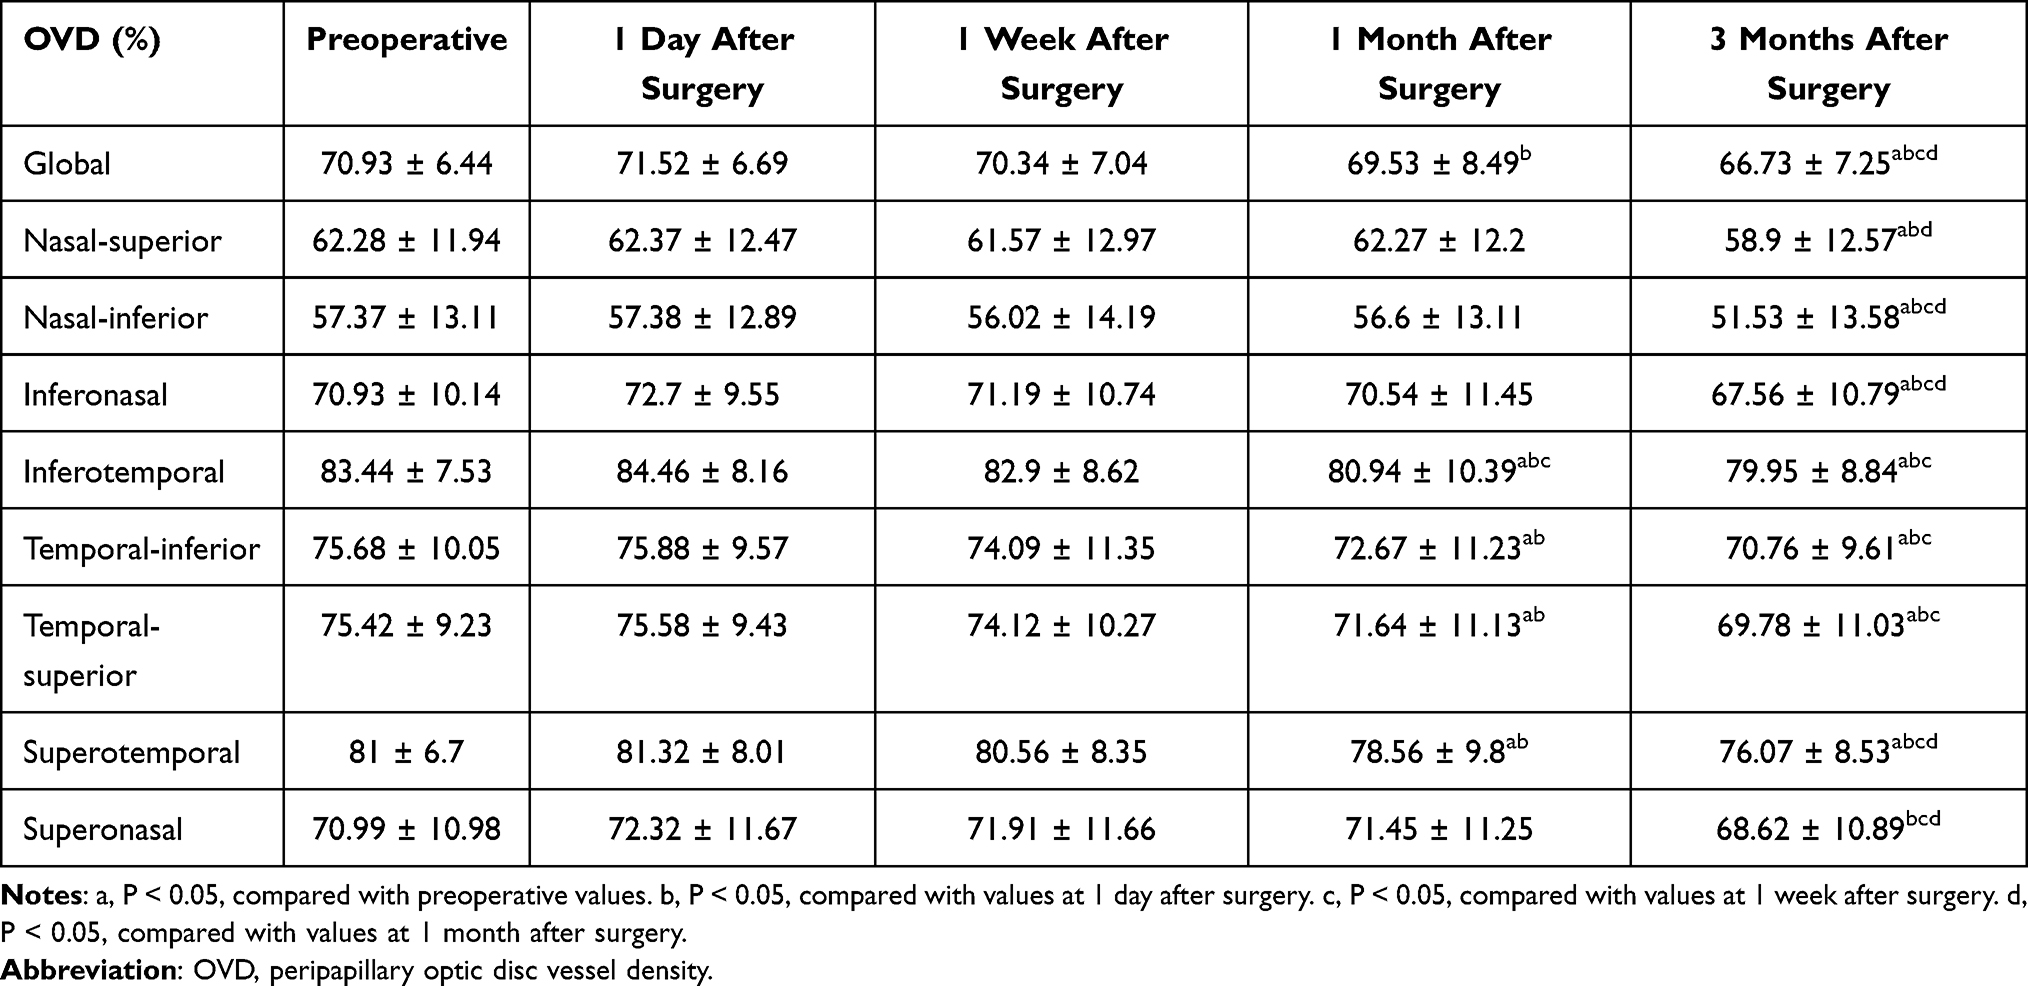 |
Table 10 Comparison of OVD Before and After Surgery |
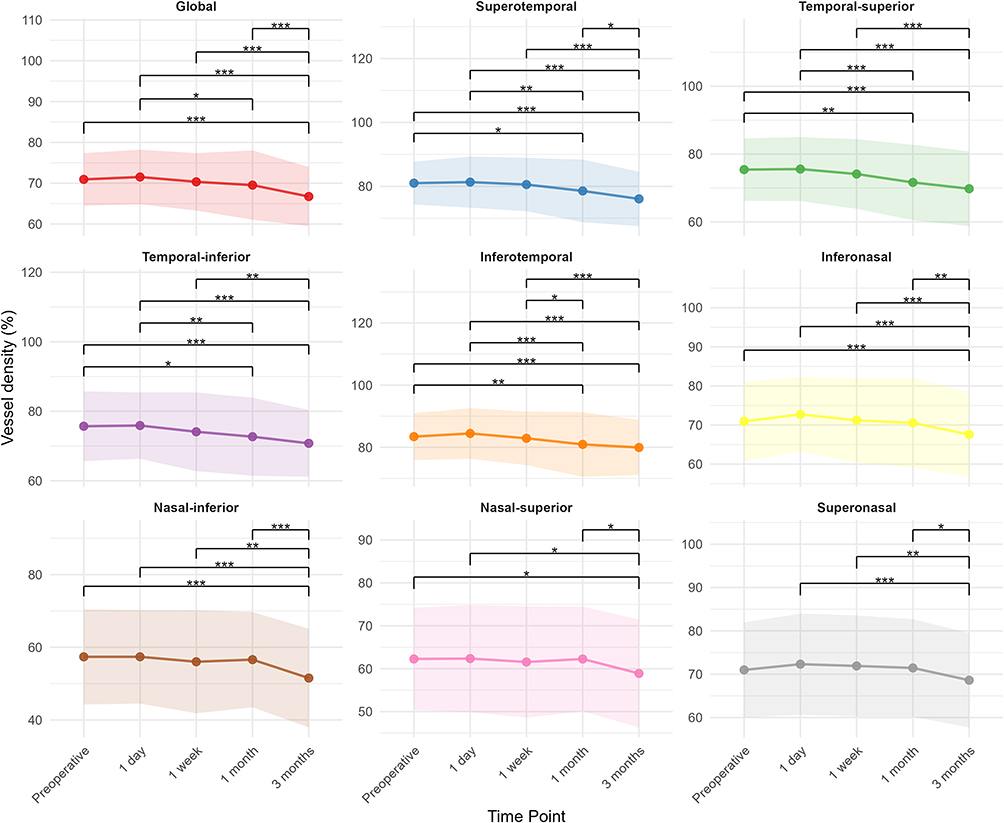 |
Figure 6 Postoperative changes in peripapillary vessel density (OVD) assessed globally, as well as across defined peripapillary sectors. *P < 0.05, **P < 0.01, ***P < 0.001. |
From baseline to 3 months, global peripapillary OSmVD decreased (Δ = −2.11, 95% CI −2.85 to −1.36; P < 0.0001). OSmVD declined significantly at 3 months in nasal sectors, including the superonasal, nasal-superior, nasal-inferior, and inferonasal areas (P < 0.05) (Table 11). In contrast, temporal sectors exhibited a distinct temporal pattern: OSmVD in the superotemporal and inferotemporal regions significantly declined on postoperative day 1 (P < 0.05) but subsequently increased over time, returning to baseline levels by 1 week and persisting through 3 months (P > 0.05). Although similar trends were observed in the temporal-superior and temporal-inferior sectors, these changes were non-significant at all time points (P > 0.05). Exact P-values for all regions and time points are provided in Supplementary Tables 10.1 and 10.2.
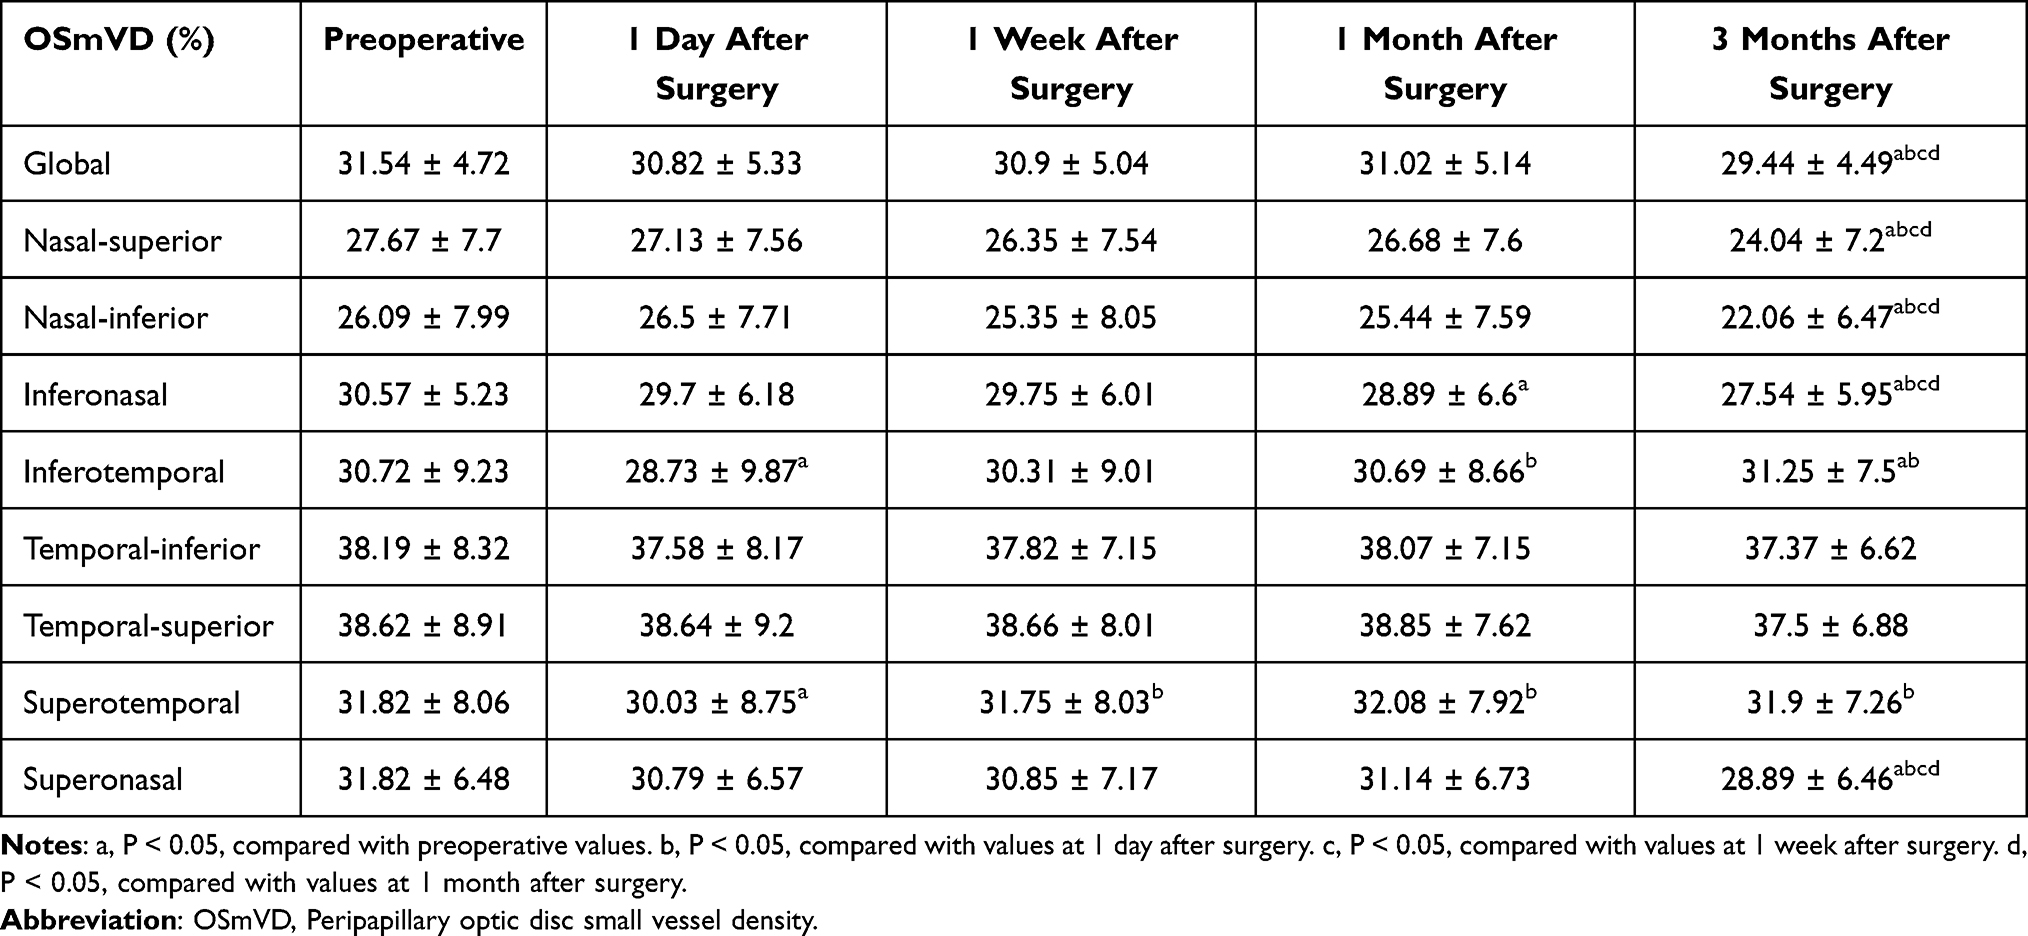 |
Table 11 Comparison of OSmVD Before and After Surgery |
Correlation Analyses
Using linear mixed-effects modeling, we assessed the relationship between AL and postoperative VD at 3 months. Models were adjusted for baseline VD and accounted for random effects from subject ID and laterality. Longer AL was significantly associated with lower vessel densities in multiple regions: the inferior quadrant of the MVD (estimate = −2.09, P = 0.0054), the perifoveal MSmVD (estimate = −1.08, P = 0.021), the inferior quadrant of the DVD (estimate = −1.26, P = 0.0035), and in the OVD inferotemporal (estimate = −1.13, P = 0.014) and superonasal sectors (estimate = −1.29, P = 0.047). Significant negative associations were also observed in the global OSmVD (estimate = −0.611, P = 0.015), and in its nasal-superior (estimate = −0.765, P = 0.039), inferonasal (estimate = −0.707, P = 0.037), superotemporal (estimate = −1.246, P = 0.0008), and superonasal (estimate = −0.908, P = 0.020) sectors. Marginally significant trends were found in the perifoveal MVD (estimate = −1.09, P = 0.052), the inferior SVD (estimate = −0.80, P = 0.066), and the OSmVD inferotemporal sector (estimate = −0.67, P = 0.064).
Using linear mixed-effects modeling, we assessed the relationship between postoperative vault at 1 week and postoperative VD at 3 months. Models were adjusted for baseline VD and accounted for random effects from subject identification number (ID) and laterality. Vault was entered as a continuous variable and rescaled per 100 μm to facilitate interpretation of regression coefficients. Postoperative vault at 1 week was not associated with 3-month posterior-segment vascular or choroidal metrics in baseline-adjusted linear mixed-effects models (all P > 0.05). For global macular metrics, total MVD was not associated with vault (estimate = −0.226; P = 0.619), and no associations were observed for SVD (global macular area: estimate = 0.0008; 95% CI, −0.444 to 0.446; P = 0.997) or DVD (global macular area: estimate = −0.152; 95% CI, −0.757 to 0.454; P = 0.625). Similarly, MSmVD did not demonstrate a vault-dependent pattern; the lowest P value was observed for foveal MSmVD (estimate = −0.252; P = 0.0796). Mean CVI values were also not associated with vault across rings (foveal area: estimate = 0.0010, P = 0.691; parafoveal area: estimate = −0.0005, P = 0.798; perifoveal area: estimate = −0.0003, P = 0.818). In the global peripapillary area, neither OVD (estimate = 0.463; P = 0.127) nor OSmVD (estimate = 0.0418; P = 0.826) demonstrated a vault-dependent pattern.
Among the 61 participants enrolled, 32 participants (64 eyes) had AL measurements available at the 2-year follow-up. Mean AL changed from 27.50 ± 1.70 mm at baseline to 27.60 ± 1.76 mm at 2 years, and this difference was not statistically significant (P > 0.05). In an exploratory sub-analysis restricted to eyes with available 2-year data, linear mixed-effects models were fitted with AL at 2 years (mm) as the outcome and 3-month postoperative changes in OCT/OCTA metrics as predictors, adjusting for baseline AL and accounting for inter-eye correlation. Foveal CT change was expressed in μm; when scaled to a clinically interpretable unit, each 10-μm greater reduction in foveal CT at 3 months was associated with an approximately 0.03-mm longer AL at 2 years (estimate = −0.003 mm/μm; P = 0.008). Given the non-significant mean AL change and incomplete long-term follow-up, this finding should be interpreted as exploratory and hypothesis-generating.
Discussion
The increasing global frequency of myopia, especially high myopia, necessitates the development of effective, safe, and minimally invasive corrective strategies. For individuals with moderate-to-severe ametropia who are unsuitable candidates for corneal refractive procedures such as photorefractive keratectomy (PRK), laser-assisted in situ keratomileusis (LASIK), or SMILE, implantation of an ICL offers a viable and tissue-preserving alternative.23,24 The V4C model of ICL incorporates a central port, which facilitates physiological aqueous humor flow and helps maintain anterior chamber homeostasis. This design innovation eliminates the need for preoperative laser peripheral iridotomy or intraoperative iridectomy to prevent pupillary block and reduces the risk of anterior subcapsular cataract formation associated with impaired aqueous dynamics.25,26 Notably, ICL implantation not only provides excellent refractive outcomes comparable to or even exceeding those of corneal refractive surgeries but also induces fewer higher-order aberrations.27–29 Furthermore, because the lens is removable, the procedure retains a degree of reversibility.
Our study reinforces the safety and effectiveness of ICL implantation in the management of myopia. Patients demonstrated significant improvement in UDVA, with both refractive and visual outcomes remaining stable throughout the 3-month follow-up. CDVA also improved at all postoperative visits compared with baseline, suggesting that the procedure did not compromise best-corrected visual performance. IOP remained unchanged postoperatively, and no complications such as cataract development, pigment dispersion syndrome, pupillary block, or lens rotation were recorded during the study period.
OCTA provides a valuable, non-invasive method to quantify retinal and choroidal microvasculature, with VD serving as a key metric. VD has been widely used to characterize hemodynamic changes in various ocular pathologies,30–32 and its alterations following ICL surgery have been increasingly documented.16–20,33 Importantly, SmVD, which excludes larger-caliber vessels, enhances sensitivity for detecting early perfusion changes in the capillary network. In contrast, total VD measurements that include both large and small vessels may mask subtle microvascular alterations. Despite the clinical relevance, relatively few studies have evaluated SmVD in the context of ICL implantation. To our knowledge, our study comprises the largest sample to date assessing changes in both total and small vessel densities in the macular and peripapillary regions post-ICL implantation.
At 3 months postoperatively, both MVD and MSmVD showed significant reductions compared to baseline. SVD also decreased across nearly all macular subregions, with the exception of the fovea. In contrast, DVD remained largely unchanged, except for a significant decrease within the foveal region. High myopia is itself linked with low-grade inflammation and oxidative stress dysregulation,34 and intraocular procedures such as ICL implantation, much like cataract surgery, may provoke additional trauma. Mechanical manipulation, exposure to irrigating fluids, vitreoretinal traction, and transient ischemia may induce metabolic stress and inflammatory signaling in the retina.35 Prior studies have shown elevated intraocular prostaglandin levels following cataract extraction,36 along with increased expression of inflammatory cytokines such as chemokine ligand 2 (CCL2) and interleukin-1β (IL-1β) in the neurosensory retina of animal models.37 This proinflammatory environment can trigger glial cell activation, ultimately compromising vascular endothelium integrity, causing vasodilation, and disrupting the blood-retinal barrier.38 Such inflammatory sequelae may contribute to the observed long-term decline in macular vascular density.
The present findings are consistent with those of Xu et al,33 who observed significant reductions in both superficial and deep macular vessel densities at 3 months following ICL implantation. However, other studies have reported divergent outcomes. For instance, Zhu et al16 and Tang et al17 found no marked postoperative changes in macular VD, while Peng et al18 noted an initial decline that resolved by the 3-month mark. Zhao et al19 further observed that superficial VD initially decreased but returned to baseline, while deep VD remained stable throughout. Notably, our study and Xu et al33 ‘s included participants with longer AL and more severe refractive errors: mean AL and SE in our study were 27.29 ± 1.59 mm and −10.11 ± 3.45 D, respectively; Xu et al33 reported 27.24 ± 1.23 mm and −9.73 D. These values are higher than those reported by Zhu et al16 (26.61 ± 1.15 mm, −7.52 ± 2.2 D), Tang et al17 (26.63 ± 1.06 mm, −8.50 ± 2.68 D), Peng et al18 (26.98 ± 1.19 mm, −8.64 ± 1.71 D), and Zhao et al19 (26.97 ± 1.54 mm, −9.02 ± 2.70 D). Thus, inter-study discrepancies may stem from differences in baseline ocular characteristics. Further supporting this interpretation, a previous OCTA-based study of cataract surgery showed that patients with high myopia are more prone to postoperative reductions in retinal VD compared to those with lower degrees of myopia or emmetropia.39 Our correlation analysis revealed a significant inverse relationship between AL and postoperative VD in various macular regions, even after adjusting for baseline VD. These results are consistent with prior research demonstrating that longer AL is associated with decreased retinal vascular density.40–42 Given the high metabolic demands of the retina, structural changes accompanying high myopia may render these eyes more vulnerable to perfusion fluctuations and inflammatory responses,43 thereby predisposing them to postoperative vascular alterations. Moreover, while many previous studies have reported nonsignificant changes in VD, the consistent trend toward postoperative reduction suggests that our statistically significant findings may be attributable, at least in part, to our larger sample size.
Our data also revealed differing responses between superficial and deep vascular layers. SVD decreased significantly after surgery, whereas DVD remained stable, similar to the pattern observed by Zhao et al.19 This differential behavior has also been reported by Pilotto et al,44 who studied early and intermediate-term OCTA changes following uneventful cataract surgery. They proposed that inflammation tends to initiate in the inner retinal layers before propagating to the outer layers, reflecting the temporal dynamics of microglial activation and Müller cell elongation. These glial responses, which have been extensively documented in histopathologic studies of inflammatory retinal disorders such as diabetic retinopathy,45,46 may help explain the observed selective involvement of superficial vasculature. Importantly, the relative preservation of DVD in our study suggests that postoperative inflammation after ICL implantation is generally localized and mild. Interestingly, our results showed a contrasting pattern in the foveal subregion, where DVD declined while SVD remained unchanged. This may be explained by the unique anatomical features of the fovea, where the superficial capillary plexus is sparse or absent, and deep layers predominantly contribute to inner retinal perfusion.
In our study, we observed a significant reduction in the CVI within the foveal region at 3 months postoperatively, whereas the parafoveal and perifoveal areas exhibited no notable changes from baseline. We propose that this focal decline in foveal CVI may arise from mechanisms similar to those underlying the observed decreases in retinal VD, such as the intraocular inflammation that impairs choroidal vascular integrity. The choroid supplies the majority of oxygen to the retina (~90%) through high-volume blood flow tailored to meet the intense metabolic requirements of photoreceptors.47 Since the fovea represents the retinal region with the greatest oxygen demand, its underlying choroidal vasculature may be especially susceptible to stress-related compromise, potentially accounting for the localized CVI decline.
We also found that OVD declined significantly in most regions by the 3-month follow-up, with reductions in the temporal sectors already evident at 1 month postoperatively. These results align partly with those of Xu et al,33 who observed a significant drop in VD in the temporal peripapillary quadrant at 1 month after ICL surgery, though their results showed no significant changes by 3 months. In their study, other quadrants exhibited a trend toward reduced vascular density postoperatively, but these changes were not statistically significant. The discrepancy between their findings and ours may stem from differences in sample size; our analysis included 122 eyes, nearly double the 67 eyes in their cohort, potentially affording greater statistical power. Furthermore, the finer granularity of our eight-sector segmentation may have enhanced sensitivity in detecting localized microvascular alterations compared to the broader four-quadrant division used in their study.
Although overall VD in the temporal sectors declined, SmVD remained relatively stable in these sectors. This dissociation suggests that changes in larger-caliber vessels may be the primary contributors to the observed OVD reductions in the temporal sectors, which anatomically contain a higher proportion of such vessels. Retinal circulation is regulated through autoregulatory mechanisms involving arteriolar vasodilation and constriction in response to fluctuations in perfusion pressure, metabolic demand, and neural input.48–50 The early onset of VD reduction in the temporal sectors, detectable as soon as one month post-surgery, supports the hypothesis that autoregulatory responses, rather than inflammatory processes alone, may drive these early changes. In eyes with high myopia, combined with structural and metabolic shifts induced by surgery, autoregulatory vasoconstriction may contribute to a decrease in peripapillary perfusion.51,52
Moreover, we observed that the temporal OSmVD remained more stable over time than that in the nasal peripapillary or macular regions. This relative stability may reflect the region’s more robust macrovascular framework, characterized by the proximity and abundance of large-caliber vessels branching directly from primary arterial trunks. The structural support provided by these larger vessels may help preserve microvascular perfusion in the face of postoperative inflammatory stimuli, delaying or attenuating the impact on smaller temporal vessels.
We further explored whether vault, a key anterior-segment parameter, might act as an influential or intermediary factor in postoperative microvascular changes. Using baseline-adjusted linear mixed-effects models, we found no evidence of a vault-dependent association between postoperative vault at 1 week and posterior-segment vascular or choroidal metrics at 3 months. The absence of a vault-related effect on 3-month macular and peripapillary VD is consistent with the design rationale of the hole-ICL (V4c), in which the central port is intended to facilitate aqueous humor circulation and thereby minimize anterior–posterior segment perturbations attributable to mechanical vaulting.25,26 From this perspective, the postoperative microvascular signals detected by OCTA in our cohort are more likely to reflect a vault-independent postoperative physiological response rather than a mechanically mediated, vault-driven phenomenon.
RT increased significantly following surgery, consistent with previous reports.16,33,53 This thickening is likely due to retinal edema, although the precise mechanism remains uncertain. Several hypotheses have been proposed, including mechanical vitreous traction and the upregulation of inflammatory mediators postoperatively.36,54 These processes can disrupt the blood-retinal barrier, increase vascular permeability, and lead to fluid accumulation within the retinal layers. Conversely, CT exhibited a transient postoperative increase, returning to baseline without evidence of sustained change. Similar transient choroidal thickening has been reported following phacoemulsification and is generally attributed to inflammation triggered by surgical trauma.37,55 Thus, the reversible nature of CT changes in our study supports the notion that the inflammatory response after ICL implantation is relatively mild and localized. Our baseline AL–adjusted correlation analysis suggested that greater postoperative reductions in foveal CT at 3 months were associated with longer AL measured at the 2-year follow-up in the subset of eyes with available long-term data. Given the limited number of participants contributing to the 2-year assessment and the non-significant mean AL change, this observation should be interpreted as exploratory and hypothesis-generating rather than definitive evidence of a longitudinal pathway. Nevertheless, this signal is broadly consistent with prior work in which choroidal thinning has been reported in relation to myopic progression.56–58 A plausible biological explanation is that a thicker choroid may act as a diffusion barrier modulating the exchange of signaling molecules and growth factors between the retina and sclera.59 From this perspective, postoperative choroidal thinning in some eyes could potentially reduce such buffering capacity; however, whether this mechanism operates in the post-ICL setting and whether it translates into clinically meaningful axial elongation require confirmation in larger cohorts with more complete long-term follow-up.
Despite the structural and vascular changes observed, postoperative visual function remained stable and favorable throughout the follow-up period, suggesting that these short-term alterations may not be clinically meaningful within the early postoperative window. However, given the expanding global uptake of posterior chamber phakic IOLs, the clinical relevance of early postoperative OCT/OCTA signals should be considered alongside long-term surveillance and the cumulative burden of established complications. Recent simulation-based projections suggest that population-level disability burden from post-phakic IOL complications—including cataract, secondary glaucoma, and corneal endothelial decompensation—may rise substantially toward 2050, particularly under poor follow-up adherence scenarios.60 Accordingly, these data underscore the importance of comprehensive postoperative monitoring that incorporates anterior-segment determinants (eg, vault and angle-related metrics) for risk stratification of long-term complications. In parallel, further investigation of whether postoperative microvascular changes are predictive of future retinal dysfunction is warranted. Longitudinal studies incorporating functional assessments, such as electrophysiological testing or microperimetry, will be critical for evaluating long-term implications. Additionally, future work may benefit from integrating intraocular fluid analysis (eg, aqueous humor sampling) with advanced imaging and multi-omics profiling to elucidate molecular pathways underlying perfusion changes and to identify early biomarkers of subclinical retinal impairment, thereby enabling more tailored perioperative strategies and risk stratification for patients undergoing ICL implantation.
Several limitations of this study should be acknowledged. First, the study population primarily consisted of young adults with a relatively narrow age range, and we did not include an age- and AL–matched non-surgical high-myopia control group. This limits generalizability to older highly myopic individuals, who may have different vascular resilience and age-related retinal/choroidal remodeling that could modify postoperative microvascular responses, and reduces our ability to fully disentangle surgery-related changes from the natural course of high myopia. Second, the 3-month follow-up may be insufficient to capture the full spectrum of structural and vascular adaptations after ICL implantation, and longer-term follow-up is warranted. Third, although image quality was rigorously controlled through standardized acquisition and SSI-based screening, OCTA measurements remain susceptible to residual motion artifacts, projection effects, segmentation-related errors, and the influence of device-specific proprietary algorithms—particularly in highly myopic eyes—which may affect quantitative VD estimates and limit cross-platform comparability of absolute values. Fourth, the 2-year axial-length sub-analysis (examining the association between 3-month postoperative OCT/OCTA changes and AL at 2 years) was exploratory and restricted to a subset of participants, introducing potential selection bias due to incomplete long-term follow-up. Finally, more complete longitudinal measurements of vault and other anterior-segment dynamics would further strengthen inference regarding potential time-varying biomechanical effects.
Conclusion
Our findings confirm that ICL implantation is a generally safe and effective refractive solution for patients with high myopia. However, the procedure is associated with notable changes in the microvascular architecture of the retina, peripapillary region, and choroid, suggesting alterations in ocular hemodynamics. Notably, in patients with available 2-year follow-up, early postoperative choroidal changes showed an association with subsequent axial length outcomes, supporting the potential value of choroidal metrics as a longitudinal indicator after ICL implantation. While these changes did not translate into measurable visual impairment over the short term, they warrant careful monitoring. Clinically, beyond routine surveillance for established postoperative complications, attention should also be paid to fundus status and potential posterior-segment complications during follow-up. Routine OCTA is not mandatory in asymptomatic eyes with stable vision, but may be considered when available to longitudinally monitor postoperative microvascular signals. Future large-scale, long-duration studies are essential to elucidate the mechanisms driving these microvascular responses and to assess their potential clinical relevance over time.
Abbreviations
SMILE, small incision lenticule extraction; ICL, Implantable collamer lens; OCT, Optical coherence tomography; OCTA, Optical coherence tomography angiography; SE, Spherical equivalent; ECD, Corneal endothelial cell density; ACD, Central anterior chamber depth; AL, Axial length; IOP, Intraocular pressure; CDVA, Corrected distance visual acuity; ONH, Optic nerve head; SSI, Signal Strength Index; RT, Retinal thickness; ILM, The inner limiting membrane; RPE, Retinal pigment epithelium; CT, Choroidal thickness; CVI, Choroidal vascularity index; VD, Vessel density; SVD, Superficial vessel density; DVD, Deep vessel density; MVD, Macula vessel density; OVD, Vessel density surrounding the optic disc; MSmVD, Macular SmVD; OSmVD, Small vessel density surrounding the optic disc; SD, Standard deviation; PRK, Photorefractive keratectomy; LASIK, Laser-assisted in situ keratomileusis.
Data Sharing Statement
The data supporting the findings of this study are available from either corresponding author upon reasonable request.
Ethics Approval and Informed Consent
All procedures involving human participants were conducted in accordance with the ethical standards of the institutional and national research committees, and with the 1964 Helsinki Declaration and its later amendments or comparable ethical standards. The study was approved by the Institutional Ethics Committee of PUMCH (Approval No. I-25PJ0034).
Consent for Publication
Written informed consent was obtained from all patients for participation in this study and for publication of the associated data and images. A copy of the written consent is available for review by the editors of this journal.
Author Contributions
All authors made a significant contribution to the work reported, whether that is in the conception, study design, execution, acquisition of data, analysis and interpretation, or in all these areas; took part in drafting, revising or critically reviewing the article; gave final approval of the version to be published; have agreed on the journal to which the article has been submitted; and agree to be accountable for all aspects of the work.
Funding
This work was supported by the CAMS Innovation Fund for Medical Sciences (CIFMS) (Grant No. 2023-12M-C&T-B-004, Beijing, China), the Peking Union Medical College Hospital Deposit Integration Commission Funds (Grant No. ZC201904168, Beijing, China) and the Peking Union Medical College Hospital Talent Cultivation (Category C) No. UBJ 10546.
Disclosure
The authors declare that they have no competing interests in this work.
References
1. Holden BA, Fricke TR, Wilson DA, et al. Global prevalence of myopia and high myopia and temporal trends from 2000 through 2050. Ophthalmology. 2016;123(5):1036–21. doi:10.1016/j.ophtha.2016.01.006
2. Binder PS. Risk factors for ectasia after LASIK. J Cataract Refract Surg. 2008;34(12):2010–2011. doi:10.1016/j.jcrs.2008.08.035
3. Kamiya K, Shimizu K, Igarashi A, et al. Posterior chamber phakic intraocular lens implantation: comparative, multicentre study in 351 eyes with low-to-moderate or high myopia. Br J Ophthalmol. 2018;102(2):177–181. doi:10.1136/bjophthalmol-2017-310164
4. Pesando PM, Ghiringhello MP, Di Meglio G, Fanton G. Posterior chamber phakic intraocular lens (ICL) for hyperopia: ten-year follow-up. J Cataract Refract Surg. 2007;33(9):1579–1584.
5. Sanders DR, Doney K, Poco M. United States Food and Drug Administration clinical trial of the Implantable Collamer Lens (ICL) for moderate to high myopia: three-year follow-up. Ophthalmology. 2004;111(9):1683–1692.
6. Al-Sheikh M, Phasukkijwatana N, Dolz-Marco R, et al. Quantitative OCT angiography of the retinal microvasculature and the choriocapillaris in myopic eyes. Invest Ophthalmol Visual Sci. 2017;58(4):2063–2069. doi:10.1167/iovs.16-21289
7. La Spina C, Corvi F, Bandello F, Querques G. Static characteristics and dynamic functionality of retinal vessels in longer eyes with or without pathologic myopia. Graefe’s Arch Clin Exp Ophthalmol. 2016;254(5):827–834. doi:10.1007/s00417-015-3122-z
8. Man REK, Lamoureux EL, Taouk Y, et al. Axial length, retinal function, and oxygen consumption: a potential mechanism for a lower risk of diabetic retinopathy in longer eyes. Invest Ophthalmol Visual Sci. 2013;54(12):7691–7698. doi:10.1167/iovs.13-12412
9. Liu M, Wang P, Hu X, Zhu C, Yuan Y, Ke B. Myopia-related stepwise and quadrant retinal microvascular alteration and its correlation with axial length. Eye. 2021;35(8):2196–2205. doi:10.1038/s41433-020-01225-y
10. Jiang Y, Lou S, Li Y, Chen Y, Lu TC. High myopia and macular vascular density: an optical coherence tomography angiography study. BMC Ophthalmol. 2021;21(1):407. doi:10.1186/s12886-021-02156-2
11. Milani P, Montesano G, Rossetti L, Bergamini F, Pece A. Vessel density, retinal thickness, and choriocapillaris vascular flow in myopic eyes on OCT angiography. Graefe’s Arch Clin Exp Ophthalmol. 2018;256(8):1419–1427. doi:10.1007/s00417-018-4012-y
12. Liu J, Liu Q, Yu H, et al. Microvascular changes in macular area after phacoemulsification and its influencing factors assessed by optical coherence tomography angiography. Therap Clin Risk Manage. 2021;17:405–414. doi:10.2147/TCRM.S309679
13. Polizzi S, Barca F, Caporossi T, Virgili G, Rizzo S. Branch retinal vein occlusion following cataract surgery. Clin Exp Optom. 2018;101(1):135–136. doi:10.1111/cxo.12525
14. Ece BŞ D, Sarıcaoğlu MS. Examination of retinal vascular density changes via optical coherence tomography angiography in patients with glaucoma. Intl Ophthalmol. 2021;41(2):687–698. doi:10.1007/s10792-020-01626-8
15. Macedo S, Pohlmann D, Lenglinger M, Pleyer U, Joussen AM, Winterhalter S. Optical coherence tomography angiography (OCTA) findings in serpiginous choroiditis. BMC Ophthalmol. 2020;20(1):258. doi:10.1186/s12886-020-01527-5
16. Zhu QJ, Wang MY, Yu P, et al. Analysis of macular microvasculature and thickness after ICL implantation in patients with myopia using optical coherence tomography. Int J Ophthalmol. 2020;13(12):1948–1954. doi:10.18240/ijo.2020.12.16
17. Tang C, Zhang Y, Sun T, et al. Prospective clinical study of retinal microvascular alteration after ICL implantation. Front Cell Develop Biol. 2023;11:1115822. doi:10.3389/fcell.2023.1115822
18. Peng Y, Xiong L, Qu H, Liu Y, Wang Z. Analysis of the correlations between changes in posterior segment and anterior chamber segment after implantable collamer lens implantation in highly myopic patients. BMC Ophthalmol. 2025;25(1):33. doi:10.1186/s12886-025-03863-w
19. Zhao B, Zhang H, Fang X, et al. Evaluation of retinal and choroidal microvascular alteration after ICL V4c implantation based on OCTA. BMC Ophthalmol. 2024;24(1):487. doi:10.1186/s12886-024-03752-8
20. Hu X, Wang P, Zhu C, Yuan Y, Liu M, Ke B. Transient reduction in the retinal microvascular network following implantation surgery of implantable collamer lens: an OCT angiography study. Mol Vis. 2021;27:466–479.
21. Yang Y, Wang J, Jiang H, et al. Retinal microvasculature alteration in high myopia. Invest Ophthalmol Visual Sci. 2016;57(14):6020–6030. doi:10.1167/iovs.16-19542
22. Rao HL, Pradhan ZS, Weinreb RN, et al. Regional comparisons of optical coherence tomography angiography vessel density in primary open-angle glaucoma. Am J Ophthalmol. 2016;171:75–83. doi:10.1016/j.ajo.2016.08.030
23. Chen D, Zhao X, Chou Y, Luo Y. Comparison of visual outcomes and optical quality of femtosecond laser-assisted SMILE and Visian Implantable Collamer Lens (ICL V4c) implantation for moderate to high myopia: a meta-analysis. J Refractive Surg. 2022;38(6):332–338. doi:10.3928/1081597X-20220411-01
24. Igarashi A, Shimizu K, Kamiya K. Eight-year follow-up of posterior chamber phakic intraocular lens implantation for moderate to high myopia. Am J Ophthalmol. 2014;157(3). doi:10.1016/j.ajo.2013.11.006
25. Wannapanich T, Kasetsuwan N, Reinprayoon U. Intraocular implantable collamer lens with a central hole implantation: safety, efficacy, and patient outcomes. Clin Ophthalmol. 2023;17:969–980. doi:10.2147/opth.S379856
26. Packer M. The implantable collamer lens with a central port: review of the literature. Clin Ophthalmol. 2018;12:2427–2438. doi:10.2147/opth.S188785
27. Wei R, Li M, Zhang H, et al. Comparison of objective and subjective visual quality early after implantable collamer lens V4c (ICL V4c) and small incision lenticule extraction (SMILE) for high myopia correction. Acta ophthalmologica. 2020;98(8):e943–e950. doi:10.1111/aos.14459
28. Goes S, Delbeke H. Posterior chamber toric implantable collamer lenses vs LASIK for myopia and astigmatism: systematic review. J Cataract Refract Surg. 2022;48(10):1204–1210. doi:10.1097/j.jcrs.0000000000001007
29. Zhao W, Zhao J, Han T, Wang J, Zhang Z, Zhou X. A comprehensive investigation of contrast sensitivity and disk halo in high myopia treated with SMILE and EVO implantable collamer lens implantation. Transl Vis Sci Technol. 2022;11(4):23. doi:10.1167/tvst.11.4.23
30. Hikichi T, Agarie M. Reduced vessel density of the choriocapillaris during anti-vascular endothelial growth factor therapy for neovascular age-related macular degeneration. Invest Ophthalmol Visual Sci. 2019;60(4):1088–1095. doi:10.1167/iovs.18-24522
31. Uji A, Sadda SR, Muraoka Y, et al. Effect of image averaging on optical coherence tomography angiography data in eyes with branch retinal vein occlusion. Graefe’s Arch Clin Exp Ophthalmol. 2020;258(8):1639–1648. doi:10.1007/s00417-020-04713-9
32. Ashraf M, Sampani K, Rageh A, Silva PS, Aiello LP, Sun JK. Interaction between the distribution of diabetic retinopathy lesions and the association of optical coherence tomography angiography scans with diabetic retinopathy severity. JAMA Ophthalmol. 2020;138(12):
33. Xu Y, Yang W, Long T, et al. Analysis of microcirculation changes in the macular area and para‑optic disk region after implantable collamer lens implantation in patients with high myopia. Front Neurosci. 2022;16:867463. doi:10.3389/fnins.2022.867463
34. Yu Q, Wang C, Liu Z, et al. Association between inflammatory cytokines and oxidative stress levels in aqueous humor with axial length in human myopia. Exp Eye Res. 2023;237:109670. doi:10.1016/j.exer.2023.109670
35. Russo A, Costagliola C, Delcassi L, et al. Topical nonsteroidal anti-inflammatory drugs for macular edema. Mediators Inflamm. 2013;2013:476525. doi:10.1155/2013/476525
36. Miyake K, Ibaraki N. Prostaglandins and cystoid macular edema. Surv Ophthalmol. 2002;47(Suppl 1):
37. Xu H, Chen M, Forrester JV, Lois N. Cataract surgery induces retinal pro-inflammatory gene expression and protein secretion. Invest Ophthalmol Visual Sci. 2011;52(1):249–255. doi:10.1167/iovs.10-6001
38. Chen Y, Xia Q, Zeng Y, Zhang Y, Zhang M. Regulations of retinal inflammation: focusing on Müller glia. Front Cell Dev Biol. 2022;10:898652. doi:10.3389/fcell.2022.898652
39. Li T, Guadie A, Feng L, Fan J, Jiang Z, Liu F. Influence of cataract surgery on macular vascular density in patients with myopia using optical coherence tomography angiography. Exp Ther Med. 2020;20(6):258. doi:10.3892/etm.2020.9388
40. Khan MH, Lam AKC, Armitage JA, Hanna L, To CH, Gentle A. Impact of axial eye size on retinal microvasculature density in the macular region. J Clin Med. 2020;9(8):2539. doi:10.3390/jcm9082539
41. Li M, Yang Y, Jiang H, et al. Retinal microvascular network and microcirculation assessments in high myopia. Am J Ophthalmol. 2017;174:56–67. doi:10.1016/j.ajo.2016.10.018
42. Fan H, Chen HY, Ma HJ, et al. Reduced macular vascular density in myopic eyes. Chin Med J. 2017;130(4):
43. Jonas JB, Xu L. Histological changes of high axial myopia. Eye. 2014;28(2):113–117. doi:10.1038/eye.2013.223
44. Pilotto E, Leonardi F, Stefanon G, et al. Early retinal and choroidal OCT and OCT angiography signs of inflammation after uncomplicated cataract surgery. Br J Ophthalmol. 2019;103(7):1001–1007. doi:10.1136/bjophthalmol-2018-312461
45. Wang M, Ma W, Zhao L, Fariss RN, Wong WT. Adaptive Müller cell responses to microglial activation mediate neuroprotection and coordinate inflammation in the retina. J Neuroinflamm. 2011;8:173. doi:10.1186/1742-2094-8-173
46. Vujosevic S, Bini S, Midena G, Berton M, Pilotto E, Midena E. Hyperreflective intraretinal spots in diabetics without and with nonproliferative diabetic retinopathy: an in vivo study using spectral domain OCT. J Diabetes Res. 2013;2013:491835. doi:10.1155/2013/491835
47. Agrawal R, Ding J, Sen P, et al. Exploring choroidal angioarchitecture in health and disease using choroidal vascularity index. Prog Retinal Eye Res. 2020;77:100829. doi:10.1016/j.preteyeres.2020.100829
48. Wu X, Konieczka K, Liu X, et al. Role of ocular blood flow in normal tension glaucoma. Adv Ophthalmol Pract Res. 2022;2(1):100036. doi:10.1016/j.aopr.2022.100036
49. Riva CE, Grunwald JE, Petrig BL. Autoregulation of human retinal blood flow. An investigation with laser Doppler velocimetry. Invest Ophthalmol Visual Sci. 1986;27(12):1706–1712.
50. Arciero J, Harris A, Siesky B, et al. Theoretical analysis of vascular regulatory mechanisms contributing to retinal blood flow autoregulation. Invest Ophthalmol Vis Sci. 2013;54(8):
51. Hilton EJR, Hosking SL, Gherghel D, Embleton S, Cunliffe IA. Beneficial effects of small‑incision cataract surgery in patients demonstrating reduced ocular blood flow characteristics. Eye. 2005;19(6):
52. Dastiridou AI, Ginis H, Tsilimbaris M, et al. Ocular rigidity, ocular pulse amplitude, and pulsatile ocular blood flow: the effect of axial length. Invest Ophthalmol Visual Sci. 2013;54(3):2087–2092. doi:10.1167/iovs.12-11576
53. Cunha-Pachon S, Rodriguez-Una I, Rodriguez-Calvo PP, et al. Effect of phakic collamer intraocular lens with a central hole on structural tests measurements of retinal nerve fiber layer and macula. Eur J Ophthalmol. 2023;33(5):1977–1985. doi:10.1177/11206721231155519
54. Kim SJ, Equi R, Bressler NM. Analysis of macular edema after cataract surgery in patients with diabetes using optical coherence tomography. Ophthalmology. 2007;114(5):881–889.
55. Chen H, Wang B, Pan T, Zhou L, Zeng H. CropNet: real‑time thumbnailing. In:
56. Lee SS, Alonso-Caneiro D, Lingham G, et al. Choroidal thickening during young adulthood and baseline choroidal thickness predicts refractive error change. Invest Ophthalmol Visual Sci. 2022;63(5):34. doi:10.1167/iovs.63.5.34
57. Fontaine M, Gaucher D, Sauer A, Speeg-Schatz C. Choroidal thickness and ametropia in children: a longitudinal study. Eur J Ophthalmol. 2017;27(6):730–734. doi:10.5301/ejo.5000965
58. Nickla DL, Totonelly K. Choroidal thickness predicts ocular growth in normal chicks but not in eyes with experimentally altered growth. Clin Exp Optometry. 2015;98(6):564–570. doi:10.1111/cxo.12317
59. Nickla DL, Wallman J. The multifunctional choroid. Prog Retinal Eye Res. 2010;29(2):144–168. doi:10.1016/j.preteyeres.2009.12.002
60. Kim H, Choi H, Yoo TK. The rising global burden of phakic intraocular lens complications: a simulation-based projection to 2050. Expert Rev Ophthalmol. 2025;20(6):487–496. doi:10.1080/17469899.2025.2594817
 © 2026 The Author(s). This work is published and licensed by Dove Medical Press Limited. The
full terms of this license are available at https://www.dovepress.com/terms
and incorporate the Creative Commons Attribution
- Non Commercial (unported, 4.0) License.
By accessing the work you hereby accept the Terms. Non-commercial uses of the work are permitted
without any further permission from Dove Medical Press Limited, provided the work is properly
attributed. For permission for commercial use of this work, please see paragraphs 4.2 and 5 of our Terms.
© 2026 The Author(s). This work is published and licensed by Dove Medical Press Limited. The
full terms of this license are available at https://www.dovepress.com/terms
and incorporate the Creative Commons Attribution
- Non Commercial (unported, 4.0) License.
By accessing the work you hereby accept the Terms. Non-commercial uses of the work are permitted
without any further permission from Dove Medical Press Limited, provided the work is properly
attributed. For permission for commercial use of this work, please see paragraphs 4.2 and 5 of our Terms.
Recommended articles
The Association of Axial Length with Macular Microvascular Changes in Chinese Diabetic Retinopathy Patients
Zhang Q, Yang L, Xu X, Lan X, Wang Z, Sun Y, Fu S, Xiong Y
International Journal of General Medicine 2022, 15:3895-3902
Published Date: 8 April 2022
Microvascular Changes in Pituitary Adenoma Correlate with Structural Measurements and Visual Field Loss
Chen Y, Li X, Song X, Cong L, Zhang Y
Neuropsychiatric Disease and Treatment 2023, 19:2745-2754
Published Date: 6 December 2023