Back to Journals » Diabetes, Metabolic Syndrome and Obesity » Volume 17
Alpha-Linolenic Acid Ameliorates Cognitive Impairment and Liver Damage Caused by Obesity
Authors Zhang X, Bao J, Zhang Y, Wang X
Received 8 September 2023
Accepted for publication 13 December 2023
Published 28 February 2024 Volume 2024:17 Pages 981—995
DOI https://doi.org/10.2147/DMSO.S434671
Checked for plagiarism Yes
Review by Single anonymous peer review
Peer reviewer comments 2
Editor who approved publication: Dr Konstantinos Tziomalos
Xian Zhang, Jialu Bao, Yan Zhang, Xiaodan Wang
College of Traditional Chinese Veterinary Medicine, Hebei Agricultural University, Baoding, 071001, People’s Republic of China
Correspondence: Xiaodan Wang, College of Traditional Chinese Veterinary Medicine, Agricultural University of Hebei Baoding, People’s Republic of China, 071001, Email [email protected]
Background: Obesity is a growing global problem that causes various complications such as diabetes, cognitive dysfunction, cardiovascular diseases, and hepatobiliary disease. Alpha-linolenic acid (ALA) has been reported to exhibit multiple pharmaceutical effects. This study aimed to explore the effects of ALA on obesity-induced adipose tissue accumulation, cognitive impairment, inflammation, and colonic mucosal barrier integrity.
Methods: Mice were fed with high-fat diet (HFD) and were treated with ALA (60 or 100 mg/kg). Body weight, adipose tissue, serum glucose and lipid levels, glucose resistance, and insulin resistance were measured. Cognitive ability was analyzed using the behavior tests. PTP1B and IRS/p-AKT/p-GSK3β/p-Tau signaling were examined to evaluate inflammation and synaptogenesis. Colon mucosal barrier integrity was examined by Alcian blue staining and expression of the tight junction proteins. The production of pro-inflammatory cytokines and liver damages were evaluated. 3T3-L1 cells were used for in vitro experiments. Cell viability, migration and invasion were detected. The levels of ROS, iron, and ferrous ions were measured to assess ferroptosis. Metabolomic analysis of adipose tissues was performed.
Results: ALA treatment prevented HFD-induced adipose tissue accumulation, improved glucose and lipid homeostasis and metabolism. Administration of ALA repressed the HFD-induced increase in insulin levels and insulin resistance index. Serum and colon levels of pro-inflammatory cytokines were decreased after ALA treatment. ALA elevated mitochondrial content in brown adipose tissues. ALA ameliorated obesity-induced cognitive impairment and hippocampal inflammation, enhanced colon mucosa integrity. ALA treatment ameliorated HFD-induced liver damage and lipid accumulation and inhibited differentiation of preadipocyte 3T3-L1 cells into mature adipocytes and induces ferroptosis. Metabolomic analysis suggested that ALA may target the glycerolipid metabolism pathway to ameliorate obesity. Knockdown of AGPAT2 abolished the protective effects of ALA.
Conclusion: ALA treatment suppressed adipose accumulation in adipocytes, improved cognitive ability and colon integrity, and alleviated liver damage by modulating the 1-acylglycerol-3-phosphate O-acyltransferase 2 (AGPAT2).
Keywords: alpha-linolenic acid, obesity, liver damage, cognitive recognition, colon integrity
Introduction
Obesity has become a growing global problem and is regularly correlated with a wide spectrum of complications, including metabolic disorders, diabetes, cognitive dysfunction, cardiovascular diseases, hepatobiliary disease, and colon mucosal barrier impairment.1–3 Obesity can cause grave financial, individual, and societal burdens in modern and future societies given its universal complications.4 According to the World Health Organization (WHO), individuals with a body mass index (BMI) of > 30 kg/m2 are defined as obese. In recent decades, the number of overweight and obese populations has rapidly increased owing to high caloric intake, environmental factors, and unhealthy lifestyle.4,5 Abnormal accumulation and dysfunction of adipose tissue is a universal phenomenon in obese individuals that leads to abnormal production of cytokines and hormones by adipocytes and consequently affects the functions of the liver, bone, colon, muscle, and nervous system.6,7 Therefore, obesity is an urgent issue worldwide. Currently, the primary choice for tackling obesity is to strengthen physical activity and decrease energy intake, which are difficult for most people to maintain. Hence, it is necessary to explore pivotal regulatory mechanisms and identify effective therapies to alleviate obesity.
Alpha-linolenic acid (ALA) is a plant-based omega-3 fatty acid that is one of the two essential fatty acids found in humans.8 The only source of ALA in the human body is ingestion of food, followed by its conversion to docosahexaenoic acid and eicosapentaenoic acid.9 This process is limited and regulated by various factors including disease and sex.10,11 Accumulating evidence has suggested pharmacological implications of ALA, such as anti-inflammatory, anti-cancer, anti-metabolic, neuroprotective, and anti-obesity.10–12 In this study, we investigated the effects of ALA on obesity-induced complications including glucose and lipid metabolism, cognitive impairment, disrupted colon mucosa barrier integrity, and liver damage. We performed a metabolomic analysis of adipose tissues to determine the potential target genes of ALA and identified 1-acylglycerol-3-phosphate O-acyltransferase 2 (AGPAT2) as a regulatory target for ALA-alleviated obesity.
Materials and Methods
Animal Experiment
Four-week-old male C57BL/6J mice that aged 4-weeks old were bought from Huafukang (Beijing) and housed in a standard environment with a standard diet (namely the low-fat diet) for one week for acclimatization. Mice were divided into low-fat diet (LFD, 10% calories from fat) and high-fat diet (HFD, 60% calories from fat) groups for modeling. The mice in the model group were fed a HFD for 6 weeks and then grouped for treatment: HFD + ALA group continued to receive HFD and orally administered alpha-linolenic acid (ALA; 20 mg/kg body weight as low, 60 mg/kg body weight as middle, 100 mg/kg body weight as high) every 3 days; shAGPAT2 (2 µmol/kg body weight) was injected through the tail vein every 3 days for knockdown of AGPAT2. Body weight was measured weekly. After six weeks of treatment, the behavior of the mice was analyzed. Subsequently, the mice were sacrificed via cervical dislocation, and adipose tissues, blood samples, brain (hippocampus section), liver, and colon tissues were collected for subsequent experiments. All experiments were performed in accordance with the guidelines for Animal Care and Use. The protocol was approved by the Committee on the Ethics of Animal Experiments of the Hebei Agricultural University.
Behavioral Analysis
Brain function was analyzed using object location, novel object recognition, and nesting tests. All tests were performed as previous reported.13,14 For object location test and novel object recognition test, the exploration time with novel place object was recorded. For the nesting behavior test, the Deacon nest score and the untore nestlet weight were determine spontaneous rodent behavior. Each evaluation was performed 5 times and the average data were quantified.
Histological Analysis
Adipose, colon, and liver tissues were rinsed in PBS and fixed with 4% paraformaldehyde (PFA) for 2 days, followed by embedding in paraffin. The tissues were then cut into 5-µm thickness slices. Colon mucosa integrity was measured using the Alcian blue reagent (Beyotime, China). The morphology of the adipocytes and liver damage were tested using hematoxylin and eosin (HE). All procedures were performed according to the manufacturer’s instructions. Lipid accumulation in adipocytes was measured using Oil Red O staining. Tissues were deparaffinized, fixed with 10% formalin, and washed with 60% isopropanol. The tissues and cells were then incubated with Oil Red O reagent (SolarBio) for 60 min and washed with distilled water. Images were obtained using a microscope (Carl Zeiss).
Immunohistochemistry (IHC) Analysis
Paraffin-embedded adipose tissue was deparaffinized and rehydrated in a series of ethanol solutions. Antigen retrieval was performed by boiling in sodium citrate solution for 10 min. The tissues were then blocked with 3% H2O2 for 10 min and goat serum for 30 min, followed by incubation with the primary antibody at 4°C overnight. The next day, the samples were probed with horseradish peroxidase (HRP)-conjugated secondary antibodies and stained with DAB solution (SolarBio, China). Primary antibodies against adiponectin and Arg1 were purchased from Abcam and were diluted 1:150 in PBS. Images were captured using a microscope (Carl Zeiss).
Blood Biochemical Analysis
Blood samples were collected from mice, coagulated for 3 h at room temperature, and centrifuged at 2000 rpm for 10 min. Total cholesterol (TG), triglyceride (TG), high-density lipoprotein (HDL), and low-density lipoprotein (LDL) levels were measured using commercial kits (Beyotime, China) according to the manufacturer’s protocol. The serum levels of pro-inflammatory cytokines, including TNF-α, IL-1β, and IL-6, were measured by Enzyme linked immunosorbent assay (ELISA) using commercial kits (Abcam, USA) according to the manufacturer’s instructions.
Glucose Tolerance Test (GTT)
To examine glucose tolerance, mice were fasted for 16 h, followed by an intraperitoneal injection of glucose (1.5 g/kg body weight; Sigma, USA). After injection for 0, 15, 30, 60, 90, and 120 min, blood samples were collected, and serum glucose levels were measured using a blood glucose meter.
Insulin Tolerance Test (ITT)
After modeling and treatment, the mice were starved for 6 h and insulin (1 IU/kg body weight) was intraperitoneally injected. Serum insulin concentrations were measured 15, 30, 45, and 60 min after insulin injection.
Cell Culture and Induction
The pre-adipocyte 3T3-L1 cell line was purchased from the American Type Culture Collection (ATCC, Manassas, VA, USA) and maintained in DMEM supplemented with 10% fetal bovine serum (FBS, Gibco, Grand Island, NY, USA) and 1% penicillin and streptomycin at 37°C. To induce mature adipocytes, 3T3-L1 cells were incubated in an adipogenic induction medium (MDI; MesGen, China) for 7 days. Lipid droplets in mature adipocytes were observed using Oil Red O staining. Cell transfection was performed using Lipofectamine 2000 reagent (Invitrogen, USA), according to the manufacturer’s protocol.
Western Blotting
Adipose tissues, hippocampus, colon tissues, and 3T3-L1 cells were lysed using RIPA lysis buffer (Thermo Fisher Scientific) supplemented with phosphatase and protease inhibitor cocktail (Thermo Fisher Scientific). Total protein was collected and quantified with BCA kit (Beyotime, China). A total of 35 µg of protein was separated using 6–12% SDS-PAGE and transferred to NC membranes. After blocking in 5% non-fat milk for 2 h, proteins were probed with primary antibodies against PTP1B (#5311s, CST, USA), p-IRS (#2381s, CST), p-AKT (#9271, CST), p-GSK3β (#5558, CST), p-tau (#12885, CST), Synapsin-1 (SYN; #53059, CST), PSG95 (#3450, CST), ZO-1 (#13663, CST), occludin (#91131, CST), GPX4 (#52455, CST), SLC7A11 (#98051, CST), and GAPDH (#2118, CST) overnight at 4°C. The next day, membranes were incubated with HRP-conjugated goat anti-rabbit (ab6721, Abcam, USA) or goat anti-mouse (ab6728, Abcam) secondary IgG antibodies for 1 h. The gray scale of the protein bands was quantified and calculated using ImageJ software.
qPCR Experiment
Total RNAs was extracted from tissues or cells after incubation with TRIzol reagent. cDNA was obtained by reverse transcription using the PrimeScript RT Master Mix (Takara, Japan). qPCR was conducted using the SYBR Green Master Mix (Takara, Japan). GAPDH was used as an endogenous control and gene expression was calculated using the 2–ΔΔCT method.
Cell Counting Kit 8 (CCK-8)
Cell viability was determined using the cell counting kit-8 (Beyotime, China). Cells were seeded in 96-well plates and treated with ALA (5 µM) for 48 hours. CCK-8 reagent was then added to each well for 2-hour incubation at 37°C. Optical density at 450 nm was measured using a microplate detector (Tanon, USA).
Cell Migration and Invasion
To measure cell migration, cells were seeded into 6-well plates and incubated overnight to form a monolayer. Wounds were made by scratching each well using a sterile 200 µL pipette. The cells were then washed with PBS to remove cell debris. Fresh medium without FBS was added for the incubation. Images of wounds were captured using a digital camera (Olympus).
Lipid ROS Detection
The reactive oxygen species (ROS) levels were detected using a 2′7′-dichlorodihydrofluorescein diacetate (DCFH-DA) probe (Beyotime, China) following the manufacturer’s protocol. Briefly, 3T3-L1 cells were incubated with the probe at 10 µM for 30 min at 37°C. The absorbance values were measured at excitation and excitation/emission of 488/525 nm.
Iron Detection
The accumulation of total iron and ferrous ions in 3T3-L1 cells was measured using an iron assay kit (Abcam, USA) in accordance with the manufacturer’s instructions.
Metabolomic Analysis
The adipose of mice were collected for metabolomic analysis. In short, the tissues were grinded and centrifuged. The metabolites were detected by LC-MS. Data were processed with MSDIAL platform and referred to MSBank and KEGG database.
Statistics
Statistical analysis was conducted using SPSS software (version 20.0) and GraphPad Prism 7.0. Comparisons between two groups were performed using the unpaired Student’s t-test and comparisons among multiple groups were analyzed with one-way analysis of variance followed by the post hoc test. Data are presented as mean ± standard deviation (SD) of three independent experiments. p < 0.05 was considered as statistically significant.
Results
ALA Alleviates the HFD-Induced Obesity
To elucidate the effects of ALA on obesity and complications such as high glucose and fatty liver, we established a high-fat diet (HFD)-induced mouse model. After feeding for 6 weeks, HFD mice showed notably increased body weight compared with control low-fat diet (LFD) mice (Figure 1A). HFD mice were then treated with saline or ALA at low, medium, or high doses for another 6 weeks. The body weights of mice in the ALA treatment groups were similar to those in the LFD group (Figure 1A). In addition, treatment with ALA significantly decreased the weight of epididymal white adipose tissue (EP), inguinal white adipose tissue (SUB), and brown adipose tissue (BAT) in a dose-dependent manner and reduced their ratio to body weight (Figure 1B and C). The weights of the major organs, except for liver, were not altered by HFD or ALA treatment (Figure 1D). The weight of liver in HFD group is elevated compared with the LFD group, and treatment with ALA reduced this elevation (Figure 1D). These data indicated that ALA treatment could prevent HFD-induced adipose accumulation.
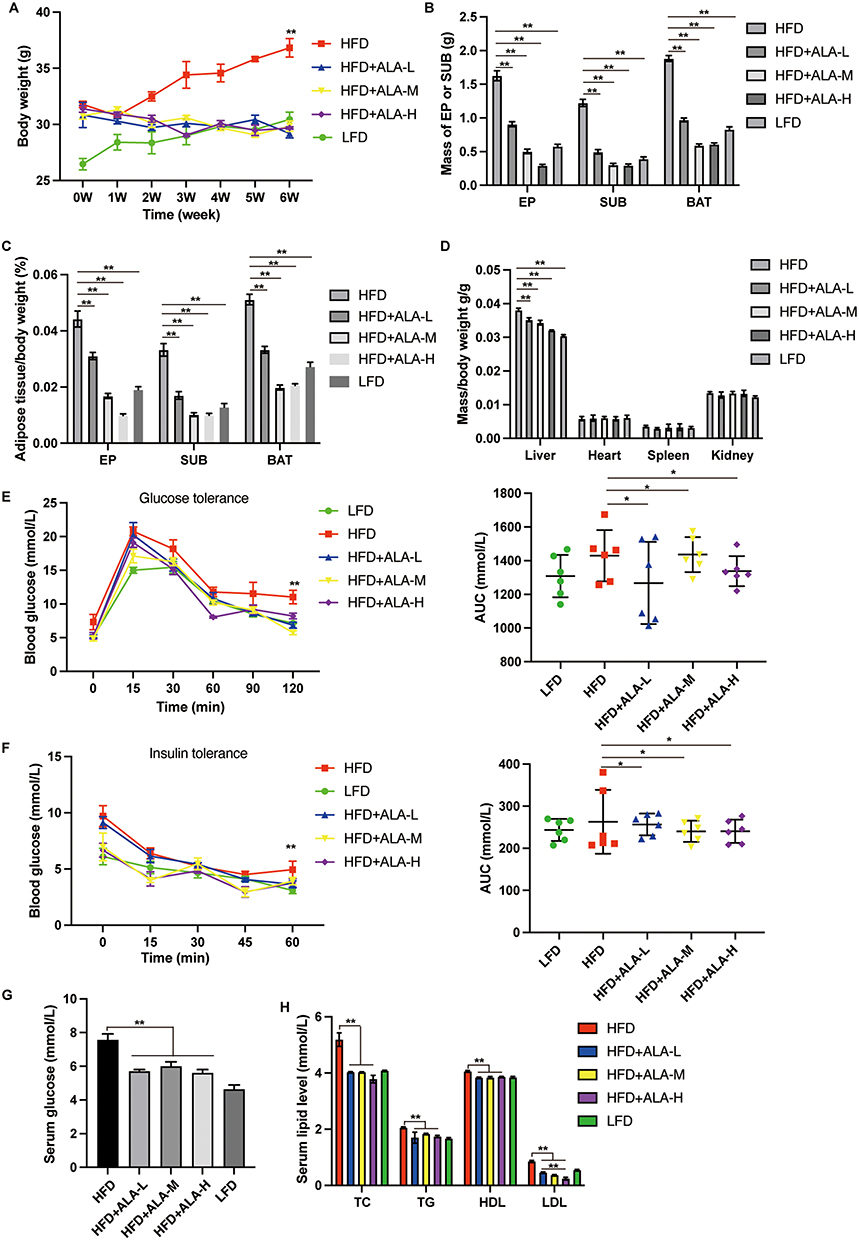 |
Figure 1 Treatment with ALA alleviates the HFD-induced obesity. (A) Body weight. (B) Mass of adipose tissue. EP: epididymal white adipose tissue; SUB: subcutaneous inguinal white adipose tissue; BAT: brown adipose tissue. (C) Ratio of the adipose tissue to total body weight. (D) Ratio of organ weight to body weight. (E) glucose tolerance test (GTT) and (F) insulin tolerance test (ITT) and the area under curve (AUC) were recorded. (G) Fasting serum glucose level. (H) Serum lipid level. (n = 6). (L) low dose; (M) middle dose, (H) high dose; *p < 0.05; **p < 0.01. Abbreviations: LFD, low fat diet; HFD, high fat diet. |
ALA Modulates the Metabolism of Glucose and Lipid
Next, we performed a glucose tolerance test (GTT) and insulin tolerance test (ITT). The HFD group exhibited an increased glucose tolerance and insulin sensitivity (Figure 1E and F). Even though the area under the curve (AUC) of the ITT and GTT did not show obvious changes between LFD and HFD. AUC was notably lower in the ALA treatment groups than in the HFD group (Figure 1E and 1F). Glucose levels (Figure 1G), total cholesterol (TG), triglyceride (TG), high-density lipoprotein (HDL), and low-density lipoprotein (LDL) levels were suppressed by ALA (Figure 1H). These findings demonstrate that ALA improves the homeostasis and metabolism of glucose and lipids. We selected the middle dose of ALA for subsequent experiments. Administration of ALA repressed the HFD-induced increase in insulin levels and insulin resistance index (Figure 2A and 2B). In addition, the serum levels of the pro-inflammatory cytokines leptin, resistin, plasminogen activator inhibitor-1 (PAI-1), and plasma glucose-dependent insulinotropic polypeptide (GIP) were notably elevated in the HFD group, whereas ALA treatment abolished these effects (Figure 2C–F).
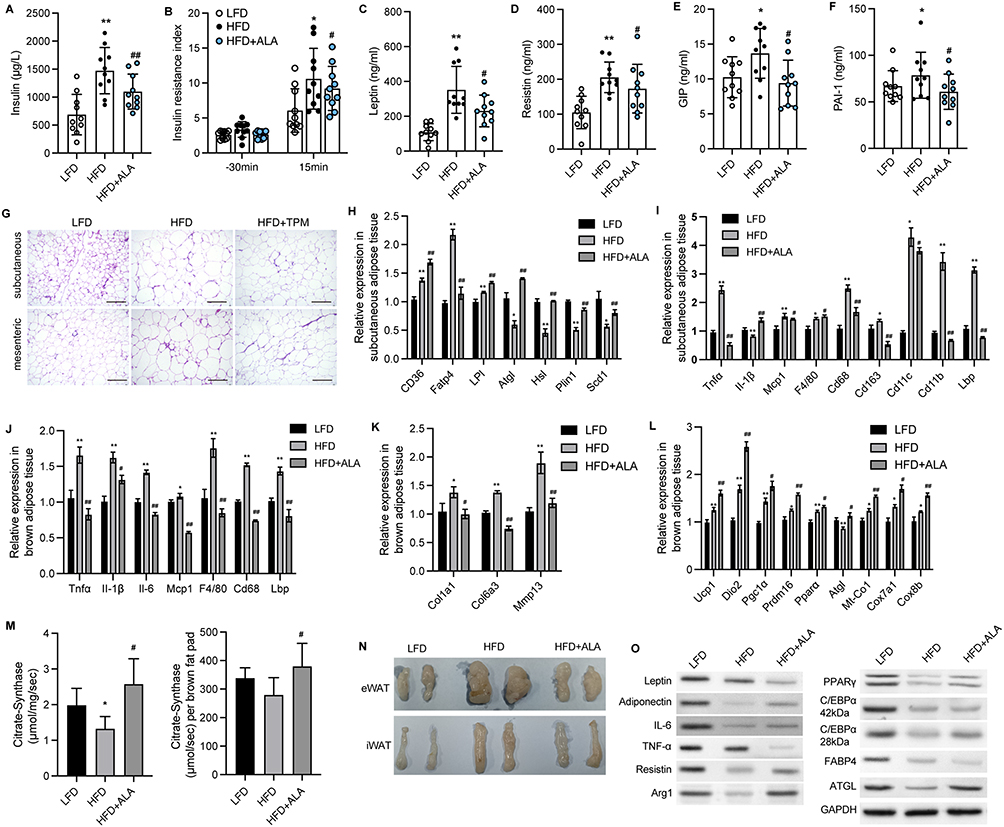 |
Figure 2 ALA alleviates adipose tissue inflammation and increases mitochondrial function. (A) Insulin level in serum 30 min before and 15 min after glucose induction. (B) Insulin resistance index. (C–F) Serum levels of leptin, resistin, GIP and PAI-1 after fasting for 6 h. (G) Representative images of HE staining on subcutaneous and mesenteric adipose tissues. Scale bar, 100 μm. (H) Relative RNA levels of lipid metabolism-related genes in SAT. (I) Relative RNA levels of inflammatory factors and immune factors in SAT. (J) Relative RNA expression related to inflammatory factors and immune factors in BAT. (K) Relative RNA levels of fibrotic genes in BAT. (L) Relative RNA levels of genes related to mitochondria function in BAT. (M) Citrate synthase activity per mg of BAT and brown fat pad. (N) Images of epididymis WAT (eWAT) and inguinal WAT (iWAT). (O) Protein expression of inflammatory factors and lipolysis-related proteins. N=6 mice in each group. *p < 0.05, **p < 0.01 vs LFD; #p < 0.05, ##p < 0.01 vs HFD. Abbreviations: LFD, low fat diet; HFD, high fat diet. |
ALA Alleviates Adipose Tissue Inflammation and Increases Mitochondrial Function
Adipocyte hypertrophy, inflammation, and impaired lipolysis contribute to obesity. The results of HE staining of adipocytes in subcutaneous (SAT) and mesenteric adipose tissue (MAT) showed that ALA treatment notably elevated the size of small adipocytes and decreased the size of large adipocytes (Figure 2G and Figure S1), suggesting reduced fat storage ability. Consistent with this, fatty acid transport protein 4 (Fatp4), which facilitates the uptake of fatty acids, was upregulated by HFD and was significantly downregulated by ALA (Figure 2H). Conversely, the levels of genes associated with fatty acid mobilization and lipolysis, including adipose triglyceride lipase (ATGL), hormone-sensitive lipase (Hsl), perilipin 1 (Plin1), and stearoyl-coenzyme A desaturase 1 (Scd1), were elevated in SAT from the ALA treatment group compared with the HFD group (Figure 2H). Furthermore, the elevated expression of pro-inflammatory genes Tnfα, Mcp-1, and macrophage infiltration markers Cd68, Cd11b, Lbp, and Cd163 in SAT (Figure 2I) and brown adipose tissues (BAT) (Figure 2J) of HFD mice was markedly reduced by ALA. In addition, the levels of profibrotic genes encoding collagens and matrix metalloproteinases were maintained at normal levels following ALA administration (Figure 2K). Inflammation and the conversion of BAT to white adipose tissue (WAT) are correlated with mitochondrial dysfunction. We found that specific BAT markers, including uncoupling protein (Ucp1), Dio2, and Prdm16, and the mitochondrial biogenesis marker Pgc1α, were increased after ALA treatment. The elevated levels of Mt-Co1, Cox8b, and Cox7a1 induced by the HFD demonstrated enhanced mitochondrial respiration, which was further stimulated by ALA (Figure 2L). We further detected citrate synthase activity to determine metabolic changes. ALA elevated citrate synthase compared to that in the HFD group, suggesting increased mitochondrial content in BAT (Figure 2M). Consistent with these results, the mass of epididymal WAT (eWAT) and inguinal WAT (iWAT) was reduced by ALA administration (Figure 2N), along with increased expression of the anti-inflammatory factors adiponectin and arginase 1 (Arg1) and lipolysis-related proteins ATGL, PPARγ, and C/EBPα (Figure 2O).
ALA Ameliorates Obesity-Induced Cognitive Impairment and Hippocampus Inflammation
Subsequently, we analyzed recognition ability and living ability by performing the object location test (Figure 3A), novel object recognition test (Figure 3B), and nesting test (Figure 3C). We observed that ALA remarkably improved the ability to remember locations (Figure 3A, Figure S2A and B) and to recognize novel objects (Figure 3B, Figure S2C and D). In the nesting test, the ALA group showed a lower nesting score and higher amount of untore-nesting material than did the HFD group (Figure 3C, Figure S2E and F). Moreover, the expression of the activated microglial biomarker, Iba1, was upregulated by HFD and notably suppressed by ALA treatment (Figure 3D). ALA treatment also significantly suppressed the upregulation of inflammatory cytokines, such as TNF-α, IL-6, and IL-1β, in the hippocampus (Figure 3E). PTP1B and IRS/p-AKT/p-GSK3β/p-Tau signaling play critical roles in inflammation and synaptogenesis. Here, we found that PTP1B protein levels were notably decreased in the hippocampus of the ALA group compared with the HFD group. ALA significantly downregulated HFD-induced elevation of phosphorylation on serine 307 of IRS-1, which consequently upregulated the levels of p-Akt and p-GSK3β (Figure 3F). In addition, HFD induced elevation of p-Tau and decrease in SYN and PSD95 in the hippocampus, whereas ALA administration reversed these effects (Figure 3F).
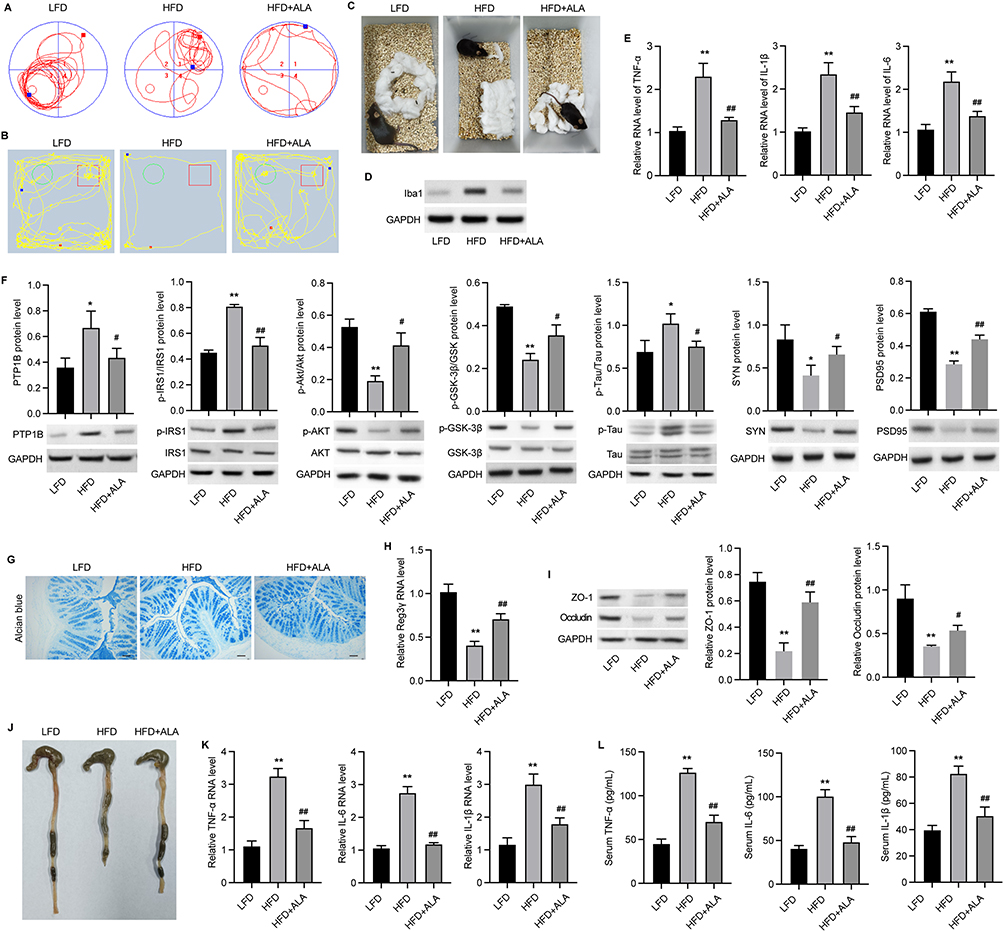 |
Figure 3 ALA ameliorates cognitive impairment and improves intestinal barrier integrity. (A) Track plots of mice from LFD, HFD, and ALA treatment group in the object location test. Blue cube/red circle: objects for location. (B) Track plots of mice from LFD, HFD, and ALA treatment group in novel object recognition test. Green circle: old object, Red cube: novel object. (C) Representative images of nests in nesting test. (D) Protein expression of Iba1 in hippocampus. (E) The RNA levels of inflammatory cytokines TNF-α, IL-1β and IL-6 in hippocampus. (F) The protein expression of PTP1B and IRS/pAKTpGSK3β/pTau signaling in hippocampus. (G) Alcian blue staining of colon mucosa. Scale bar=50 µm. (H) RNA level of Reg3 in colon mucosa. (I) Protein expression of ZO-1 and occluding in colon. (J) Images of colons. (K) RNA level and (L) secretion of TNF-α, IL-1β and IL-6 in serum. N=6 mice in each group. *p < 0.05, **p < 0.01 vs LFD; #p < 0.05, ##p < 0.01 vs HFD. Abbreviations: LFD, low fat diet; HFD, high fat diet. |
ALA Improves Intestinal Barrier Integrity
Next, we examined the effect of ALA on the colonic mucosal barrier. Alcian blue staining of the colon mucosa indicated that ALA enhanced the thickness of the colon mucosa compared to that in the HFD group (Figure 3G and Figure S2G). ALA treatment restored the expression of Reg3γ, an antimicrobial peptide (Figure 3H), suggesting that ALA may enhance the protective ability of the mucosa against bacterial infection. Furthermore, ALA upregulated the levels of the tight junction proteins zonula occludens-1 (ZO-1) and occludin in the colon compared to those in the HFD group (Figure 3I). Next, the length of the colon was shortened by HFD and notably recovered by ALA treatment (Figure 3J and Figure S2H). A shortened colon length is correlated with inflammation. Therefore, we examined the levels of inflammatory cytokines. The results of qPCR analysis and ELISA indicated that ALA repressed the production and secretion of TNF-α, IL-1β, and IL-6 (Figure 3K and L).
ALA Ameliorates HFD-Induced Hepatic Steatosis
Subsequently, we evaluated liver function and damage to analyze the effects of ALA on HFD-induced hepatic steatosis. The results from HE and Oil Red O analyses showed injuries and lipid accumulation in liver tissue, which were alleviated by ALA administration (Figure 4A and Figure S3). The levels of total cholesterol (TG) and triglycerides (TG) in the liver were elevated in HFD mice compared to those in the control group, whereas ALA treatment abolished this elevation (Figure 4B and C). In addition, elevated serum levels of alanine transaminase (ALT) and aspartate aminotransferase (AST) suggested liver damage induced by HFD, which was repressed by ALA (Figure 4D and E). The expression of proteins involved in fatty acid transport, such as Fatp1, Fabp1, Fasn, and Acca, was significantly elevated in the HFD group, whereas ALA notably suppressed this expression (Figure 4F).
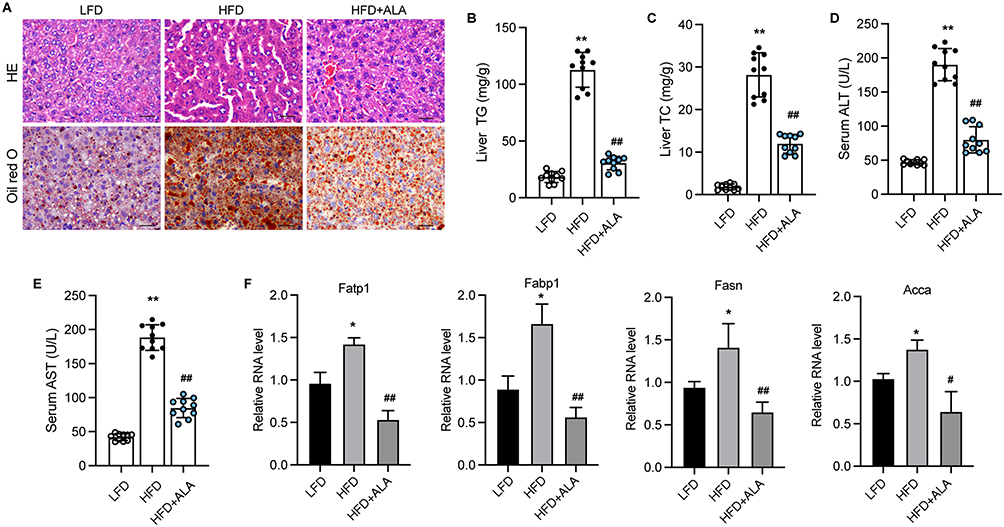 |
Figure 4 ALA ameliorates HFD-induced hepatic steatosis. (A) HE and Oil red O analysis of liver tissues. Scale bar=20 µm. (B and C) Production of TG and TC in liver tissues. (D and E) Serum levels of ALT and AST. (F) Relative RNA levels of Fatp1, Fabp1, Fasn, and Acca were measured by qPCR assay. N=6 mice in each group. *p < 0.05, **p < 0.01 vs LFD; #p < 0.05, ##p < 0.01 vs HFD. Abbreviations: LFD, low fat diet; HFD, high fat diet. |
ALA Inhibits Differentiation of Pre-Adipocyte 3T3-L1 into Mature Adipocytes
3T3-L1 cells treated with ALA showed decreased lipid accumulation (Figure 5A and Figure S4) and triacylglycerol (TAG) storage (Figure 5B) compared to control cells. Results from qPCR and Western blot assays showed decreased levels of adipogenic differentiation markers, including proliferator-activated receptor gamma (PPARγ), CCAAT-enhancer-binding protein alpha (C/EBPα), and fatty acid-binding protein 4 (FABP4) in ALA-treated cells (Figure 5C and D). ALA also downregulated other markers of adipogenic differentiation, including CD36, lipoprotein lipase (LPL), glycerol-3-phosphate dehydrogenase (GPDH), and fatty acid synthase (FAS) (Figure 5E). Furthermore, ALA treatment increased the accumulation of lipid ROS, total iron, and ferrous ions (Fe2+) (Figure 5F) in 3T3-L1 cells and suppressed the protein levels of GPX4 and SLC7A11 (Figure 5G), suggesting that ferroptosis is induced by ALA.
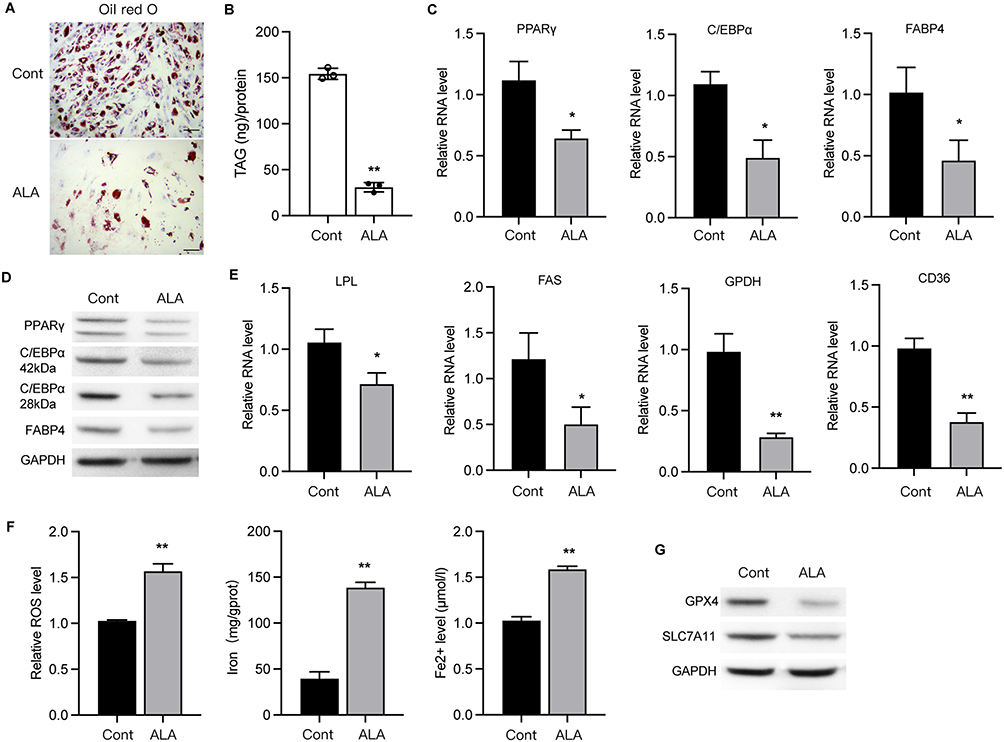 |
Figure 5 ALA inhibits differentiation of pre-adipocyte 3T3-L1 into mature adipocytes. (A) Oil red O staining of 3T3-L1 cells. Scale bar=20 µm. (B) Triacylglycerol (TAG) storage in 3T3-L1 cells. (C and D) RNA and protein levels of PPARγ, C/EBPα and FABP4. (E) RNA levels of LPL, FAS, GPDH and CD36 in 3T3-L1 cells. (F) Accumulation of ROS, iron and Fe2+ in cells. (G) Protein levels of GPX4 and SLC7A11. *p < 0.05, **p < 0.01 vs control (Cont). |
ALA Represses the Mature of Adipocytes via Targeting the Glycerolipid Metabolism
To explore the mechanisms underlying ALA-regulated obesity, we performed a metabolomic analysis of adipose tissues from the LFD, HFD, and ALA groups. Among the enriched metabolic pathways, the glycerolipid metabolism pathway was notably altered in the HFD with LFD and ALA groups (Figure S5). Several metabolites such as glyceric acid, pimelic acid, cysteic acid, guanosine, and rubiadin were notably changed (Figure S6). AGPATs (1-acylglycerol-3-phosphate O-acyltransferases) catalyze a key step in the synthesis of triacylglycerols and phospholipids. Here, we observed that the expression of AGPAT2 was significantly suppressed in MDI-induced mature adipocytes, and that ALA recovered this suppression (Figure 6A). We then performed knockdown of AGPAT2 to analyze its effects on the adipocyte phenotype. Oil Red O analysis indicated that ALA decreased lipid accumulation in MDI-induced 3T3-L1 cells, whereas shAGPAT2 increased lipid accumulation (Figure 6B and Figure S7A). ALA treatment repressed the viability (Figure 6C), invasion (Figure 6D and Figure S7B), and migration (Figure 6E and Figure S7C) of MDI-treated 3T3-L1 cells, whereas AGPAT2 knockdown reversed these effects. Additionally, ALA induced ferroptosis of differentiated 3T3-L1 cells, as evidenced by elevated accumulation of ROS, total iron and Fe2+, as well as decreased expression of ferroptosis repressor GPX4 and SLC7A11. And these effects were abolished by shAGPAT2 treatment (Figure 6F and G).
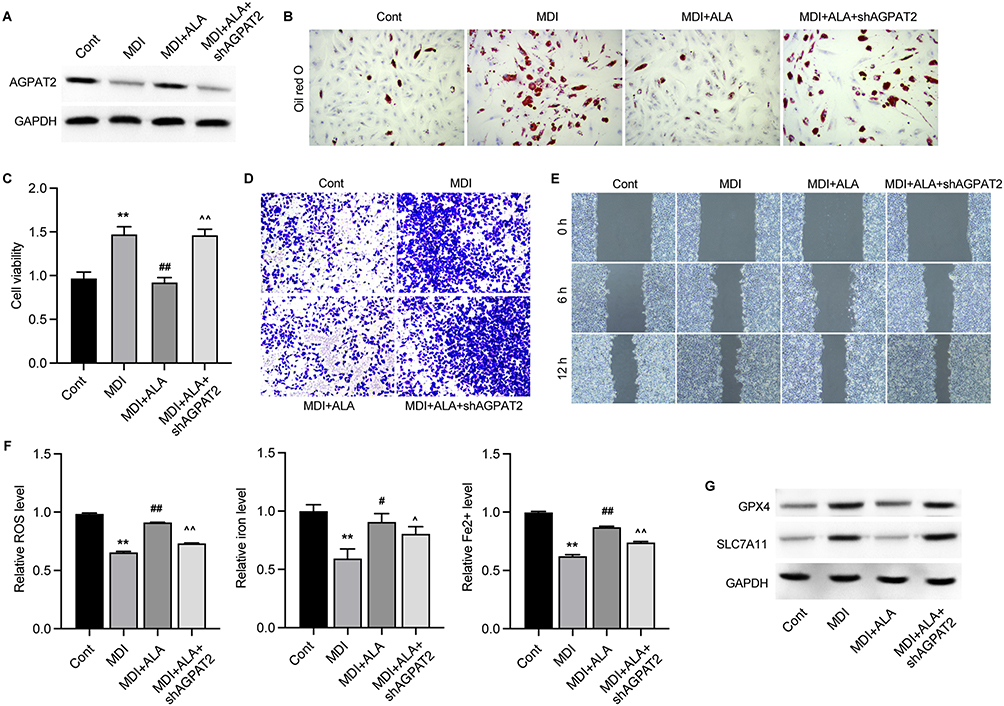 |
Figure 6 ALA represses the mature of adipocytes via targeting the glycerolipid metabolism. 3T3-L1 cells were induced by MDI (adipogenic induction medium), treated with ALA and depleted of AGPAT2. (A) Protein level of AGPAT2. (B) Oil red O staining of accumulated lipid. (C) Cell viability was measured by CCK-8 assay. (D) Transwell assay to measure cell invasion. (E) Wound healing experiment to detect cell migration. (F) Accumulation of ROS, iron and Fe2+ in cells. (G) Protein levels of GPX4 and SLC7A11. **p < 0.01 vs Cont; #p < 0.05, ##p < 0.01 vs MDI; ^p < 0.05, ^^p < 0.01 vs MDI+ALA. |
AGPAT2 Mediates ALA-Improved Lipid Metabolism, Cognitive Recognition, and Liver Function
Next, we depleted AGPAT2 in the HFD model to confirm its role in obesity-induced complications. Analysis of serum samples and adipose tissue showed that knockdown of AGPAT2 notably elevated glucose (Figure 7A) and lipid levels except for TG (Figure 7B) in the serum, along with increased adipose mass (Figure 7C), compared with the ALA treatment group. Moreover, increased adipocyte size and upregulated levels of adiponectin and Arg1 in eWAT and iWAT were observed under AGPAT2 depletion compared to those in the ALA group (Figure 7D, Figure S8A and B). We also evaluated the cognitive ability of HFD mice following AGPAT2 knockdown. Compared to ALA-treated HFD mice, shAGPAT2 notably impaired the memory of location (Figure 8A, Figure S9A and B), recognition of novel objects (Figure 8B, Figure S9C and D), and nesting ability of mice (Figure 8C, Figure S9E and F). The colon length of HFD mice was markedly shortened (Figure 8D and Figure S9G), the production of pro-inflammatory cytokines was stimulated (Figure 8E and F), and the expression of tight junction proteins ZO-1 and occludin was suppressed in colon tissues upon depletion of AGPAT2, which abolished the protective effects of ALA on colon integrity (Figure 8G). Consistently, the protective effects of ALA on the liver against HFD were also abolished by AGPAT2 depletion, as manifested by increased lipid accumulation (Figure 9A), elevated liver TG and TC content (Figure 9B and C), increased serum ALT and AST levels (Figure 9D and E), and upregulated expression of Fatp1, Fabp1, Fasn, and Acca in liver tissues (Figure 9F). These data suggested that AGPAT2 mediates the therapeutic effects of ALA in HFD-induced obesity.
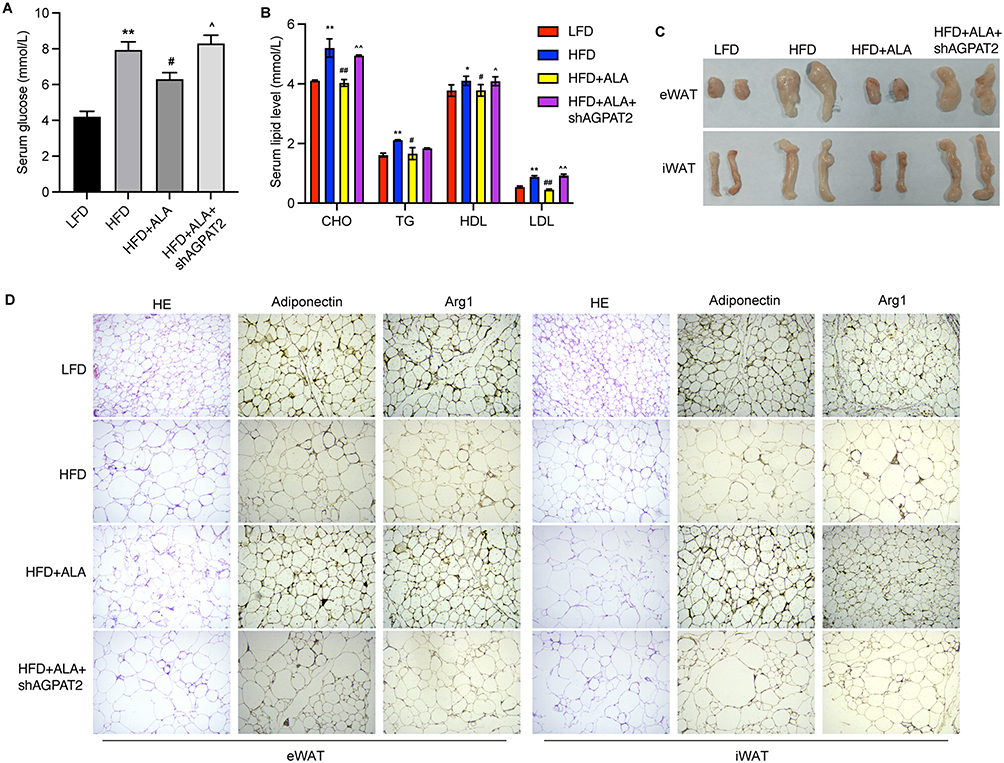 |
Figure 7 Knockdown of AGPAT2 promotes adipose accumulation in HFD mice. (A) Serum glucose level. (B) Serum lipid level. (C) Mass of eWAT and iWAT. (D) The adipocytes morphology and HE staining of eWAT and iWAT. N=6 mice in each group. *p < 0.05, **p < 0.01 vs Cont; #p < 0.05, ##p < 0.01 vs MDI; ^p < 0.05, ^^p < 0.01 vs MDI+ALA. Abbreviations: LFD, low fat diet; HFD, high fat diet. |
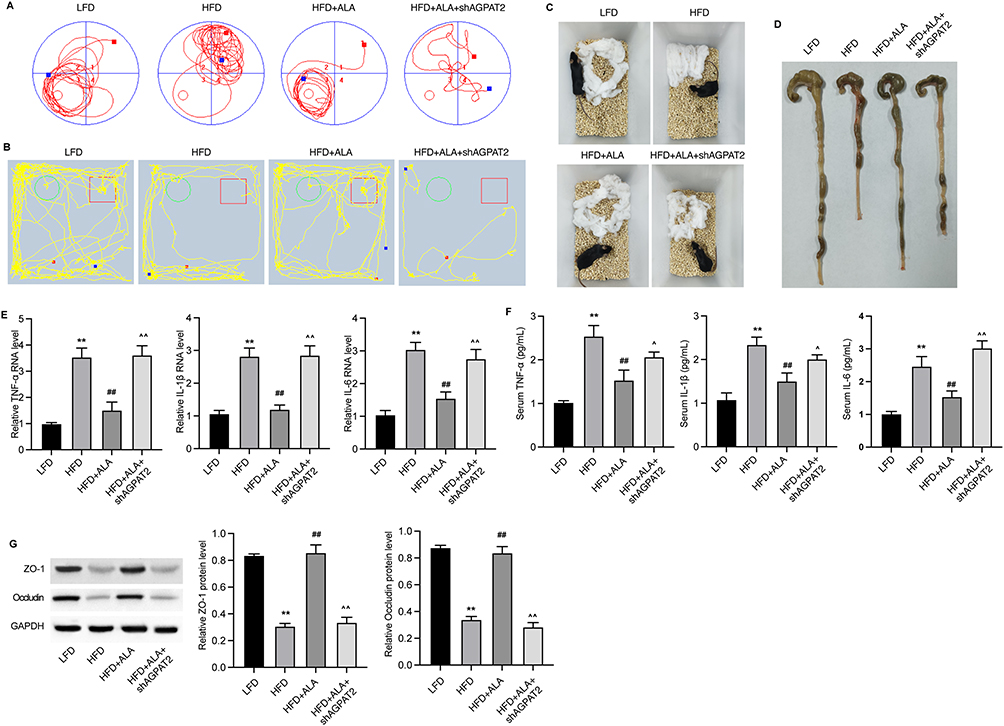 |
Figure 8 Knockdown of AGPAT2 disrupts colon integrity in HFD mice. (A) Track plots of mice in the object location test. (B) Track plots of mice in novel object recognition test. (C) Representative images of nesting test. (D) Images of colons. (E) The RNA levels of inflammatory cytokines TNF-α, IL-1β and IL-6 in colon tissues. (F) Serum levels of TNF-α, IL-1β and IL-6. (G) Protein expression of ZO-1 and occludin in colon. N=6 mice in each group. **p < 0.01 vs Cont; ##p < 0.01 vs MDI; ^p < 0.05, ^^p < 0.01 vs MDI+ALA. Abbreviations: LFD, low fat diet; HFD, high fat diet. |
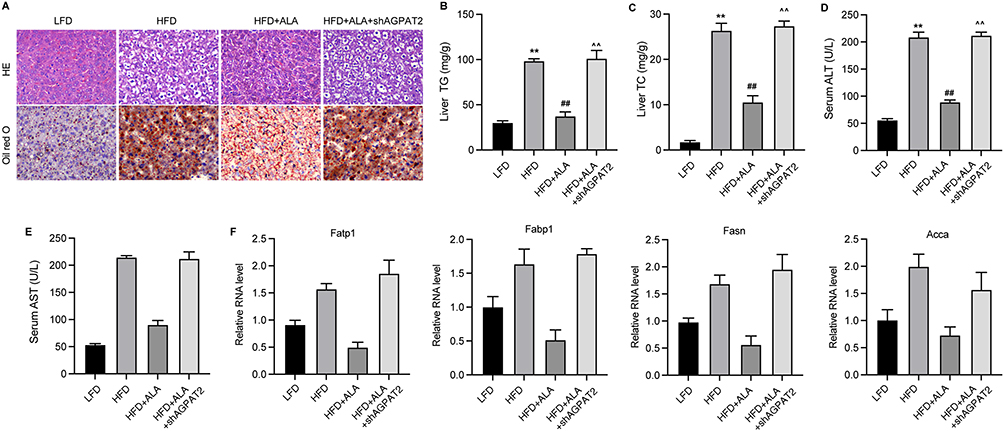 |
Figure 9 Knockdown of AGPAT2 induces liver damage in HFD mice. (A) HE and Oil red O analysis of liver tissues. (B and C) Levels of TG and TC in liver tissues. (D and E) Serum levels of ALT and AST. (F) Relative RNA levels of Fatp1, Fabp1, Fasn, and Acca were measured by qPCR assay. N=6 mice in each group. **p < 0.01 vs LFD; ##p < 0.01 vs HFD; ^^p < 0.01 vs HFD+ALA. Abbreviations: LFD, low fat diet; HFD, high fat diet. |
Discussion
In this study, we demonstrated the potential protective effects of ALA against obesity-related complications, including impaired cognitive function, liver and colon damage, and glucose tolerance in an HFD mouse model. Specifically, ALA reduced the body weight and accumulation of adipose tissues of obesity mice and recovered the glucose and insulin tolerance. ALA protected the colon barrier integrity and alleviated intestinal inflammation. We provided evidence that ALA improved the recognition of novel objects, memory of objects, and nesting ability of HFD mice, along with the activation of IRS/p-AKT/p-GSK3β/p-Tau signaling. Previous studies have indicated that ALA exhibits neuroprotective effects against in vivo brain damage induced by kainic acid and nerve agents.15 ALA also promotes synaptic plasticity and exhibits antidepressant activity in vivo.8,16 In neurodegenerative diseases such as Alzheimer’s disease, accumulation of amyloid beta in C6 glial cells causes abnormal production of nitric oxide and pro-inflammatory cytokines, including IL-6 and TNF-α, leading to cell death, whereas ALA treatment attenuates inflammation and improved cell viability.17 Consistent with these previous studies, we observed that ALA repressed the expression of Iba1 in the hippocampus, suggesting inactivation of microglia, which highlighted its potential neuron protection effects.
The inflammatory response in the hippocampus stimulates the transcription of PTP1B,18 impedes the insulin signaling pIRS/pAKT/pGSK-3β transduction and synaptogenesis,19–21 and stimulates the phosphorylation of Tau, which consequently disrupts the formation and maintenance of synapses.22 Consistent with these reports, we observed elevated PTP1B expression and repressed AKT/GSK-3β phosphorylation upon HFD induction, which was reversed by ALA administration. SYN and PSD95 are critical for synaptogenesis and synaptic plasticity,23 and their reduction has been implicated in the hippocampal tissues of patients with Alzheimer disease and cognitive impairment.24,25 Here, our data demonstrated elevation of SYN and PSD95 protein levels in HFD mice treated with ALA, suggesting improved synaptogenesis.
Our findings from an in vitro 3T3-L1 cell model indicated that ALA induced ferroptosis in mature adipocytes, as evidenced by the increased accumulation of ROS, iron, and ferrous ions.26,27 Increasing evidence indicates that ferroptosis is a significant vulnerability induced by the incorporation of polyunsaturated fatty acids (PUFA) into cellular membranes.28 Studies have reported that PUFA biosynthesis plays a pivotal role in ferroptosis induction, as PUFAs can be oxidized by lipoxygenases, leading to lipid peroxidation and cell death.29 Interestingly, ALA is a polyunsaturated fatty acid, which may explain the induction of ferroptosis by ALA treatment.
Further investigation on potential molecular mechanisms underlying ALA treatment using metabolomic analysis. The results showed notably changed metabolites such as glyceric acid, pimelic acid, cysteic acid, guanosine, and rubiadin. As the enzyme that catalyze a key step in the synthesis of triacylglycerols and phospholipids, AGPAT2 was selected for subsequent investigation. We observed that the expression of AGPAT2 was significantly suppressed in MDI-induced mature adipocytes, and that ALA recovered this suppression. AGPAT2 is a member of the enzyme family that catalyzes sn-2 acylation of the glycerol-3-phosphate backbone, which converts lysophosphatidic acid to phosphatidic acid.30 AGPAT2 is reported to be essential for adipogenic differentiation, and deficiency of AGPAT2 leads to an altered ability of adipocytes to adapt to massive lipids.31 Victor et al reported that AGPAT2 is essential for the differentiation of brown adipose tissue, and its absence leads to a decreased proportion of adipocytes loading lipids, altered morphology, and decreased number of mitochondria.32 Here, we observed that the depletion of AGPAT2 repressed the protective effects of ALA in HFD mice. Nevertheless, whether AGPAT2 modulates IRS/p-AKT/p-GSK3β/p-Tau signaling requires further investigation.
Funding
Supported by the National Natural Science Foundation of China (32072910)
Disclosure
The authors report no conflicts of interest in this work.
References
1. Dubern B, Mosbah H, Pigeyre M, et al. Rare genetic causes of obesity: diagnosis and management in clinical care. Ann Endocrinol. 2022;83(1):63–72. doi:10.1016/j.ando.2021.12.003
2. Marcelin G, Silveira ALM, Martins LB, et al. Deciphering the cellular interplays underlying obesity-induced adipose tissue fibrosis. J Clin Invest. 2019;129(10):4032–4040. doi:10.1172/JCI129192
3. Mayoral LP, Andrade G, Mayoral E-C, et al. Obesity subtypes, related biomarkers & heterogeneity. Indian J Med Res. 2020;151(1):11–21. doi:10.4103/ijmr.IJMR_1768_17
4. Piché ME, Tchernof A, Després JP. Obesity phenotypes, diabetes, and cardiovascular diseases. Circ Res. 2020;126(11):1477–1500. doi:10.1161/CIRCRESAHA.120.316101
5. Sandouk Z, Lansang MC. Diabetes with obesity--Is there an ideal diet? Cleve Clin J Med. 2017;84(7 Suppl 1):S4–s14. doi:10.3949/ccjm.84.s1.02
6. Milić S, Lulić D, Štimac D. Non-alcoholic fatty liver disease and obesity: biochemical, metabolic and clinical presentations. World J Gastroenterol. 2014;20(28):9330–9337. doi:10.3748/wjg.v20.i28.9330
7. Tomlinson DJ, Erskine RM, Morse CI, et al. The impact of obesity on skeletal muscle strength and structure through adolescence to old age. Biogerontology. 2016;17(3):467–483. doi:10.1007/s10522-015-9626-4
8. Kim KB, Nam YA, Kim HS, et al. α-Linolenic acid: nutraceutical, pharmacological and toxicological evaluation. Food Chem Toxicol. 2014;70:163–178. doi:10.1016/j.fct.2014.05.009
9. Burdge G. Alpha-linolenic acid metabolism in men and women: nutritional and biological implications. Curr Opin Clin Nutr Metab Care. 2004;7(2):137–144. doi:10.1097/00075197-200403000-00006
10. Pan A, Chen M, Chowdhury R, et al. α-Linolenic acid and risk of cardiovascular disease: a systematic review and meta-analysis. Am J Clin Nutr. 2012;96(6):1262–1273. doi:10.3945/ajcn.112.044040
11. Desale SE, Dubey T, Chinnathambi S. α-Linolenic acid inhibits Tau aggregation and modulates Tau conformation. Int J Biol Macromol. 2021;166:687–693. doi:10.1016/j.ijbiomac.2020.10.226
12. de Lorgeril M, Salen P. Alpha-linolenic acid and coronary heart disease. Nutr, Metab Cardiovasc Dis. 2004;14(3):162–169. doi:10.1016/S0939-4753(04)80037-1
13. Hattiangady B, Mishra V, Kodali M, et al. Object location and object recognition memory impairments, motivation deficits and depression in a model of Gulf War illness. Front Behav Neurosci. 2014;8:78. doi:10.3389/fnbeh.2014.00078
14. Subhramanyam CS, Wang C, Hu Q, et al. Microglia-mediated neuroinflammation in neurodegenerative diseases. Semin Cell Dev Biol. 2019;94:112–120. doi:10.1016/j.semcdb.2019.05.004
15. Piermartiri T, Pan H, Figueiredo T, et al. α-Linolenic Acid, A nutraceutical with pleiotropic properties that targets endogenous neuroprotective pathways to protect against organophosphate nerve agent-induced neuropathology. Molecules. 2015;20(11):20355–20380. doi:10.3390/molecules201119698
16. Gao H, Yan P, Zhang S, et al. Chronic alpha-linolenic acid treatment alleviates age-associated neuropathology: roles of PERK/eIF2α signaling pathway. Brain Behav Immun. 2016;57:314–325. doi:10.1016/j.bbi.2015.09.012
17. Lee AY, Lee MH, Lee S, et al. Neuroprotective effect of alpha-linolenic acid against Aβ-mediated inflammatory responses in C6 glial cell. J Agric Food Chem. 2018;66(19):4853–4861. doi:10.1021/acs.jafc.8b00836
18. Zabolotny JM, Kim Y-B, Welsh LA, et al. Protein-tyrosine phosphatase 1B expression is induced by inflammation in vivo. J Biol Chem. 2008;283(21):14230–14241. doi:10.1074/jbc.M800061200
19. Vieira MN, Lyra e Silva NM, Ferreira ST, et al. Protein tyrosine phosphatase 1B (PTP1B): a potential target for alzheimer’s therapy? Front Aging Neurosci. 2017;9:7. doi:10.3389/fnagi.2017.00007
20. Fuentes F, Zimmer D, Atienza M, et al. Protein tyrosine phosphatase PTP1B is involved in hippocampal synapse formation and learning. PLoS One. 2012;7(7):e41536. doi:10.1371/journal.pone.0041536
21. Pathak NM, Pathak V, Lynch AM, et al. Stable oxyntomodulin analogues exert positive effects on hippocampal neurogenesis and gene expression as well as improving glucose homeostasis in high fat fed mice. Mol Cell Endocrinol. 2015;412:95–103. doi:10.1016/j.mce.2015.05.035
22. Spires-Jones TL, Hyman BT. The intersection of amyloid beta and tau at synapses in Alzheimer’s disease. Neuron. 2014;82(4):756–771. doi:10.1016/j.neuron.2014.05.004
23. Jiang Y, Liu Y, Zhu C, et al. Minocycline enhances hippocampal memory, neuroplasticity and synapse-associated proteins in aged C57 BL/6 mice. Neurobiol Learn Mem. 2015;121:20–29. doi:10.1016/j.nlm.2015.03.003
24. Head E, Corrada MM, Kahle-Wrobleski K, et al. Synaptic proteins, neuropathology and cognitive status in the oldest-old. Neurobiol Aging. 2009;30(7):1125–1134. doi:10.1016/j.neurobiolaging.2007.10.001
25. Whitfield DR, Vallortigara J, Alghamdi A, et al. Assessment of ZnT3 and PSD95 protein levels in Lewy body dementias and Alzheimer’s disease: association with cognitive impairment. Neurobiol Aging. 2014;35(12):2836–2844. doi:10.1016/j.neurobiolaging.2014.06.015
26. Jiang X, Stockwell BR, Conrad M. Ferroptosis: mechanisms, biology and role in disease. Nat Rev Mol Cell Biol. 2021;22(4):266–282. doi:10.1038/s41580-020-00324-8
27. Li J, Cao F, Yin H-L, et al. Ferroptosis: past, present and future. Cell Death Dis. 2020;11(2):88. doi:10.1038/s41419-020-2298-2
28. Stockwell BR, Friedmann Angeli JP, Bayir H, et al. Ferroptosis: a regulated cell death nexus linking metabolism, redox biology, and disease. Cell. 2017;171(2):273–285. doi:10.1016/j.cell.2017.09.021
29. Lee JY, Nam M, Son HY, et al. Polyunsaturated fatty acid biosynthesis pathway determines ferroptosis sensitivity in gastric cancer. Proc Natl Acad Sci U S A. 2020;117(51):32433–32442. doi:10.1073/pnas.2006828117
30. Mak HY, Ouyang Q, Tumanov S, et al. AGPAT2 interaction with CDP-diacylglycerol synthases promotes the flux of fatty acids through the CDP-diacylglycerol pathway. Nat Commun. 2021;12(1):6877. doi:10.1038/s41467-021-27279-4
31. Cautivo KM, Lizama CO, Tapia PJ, et al. AGPAT2 is essential for postnatal development and maintenance of white and brown adipose tissue. Mol Metab. 2016;5(7):491–505. doi:10.1016/j.molmet.2016.05.004
32. Tapia PJ, Figueroa A-M, Eisner V, et al. Absence of AGPAT2 impairs brown adipogenesis, increases IFN stimulated gene expression and alters mitochondrial morphology. Metabolism. 2020;111:154341. doi:10.1016/j.metabol.2020.154341
 © 2024 The Author(s). This work is published and licensed by Dove Medical Press Limited. The
full terms of this license are available at https://www.dovepress.com/terms
and incorporate the Creative Commons Attribution
- Non Commercial (unported, 3.0) License.
By accessing the work you hereby accept the Terms. Non-commercial uses of the work are permitted
without any further permission from Dove Medical Press Limited, provided the work is properly
attributed. For permission for commercial use of this work, please see paragraphs 4.2 and 5 of our Terms.
© 2024 The Author(s). This work is published and licensed by Dove Medical Press Limited. The
full terms of this license are available at https://www.dovepress.com/terms
and incorporate the Creative Commons Attribution
- Non Commercial (unported, 3.0) License.
By accessing the work you hereby accept the Terms. Non-commercial uses of the work are permitted
without any further permission from Dove Medical Press Limited, provided the work is properly
attributed. For permission for commercial use of this work, please see paragraphs 4.2 and 5 of our Terms.