Back to Journals » International Journal of Chronic Obstructive Pulmonary Disease » Volume 18
All-Cause, Cardiovascular and Respiratory Mortality in People with Type 2 Diabetes and Chronic Obstructive Pulmonary Disease (COPD) in England: A Cohort Study Using the Clinical Practice Research Datalink (CPRD)
Authors Raslan AS, Quint JK ![]() , Cook S
, Cook S ![]()
Received 3 February 2023
Accepted for publication 22 May 2023
Published 13 June 2023 Volume 2023:18 Pages 1207—1218
DOI https://doi.org/10.2147/COPD.S407085
Checked for plagiarism Yes
Review by Single anonymous peer review
Peer reviewer comments 2
Editor who approved publication: Prof. Dr. Richard Russell
Abdul Sattar Raslan,1 Jennifer K Quint,1,2 Sarah Cook1
1Department of Primary Care and Public Health, School of Public Health, Imperial College London, London, UK; 2National Heart and Lung Institute, Imperial College London, London, UK
Correspondence: Sarah Cook, Department of Primary Care and Public Health, School of Public Health, Imperial College London, Floor 9, Michael Uren Building, 86 Wood Lane, White City, London, W12 0BZ, UK, Email [email protected]
Background: Type 2 diabetes (T2D) and chronic obstructive pulmonary disease (COPD) are common non-communicable diseases. Both have an inflammatory nature and similar risk factors, and there is overlap and interaction between them. To date, there is a lack of research on outcomes in people that have both conditions. The aim of this study was to investigate whether the presence of COPD in people with T2D was associated with an increased risk of all-cause, respiratory-cause and cardiovascular-cause mortality.
Methods: A three-year cohort study (2017– 19) was done using the Clinical Practice Research Datalink Aurum database. The study population was 121,563 people with T2D aged ≥ 40. The exposure was COPD status at baseline. Incident rates for all-cause, respiratory-cause and cardiovascular-cause mortality were calculated. Poisson models for each outcome were fitted to estimate rate ratios for COPD status adjusted for age, sex, Index of Multiple Deprivation, smoking status, body mass index, prior asthma and cardiovascular disease.
Results: COPD was present in 12.1% people with T2D. People with COPD had a higher all-cause mortality rate (448.7 persons per 1000 person years) compared with people without COPD (296.6 persons per 1000 person years). People with COPD also had substantially higher respiratory mortality incidence rates and moderately raised cardiovascular mortality rates. Fully adjusted Poisson models showed that people with COPD had a 1.23 (95% CI 1.21, 1.24) times higher rate of all-cause mortality as compared with those without COPD and a 3.03 (95% CI 2.89, 3.18) times higher rate of respiratory-cause mortality. There was no evidence of an association with cardiovascular mortality after adjusting for existing cardiovascular disease.
Conclusion: Co-morbid COPD in people with T2D was associated with increased mortality overall and particularly from respiratory causes. People with both COPD and T2D are a high-risk group who would benefit from particularly intensive management of both conditions.
Keywords: type 2 diabetes, chronic obstructive pulmonary disease, mortality, respiratory, cardiovascular
Background
Type 2 Diabetes (T2D) is a metabolic disorder of persistent hyperglycemia that can be attributed to either defective insulin secretion or insulin resistance.1 In 2019, there were 3,919,505 people diagnosed with T2D in the United Kingdom (UK) with current trends showing that the prevalence is increasing, in both adults and children.2 By 2025 it is expected that more than 5 million will be diagnosed with T2D in the UK.3 An early nation-wide cohort UK study showed a 1.93 times increase in Hazard Ratio (HR) for all-cause mortality in people with T2D as compared with people without T2D.4 Similar studies have shown that this hazard ratio is increased as the number of co-morbidities increases, in all-cause mortality and cardiovascular-cause mortality.5,6
Approximately 3 million people are affected with COPD in the UK,7 and it is considered the fourth leading cause of death worldwide.8 Complications come in the form of frequent respiratory infections and exacerbations, respiratory failure, right-sided heart failure and lung cancer.7 There is an increased risk of mortality with COPD status, with the HR for all-cause mortality of COPD as compared with non-COPD ranged from 1.2 to 2.7 depending on level of severity.9
It is estimated that 10% of individuals with T2D also have COPD.10–12 Studies have noticed an interplay between COPD and T2D individuals, with reports indicating that T2D can worsen progression and severity of COPD.10 COPD has been found in people with T2D in a higher proportion than other respiratory conditions, such as asthma.13 People with T2D were 1.89 times more likely to develop COPD than people without T2D. There are several potential reasons for this including common risk factors, such as smoking13 and central obesity,14 use of inhaled and oral corticosteroids for COPD,15–18 and inflammatory nature of COPD15 increasing risk of T2D.
Clinical Mortality Studies in T2D and COPD Patients
Earlier clinical studies have reported on the mortality and morbidity caused in both conditions and have tried to highlight certain aspects of the interplay. All-cause mortality has been well documented for T2D4,19 and COPD9 separately. This is also the case for cardiovascular-cause mortality.4,6,20,21 However, while respiratory causes are known to be one of the main causes of death in people with COPD, whether this is the case for people with T2D and COPD in not clear.
This study examined the role of COPD status in people with T2D on all-cause as well as respiratory and cardiovascular-cause mortality to help fill the gap in the research with regard to the clinical implications of the T2D-COPD interplay.
Materials and Methods
Data Sources
The resource used in this study, was the Clinical Research Practice Datalink (CPRD) Aurum, which covers diagnoses, treatment, tests and referrals from approximately 56% of GP practices in England that utilize the Egton Medical Information Systems (EMIS) health software.22 This translates to roughly data from over 7 million living patients that are actively recorded as of September 2018, which equates to approximately 12.5% of England’s population in 2018. CPRD Aurum data are coded in terms of MedCode IDs which are derived from the Systematized Nomenclature of Clinical Terms (SNOMED-CT) codes that are utilized by the EMIS health software.
The CPRD Aurum is also linked to different datasets including the ONS Death registration data which indicates the date, place and cause of death using standard international classification of disease (ICD) codes (58). It also includes HES data of outpatient and inpatient diagnostic ICD codes as well as small-area level data, primarily that of the Index of Multiple Deprivation (IMD), which includes patient and practice-level deprivation data (57). Linked pseudonymised data was provided for this study by CPRD. Data is linked by NHS Digital, the statutory trusted third party for linking data, using identifiable data held only by NHS Digital. Select general practices consent to this process at a practice level with individual patients having the right to opt-out.
Study Design and Population
The study population was a cohort of 121,563 people with T2D followed for a three-year time frame between January 1, 2017 and December 31, 2019. People with T2D were determined using a code list from a previously published study23 available on github.24
Participants were included in the study if they had (1) a code for T2D prior to 1st January 2017, (2) were aged greater than 40, (3) had linked ONS data on mortality, (4) were registered with their GP for at least 1 year prior to the 1st January 2017 and (5) had data recorded on smoking status and 6) met criteria for data recording plausibility. The number of participants excluded and reasons for exclusion are shown in Figure 1.
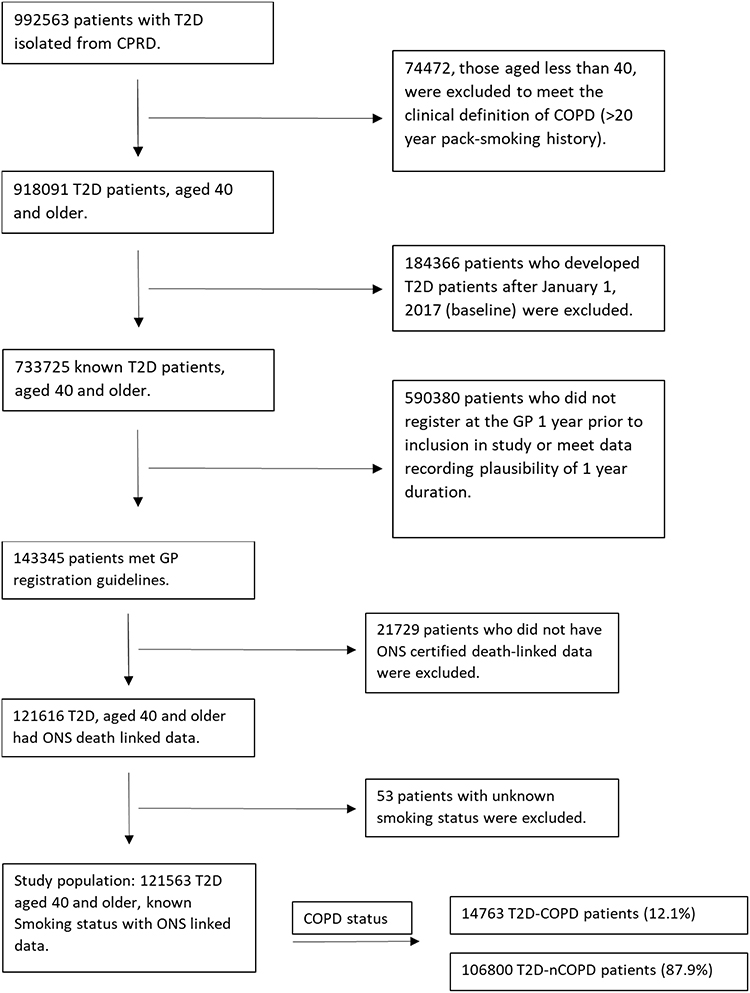 |
Figure 1 Study population selection. |
Study Exposures and Outcome
The study exposure was defined as a code for COPD on or prior to the 1st January 2017 from a previously published codelist23 available on github.24
The primary study outcome was all-cause mortality and the secondary outcomes were respiratory and cardiovascular mortality. Study outcomes were defined using ONS mortality data.
Co-Variates
Co-variates included were age, sex, most recent BMI measurement prior to January 2017 based on the WHO classification, smoking status (never, ex and current), presence of prior asthma status and cardiovascular disease history. Quintiles of IMD from linked data was used an indicator of area-level socio-economic position. Prior cardiovascular disease history included all coronary artery disease, myocardial infarctions, heart failure, peripheral vascular disease and carotid endarterectomy diagnoses. Codelists and stata code used to define these variables were taken from a previously published study23 and are available on github.24
Statistical Analysis
All-cause mortality and cause-specific mortality rates were calculated by whether people were defined as having COPD at the start of the study (1st January 2017). For all-cause mortality, the numerators were calculated as the number of deaths within the three-year period divided by person-time (years) in both COPD-T2D and no COPD-T2D groups. For cause-specific mortality, the numerators were the number of cardiovascular or respiratory deaths within the three-year period divided by person-years in both groups. The rates were reported in terms of 1000 person-years, as well as the 95% confidence intervals of incidence mortality ratios.
Kaplan–Meier (KM) aggregated crude-level survival analysis was determined for all outcomes by COPD status at the start of the study and was illustrated graphically on a survival plot.
Poisson regression modeling was used to calculate adjusted Incident Rate Ratios (IRR) for each outcome by COPD status at the start of the study. For each outcome, a series of model adjusting sequentially for a priori defined confounders were fitted: Model 1 crude unadjusted model, Model 2 demographic variables (age, sex and IMD); Model 3 covariates that have been found to be heavily associated with COPD and T2D (smoking status and BMI); Models 4 and 5 adjusted for the presence of other prior associated respiratory (asthma) or cardiovascular conditions.
The interaction between BMI and COPD status was investigated by fitting fully adjusted models with and without an interaction term and comparing them using the likelihood ratio test.
The amount of missingness for each variable was described. Complete cases analysis was used for regression modelling.
Statistical analysis was done using R software (Version 4.1.1).
Results
The total number of patients included at the start (1st January 2017) was 121,563. The numbers of patients excluded and reasons for exclusion are shown in Figure 1. The characteristics of the study population by COPD status are shown in Table 1. People with both T2D and COPD were more likely to be male, older, current smokers, in the most deprived quintile of IMD and have pre-existing asthma or cardiovascular disease than those without COPD.
 |
Table 1 Baseline Demographic Statistics of Non-COPD and COPD Individuals in Study Population |
Mortality Incidence Rates
All-cause mortality incidence rates for all people with T2D were 314.3 (95% CI 311.8, 316.8) persons per 1000 person years. There was a higher all-cause mortality incidence rate among people with COPD at 448.7 (95% CI 440.1, 457.5) persons per 1000 person years compared to people without COPD 296.6 (95% CI = 294.0, 299.1) persons per 1000 person years. The respiratory mortality incidence rate in the entire T2D cohort was 42.7 (95% CI 41.8, 43.7) persons per 1000 person years. The difference in respiratory mortality rate by COPD status was very high. The respiratory mortality rate in those with COPD was 129.0 (95% CI = 124.4, 133.7) persons per 1000 person years compared to only 26.6 (95% CI = 25.9,27.3) persons per 1000 person years in people without COPD. Whilst still higher in people with COPD the difference in cardiovascular mortality rates was lower than for respiratory mortality (people with COPD 112.8 (95% CI 108.5, 117.2) per 1000 person years; people without COPD 86.9 (95% CI 85.5, 88.3) per 1000 person years; total study population of people with T2D 89.9 (95% CI 88.6, 91.2) per 1000 person years.
Kaplan-Meier (KM) Survival Graphs
All-Cause Mortality
Figure 2 shows the KM survival graph of crude survival probabilities by COPD status with respect to all-cause mortality. People with COPD had a lower survival probability as compared with their non-COPD counterparts. People with COPD had a roughly 25% survival probability by the end of the study period, whereas the people without COPD roughly had a 40% survival probability.
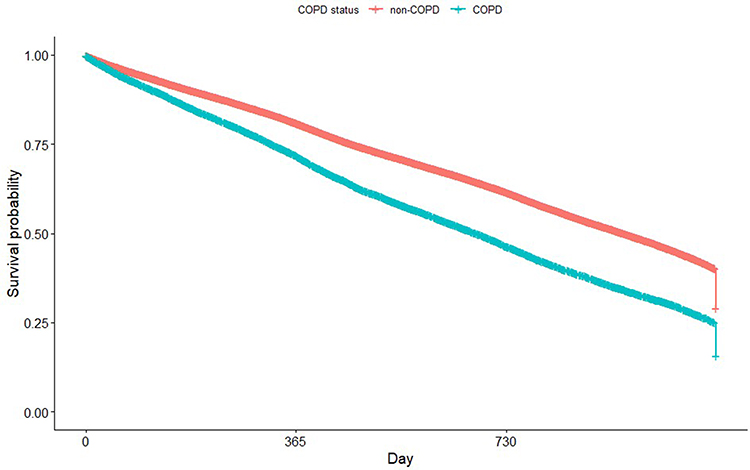 |
Figure 2 All-cause mortality: Kaplan–Meier survival graph stratified by COPD status. |
Respiratory Mortality
Figure 3 shows the KM survival graphs of the cohorts with respect to respiratory-cause mortality. People with COPD had a greater difference in the probability of survival as compared with people without COPD. People with COPD had a roughly 75% survival probability by the end of the study period whereas people without COPD had close to 100% survival at the end of the study period.
 |
Figure 3 Respiratory-cause mortality: Kaplan–Meier survival graph stratified by COPD status. |
Cardiovascular-Cause Mortality
Figure 4 shows the KM survival graphs with respect to cardiovascular-cause mortality. The rate of decline is less prominent as compared to other KM survival curves in overall mortality and respiratory-cause mortality. People with COPD had a lower survival probability as compared to people without COPD. However, the difference between those with and without COPD was smaller than for all-cause and respiratory mortality and both people with COPD and without COPD had roughly similar 3-year survival probabilities at around 0.75 (75% survival probability).
 |
Figure 4 Cardiovascular-cause mortality: Kaplan–Meier survival graph stratified by COPD status. |
Poisson Regression Modeling: All-Cause Mortality
Table 2 shows the impact of sequentially adjusting for different confounders from the initial unadjusted model (Model 1), which reports the crude IRR. In Model 1, people with COPD had 1.44 times the rate of all-cause mortality as compared to people without COPD (IRR= 1.44, 95% CI=1.42,1.46). After adjusting for common demographic variables, such as age, sex and IMD (Model 2), the IRR decreased (RR= 1.31, 95% CI= 1.30,1.33). Model 3 adjusted additionally for smoking status and BMI and people with COPD had 1.26 times the rate of all-cause mortality compared with people without COPD (IRR= 1.26, 95% CI= 1.25,1.28). Model 4, adjusted for prior asthma diagnosis, implying the COPD cohort had 1.25 times the rate of developing all-cause mortality (IRR= 1.25, 95% CI= 1.24,1.27). In the final fully adjusted model (Model 5), the IRR drops to 1.23 (95% CI= 1.21,1.24). There was strong evidence (p<0.001) for an association between COPD and all-cause mortality in all models.
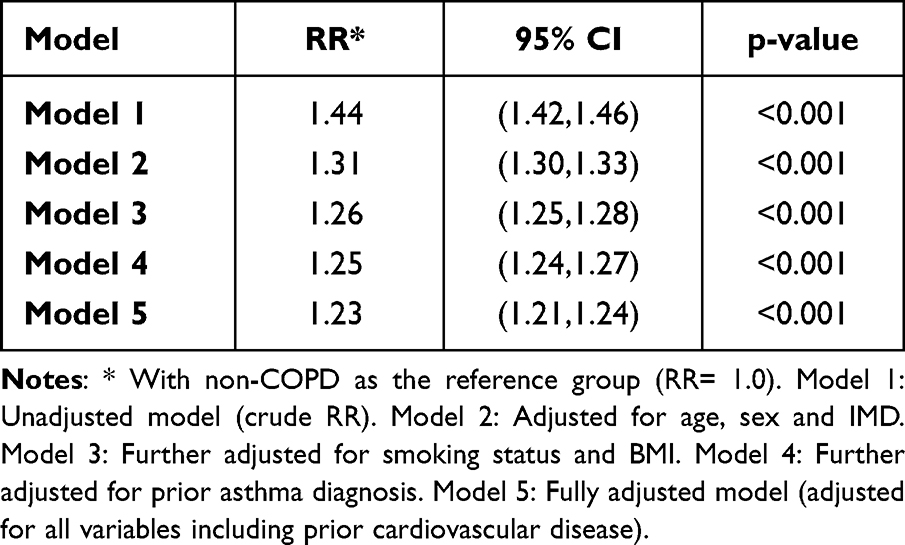 |
Table 2 Multiple Adjusted Models of COPD Status on Overall Mortality |
Poisson Regression Modeling: Respiratory-Cause Mortality
The rate ratios of COPD as compared to non-COPD differ to a greater degree with respect to respiratory-cause mortality (Table 3). Similar to all-cause mortality, there was strong evidence for an association between COPD and respiratory mortality in all models (p<0.001). In the crude unadjusted Model 1, people with COPD had 3.92 times the rate of developing respiratory-cause mortality as compared to people without COPD (IRR= 3.92, 95% CI= 3.76,4.09). When adjusting for age, sex and IMD, the IRR decreased to 3.53 (95% CI= 3.38,3.67). As more variables were adjusted, the rate decreased to a IRR of 3.03 (95% CI= 2.89, 3.18).
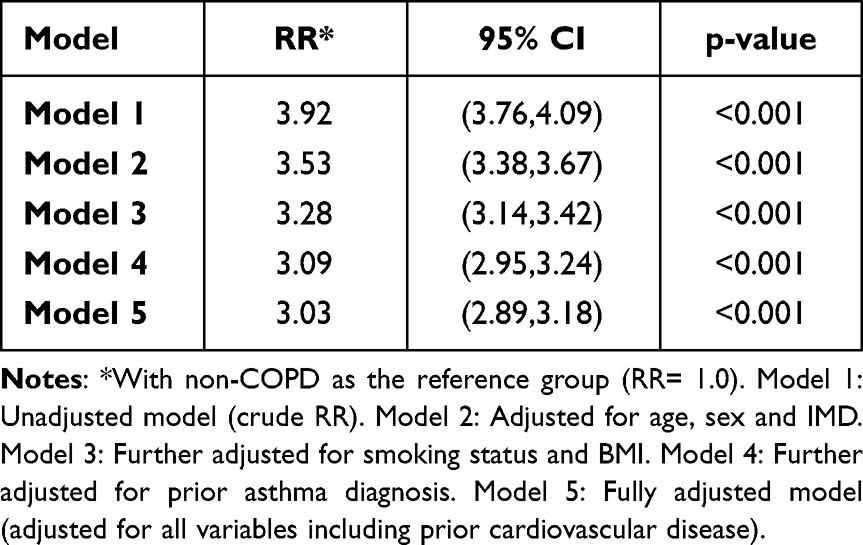 |
Table 3 Multiple Adjusted Models of COPD Status on Respiratory Mortality |
Poisson Regression Modeling: Cardiovascular-Cause Mortality
Looking at specific-cause cardiovascular mortality, the rate ratios across the models are lower than that of all-cause and respiratory-cause mortality outcomes (Table 4). The unadjusted model shows that people with COPD had 1.24 times the rate of developing cardiovascular related mortality as compared with people without COPD (IRR= 1.24, 95% CI = 1.19,1.28, p-value= <0.001). As more variables are adjusted throughout the models, the IRR decreases and the models significance decreases. In Model 2, the IRR decreases to 1.12 (95% CI = 1.08,1.16). After adjusting for smoking status and BMI, the IRR decreases to 1.07 (95% CI= 1.03,1.11), and the absolute p-value decreases to 0.002. After adjusting for prior asthma diagnosis, the IRR does not change and stays at 1.07. However, after the addition of prior cardiovascular disease in the model, the IRR becomes less than 1 and there was no longer evidence for an association between COPD and cardiovascular mortality (IRR= 0.99, 95% CI= 0.95,1.03, p-value=0.629).
 |
Table 4 Multiple Adjusted Models of COPD Status on Cardiovascular Mortality |
Interaction by BMI
There was evidence for an interaction between BMI and COPD for respiratory-cause (p-value < 0.001) and cardiovascular-cause mortality (p-value <0.001) but not for all-cause mortality (p-value = 0.922). Rate ratios stratified by BMI are shown for both respiratory-cause and cardiovascular-cause mortality in Supplementary Table 1. There was strong evidence that COPD was associated with respiratory-cause mortality at all BMIs, however, pre-obesity individuals reported the lowest rate ratio for developing respiratory-cause mortality (2.86, 95% CI= 2.62,3.12), whereas underweight individuals reported the highest rate ratio for developing respiratory-cause mortality (3.37,95% CI= 2.64,4.31). It is also worth noting that even though the rate ratio are different and there was evidence of interaction, the 95% confidence interval between the pre-obesity and underweight groups overlap.
There was no evidence for an association between COPD and cardiovascular mortality in people in the pre-obesity and obese groups, whereas those in the underweight and normal groups had lower rate ratios 0.72 (95% CI= 0.52,0.99) and 0.90 (95% CI= 0.82,0.99), respectively (Supplementary Table 1).
Discussion
In a large sample of patients from primary care in England, people with both COPD and T2D had higher all-cause mortality and mortality from respiratory causes compared with people with T2D but without COPD over a three year time period. Mortality from respiratory causes was particularly high (over three times higher). People with both conditions had slightly higher mortality from cardiovascular disease, but this was explained by pre-existing cardiovascular disease. There was evidence for an interaction between body mass index and respiratory and cardiovascular cause mortality, with higher mortality from respiratory causes in people who underweight with conversely lower mortality from cardiovascular causes in this group. Weight loss is associated with poorer prognosis in COPD,25,26 therefore this may be explained by competing causes for mortality if those who are underweight with T2D and COPD are at particularly high risk of dying from respiratory causes they by definition have lower risk of dying from other causes.
Comparison with the Literature
The study’s findings are in line with the current literature on T2D and COPD. Current estimates on the global COPD prevalence in people with T2D is approximately 10%.10–12 The prevalence of COPD in people with T2D that was calculated based on our English study population from the CPRD was 12.1%.
Here, we found after adjusting for confounders that people with T2D and a recorded diagnosis of COPD had higher rate ratios of all-cause (1.23, 95% CI = 1.21, 1.24) and respiratory-cause mortality (3.03, 95% CI = 2.89,3.18). A similar study done in China, by Ho et al27 showed that the presence of a T2D diagnosis in people with COPD, had a hazard ratio of 1.24 for all-cause mortality (95% CI 1.01, 1.53) which is very similar to the estimate from our study. Their study also recorded an incidence of T2D in people with COPD of 16%.27 However, Ho et al’s study did not look at respiratory or cardiovascular causes of mortality. Their study was also done using a health database that spanned a 13-year follow-up time period, unlike ours which spanned a 3-year follow-up time period. Their study adjusted for age, gender and prior cardiovascular diseases (such as hypertension, dyslipidemia, CVA, heart failure and CAD). However, their study did not include other covariates such as BMI, smoking status and prior respiratory diseases which were included in our final model. Despite some differences between the studies in methodology the findings are very similar.
This study substantiated more information to the results reported by a 2016 meta-analysis done by Guo et al.28 Whereas Guo et al only focused on the effect of BMI in all-cause mortality in people with COPD, our study looked at the influence of BMI on COPD, as an exposure status in people with both COPD and T2D, in all and specific-cause mortality. The meta-analysis reported that those underweight with COPD had a higher rate of all-cause mortality (pooled RR = 1.40, 95% CI = 1.20,1.63). Whereas when they looked at people who were overweight (BMI= 25.0–29.9) and obese (BMI above 30) they reported lower-rate of all-cause mortality in overweight (pooled RR = 0.80, 95% CI = 0.67,0.96) and obese (pooled RR = 0.77, 95% CI= 0.62,0.95) individuals, respectively. It was also described in the limitations of the study that there is insufficient evidence of an association between BMI and all-cause mortality in people who are obese.28 Whereas in this study, our results confirmed that BMI did not have a significant interaction with COPD for all-cause mortality, but rather had a significant interaction for the specific-cause mortality outcomes. A potential reason that the meta-analysis28 found significance in all-cause mortality with BMI, is that only one of the thirteen studies included in the meta-analysis adjusted for asthma and heart failure. Whereas all the other twelve studies adjusted for age, gender, smoking status and severity of COPD only. Whereas for specific-cause outcomes that were only reported in our study, our results showed us that those with COPD-T2D who were underweight (BMI < 18.5) had the lowest rate of cardiovascular-cause mortality as compared with other BMI groups but had the highest rate of respiratory-cause mortality.
Strengths and Limitations
CPRD Aurum is a large dataset and broadly representative of the English population.
The definition of the study population (people with T2D), the exposure (COPD) and adjusted covariates were determined based on coding by GPs in patients records. The coding of data within GP records varies by practice and individual GP. In using electronic health record data, some level of misclassification of the exposure and confounders is to be expected as data quality is dependent on data coding at the point of data collection. The impact of this on the study findings would depend if this is differential by the outcome and exposure or not.
It is worth noting that with a large sample size as in this study, there is likely to be statistical evidence for even small effect sizes and findings should be interpreted in light of their clinical relevance.
Clinical Implications
To our knowledge, no previous study in England has looked at the COPD-T2D interplay in all-cause and specific-cause mortality. Here, we have shown the people with T2D and COPD are at higher risk of mortality particularly from respiratory causes. This is important in management of people with both these conditions, as it shows the importance of management of co-morbid COPD and reducing risk of exacerbations for preventing excess mortality in people with T2D.
Conclusions
In conclusion, this cohort study analyzed the effect of a diagnosis of COPD in people with T2D. This study showed that there was a 23% increase in all-cause mortality in people with T2D who also had COPD compared to those who did not have COPD. COPD status also was associated with a severely increased rate of respiratory-cause mortality. However, it did not affect cardiovascular-cause mortality when adjusted for prior cardiovascular disease. It is also important to note the effect modification of BMI on COPD in people with T2D in respiratory and cardiovascular cause outcomes. Those who were underweight were shown to have the highest respiratory-cause mortality but lowest cardiovascular-cause mortality. People with both COPD and T2D are a high-risk group who would benefit from particularly intensive management of both conditions. Further research should be implemented to examine the role of the COPD-T2D interplay in individuals, which could consequentially develop newer guidelines and update prognostic clinical indicators in people who are affected with both conditions.
Data Sharing Statement
Data are available on request from the CPRD. Their provision requires the purchase of a license, and this license does not permit the authors to make them publicly available to all. This work used data from the version collected in December 2020 and have clearly specified the data selected within the Methods section. To allow identical data to be obtained by others, via the purchase of a license, the code lists will be provided upon request. Licenses are available from the CPRD (http://www.cprd.com): The Clinical Practice Research Datalink Group, The Medicines and Healthcare products Regulatory Agency, 10 South Colonnade, Canary Wharf, London E14 4PU.
Ethics Approval
In the UK, the protocol for this research was approved by the Independent Scientific Advisory Committee (ISAC) for MHRA Database Research (protocol number 22_001961) and the approved protocol was made available to the journal and reviewers during peer review. This study is based in part on data from the Clinical Practice Research Datalink obtained under licence from the UK Medicines and Healthcare products Regulatory Agency. The data is provided by patients and collected by the NHS as part of their care and support. The interpretation and conclusions contained in this study are those of the author/s alone. Linked pseudonymised data was provided for this study by CPRD. Data is linked by NHS Digital, the statutory trusted third party for linking data, using identifiable data held only by NHS Digital. Select general practices consent to this process at a practice level, with individual patients having the right to opt-out. This study is based in part on data from the Clinical Practice Research Datalink (CPRD) obtained under licence from the UK Medicines and Healthcare products Regulatory Agency. The data is provided by patients and collected by the National Health Service (NHS) as part of their care and support. The Office for National Statistics (ONS) was the provider of the ONS Data contained within the CPRD Data and maintains a Copyright © 2019, re-used with the permission of The Health & Social Care Information Centre, all rights reserved. The interpretation and conclusions contained in this study are those of the authors alone.
Author Contributions
All authors made a significant contribution to the work reported, whether that is in the conception, study design, execution, acquisition of data, analysis and interpretation, or in all these areas; took part in drafting, revising or critically reviewing the article; gave final approval of the version to be published; have agreed on the journal to which the article has been submitted; and agree to be accountable for all aspects of the work.
Disclosure
Abdul Sattar Raslan is now an employee of IQVIA. All of his work for this project was done at Imperial College London. The authors report no other conflicts of interest in this work.
References
1. World Health Organisation. Classification of Diabetes Mellitus. Geneva: World Health Organisation; 2019.
2. Diabetes UK. Diabetes Prevalence 2019. Diabetes UK; 2019.
3. NICE National Institute for Health and Care Excellence. Diabetes- type 2; 2022.
4. Mulnier HE, Seaman HE, Raleigh VS, Soedamah-Muthu SS, Colhoun HM, Lawrenson RA. Mortality in people with type 2 diabetes in the UK. Diabetic Med. 2006;23(5):516–521.
5. Coles B, Zaccardi F, Hvid C, Davies MJ, Khunti K. Cardiovascular events and mortality in people with type 2 diabetes and multimorbidity: a real-world study of patients followed for up to 19 years. Diabetes Obes Metab. 2021;23(1):218–227.
6. Mulnier HE, Seaman HE, Raleigh VS, et al. Risk of stroke in people with type 2 diabetes in the UK: a study using the General Practice Research Database. Diabetologia. 2006;49:2859–2865.
7. NICE National Institute for Health and Care Excellence. Chronic obstructive pulmonary disease; 2021.
8. GBD 2015 Chronic Respiratory Disease Collaborators. Global, regional, and national deaths, prevalence, disability-adjusted life years, and years lived with disability for chronic obstructive pulmonary disease and asthma, 1990–2015: a systematic analysis for the Global Burden of Disease Study 2015. Lancet Respir Med. 2017;5(9):691–706.
9. Berry CE, Wise RA. Mortality in COPD: causes, risk factors, and prevention. COPD. 2010;7(5):375–382.
10. Gläser S, Krüger S, Merkel M, Bramlage P, Herth FJ. Chronic obstructive pulmonary disease and diabetes mellitus: a systematic review of the literature. Respiration. 2015;89(3):253–264.
11. Caughey GE, Roughead EE, Shakib S, Vitry AI, Gilbert AL. Co-morbidity and potential treatment conflicts in elderly heart failure patients: a retrospective, cross-sectional study of administrative claims data. Drugs Aging. 2011;28(7):575–581.
12. Kerr EA, Heisler M, Krein SL, et al. Beyond comorbidity counts: how do comorbidity type and severity influence diabetes patients’ treatment priorities and self-management? J Gen Intern Med. 2007;22(12):1635–1640.
13. George CDA, Conway BN. Increased risk of respiratory diseases in adults with Type 1 and Type 2 diabetes. Diabetes Res Clin Pract. 2018;142:46–55.
14. Mirrakhimov AE. Chronic obstructive pulmonary disease and glucose metabolism: a bitter sweet symphony. Cardiovasc Diabetol. 2012;11:132.
15. Meteran H, Backer V, Kyvik KO, Skytthe A, Thomsen SF. Comorbidity between chronic obstructive pulmonary disease and type 2 diabetes: a nation-wide cohort twin study. Respir Med. 2015;109(8):1026–1030.
16. Hwang JL, Weiss RE. Steroid-induced diabetes: a clinical and molecular approach to understanding and treatment. Diabetes Metab Res Rev. 2014;30(2):96–102.
17. Gayle A, Dickinson S, Poole C, Pang M, Fauconnot O, Quint JK. Incidence of type II diabetes in chronic obstructive pulmonary disease: a nested case-control study. NPJ Primary Care Respir Med. 2019;29(1):28.
18. Saeed MI, Eklöf J, Achir I, et al. Use of inhaled corticosteroids and the risk of developing type 2 diabetes in patients with chronic obstructive pulmonary disease. Diabetes Obes Metab. 2020;22(8):1348–1356.
19. McAlpine RR, Morris AD, Emslie-Smith A, James P, Evans JM. The annual incidence of diabetic complications in a population of patients with Type 1 and Type 2 diabetes. Diabetic Med. 2005;22(3):348–352.
20. Whittaker HR, Bloom CI, Morgan AD, Jarvis DL, Kiddle SJ, Quint J. Accelerated FEV1 decline and risk of cardiovascular disease and mortality in a primary care population of COPD patients. Eur Respir J. 2020;57(3):2000918.
21. Huiart L, Ernst P, Suissa S. Cardiovascular morbidity and mortality in COPD. Chest. 2005;128(4):2640–2646.
22. Wolf A, Dedman D, Campbell J, et al. Data resource profile: Clinical Practice Research Datalink (CPRD) Aurum. Int J Epidemiol. 2019;48(6):1740–g.
23. Cook S, Schmedt N, Broughton J, Kalra PA, Tomlinson LA, Quint JK. Characterising the burden of chronic kidney disease among people with type 2 diabetes in England: a cohort study using the Clinical Practice Research Datalink. BMJ Open. 2023;13(3):e065927.
24. Github, inc. Github repository for project: characterising the burden of chronic kidney disease among people with type 2 diabetes in England: a cohort study using the Clinical Practice Research; 2023. Available from: https://github.com/NHLI-Respiratory-Epi/ABC-CKD.
25. Wilson DO, Rogers RM, Wright EC, Anthonisen NR. Body weight in chronic obstructive pulmonary disease. The National Institutes of Health Intermittent Positive-Pressure Breathing Trial. Am Rev Respir Dis. 1989;139(6):1435–1438.
26. Decramer M, De Benedetto F, Del Ponte A, Marinari S. Systemic effects of COPD. Respir Med. 2005;99:S3–S10.
27. Ho T-W, Huang C-T, Ruan S-Y, Tsai Y-J, Lai F, Yu C-J. Diabetes mellitus in patients with chronic obstructive pulmonary disease-The impact on mortality. PLoS One. 2017;12(4):e0175794.
28. Guo Y, Zhang T, Wang Z, et al. Body mass index and mortality in chronic obstructive pulmonary disease: a dose-response meta-analysis. Medicine. 2016;95(28):e4225.
 © 2023 The Author(s). This work is published and licensed by Dove Medical Press Limited. The
full terms of this license are available at https://www.dovepress.com/terms
and incorporate the Creative Commons Attribution
- Non Commercial (unported, 3.0) License.
By accessing the work you hereby accept the Terms. Non-commercial uses of the work are permitted
without any further permission from Dove Medical Press Limited, provided the work is properly
attributed. For permission for commercial use of this work, please see paragraphs 4.2 and 5 of our Terms.
© 2023 The Author(s). This work is published and licensed by Dove Medical Press Limited. The
full terms of this license are available at https://www.dovepress.com/terms
and incorporate the Creative Commons Attribution
- Non Commercial (unported, 3.0) License.
By accessing the work you hereby accept the Terms. Non-commercial uses of the work are permitted
without any further permission from Dove Medical Press Limited, provided the work is properly
attributed. For permission for commercial use of this work, please see paragraphs 4.2 and 5 of our Terms.