Back to Journals » Pragmatic and Observational Research » Volume 14
Alignment of Physician-Stated vs Clinically Derived Reference Fibrosis Score in Patients with Non-Alcoholic Steatohepatitis: A Real-World European Survey
Authors Anstee QM, Hallsworth K, Lynch N, Hauvespre A, Mansour E, Kozma S, Bottomley J, Milligan G, Piercy J, Higgins V ![]()
Received 12 October 2022
Accepted for publication 2 February 2023
Published 24 February 2023 Volume 2023:14 Pages 13—27
DOI https://doi.org/10.2147/POR.S392320
Checked for plagiarism Yes
Review by Single anonymous peer review
Peer reviewer comments 2
Editor who approved publication: Professor David Price
Quentin M Anstee,1,2 Kate Hallsworth,1,2 Niall Lynch,3 Adrien Hauvespre,4 Eid Mansour,5 Sam Kozma,5 Juliana Bottomley,6 Gary Milligan,7 James Piercy,8 Victoria Higgins9
1Translational & Clinical Research Institute, Faculty of Medical Sciences, University of Newcastle, Newcastle Upon Tyne, UK; 2Liver Unit, Newcastle Upon Tyne Hospitals NHS Foundation Trust, Newcastle upon Tyne, UK; 3Global Value and Access, Gilead Sciences, Hayes, Uxbridge, UK; 4Market Access and Reimbursement, Gilead Sciences, Hayes, Uxbridge, UK; 5Pricing and Market Access (Middle East), Gilead Sciences, Dubai, United Arab Emirates; 6Pricing and Market Access, Gilead Sciences, Hayes, Uxbridge, UK; 7Statistics Department, Adelphi Real World, Bollington, UK; 8Scientific Franchise, Adelphi Real World, Bollington, UK; 9Scientific and NASH Franchise, Adelphi Real World, Bollington, UK
Correspondence: Victoria Higgins, Adelphi Real World, Adelphi Mill, Grimshaw Lane, Bollington, SK10 5JB, UK, Tel +44 1625 577233, Email [email protected]
Objective: Stratifying disease severity in patients with non-alcoholic steatohepatitis (NASH) is essential for appropriate treatment and long-term management. Liver biopsy is the reference standard for fibrosis severity in NASH, but less invasive methods are used, eg, Fibrosis-4 Index (FIB-4) and vibration-controlled transient elastography (VCTE), for which reference thresholds for no/early fibrosis and advanced fibrosis are available. We compared subjective physician assessment of NASH fibrosis versus reference thresholds to understand classification in a real-world setting.
Methods: Data were drawn from Adelphi Real World NASH Disease Specific ProgrammeTM conducted in France, Germany, Italy, Spain and UK in 2018. Physicians (diabetologists, gastroenterologists, hepatologists) completed questionnaires for five consecutive NASH patients presenting for routine care. Physician-stated fibrosis score (PSFS) based on available information was compared with clinically defined reference fibrosis stage (CRFS) determined retrospectively using VCTE and FIB-4 data and eight reference thresholds.
Results: One thousand two hundred and eleven patients had VCTE (n = 1115) and/or FIB-4 (n = 524). Depending on thresholds, physicians underestimated severity in 16– 33% (FIB-4) and 27– 50% of patients (VCTE). Using VCTE ≥ 12.2, diabetologists, gastroenterologists and hepatologists underestimated disease severity in 35%, 32%, and 27% of patients, respectively, and overestimated fibrosis in 3%, 4%, and 9%, respectively (p = 0.0083 across specialties). Hepatologists and gastroenterologists had higher liver biopsy rates than diabetologists (52%, 56%, 47%, respectively).
Conclusion: PSFS did not consistently align with CRFS in this NASH real-world setting. Underestimation was more common than overestimation, potentially leading to undertreatment of patients with advanced fibrosis. More guidance on interpreting test results when classifying fibrosis is needed, thereby improving management of NASH.
Keywords: fibrosis staging, non-alcoholic steatohepatitis, clinically derived reference fibrosis score, physician-stated fibrosis score, real-world evidence
Plain Language Summary
Why Was the Study Done?
The link between type 2 diabetes mellitus and non-alcoholic fatty liver disease and non-alcoholic steatohepatitis is well known. This impacts the risk, severity, and prognosis of these diseases, warranting timely interventions to identify the presence and stage of disease to ensure appropriate management. Although studies have compared vibration-controlled transient elastography (VCTE) and liver histology findings and demonstrated a good correlation between these methods, the correlation between clinically defined reference thresholds and physician-assessed fibrosis score has not been widely studied. The reliability of physician-assessed fibrosis score warranted further exploration.
What Did the Researchers Do and Find?
Our analysis showed physician-assessed fibrosis scoring to be inaccurate in patients with non-alcoholic steatohepatitis, underestimating and overestimating fibrosis stage compared with reference VCTE and Fibrosis-4 Index (FIB-4) methods. Overall, underestimation was more frequent than overestimation. Scoring misalignment varied with physician specialty, with underestimation greatest among diabetologists and overestimation greatest among hepatologists.
What Do These Results Mean?
Accurate diagnosis and risk stratification of patients are important so that health-care resources can be targeted to those at the greatest risk from their disease. Our findings suggest that more guidance, education and awareness are required to enable effective and accurate interpretation of the test results used to classify a patient’s fibrosis stage.
Introduction
Non-alcoholic fatty liver disease (NAFLD) is a chronic, often asymptomatic, disease characterized by excessive accumulation of triglycerides in more than 5% of hepatocytes.1 NAFLD comprises steatosis (non-alcoholic fatty liver [NAFL]), as well as an inflammatory form — non-alcoholic steatohepatitis (NASH) — defined as steatosis plus inflammation and hepatocyte ballooning injury.2 In one meta-analysis, NAFLD was estimated to affect 25% of adults globally and 59% of biopsied patients with NAFLD had NASH, resulting in an overall prevalence for NASH of 1.5–6.5%.3 It has been estimated that 12% of adults in the UK4 and 14% of adults in the USA have NASH.5 A recent structured literature review reported that NASH affects 3–5% of the global population, with most patients having several other comorbidities.6
High-quality data on rates of disease progression to NASH are sparse, although two dual biopsy studies indicated that both NAFL and NASH have the capacity to progress to advanced fibrosis, with the greatest risk being in patients with type 2 diabetes mellitus (T2DM) and hypertension.7,8 Greater levels of hepatic fibrosis are associated not only with liver-related morbidity but also with cardiovascular disease and all-cause mortality.9 In the absence of effective licensed pharmaceutical therapies specifically targeting liver disease, treatment involves controlling underlying risk factors of NASH, including cardiovascular disease, T2DM and obesity, as well as making lifestyle changes (diet and exercise), in particular weight loss.10 Accurate diagnosis and risk stratification of patients are thus important so that health-care resources can be targeted to those at the greatest risk from their disease.
Liver biopsy is currently the reference standard for identifying steatohepatitis and then grading and staging the disease.2 This procedure has several limitations, including sampling error, cost and risk of complications.11 In the real-world setting, physicians do not always have access to, or wish to use, this invasive diagnostic method and, as a result, non-invasive tests have emerged as a means to assess liver fibrosis,12,13 including measurement of liver stiffness by vibration-controlled transient elastography (VCTE; FibroScan) as a surrogate measure of hepatic fibrosis.14,15 Although more accessible than liver biopsy, VCTE is also subject to some limitations; in particular, fibrosis staging using this technique might be less accurate in older, obese, or hypertensive patients, or in those who have T2DM.14,16 Based on the results of studies correlating median liver stiffness derived from non-invasive tests with histological fibrosis stage according to the NASH Clinical Research Network (CRN) Scoring system,17 thresholds for staging fibrosis have been reported, with sensitivity and specificity values for each derived threshold.15,18,19 When applied in standard clinical settings, VCTE and Fibrosis-4 Index (FIB-4) scores have a high negative predictive value and might be used to exclude patients with advanced fibrosis, minimizing unnecessary liver biopsies.20 However, VCTE results require interpretation by supervising clinicians and are open to misinterpretation, such that liver disease severity might be over- or underestimated.21 The FIB-4 is another non-invasive method for stratifying patients into those with versus without advanced hepatic fibrosis using the patient’s age, aspartate transaminase (AST) level, alanine transaminase (ALT) level and platelet count.22 FIB-4 score is influenced to a greater extent by age than VCTE.23
Despite recommendations by professional societies,2,24 NAFLD remains underdiagnosed and many physicians do not routinely use formal risk-stratification tools to aid triage and management of these patients.25–27 Therefore, physicians might underestimate NAFLD severity in the real-world setting. The aim of this analysis was to determine the alignment of physicians’ subjective assessment of fibrosis stage (physician-stated fibrosis score, PSFS) in patients with a diagnosis of NASH in the real world against a clinically defined reference fibrosis stage (CRFS) that was calculated using the above-mentioned published reference thresholds for VCTE and FIB-4.15,18,19 A secondary aim was to identify physician specialty, patient liver biopsy status, and other patient demographic and clinical factors associated with alignment/misalignment between PSFS and CRFS. Finally, sensitivity analyses were done to determine if the following influenced the degree of alignment: (i) inclusion of patients for whom VCTE is suboptimal; (ii) timing of VCTE, ie, at diagnosis versus most recent test result; and (iii) whether or not patients had a liver biopsy in their diagnostic pathway, as this has the potential to supersede VCTE or FIB-4 assessments.
Methods
Study Design and Participants
Data were drawn from the Adelphi Real World NASH Disease Specific Programme (DSP) conducted in five European countries (France, Germany, Italy, Spain and the UK) between January and March 2018. DSPs are point-in-time surveys of physicians and their patients presenting in real-world clinical settings and have been described in detail and validated elsewhere.28–30
Physicians
Eligible physicians were hepatologists (France, Italy and the UK), gastroenterologists (Germany, Italy, Spain and the UK), gastroenterologists with a subspecialization in hepatology (Germany and Spain), hepato-gastroenterologists (France only), endocrinologists (all countries) and diabetologists (all countries). Physicians were managing ten or more patients with NASH per month and personally responsible for NASH management decisions. Patients had to be aged 18 years or older, with a physician-confirmed diagnosis of NASH obtained via liver biopsy and/or non-invasive test. In this analysis, patients had to have both a PSFS plus a VCTE test and/or data enabling retrospective calculation of a FIB-4 score. Patients could not be participating in NASH clinical trials at the time of data collection.
The survey was performed in accordance with relevant guidelines and in line with the principles of the Declaration of Helsinki; ethics approval was obtained from Freiburg Ethics Commission International (Approval No. 017/1931). All patients provided written informed consent for use of their data, which were anonymized and aggregated. No medication was provided and no tests or investigations were performed as part of this research. No hypothesis was developed or tested.
Patient Sample and Data Collection
Physicians completed questionnaires for the next five consecutive consulting patients with a diagnosis of NASH of any fibrosis stage presenting for routine care. This number of patients was chosen to maximize the number of physicians sampled, while minimizing the burden on each physician.
The questionnaire collected patient demographic and clinical information and details of patient care, including diagnostic tests used, fibrosis score and VCTE reporting.
Outcomes
PSFS
Physicians were asked to classify the patient’s fibrosis score at diagnosis (if known) and their current fibrosis score (F0 to F4). The PSFS was based on a summation of available clinical information and routinely ordered investigations, including a combination of non-liver and liver-specific tests as the physician deemed appropriate for that patient. Fibrosis scores are typically applied as per the NASH CRN fibrosis scoring system;17 however, physicians were not provided with any criteria for use in this assignment.
CRFS
This was a retrospectively assigned, objective fibrosis stage derived from published reference non-invasive test data and established thresholds.15,18,19 Using these systems, individual patient fibrosis scores were dichotomized using thresholds I–VIII as shown in Figure 1A. Thresholds were applied at the 80% or 90% level depending on the scoring system used and were defined by either sensitivity (testing correctly to identify the disease — a true positive), specificity (ability to identify patients without disease — a true negative), or Youden’s Index (the threshold that optimizes a biomarker’s differentiating ability when equal weight is given to sensitivity and specificity).31 This generated eight CRFS binary variables defining no fibrosis/early fibrosis or advanced fibrosis/cirrhosis. Patients with indeterminate NASH, ie, those identified via the 90% sensitivity and specificity ranges who did not clearly fall into the advanced fibrosis/cirrhosis category or the no fibrosis/early fibrosis category, were also included in subsequent sizing of patient fibrosis groups.
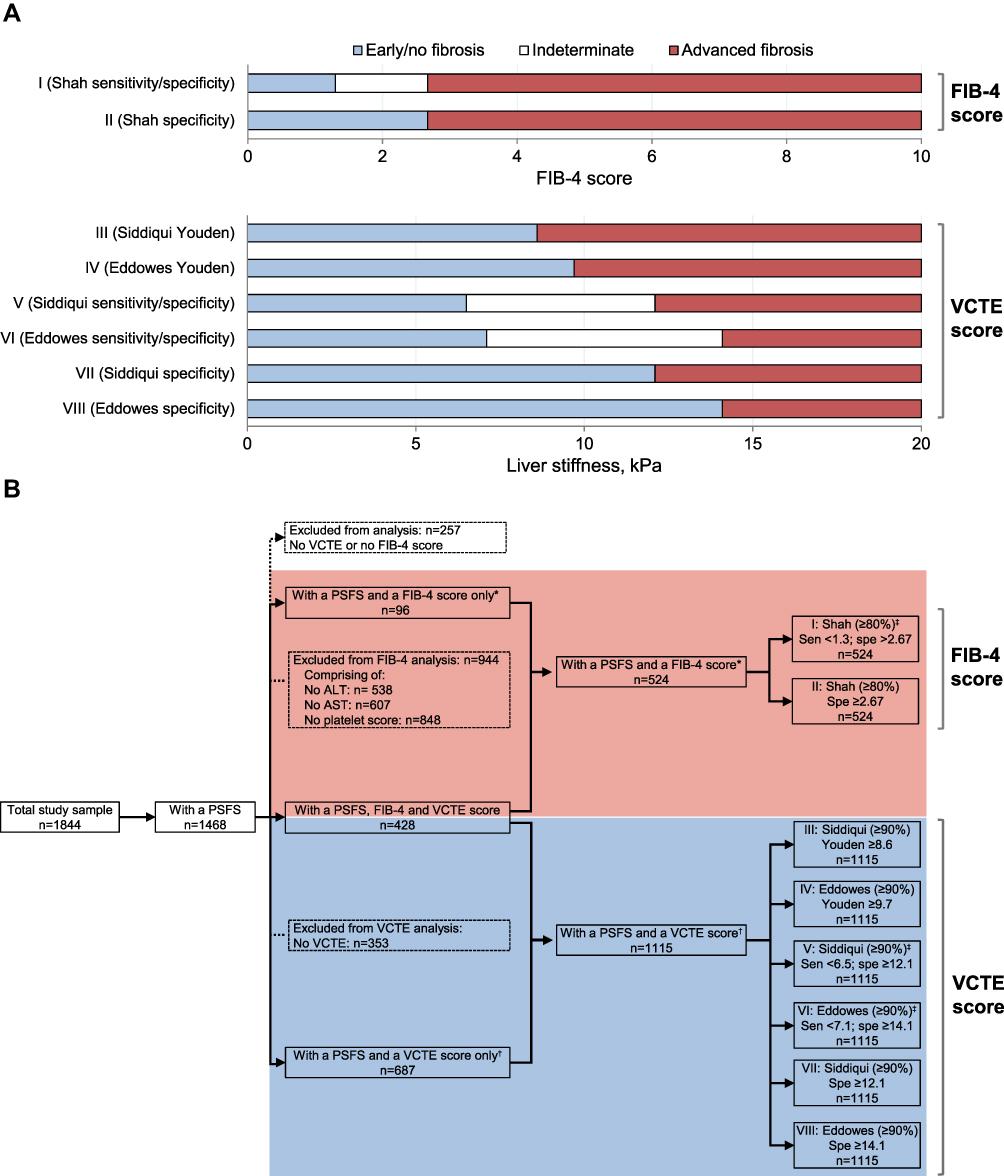 |
Figure 1 (A) Correlation of FIB-4 and VCTE scores with fibrosis stage according to published thresholds. Thresholds were applied at the 80% threshold for FIB-4 and 90% threshold for VCTE and defined by either sensitivity, specificity, or Youden’s Index. Patients with indeterminate non-alcoholic steatohepatitis were also included in subsequent sizing of patient fibrosis groups. (B) Study flow using these thresholds. Patient cohorts were generated using the thresholds described in key references for the presence of advanced fibrosis (specificity; true positive) and absence of advanced fibrosis (sensitivity; true negative). In some cases, upper and lower limits were applied, omitting an “indeterminate” group of patients in whom the presence or absence of advanced fibrosis could not be confirmed. Youden’s Index is the threshold that optimizes the biomarker’s differentiating ability when equal weight is given to sensitivity and specificity. *A FIB-4 score could not be derived if any one of the four components required (ALT, AST, platelet count, or age) was not available. Patients were excluded if their derived FIB-4 score was >10. Only the most recent FIB-4 score was available. †VCTE scores were available at diagnosis and most recent. ‡Indicates scoring systems that include indeterminate patients. Abbreviations: ALT, alanine aminotransferase; AST, aspartate aminotransferase; FIB-4, Fibrosis-4 Index; PSFS, physician-stated fibrosis score; Sen, sensitivity; Spe, specificity; VCTE, vibration-controlled transient elastography. |
FIB-4
If the patient’s age, AST and ALT levels and platelet count were recorded, FIB-4 scores were calculated retrospectively as previously described,22 irrespective of whether the physician had documented a FIB-4 score. Only FIB-4 scores within the range 0.05–10 were included.
In patients for whom a VCTE test result was available, the median liver stiffness (kPa) was captured to the nearest whole number.
Objectives
The primary objective was to determine how well PSFS aligned with CRFS using a variety of reference thresholds. The secondary objective was to identify physician specialty, patient liver biopsy status, and other demographic and clinical factors associated with alignment/misalignment between PSFS and CRFS.
Statistical Analysis
In the primary analysis, patients were grouped according to their PSFS as F0–F2 versus F3/F4. When categorizing patients as having early versus advanced fibrosis, we referred to 80–90% thresholds for each of the eight CRFS variables as defined in Figure 1B. Proportions within each of the four groups were reported as: (i) aligned, CRFS of no/early fibrosis and PSFS both F0–F2; (ii) aligned, CRFS of advanced fibrosis and PSFS both F3/4; (iii) physician underestimated, PSFS F0–F2 but CRFS of advanced fibrosis; or (iv) physician overestimated, PSFS F3/4 but CRFS of no/early fibrosis.
The secondary objective was to identify factors associated with alignment or misalignment between PSFS and CRFS. Alignment was assessed according to treating physician specialty (gastroenterologist, hepatologist, diabetologist), liver biopsy performed (yes, no), and key patient clinical and demographic characteristics, including age (>65 years, ≤65 years), key comorbidities (hypertension, metabolic conditions [any of metabolic syndrome, T2DM, insulin resistance or hyperglycemia]), and ethnicity (White/Caucasian, Asian, Hispanic/Latino, Afro-Caribbean, other). Statistically significant differences were identified using univariate tests (t, chi-squared, Fisher’s exact and log rank tests). P-values of <0.05 were considered statistically significant; summary statistics were used to provide the size and direction of the difference.
Three sensitivity analyses were undertaken to test the assessment of alignment of fibrosis score:
1. VCTE-Suitable Cases
This involved exclusion of certain patient subgroups based on the recognition that VCTE might not be accurate enough in certain subgroups of patients, ie, patients aged ≥65 years, patients who are morbidly obese (body mass index [BMI] ≥35 kg/m2), patients with T2DM and patients with physician-reported hypertension. In this sensitivity analysis, the primary analysis was re-run including only patients who did not fall into any of the above categories to establish the degree of disconnect when accounting for these patient subgroups. This sensitivity analysis was conducted using the patient’s most recent test results, which were assumed to have been performed reasonably close to the survey data collection timepoint and therefore to reflect the patient’s condition at the time of the consultation.
2. VCTE Results at Diagnosis
As the timing of the above test results could not be confirmed, this sensitivity analysis was repeated using the VCTE test result and PSFS obtained at diagnosis, where available, to assess whether the pattern of misalignment was consistent over time. Tests and assessments upon which diagnosis was based would have been undertaken not long before diagnosis and therefore can be assumed to be time relevant. As the physician only recorded the patient’s most recent AST level, ALT level and platelet count data in the questionnaire, FIB-4 calculations could only be generated using the most recent test results, thereby limiting the second sensitivity analysis to VCTE scores.
3. Liver Biopsy
This analysis was performed to assess whether the degree of alignment might be influenced if a patient had undergone a liver biopsy, as this clinical assessment could supersede the FIB-4 or VCTE assessment and subsequent fibrosis assignment. Hence, analysis was repeated for those patients who had undergone a liver biopsy versus those who had not.
Results
Patients
The analysis population included 1844 patients, 1468 (80%) of whom had a PSFS. Despite current guidelines,24 257 patients had neither a VCTE score nor enough data to calculate a FIB-4 score and were excluded from the analysis. The analysis cohort therefore comprised 1211 patients. Overall, 524 patients (36%) had data enabling the calculation of a FIB-4 score and comprised the FIB-4 cohort (Figure 1B). A further 1115 patients (76%) had a VCTE score and comprised the VCTE cohort (Figure 1B). A subgroup of patients (n = 428) had both a VCTE score and a FIB-4 score and were included in the VCTE and FIB-4 cohorts. Patient characteristics are shown in Table 1.
 |
Table 1 Patient Demographics and Clinical Characteristics |
Overall, 494 patients (39%) were being managed by a hepatologist, 472 patients (41%) were being managed by a gastroenterologist and 245 patients (20%) were being managed by a diabetologist. Patient characteristics according to treating physician are shown in Supplemental Table 1. Patients managed by a hepatologist or gastroenterologist appeared to be older and had a higher BMI than those treated by a diabetologist (both p < 0.05). Concomitant metabolic factors (T2DM, insulin resistance, metabolic syndrome, hyperglycemia), hypertension and dyslipidemia were more common in patients treated by diabetologists (all p < 0.0001). Liver biopsy was more commonly performed in patients treated by gastroenterologists/hepatologists versus diabetologists (p < 0.05). Among the 694 NASH patients with concomitant T2DM, 498 patients (72%) were currently managed by a hepatologist or gastroenterologist and 196 patients (28%) were being managed by a diabetologist.
A total of 583 patients had undergone a liver biopsy and 531 patients had not. A higher proportion of patients with no liver biopsy had physician-stated F0−2 fibrosis than those with a liver biopsy whereas more patients with a liver biopsy had physician-stated F3/4 fibrosis. Characteristics of these patients are shown in Supplemental Table 2. A higher proportion of patients undergoing a liver biopsy had a BMI >35 kg/m2 (34% [n=215/638] vs 24% [n=136/573] for those with no biopsy), hypertension (55% [n=354/638] vs 44% [n=252/573], respectively), or a metabolic condition — T2DM, insulin resistance, metabolic syndrome, hyperglycemia or any combination (74% [n=470/638] vs 65% [n=370/573], respectively).
Fibrosis Stage
Physician-Stated and Clinically Defined Reference Fibrosis Assessment
As assessed by their physician, 204/1468 patients (14%) were considered to have fibrosis score F0, 565 patients (38%) were F1, 378 patients (26%) were F2, 203 patients (14%) were F3 and 118 patients (8%) were F4. Overall, 1147/1468 patients (78%) had a PSFS of F0–F2, indicating no fibrosis or early fibrosis and 321/1468 patients (22%) had a PSFS of F3/F4, indicating advanced fibrosis or cirrhosis.
FIB-4 scores were calculated for 524 patients. The mean FIB-4 score was 2.36 (standard deviation [SD] 1.56). Assignment of physician-stated F0–F2 and F3/F4 scores and published FIB-4 thresholds is shown in Figure 2A.
 |
Figure 2 Physician-stated fibrosis score according to published scoring systems. (A) Patients with a FIB-4 score and a PSFS; the PSFS is for the 524 patients with a FIB-4 score. (B) Patients with a VCTE score and a PSFS; the PSFS is for the 1115 patients with a VCTE score. (C) Alignment of PSFS and CRFS scoring according to published scoring systems. Scoring systems as previously published:15,18,19 I: Shah (FIB-4 90% Sen<1.3, Spe>2.67); II: Shah (FIB-4 90% Spe>2.67); III: Siddiqui (VCTE Youden 8.6); IV: Eddowes (VCTE Youden 9.7); V: Siddiqui (VCTE 90% Sen<6.5, Spe≥12.1); VI: Eddowes (VCTE 90% Sen<7.1, Spe≥14.1); VII: Siddiqui (VCTE 90% Spe≥12.1); VIII: Eddowes (VCTE 90% Spe≥14.1). All values are kPa. F0−2 indicates no fibrosis/early fibrosis; F3/4 indicates advanced fibrosis or cirrhosis. Abbreviations: CRFS, clinically defined reference fibrosis score; FIB-4, Fibrosis-4 Index; PSFS, physician-stated fibrosis score; Sen, sensitivity; Spe, specificity; VCTE, vibration-controlled transient elastography. |
Among the 1115 patients with an up-to-date VCTE scan, the mean liver stiffness was 19.5 kPa (SD 16.0). Assignment of F0–F2 and F4/F4 categorization according to physician assessment and published VCTE thresholds are shown in Figure 2B.
Alignment of Physician-Stated and Clinically Defined Reference Fibrosis Scores
Alignment of PSFS and FIB-4 scores was greatest using the Shah specificity only threshold (n=345/524; 66%; Figure 2C, scoring system II), although this also resulted in the highest fibrosis overestimation of all eight scoring systems (n=94/524; 18%; Figure 2C).
Alignment of PSFS and VCTE scores was greatest using Eddowes specificity only (n=731/1115; 66%; scoring system VIII) and lowest for Siddiqui sensitivity/specificity (n=336/678; 50%; scoring system V). Where results were not aligned, underestimation of the patient’s fibrosis was more common than overestimation. The extent of underestimation varied between the various derived approaches: this was greatest with the Siddiqui sensitivity/specificity threshold (n=341/678; 50%; scoring system V) and lowest with Eddowes specificity only (n=306/1115; 27%; scoring system VIII).
Alignment According to Treating Physician Specialty
The extent of misalignment of PSFS and available VCTE score according to physician specialty, specifically underestimation by physicians, is shown in Figure 3A (Siddiqui VCTE specificity ≥12.2 threshold) and Supplemental Figure S1A (all thresholds). Underestimation according to the specificity ≥12.2 threshold was 35% (n=73/211) among diabetologists, 32% (n=146/457) among gastroenterologists and 27% (n=122/447) among hepatologists (Figure 3A). Underestimation was greatest among diabetologists and lowest among hepatologists across almost all thresholds examined (Supplemental Figure S1A). Conversely, overestimation according to the Siddiqui VCTE specificity ≥12.2 threshold was greatest among hepatologists (9% [n=39/447]) versus diabetologists (3% [n=7/211]) and gastroenterologists (4% [n=17/457]). Differences in underestimation rates across physician specialties were statistically significant (p < 0.05) for all but two VCTE thresholds (Supplemental Figure S1A).
 |
Figure 3 Alignment of PSFS and CRFS scoring according to published scoring systems. All values are kPa. (A) Alignment of fibrosis using PSFS versus VCTE scores using the Siddiqui (VCTE specificity ≥12.1) threshold according to age, comorbidity, ethnicity, treating physician specialty and whether liver biopsy had been performed (VCTE cohort; n=1115); (B) alignment rates according to physician specialty and whether patients had undergone liver biopsy (VCTE cohort; n=1115). F0−2 indicates no fibrosis/early fibrosis; F3/4 indicates advanced fibrosis or cirrhosis. Metabolic indicates presence of any of: metabolic syndrome, T2DM, insulin resistance or hyperglycemia. (A) *p < 0.05, **p < 0.01, ***p < 0.0001. (B) **p < 0.001 for liver biopsy vs non-invasive testing. Abbreviations: CRFS, clinically defined reference fibrosis score; Diab, diabetologist; Gastro, gastroenterologist; Hep, hepatologist; PSFS, physician-stated fibrosis score; T2DM, type 2 diabetes mellitus; VCTE, vibration-controlled transient elastography. |
A similar pattern was observed when alignment of PSFS and FIB-4 score was analyzed according to physician specialty, with hepatologists generally having a higher rate of overestimation, especially when applying both the sensitivity and specificity ranges (Supplemental Figure S1A).
Alignment According to Patient Liver Biopsy Status
The extent of misalignment of PSFS and CRFS according to liver biopsy status is shown in Figure 3A (Siddiqui VCTE specificity ≥12.2 threshold) and Supplemental Figure S1B (all thresholds). Rates of under- and overestimation were higher in patients who had undergone a liver biopsy than those without a biopsy, particularly when VCTE thresholds were considered. To investigate whether this was influenced by physician specialty or a disease effect, we examined alignment rates according to physician specialty and whether patients had undergone liver biopsy. Among diabetologists, underestimation rates were 36% (n=35/96) for patients with a liver biopsy and 33% (n=38/115) for those without, whereas among hepatologists/gastroenterologists, underestimation rates were 32% (n=155/487) for patients with a liver biopsy and 27% (n=113/417) for those without; Figure 3B. Overestimation rates in hepatologists/gastroenterologists were 7% (n=33/487) for patients with a liver biopsy and 6% (n=23/417) for those without, whereas the overestimation rate in diabetologists was 5% (n=5/96) for patients with a liver biopsy and 2% (n=2/115) for those without.
Alignment According to Other Patient Demographic and Clinical Factors
Other confounding factors that could contribute to alignment or misalignment between PSFS and CRFS are shown in Figure 3A. Overestimation of fibrosis severity appeared to be more common in older versus younger patients, and in Asian and Afro-Caribbean patients.
Sensitivity Analyses
Results of the sensitivity analyses are shown in Figure 4. Exclusion of VCTE-unsuitable patients only minimally influenced the degree of misalignment (Figure 4A). Results did not appear to be sensitive to the timepoint used in most groups (Figure 4B). Statistically significant differences were seen between patients with a liver biopsy and those with no liver biopsy in two VCTE groups — VII and VIII (Figure 4C).
 |
Figure 4 Alignment between PSFS and CRFS: sensitivity analyses. (A) VCTE-suitable patients (excludes patients: aged ≥65 years; who are morbidly obese [body mass index ≥35 kg/m2]; with T2DM; or with physician-reported hypertension) versus VCTE non-suitable patients); (B) at-diagnosis VCTE data; and (C) liver biopsy versus no liver biopsy. F0−2 indicates no fibrosis/early fibrosis; F3/4 indicates advanced fibrosis or cirrhosis. (A) *p < 0.05, **p<0.01 vs VCTE-unsuitable patients. (B) **p < 0.01 vs current VCTE data. (C) **p < 0.01; ***p < 0.0001 for liver biopsy vs no liver biopsy. Scoring systems as previously published.15,18,19 All values are kPa. Abbreviations: CRFS, clinically defined reference fibrosis score; FIB-4, Fibrosis-4 Index; PSFS, physician-stated fibrosis score; T2DM, type 2 diabetes mellitus; VCTE, vibration-controlled transient elastography. |
Discussion
This comprehensive real-world analysis of alignment between PSFS and two CRFS approaches, FIB-4 and VCTE, applied a range of reference thresholds to identify patients with advanced fibrosis. Our analysis showed that misalignment of PSFS and CRFS was common in the real world, regardless of the threshold retrospectively applied. Physicians underestimated disease severity compared with FIB-4 scores in 16–33% of patients depending on the threshold used and in 27–50% of patients when VCTE scores were used as the reference standard. As expected, underestimation was minimized when the highest thresholds with greater specificity but lower sensitivity were used, eg, the Siddiqui and Eddowes specificity thresholds of 12.1 kPa and 14.1 kPa, respectively. This is in line with other studies correlating liver biopsy findings with VCTE scores, where better prediction of significant liver fibrosis occurred at higher thresholds.32 Caballería et al reported that almost two-thirds of patients with a VCTE score of ≥9.2 kPa had significant liver fibrosis and 95.8% of patients with scores of <9.2 kPa had F0 or F1 disease.32 Similarly, Eddowes et al found the highest F4 threshold accuracy at the maximum Youden’s Index of 13.6 kPa.15
Analysis of the extent of fibrosis underestimation among the different physician specialties identified more underestimation among diabetologists than in gastroenterologists or hepatologists. Conversely, hepatologists had higher overestimation rates than diabetologists or gastroenterologists. However, more patients treated by hepatologists had undergone a liver biopsy compared with other physician specialties and hepatologists may have had additional knowledge of test results that accurately staged patients for advanced fibrosis. Therefore, this observation might be influenced by some specialists having additional data to support their assessment of disease severity than indicated by non-invasive markers. Nonetheless, underestimation was considerable in all physician specialties, suggesting that education initiatives providing physicians with additional training in how to select and interpret results of non-invasive biomarkers and risk-stratification tools are important, potentially enhancing delivery of optimal, personalized patient-management approaches.
Other intrinsic patient factors, such as age, comorbidities and ethnicity, affected alignment of PSFS and CRFS. Underestimation was more common in older patients and those with metabolic conditions, in agreement with previous reports.16 The underlying causes for this are likely multifactorial. Patients with metabolic syndrome are most commonly treated by diabetologists, who had the highest underestimation rates and lowest liver biopsy rates in this study. Obesity — another factor associated with less accurate VCTE measurement — is also more common in metabolic patients. Under- and overestimation of fibrosis severity varied according to ethnicity, with higher rates in Afro-Caribbean and Asian patients. This might relate to a misconception that less overweight patients are unlikely to have advanced disease, particularly relevant to Asian patients who are less likely to have a high BMI at presentation.
Our sensitivity analyses supported the validity of the primary analysis. The extent of alignment of VCTE and PSFS was similar in the overall population and in VCTE-suitable patients (ie excluding patients aged ≥65 years and those with BMI ≥35 kg/m2, T2DM or hypertension, for whom VCTE is known to be less accurate). In contrast, the extent of alignment of FIB-4 and PSFS increased when these VCTE-suboptimal patients were removed from the analysis, hence allowing for (and confirming) more accurate fibrosis assessment. Results appeared to be unaffected by timepoint at which the data were collected and did not vary widely when data obtained at diagnosis or the most recent data were used. In contrast, however, availability of liver biopsy test results resulted in lower alignment rates versus no liver biopsy.
Some potential study limitations and strengths warrant consideration. Identification of patients with NASH was based on the physician’s judgment, as no formal definitions or guidelines were provided to physicians; this is likely to be representative of physicians’ real-world patient classification. Although patients were selected for this analysis based on availability of FIB-4 and/or VCTE results, some physicians had access to additional testing information for their patient, eg, liver biopsy results. Severity assessment in these cases might have been influenced by liver biopsy interpretation, but we could not assess liver biopsy results for further verification. Nonetheless, the value of non-invasive testing has been demonstrated by others.12,33–35 Physicians recorded the most recent test values with no date stamp for the test. Hence, values were assumed to be the current test value. Recall bias, a common limitation of surveys, might have affected physician responses to questionnaires. However, as physicians had access to patient medical records, this is unlikely to have influenced our findings. Finally, although our results are generalizable to the consulting population, the methodology required consecutively consulting patients to be included. Therefore, it is possible that patients who consulted the physician more frequently had a greater chance of inclusion.
Real-world studies such as the present analysis are increasingly being used to generate data that offer a more representative but complementary assessment to randomized controlled studies.29,36,37 They are inclusive of populations usually excluded from trials (ie, those who are older or presenting with cardiovascular comorbidities), thus enhancing external validity and generalizability of findings. This analysis provides an insight into diagnostic approaches in clinical practice, where outcomes vary according to physician specialty, accessibility of tests and patient characteristics. Indeed, even the absence of tests and procedures identified in this analysis, such as the apparently low use of FIB-4 as a triage tool, provides information on how patients are being managed by their health-care providers.
Conclusions
This comparison of PSFS and CRFS for staging NASH-associated fibrosis suggests that physician-estimated fibrosis score does not consistently align with established biomarker reference thresholds, resulting in many patients being assigned an incorrect, often lower, fibrosis stage. Although both over- and underestimation of disease severity are undesirable, underestimation, and failure to identify patients with advanced disease, is potentially the greater concern as it denies patients the opportunity for effective, focused clinical care — be that lifestyle modification or pharmaceutical treatment as drugs become available. This inaccuracy, which could adversely affect testing and referral choices alongside overall patient management, remained the case even when patients with body habitus less well suited to acquiring accurate VCTE data were removed from the analysis. These results highlight the importance of applying risk-stratification tools and assessment with standardized interpretation of findings. Further education might be needed to improve NAFLD patient triage to ensure optimal delivery of individual patient management in clinical care.
Data Sharing Statement
All data relevant to the analysis are included in the article. All data that support the findings of this survey are the intellectual property of Adelphi Real World. The datasets generated during and/or analyzed during the current study are available upon reasonable request to Victoria Higgins at Victoria. [email protected].
Ethics Approval and Informed Consent
Ethics approval was obtained from Freiburg Ethics Commission International (Approval No. 017/1931). All patients provided written informed consent for use of their data, which were anonymized and aggregated.
Acknowledgments
Medical writing support was provided by Deirdre Carman of Alispera Communications Ltd on behalf of Adelphi Real World. This research was presented in part as a poster presentation of interim findings at the International Liver Congress (EASL), 10−14 April 2019, Vienna, Austria (available at https://www.postersessiononline.eu/173580348_eu/congresos/ILC2019/aula/-SAT_305_ILC2019.pdf). The poster abstract of interim findings was published in the Journal of Hepatology (J Hepatol 2019;70(1):e773, available at https://www.journal-of-hepatology.eu/article/S0618-8278(19)31537-3/pdf, DOI 10.1016/S0618-8278(19)31537-3).
Funding
Data collection was undertaken by Adelphi Real World as part of an independent survey, entitled the Adelphi NASH DSP. Gilead Sciences, Inc. did not influence the original survey through either contribution to the design of questionnaires or data collection. The analysis described here used data from the Adelphi NASH DSP. The DSP is a wholly owned Adelphi product. Gilead Sciences, Inc. is one of multiple subscribers to the DSP. This analysis was funded by Gilead Sciences, Inc.
Disclosure
QMA is coordinator of the IMI2 LITMUS consortium, which is funded by the EU Horizon 2020 programme and EFPIA. This multi-stakeholder consortium includes industry partners. He reports research grant funding from AstraZeneca, Boehringer Ingelheim, Intercept; consultancy on behalf of Newcastle University for 89Bio, Alimentiv, Akero, AstraZeneca, Axcella, BMS, Boehringer Ingelheim, Galmed, Genentech, Genfit SA, Gilead, GlaxoSmithKline, Hanmi, HistoIndex, Intercept Pharma Europe Ltd, Inventiva, Ionis, IQVIA, Janssen, Madrigal, Medpace, Merck, NGMBio, Novartis, Novo Nordisk A/S, PathAI, Pfizer Ltd, Poxel, ProSciento, Resolution Therapeutics, Roche, Ridgeline Therapeutics, RTI, Shionogi, Terns; speaker fees from Fishawack, Integritas Communications, Kenes, Madrigal, MedScape, NovoNordisk, Springer Healthcare; participation on a Data Safety Monitoring Board on behalf of Newcastle University from Medpace (North Sea Therapeutics DSMB); and royalties from Elsevier Ltd. KH is supported by a National Institute for Health Research/Health Education England Clinical Lectureship (CAT CL-2013-04-010). NL, AH and EM are employees of Gilead. SK was employed by Gilead at the time this work was undertaken. JB has received consultancy payments from Gilead. GM, JP, and VH are employees of Adelphi Real World. The authors report no other conflicts of interest in this work.
References
1. Anstee QM, Targher G, Day CP. Progression of NAFLD to diabetes mellitus, cardiovascular disease or cirrhosis. Nat Rev Gastroenterol Hepatol. 2013;10(6):330–344. doi:10.1038/nrgastro.2013.41
2. Chalasani N, Younossi Z, Lavine JE, et al. The diagnosis and management of nonalcoholic fatty liver disease: practice guidance from the American Association for the Study of Liver Diseases. Hepatology. 2018;67(1):328–357. doi:10.1002/hep.29367
3. Younossi ZM, Koenig AB, Abdelatif D, Fazel Y, Henry L, Wymer M. Global epidemiology of nonalcoholic fatty liver disease—Meta-analytic assessment of prevalence, incidence, and outcomes. Hepatology. 2016;64(1):73–84. doi:10.1002/hep.28431
4. Harrison S, Wilman H, Kelly M, et al. Prevalence and stratification of NAFLD/NASH in a UK and US cohort using non-invasive multiparametric MRI. J Hepatol. 2018;68(Suppl 1):S550. doi:10.1016/S0168-8278(18)31359-X
5. Younossi Z, Anstee QM, Marietti M, et al. Global burden of NAFLD and NASH: trends, predictions, risk factors and prevention. Nat Rev Gastroenterol Hepatol. 2018;15(1):11–20. doi:10.1038/nrgastro.2017.109
6. Povsic M, Wong OY, Perry R, Bottomley J. A structured literature review of the epidemiology and disease burden of non-alcoholic steatohepatitis (NASH). Adv Ther. 2019;36(7):1574–1594. doi:10.1007/s12325-019-00960-3
7. McPherson S, Hardy T, Henderson E, Burt AD, Day CP, Anstee QM. Evidence of NAFLD progression from steatosis to fibrosing-steatohepatitis using paired biopsies: implications for prognosis and clinical management. J Hepatol. 2015;62(5):1148–1155. doi:10.1016/j.jhep.2014.11.034
8. Singh S, Allen AM, Wang Z, Prokop LJ, Murad MH, Loomba R. Fibrosis progression in nonalcoholic fatty liver vs nonalcoholic steatohepatitis: a systematic review and meta-analysis of paired-biopsy studies. Clin Gastroenterol Hepatol. 2015;13(4):643–654.e641–649;quiz e639–640. doi:10.1016/j.cgh.2014.04.014
9. Taylor RS, Taylor RJ, Bayliss S, et al. Association between fibrosis stage and outcomes of patients with nonalcoholic fatty liver disease: a systematic review and meta-analysis. Gastroenterology. 2020;158(6):1611–1625.e1612. doi:10.1053/j.gastro.2020.01.043
10. Hallsworth K, Adams LA. Lifestyle modification in NAFLD/NASH: facts and figures. JHEP Rep. 2019;1(6):468–479. doi:10.1016/j.jhepr.2019.10.008
11. Sumida Y, Nakajima A, Itoh Y. Limitations of liver biopsy and non-invasive diagnostic tests for the diagnosis of nonalcoholic fatty liver disease/nonalcoholic steatohepatitis. World J Gastroenterol. 2014;20(2):475–485. doi:10.3748/wjg.v20.i2.475
12. Anstee QM, Lawitz EJ, Alkhouri N, et al. Noninvasive tests accurately identify advanced fibrosis due to NASH: baseline data from the STELLAR trials. Hepatology. 2019;70(5):1521–1530. doi:10.1002/hep.30842
13. Ziecina R, Beasley S. Is liver biopsy a gold or an old standard in NAFL and NASH? International Biopharmaceutical Industry. 2019;2(4):20–23.
14. Boursier J, Vergniol J, Guillet A, et al. Diagnostic accuracy and prognostic significance of blood fibrosis tests and liver stiffness measurement by FibroScan in non-alcoholic fatty liver disease. J Hepatol. 2016;65(3):570–578. doi:10.1016/j.jhep.2016.04.023
15. Eddowes PJ, Sasso M, Allison M, et al. Accuracy of FibroScan controlled attenuation parameter and liver stiffness measurement in assessing steatosis and fibrosis in patients with nonalcoholic fatty liver disease. Gastroenterology. 2019;156(6):1717–1730. doi:10.1053/j.gastro.2019.01.042
16. Castéra L, Foucher J, Bernard PH, et al. Pitfalls of liver stiffness measurement: a 5-year prospective study of 13,369 examinations. Hepatology. 2010;51(3):828–835. doi:10.1002/hep.23425
17. Puri P, Sanyal AJ. Nonalcoholic fatty liver disease: definitions, risk factors, and workup. Clin Liver Dis. 2012;1(4):99–103. doi:10.1002/cld.81
18. Shah AG, Lydecker A, Murray K, Tetri BN, Contos MJ, Sanyal AJ. Comparison of noninvasive markers of fibrosis in patients with nonalcoholic fatty liver disease. Clin Gastroenterol Hepatol. 2009;7(10):1104–1112. doi:10.1016/j.cgh.2009.05.033
19. Siddiqui MS, Vuppalanchi R, Van Natta ML, et al. Vibration-controlled transient elastography to assess fibrosis and steatosis in patients with nonalcoholic fatty liver disease. Clin Gastroenterol Hepatol. 2019;17(1):156–163.e152. doi:10.1016/j.cgh.2018.04.043
20. Vilar-Gomez E, Chalasani N. Non-invasive assessment of non-alcoholic fatty liver disease: clinical prediction rules and blood-based biomarkers. J Hepatol. 2018;68(2):305–315. doi:10.1016/j.jhep.2017.11.013
21. Park SH, Kim SY, Suh CH, et al. What we need to know when performing and interpreting US elastography. Clin Mol Hepatol. 2016;22(3):406–414. doi:10.3350/cmh.2016.0106
22. Sterling RK, Lissen E, Clumeck N, et al. Development of a simple noninvasive index to predict significant fibrosis in patients with HIV/HCV coinfection. Hepatology. 2006;43(6):1317–1325. doi:10.1002/hep.21178
23. McPherson S, Hardy T, Dufour JF, et al. Age as a confounding factor for the accurate non-invasive diagnosis of advanced NAFLD fibrosis. Am J Gastroenterol. 2017;112(5):740–751. doi:10.1038/ajg.2016.453
24. European Association for the Study of the Liver (EASL)., European Association for the Study of Diabetes (EASD). & European Association for the Study of Obesity (EASO). EASL-EASD-EASO clinical practice guidelines for the management of non-alcoholic fatty liver disease. Diabetologia. 2016;59(6):1121–1140. doi:10.1007/s00125-016-3902-y
25. Alexander M, Loomis AK, Fairburn-Beech J, et al. Real-world data reveal a diagnostic gap in non-alcoholic fatty liver disease. BMC Med. 2018;16(1):130. doi:10.1186/s12916-018-1103-x
26. Nascimbeni F, Pais R, Bellentani S, et al. From NAFLD in clinical practice to answers from guidelines. J Hepatol. 2013;59(4):859–871. doi:10.1016/j.jhep.2013.05.044
27. Sheridan DA, Aithal G, Alazawi W, et al. Care standards for non-alcoholic fatty liver disease in the United Kingdom 2016: a cross-sectional survey. Frontline Gastroenterol. 2017;8(4):252–259. doi:10.1136/flgastro-2017-100806
28. Anderson P, Benford M, Harris N, Karavali M, Piercy J. Real-world physician and patient behaviour across countries: disease-specific programmes – a means to understand. Curr Med Res Opin. 2008;24(11):3063–3072. doi:10.1185/03007990802457040
29. Babineaux SM, Curtis B, Holbrook T, Milligan G, Piercy J. Evidence for validity of a national physician and patient-reported, cross-sectional survey in China and UK: the disease specific programme. BMJ Open. 2016;6(8):e010352. doi:10.1136/bmjopen-2015-010352
30. Higgins V, Piercy J, Roughley A, et al. Trends in medication use in patients with type 2 diabetes mellitus: a long-term view of real-world treatment between 2000 and 2015. Diabetes Metab Syndr Obes. 2016;9:371–380. doi:10.2147/DMSO.S120101
31. Ruopp MD, Perkins NJ, Whitcomb BW, Schisterman EF. Youden index and optimal cut-point estimated from observations affected by a lower limit of detection. Biom J. 2008;50(3):419–430. doi:10.1002/bimj.200710415
32. Caballería L, Pera G, Arteaga I, et al. High prevalence of liver fibrosis among European adults with unknown liver disease: a population-based study. Clin Gastroenterol Hepatol. 2018;16(7):1138–1145.e1135. doi:10.1016/j.cgh.2017.12.048
33. Mózes FE, Lee JA, Selvaraj EA, et al. Diagnostic accuracy of non-invasive tests for advanced fibrosis in patients with NAFLD: an individual patient data meta-analysis. Gut. 2022;71(5):1006–1019.
34. Selvaraj EA, Mózes FE, Jayaswal ANA, et al. Diagnostic accuracy of elastography and magnetic resonance imaging in patients with NAFLD: a systematic review and meta-analysis. J Hepatol. 2021;75(4):770–785. doi:10.1016/j.jhep.2021.04.044
35. Davyduke T, Tandon P, Al-Karaghouli M, Abraldes JG, Ma MM. Impact of implementing a “FIB-4 first” strategy on a pathway for patients with NAFLD referred from primary care. Hepatol Commun. 2019;3(10):1322–1333. doi:10.1002/hep4.1411
36. Seeger JD, Nunes A, Loughlin AM. Using RWE research to extend clinical trials in diabetes: an example with implications for the future. Diabetes Obes Metab. 2020;22(Suppl3):35–44. doi:10.1111/dom.14021
37. Camm AJ, Fox KAA. Strengths and weaknesses of ‘real-world’ studies involving non-vitamin K antagonist oral anticoagulants. Open Heart. 2018;5(1):e000788. doi:10.1136/openhrt-2018-000788
 © 2023 The Author(s). This work is published and licensed by Dove Medical Press Limited. The
full terms of this license are available at https://www.dovepress.com/terms
and incorporate the Creative Commons Attribution
- Non Commercial (unported, 3.0) License.
By accessing the work you hereby accept the Terms. Non-commercial uses of the work are permitted
without any further permission from Dove Medical Press Limited, provided the work is properly
attributed. For permission for commercial use of this work, please see paragraphs 4.2 and 5 of our Terms.
© 2023 The Author(s). This work is published and licensed by Dove Medical Press Limited. The
full terms of this license are available at https://www.dovepress.com/terms
and incorporate the Creative Commons Attribution
- Non Commercial (unported, 3.0) License.
By accessing the work you hereby accept the Terms. Non-commercial uses of the work are permitted
without any further permission from Dove Medical Press Limited, provided the work is properly
attributed. For permission for commercial use of this work, please see paragraphs 4.2 and 5 of our Terms.