Back to Journals » Journal of Hepatocellular Carcinoma » Volume 10
AHSA1 Regulates Hepatocellular Carcinoma Progression via the TGF-β/Akt-Cyclin D1/CDK6 Pathway
Authors Gao Y ![]() , Li Y, Liu Z, Dong Y, Yang S, Wu B, Xiao M, Chen C, Wen Y, Chen L, Jiang H, Yao Y
, Li Y, Liu Z, Dong Y, Yang S, Wu B, Xiao M, Chen C, Wen Y, Chen L, Jiang H, Yao Y ![]()
Received 8 February 2023
Accepted for publication 24 October 2023
Published 8 November 2023 Volume 2023:10 Pages 2021—2036
DOI https://doi.org/10.2147/JHC.S407680
Checked for plagiarism Yes
Review by Single anonymous peer review
Peer reviewer comments 2
Editor who approved publication: Prof. Dr. Jörg Trojan
Yanjun Gao,1,2 Yingge Li,1,2 Zheming Liu,1,2 Yi Dong,1,2 Siqi Yang,1,2 Bin Wu,1,3 Mengxia Xiao,1,4 Chen Chen,5 Yingmei Wen,1,2 Lei Chen,1 Haijuan Jiang,6 Yi Yao1,2
1Cancer Center, Renmin Hospital of Wuhan University, Wuhan, 430060, People’s Republic of China; 2Hubei Provincial Research Center for Precision Medicine of Cancer, Wuhan, 430200, People’s Republic of China; 3Department of Oncology, Huang-Gang Central Hospital, Huanggang, 438000, People’s Republic of China; 4Department of Oncology, Yichun People’s Hospital, Yichun, 336000, People’s Republic of China; 5Department of Hepatobiliary Surgery, Renmin Hospital of Wuhan University, Wuhan, 430060, People’s Republic of China; 6Cyrus Tang Hematology Center, Collaborative Innovation Center of Hematology, Soochow University, Suzhou, People’s Republic of China
Correspondence: Yi Yao, Email [email protected]
Background: Activator of heat shock protein 90 (HSP90) ATPase Activity 1 (AHSA1) regulates proliferation, apoptosis, migration, and invasion of osteosarcoma and hepatocellular carcinoma (HCC). However, the novel mechanism of AHSA1 in the tumor biology of hepatocellular carcinoma (HCC) remains unclear.
Methods: We analyzed AHSA1 expression in 85 pairs of clinical samples of HCC and the Cancer Genome Atlas database. The role of AHSA1 in HCC was proved by cell proliferation, colony formation, migration, cell cycle analysis in vitro, xenograft models and tumor metastasis assay in vivo, and bioinformatics.
Results: High AHSA1 expression was demonstrated in HCC and associated with invasive depth, clinical stage, and poor overall survival of patients. Univariate Cox analysis confirmed that AHSA1 was an independent prognostic factor for patients with HCC. Meanwhile, AHSA1 upregulation promoted cell proliferation, colony formation, and cell migration in vitro and tumor cell proliferation and metastasis of HCC cells in vivo. AHSA1 upregulation increased the cell cycle transition from G1 to S phase by increasing the expression of cyclinD1, cyclinD3, and cyclin-dependent kinase 6(CD). Transforming growth factor beta 1 (TGF-β 1)-induced protein kinase B (Akt) signaling regulated the expression of downstream targets, including cyclinD1. AHSA1 expression was closely correlated with the expression of TGF-β, Akt, cyclinD1, cyclinD3, and CDK6 using the Gene Expression Profiling Interactive Analysis database. AHSA1 upregulation participated in HCC progression by regulating TGF-β/Akt-cyclinD1/CDK6 signaling.
Conclusion: AHSA1 might serve as a biomarker for predicting the clinical outcome of patients with HCC. It is vital in tumor metastasis and disease progression of HCC and may facilitate the development of clinical intervention strategies against HCC.
Keywords: AHSA1, AKT/cyclinD1/CDK6 signaling, cell cycle, hepatocellular carcinoma, TGF-β
Introduction
Hepatocellular carcinoma (HCC) is the sixth most common and malignant tumor worldwide and the third leading cause of cancer-related mortality in China.1,2 The risk factors associated with HCC include viral hepatitis, particularly hepatitis B virus infection as the most important factor, alcoholic liver disease, nonalcoholic fatty liver disease, metabolic syndrome, and so forth.3 The poor prognosis of HCC is mainly because most patients with HCC are in the intermediate and advanced stages when they are diagnosed and have a survival time of less than 3–6 months.4 Patients with early-stage liver cancer can undergo surgery or radiofrequency ablation. The age-standardized 5-year relative survival rate for HCC is only 18.1%.5,6 Sorafenib and lenvatinib, as two clinically approved targeted-therapy drugs, could extend the overall survival only by 2–3 months.7,8 Immunotherapy has many issues, such as uncertain efficacy, low objective remission rate, numerous side effects, and drug resistance even if patients benefit from it.9,10 Therefore, novel HCC targets and pathogenesis are urgently needed.
AHSA1, an activator of HSP90 ATPase Activity 1, is one of the partners of heat shock 90 kDa (heat shock protein 90, HSP90), which can stimulate the ATPase activity of HSP90 and participate in the maturation, stabilization, degradation, and function of oncogenic proteins.11,12 The relationship between AHSA1 and tumors has been studied successively in recent years. AHSA1 could regulate the proliferation, apoptosis, migration, and invasion of osteosarcoma by regulating the Wnt/β-catenin signaling pathway and its negative regulators.13 The knockdown of AHSA1 significantly inhibited the migration and invasion of MCF-7 and MDA-MB-231 breast cancer cells.14 AHSA1 expression increased in multiple myeloma (MM) samples, which was significantly associated with MM recurrence and poor outcomes. Furthermore, AHSA1 acted as a co-chaperone of HSP90A to activate CDK6 and non-ATPase 1 and 2(PSMD2) in vitro and in vivo, promoting MM cell proliferation and proteasome inhibitor (PI) resistance.13 The miR-338-3p overexpression resulted in a significant decrease in AHSA1 protein levels in MG63 and Saos2 cells. The AHSA1 overexpression reversed the inhibitory effect of miR-338-3p overexpression on proliferation, cell cycle, apoptosis, EMT, migration, and proliferation of MG63 and Saos2 cells.15 LINC00707 was overexpressed in osteosarcoma cell lines, and silencing LINC00707 could inhibit cell proliferation, migration, and invasion in MG-63 and Saos2 cells by targeting the miR-338-3p/AHSA1 axis.16 AHSA1 knockdown decreased the proliferation, cell migration, and invasion ability of HCC cells.17 However, the novel mechanisms underlying the involvement of AHSA1 in HCC tumorigenesis and development are still not fully understood. Our novel mechanistic studies revealed that AHSA1 upregulation participated in HCC progression by regulating TGF-β/AKT-cyclinD1/CDK6 signaling. Hence, the findings might provide new insights into the development of clinical intervention strategies against HCC.
Materials and Methods
Patients and HCC Tissues
A total of 85 pairs of HCC tumor tissues and matched adjacent nontumor tissues on tissue microarrays (HLivH180Su10), including clinical and pathological information, were purchased from Shanghai Outdo Biotech Co., Ltd. (Shanghai, China) (http://www.superchip.com.cn/). All samples were grouped based on sex, age, tumor size, invasive depth, pathological grade, lymph node metastasis, metastasis, and TNM stage (TNM stages were categorized according to the 7th edition of the American Joint Committee on Cancer Staging Manual). The patient consent and approval from Ethical Requirements for human biobanking in the National Standard GB/T 38736–2020 of the People’s Republic of China.
Immunohistochemistry and Scoring
Immunohistochemistry (IHC) was performed as described previously.18 The immunostaining intensity of AHSA1 in HCC tissues was categorized as negative (0), low (1), medium (2), or high (3). Staining intensity, which represented the percentage of positively stained cells, was evaluated and assigned scores as follows: 1 (≤ 10%), 2 (11–10%), 3 (51–75%), or 4 (> 75%), based on a questionnaire. To perform statistical analysis, overall expression scores ranging from 0 to 12 were calculated by multiplying the intensity scores with the range scores. The final staining score was then classified as either low (≤3 overall) or high (> 3 overall).
The antibodies including anti-AHSA1 (1:100, 14725-1-AP, Proteintech Company, anti-Ki67 (1:100, AF0198, Affinity, China), anti-activated caspase 3 (1:100; Cell Signaling, anti-cyclinD1 (1:200, #9932, Cell Signaling), anti-cyclinD3 (1:200, #9932, Cell Signaling), anti-CDK6 (1:1000, #13331, Cell Signaling), and anti-pAkt-Ser473 (1:200, #4060, Cell Signaling Technology).
Cell Lines and Cell Culture
Human hepatocellular carcinoma cell lines (SMMC-7721 and SK-Hep1) were purchased from and authenticated by the Typical Culture Preservation Commission Cell Bank (Chinese Academy of Sciences, Shanghai, China). All cell lines were cultured in Dulbecco’s modified Eagle’s medium (DMEM) (Gibco BRL) supplemented with 10% fetal bovine serum (FBS) (Gibco), 100 U/mL penicillin, and 100 µg/mL streptomycin. All cultures were maintained at 37°C in the presence of 5% CO2.
Lentivirus Transduction
The lentiviruses, packaged with the pCDH-CMV-MCS-GFP-FLAG-Amp vector containing a full coding region of the AHSA1 gene (NM_012111.3), were donated by Soochow University. Puromycin (2 μg/mL) was used for the selection of stable clones. All functional experiments were conducted within 2 weeks following the lentiviral infection.
Western Blot Analysis
The protein extractions and Western blotting were performed as described previously.18 The primary antibodies included antibodies against AHSA1 (1:2000, 14725-1-AP, Proteintech Company), p-AKT (Ser473) (1:2000, #4060, Cell Signaling Technology), and those contained in the Cell Cycle Regulation Sampler Kit ½ (cyclinD1, cyclinD3, and CDK6) (all 1:1000, #9932, Cell Signaling Technology). Glyceraldehyde-3-phosphate dehydrogenase (GAPDH) was used as a loading control to normalize the protein signal. The protein bands on the blots were visualized using enhanced chemiluminescence (ECL) reagent and quantified using ImageJ software for densitometry analysis. Each experiment was repeated at least three times.
Cell Proliferation Assays
HCC cells were seeded in triplicate at a density of 1×10⁴ cells per well in 24-well plates and cultured at 37°C in the presence of 5% CO2 for 1–4 days. Then, 20 µL of cell counting kit-8 (CCK-8, CK04, Dojindo, Japan) solution was added into each well. The cells were incubated at 37°C for another 4 h. The absorbance at 450 nm was measured with a microplate reader. Each experiment was repeated at least three times.
Cell Cycle Analysis
The cell cycle analysis was performed as described previously.18 For this, 5×10⁵ HCC cells were collected, washed with phosphate-buffered saline (PBS), and immobilized in 70% cold ethanol for 1 h. The cell suspensions were then centrifuged and washed twice with PBS to remove ethanol. Next, 100μL of RNaseA was added and incubated at 37°C for 30 min. Propidium iodide (25 μg/mL; Sigma was added and mixed. The samples were then analyzed by flow cytometry.
Soft Agar Assay
The cells in the logarithmic growth phase were taken, and the cell density was adjusted to 1×10⁶ cells/L. Then, gradient dilutions were made according to the experimental requirements. Two concentrations of low-melting-point agarose solutions, 1.2% and 0.7%, were prepared with distilled water. After autoclaving, they were maintained at 40°C without coagulation. After mixing 1.2% agarose and 2×dulbecco’s modified eagle medium (DMEM) (containing 2× antibiotics and 20% calf serum) at a ratio of 1:1, 1 mL of the mixture was injected into a 35-mm-diameter plate, cooled, solidified, and used as bottom agar in a CO2 incubator. After mixing 0.7% agarose and 2× DMEM in a sterile test tube at a ratio of 1:1, 0.2 mL of the cell suspension was added to the tube and mixed well. The bottom layer was injected with 1.2% agarose. In a plate, a double agar layer was gradually formed. After the upper layer of agar solidified, it was placed in an incubator at 37°C in the presence of 5% CO2 for 10–14 days. The dish was placed under an inverted microscope, and the number of cell clones was observed. Then, the clone formation rate was calculated.
Boyden Chamber Cell Migration Assays
The effect of AHSA1 on cell migration was measured using Boyden chambers (8-μm pores, Corning Star, MA, USA). The cells in the serum-free medium (5 × 10⁵ cells/200μL) were placed in the upper chamber of the Transwell plate. Then, 0.8 mL of the medium containing 10% FBS was added to the lower chamber. After 6–48 h of incubation at 37°C, the chambers were removed and the cells that migrated and adhered to the lower surface of the membrane were fixed with 100% methanol for 5 min. The fixed chambers were stained with 0.5% crystal violet for 5 min. The cells were counted in randomly selected fields (original magnification, 200×). Each experiment was repeated at least three times.
Enzyme-Linked Immunosorbent Assay
The used antigen was diluted with coating diluent to an appropriate concentration (generally, the required amount of antigen coating was 20–200 μg per well). Next, 100μL of the antigen was added to each well and set at 37°C for 4 h or 4°C for 24 h. The liquid in the hole was discarded. For blocking the enzyme-labeled reaction, 5% calf serum was placed at 37°C for 40 min. The wells were washed three times with washing solution, each time for 3 min. Generally, a dilution of 1:50–1:400 was used for detection. The samples were added to the enzyme-labeled reaction wells. At least two wells were added to each sample, 100 μL per well, and placed at 37°C for 40–60 min. The wells were washed three times with washing solution, each time 3 min. Next, 100 μL of the of enzyme-labeled antibody was added to each well and incubated at 37°C for 30–60 min. The wells were washed again as earlier. Then, 100μL of tetramethyl benzidine (TMB)-hydrogen peroxide urea solution substrate was added to each well and placed at 37°C for 3–5 min in the dark. The stop solution was added for color development. Further, 50 μL of stop solution was added to each well to stop the reaction, and the experimental results were obtained within 20 min. The absorption was measured at a wavelength of 450 nm per well.
Xenograft Assays
The xenograft assays were essentially performed as described previously.18 BALB/c nude male mice, aged 4–6 weeks, were purchased from Shanghai Jihui Laboratory Animal Care Co.,Ltd and maintained under specific-pathogen-free conditions.
Each mouse was implanted with SMCC-7721-AHSA1 on the right dorsal side (2 × 10⁶ SMMC-7721-AHSA1) and SMCC-7721-Control on the left dorsal side. The tumor growth was evaluated by measuring the length and width of the tumors with calipers. The tumor volume was calculated using the formula [width × 2 × (pi/6)]. The tumors were harvested for immunohistochemistry (IHC) after 4 weeks of postmortem.
As part of the metastasis assay, 200μL of HCC cells (1 × 10⁷ cells/mL) were xenografted into nude mice by tail vein injection. The mice were sacrificed after 12 weeks, and the lungs and livers were harvested. Hematoxylin and eosin staining was performed on the whole lung and liver. The number and diameter of all lung and liver metastases were counted. SK-AHSA1 and SK-Control cells were infected with lentivirus containing the luciferase vector to generate SK-AHSA1-luciferase and SK-Control-luciferase cells. Then, 5×10⁶ cells in 200μL were xenografted into nude mice via tail vein injection. After 8 weeks, mice with 150 mg/kg body weight were injected intraperitoneally (i.p.) with D-luciferin (15 mg/mL, 122799, PerkinElmer. The mice were imaged after 15 min using the In Vivo IVIS Lumina XRMS Series III imaging system (PerkinElmer) for lung metastasis analysis. The ethics committee of Soochow University approved all experimental protocols. The name of the guidelines followed for the welfare of the laboratory animals is China National Standard GBT 35892–2018 Guidelines.
Bioinformatics Analysis
Clinical data related to AHSA1 were downloaded from UALCAN database (https://ualcan.path.uab.edu/analysis.html). RNA-Seq was performed and analyzed to explore the mechanism of AHSA1 involved HCC growth and metastasis in GENEWIZ (Suzhou, China). Gene ontology (GO) and Kyoto Encyclopedia of Genes and Genomes (KEGG) pathway enrichment analysis were performed for the AHSA1-relevant genes using the clusterProfiler package (version 3.14.3) by GENEWIZ (Suzhou, China).
Statistical Analysis
The data were expressed as mean ± standard deviation (SD) from at least three independent experiments. The SPSS 20.0 software (SPSS Inc, R language, and GraphPad Prism 7.0 software were used for all data analysis. The independent- or paired-sample Student t test was used to compare two groups with Gaussian data. The clinical relevance was analyzed using Pearson’s chi-square test. Univariate Cox regression analyses were utilized to evaluate the potential and independent prognostic value of AHSA1 regarding OS. The statistical significance was indicated by asterisks (*P < 0.05, **P < 0.01, and ***P < 0.001).
Results
AHSA1 Expression was Upregulated and Associated with Clinicopathological Characteristics and Overall Survival
We performed IHC staining on 85 pairs of primary tumor tissues versus adjacent nontumor tissues and found that the AHSA1 protein was predominantly expressed in the cytoplasm and membrane of tumor cells and highly expressed in tumor tissues but lowly expressed in adjacent nontumor tissues (Figure 1A). According to the scoring of IHC staining, the patients were divided into high (N = 43) and low (N = 42) expression groups. The quantitative analysis of IHC scores revealed that AHSA1 was significantly upregulated in tumor tissues versus adjacent tissues (6.52 ± 0.48 vs 2.94 ± 0.25) (P < 0.01) (Figure 1B). The analysis of the clinicopathological features showed that invasive depth, tumor size, and TNM stage were significantly correlated with patient overall survival (P < 0.05); however, other features, including age, sex, metastasis, lymph node metastasis, and pathological grade did not correlate with overall survival (Table 1). These results suggested that AHSA1 might be a poor prognostic factor for HCC initiation and progression.
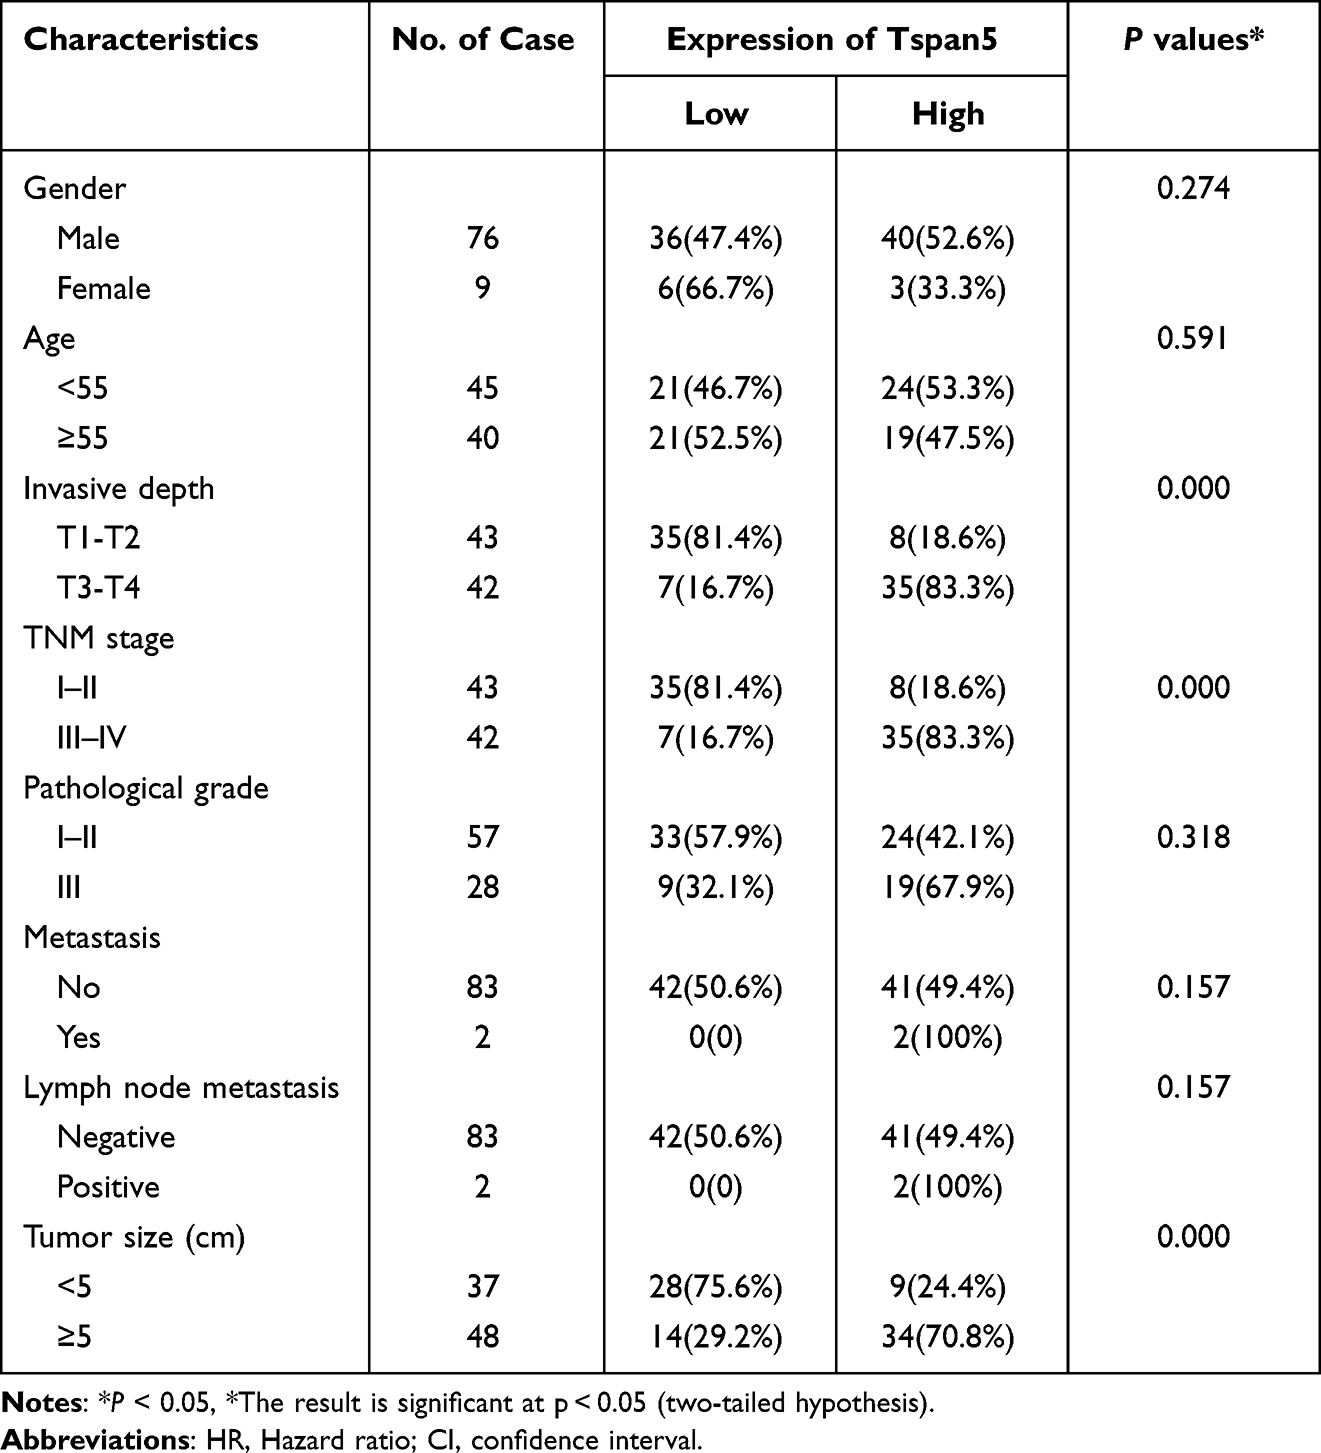 |
Table 1 Association of AHSA1 Expression with Clinicopathological Characteristics of 85 HCC Patients (*χ2-Test) |
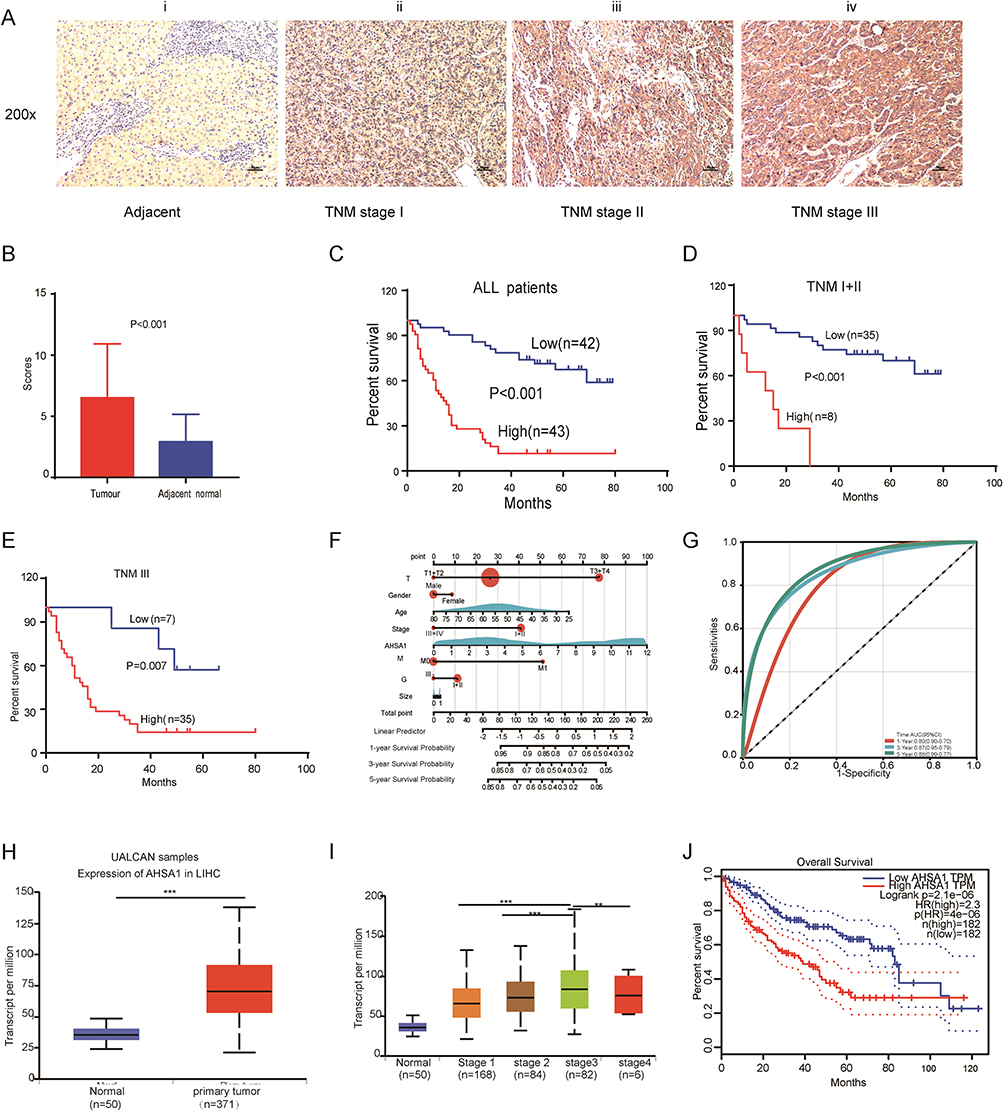 |
Figure 1 AHSA1 expression was upregulated and associated with clinicopathological characteristics and overall survival. (A) AHSA1 expression was associated with the staging of HCC: (i) negative in adjacent normal tissues, (ii) weak in TNM stage I, (iii) moderate in TNM stage II, and (iv) strong in TNM stage III. 200× magnification, scale bar 50 μm. (B) AHSA1 expression was significantly higher in 85 pairs of primary HCC tissues than in adjacent nontumor tissues (N = 85, paired-sample t test). (C) Kaplan–Meier survival analysis showed that AHSA1 expression was negatively correlated with the overall survival of all 85 patients with HCC (Log rank test). (D) Kaplan–Meier survival analysis showed that AHSA1 expression was negatively correlated with the overall survival of 43 patients with HCC with TNM stage I + II (Log rank test). (E) Kaplan–Meier survival analysis showed that AHSA1 expression was negatively correlated with the overall survival of 42 patients with HCC with TNM stage III (Log rank test). (F) Nomogram based on AHSA1 expression and sex, age, survival time, survival status, pathological staging, invasive depth, TNM stage, pathological grade, metastasis, and tumor size using Cox regression. R package “rms”, in 85 samples (C-index = 0.76). (G) Prognostic efficacy of AHSA1 in HCC overall survival. ROC function analysis, AUC of 0.80, 0.87, and 0.88 for 1, 3, and 5 years. (H) Bioinformatics analyses of AHSA1 transcripts in normal tissues and primary tumor tissues of LIHC in the UALCAN database (Student t test, ***P < 0.001). (I) AHSA1 transcripts were closely correlated with the TNM stage of patients with HCC (Student t test, ***P < 0.001, **P < 0.01). (J) AHSA1 transcripts were closely correlated with the overall survival of patients with HCC (Log rank test). |
Kaplan–Meier survival analysis revealed a notable correlation between AHSA1 expression and overall survival in all patients (Figure 1C) and patients with TNM stage I + II (Figure 1D) and TNM stage III (Figure 1E). UALCAN database–analyzed AHSA1 transcripts were closely correlated with the TNM stage of patients with HCC (Figure S1B). The univariate Cox regression analysis of the data of 85 patients with HCC patients revealed that the invasive depth and TNM stage were the potential prognostic factors (Table 2). We established a nomogram (Figure 1F) using the Cox method with the R package “rms”, which integrated data on survival time, survival status, and eight features, and assessed the prognostic significance of these features in 85 samples (C-index = 0.76). Subsequently, we analyzed the prognostic efficacy of AHSA1 in HCC overall survival using Receiver Operating Characteristic (ROC) and found that AHSA1 performed well in HCC with AUC of 0.80, 0.87, and 0.88 for 1, 3, and 5 years, respectively (Figure 1G). Consistently, the bioinformatics analyses of the UALCAN database (http://ualcan.path.uab.edu/index.html) showed that AHSA1 transcripts were also significantly upregulated in tumor tissues compared with adjacent tissues (Figure 1H–J). Thus, the results suggested that high expression of AHSA1 was an important independent predictor of poor overall survival.
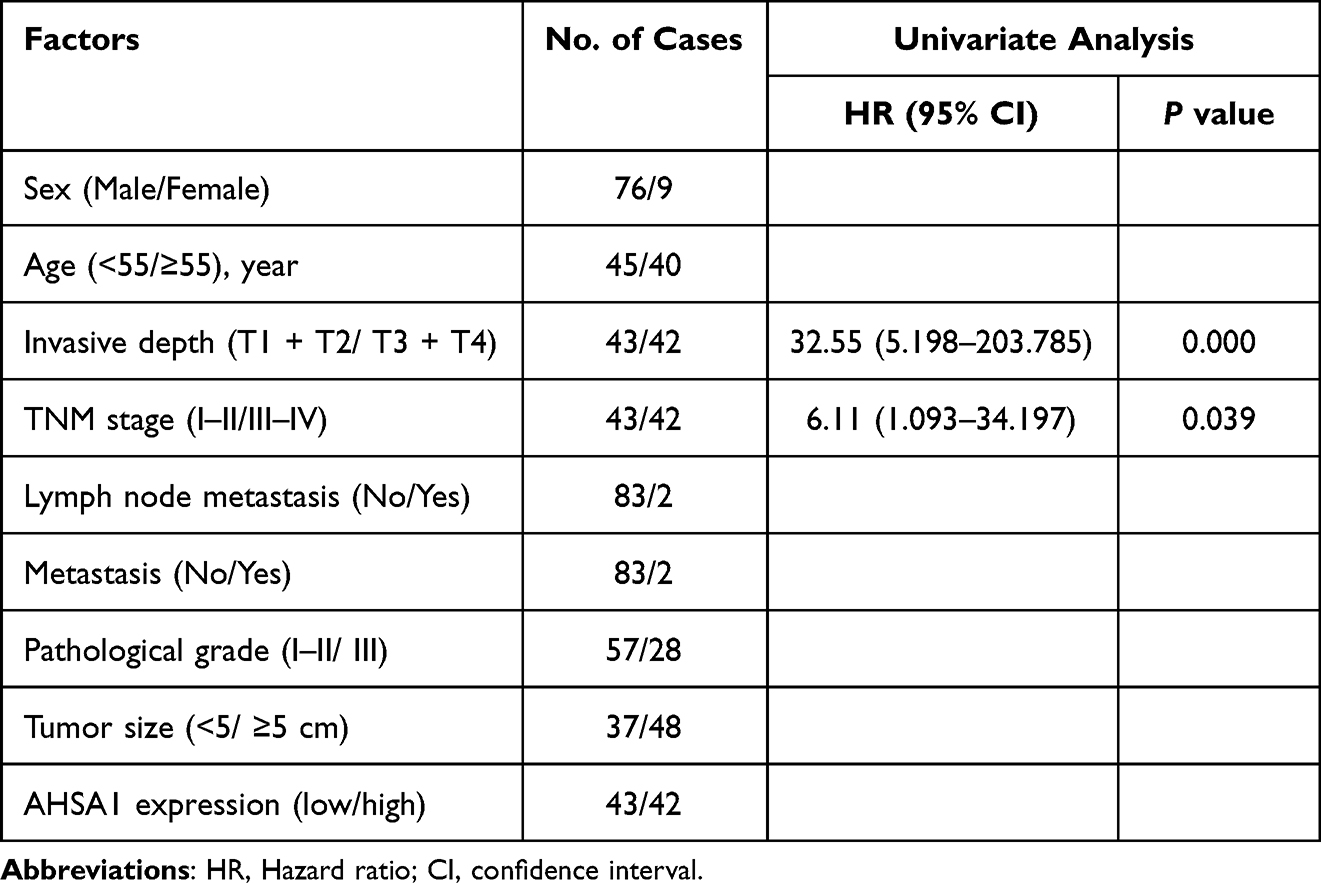 |
Table 2 Univariate Analysis of Potential Prognostic Factors in 85 HCC Cancer Patients |
AHSA1 Upregulation Promoted HCC Proliferation, Colony Formation, and Migration in vitro and in vivo
We conducted a series of studies to investigate how AHSA1 promoted liver cancer growth and metastasis. First, we increased the AHSA1 expression in SMMC-7721 and SK-HEP1 cell lines by retrovirus-mediated transduction. Western blotting verified that AHSA1 was significantly upregulated in two cell lines compared with the empty vector–containing retrovirus control (Figure 2A). The CCK-8 proliferation assays demonstrated that AHSA1 promoted cell proliferation of either SMCC7721 or SK-HEP1 cells compared with the relative control cells (P < 0.001) (Figure 2B). The soft agar assay showed that AHSA1 significantly increased the colony formation of SMCC7721 and SK-HEP1 cells (P < 0.001) (Figure 2C). Boyden chamber migration assays showed that AHSA1 significantly inhibited the migration of SMCC7721 and SK-HEP1 cells to the basal compartment (both P < 0.001) (Figure 2D).
 |
Figure 2 AHSA1 upregulation promoted HCC proliferation, colony formation, and migration in vitro and in vivo. (A) Western blotting confirmed the AHSA1 upregulation in both SMCC7721 and SK-HEP1 cell lines. (B) CCK-8 assays showed that AHSA1 upregulation induced the growth of SMCC7721 and SK-HEP1 cells (Student t test, **P < 0.01,***P< 0.001). (C) Soft agar assay showed that AHSA1 significantly increased the colony formation of SMCC7721 and SK-HEP1 cells (Student t test, ***P < 0.001). (D) Boyden chamber migration assays showed that AHSA1 significantly increased the migration of SMCC7721 and SK-HEP1 cells (Student t test, **P < 0.01, ***P < 0.001). (E and F) AHSA1 upregulation promoted the tumor growth of SMCC7721 cells in BALB/c nude mice. The data (mean ± SD, n = 6) (Student t test, *P < 0.05, ***P < 0.001). (G) IHC and quantification of scoring for AHSA1, Ki67, and activated caspase 3 on the xenograft sections of SMCC7721 cells (Student t test, **P < 0.01). (H) AHSA1 upregulation promoted the tumor metastasis of SK-HEP1 cells injected through the tail vein in BALB/c nude mice. (I) Kaplan–Meier survival analysis showed that AHSA1 expression was negatively correlated with overall survival in vivo (Log rank test,). |
We then implanted HCC cells into nude mice. AHSA1 upregulation significantly increased tumor growth (SMCC7721-AHSA1 vs SMCC7721-LV, P < 0.05) (Figure 2E and F). The IHC staining for Ki67, active-caspase, and AHSA1 showed that the tumor cell proliferation significantly increased in xenograft tumors (SMCC7721-AHSA1 vs SMCC7721-LV, P < 0.05) (Figure 2G). For in vivo metastasis experiments, the tumor cells were injected into the tail vein of nude mice, following which lung metastasis was performed to validate the results in vitro. After 12 weeks, the lung metastasis in mice showed significantly higher metastasis rates of both SK-HEP1-AHSA1 cells compared with SK-HEP1-control cells (Figure 2H). Kaplan–Meier survival analysis revealed a negative correlation between AHSA1 expression and overall survival in nude mice (Figure 2I).
Identification of AHSA1-Related Signaling Pathways by Gene Set Enrichment Analysis, Gene Ontology, and Kyoto Encyclopedia of Genes and Genomes Analysis
RNA-Seq was performed to explore the mechanism of AHSA1 promoting HCC growth and metastasis by comparing the gene expression profiles in SK-HEP1-AHSA1 cells versus those in SK-HEP1-LV cells. The DEGs between the low- and high- AHSA1 expression subgroups are presented in Figure 3A. The gene set enrichment analysis (GSEA) was used to screen the signaling pathways involved in GC between the low– and high–AHSA1 expression datasets. GSEA indicated that the cell cycle was evidently enriched in samples with the high-AHSA1-expression phenotype (Figure 3B). Differential GO enrichment bar diagrams visualized the main functions of differentially expressed genes on GO terms enriched for protein binding. These molecules were mainly enriched in the cytosolic part; the biological processes were mainly enriched in the negative regulation of transcription from the RNA polymerase II promoter (Figure 3C). Further analysis showed that the positive regulation of transcription involved in the G1/S transition of the mitotic cell cycle was more pronounced in SK-HEP1 cells overexpressing AHSA1 (Figure 3C). The KEGG analysis demonstrated that the TGF-β signaling pathway was involved in samples with the high-AHSA1 expression phenotype (Figures S1A and S1B). Transforming growth factor beta (TGF-β) is an important cytokine involved in promoting the growth and metastasis of HCC cells. RNA-seq analysis of cytokines revealed that AHSA1 showed a significant positive correlation with TGF-β1, TGF-β2, vascular endothelial growth factor beta (VEGF-β), and interleukin-8 (IL-8) in LIHC (Figure S1C). Meanwhile, TGF-β1 was the most significantly positively correlated cytokine (Figure S1C). In summary, the RNA-seq analysis demonstrated that the TGF-β signaling pathway and cell cycle were significantly correlated with the development of HCC.
 |
Figure 3 AHSA1-related signaling pathways analysis based on RNA-seq. (A) DEGs between the low- and high- AHSA1 expression subgroups. (B) GSEA analysis was used to evaluate the abundance of main signaling pathways. (C) GO functional enrichment analysis of the molecules interacting with AHSA1. |
AHSA1 Participates in the Cell Cycle by Regulating TGF-β/Akt-cyclinD1/CDK6 Signaling Pathway to Promote the Growth of HCC
The cell cycle analysis showed a significantly lower proportion of AHSA1-overexpressing SMCC-7721 cells in the G1/G0 phase compared with control cells (51.75 ± 1.12 versus 75.34 ± 0.74, P < 0.001) (Figure 4A). Consistently, decreased percentage of cells in the G1/G0 phase by AHSA1 was also observed in SK-HEP1 cells (43.47 ± 1.49 vs 54.43 ± 1.47, P < 0.001). Taken together, the results suggested that AHSA1 upregulation increased the cell cycle transition from the G1 phase to the S phase.
 |
Figure 4 AHSA1 participates in the cell cycle by regulating TGF-β/Akt-cyclinD1/CDK6 signaling pathway to promote the growth of HCC (A) Cell cycle analysis showed that AHSA1 upregulation in SMMC-7721 and SK-HEP1 cells reduced the cell cycle arrest in the G1/G0 phase, as detected by the flow cytometry assays (Student t test, ***P < 0.001). (B) Western blotting showed that AHSA1 upregulation expression increased the expression of cyclin D1, cyclin D3, and CDK6 in both SMMC-7721 and SK-HEP1 cells. GAPDH was used as the protein loading control. The relative protein ratio was quantified using ImagePro Plus 6.0 software and normalized to GAPDH (Student t test, ***P < 0.001). (C) Western blotting showed that AHSA1 regulated the expression of p-Akt and CyclinD1 in SK-HEP1 cells (Student t test, **P < 0.01, ***P < 0.001). (D and E) Boyden chamber migration assays of SK-HEP1 cells after AHSA1 upregulation and treatment with the Akt inhibitor MK2206 (mean ± SD, n = 3; NS P > 0.05, ***P < 0.001). (F) In vitro growth curves of SK-HEP1 cells after AHSA1 upregulation and treatment with the Akt inhibitor MK2206 (mean ± SD, n = 3; Student t test, **P < 0.01). (G and H) Western blotting showed the upregulation of the protein expression of AHSA1 in SK-HEP1 cells treated with the Akt inhibitor MK2206 (n = 3, NS P > 0.05, ***P < 0.001, **P < 0.01). (I) ELISA validation analysis showed the secretion of TGF-β in both SK-HEP1 and SMCC7721 cells (AHSA1 vs LV) (***P < 0.001). (J and K) Western blotting showed the upregulation of the protein expression of AHSA1 in SK-HEP1 cells treated with anti-TGF-β. (***P < 0.001). |
We detected the expression of the G1/S checkpoint protein to investigate the potential mechanisms. Western blotting showed that the AHSA1 overexpression induced the expression of cyclinD1, cyclinD3, and CDK6 in both SK-HEP1 and SMCC7721 cell lines (Figure 5B). Collectively, the results indicated that AHSA1 upregulation promoted G1–S phase transition by inducing cyclinD1, cyclin-D3, and CDK6 activity of HCC cells in vitro.
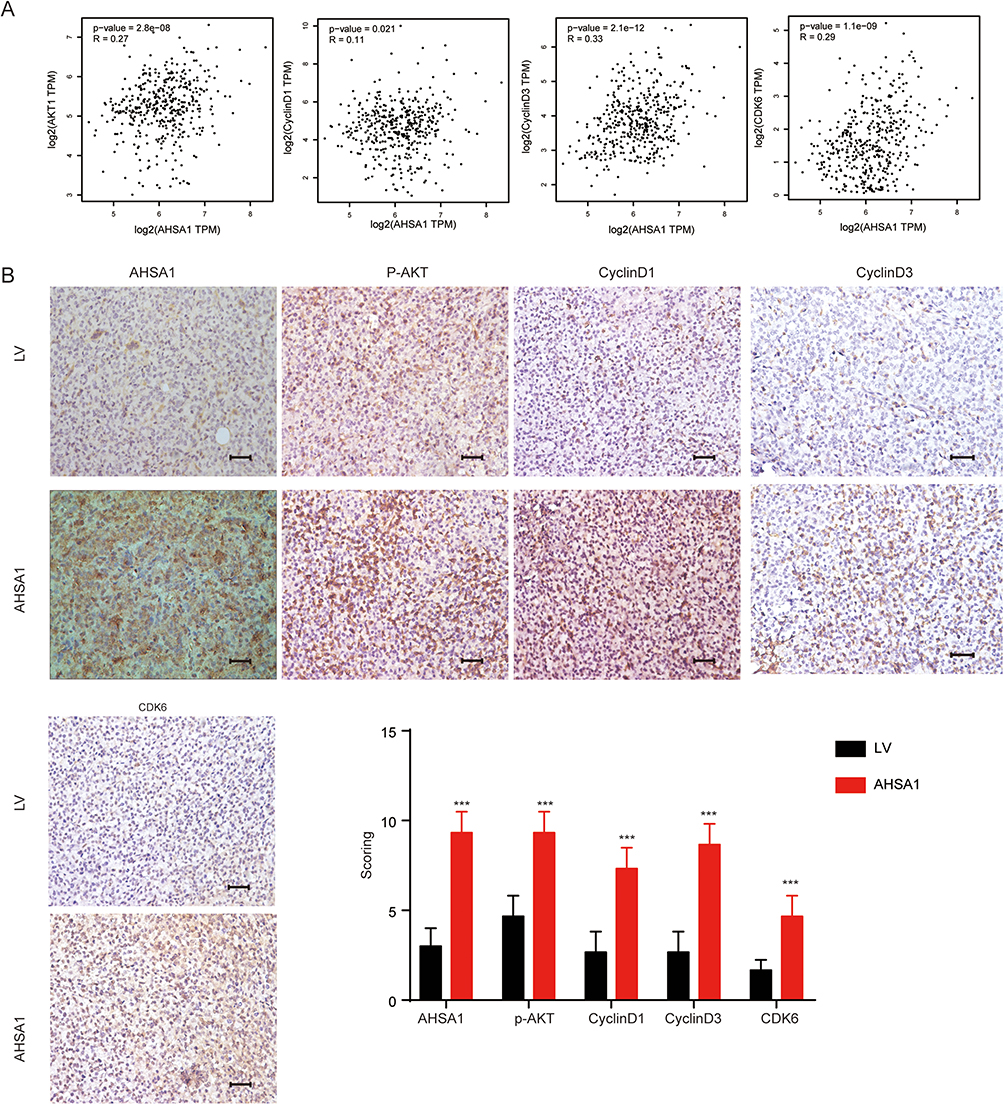 |
Figure 5 Association of AHSA1 with cyclinD1, cyclinD3, and CDK6 in vivo and in HCC specimens. (A) GEPIA database analysis suggested the transcriptional expression of Akt, cyclin D1, cyclinD3, and CDK6 in TCGA HCC tissues (Pearson correlation analysis, all P < 0.05). (B) IHC staining demonstrated the expression of AHSA1, cyclinD1, cyclinD3, and CDK6 in SMCC-7721 xenograft tumors compared with control tumors (Student t test, ***P < 0.001). |
Previous studies showed significantly elevated levels of phosphorylated AKT in colon cancer cells overexpressing AHSA1.19 We hypothesized that AHSA1 also regulated HCC development through the AKT signaling pathway in HCC. To test this hypothesis, we first evaluated the phosphorylation of p-AKT in HCC cells. AHSA1 upregulation significantly increased the phosphorylation of AKT and cyclinD1 in SK-HEP1 cells in vitro (AHSA1 vs LV) (Figure 4C).
MK2206, a highly potent and selective allosteric AKT inhibitor, was used to further explore the role of p-AKT in the development of HCC. The cell migration (Figure 4D and E) and cell proliferation (Figure 4F) assays confirmed that AHSA1 upregulation increased the abilities of cell migration and growth of SK-HEP1 cells, while MK2206 treatment eliminated the ability of SK-HEP1 AHSA1 cells to grow and metastasize (SK-HEP1 LV + MK2206 vs SK-HEP1 AHSA1 + MK2206, P >0.05.NS).Importantly, MK2206 dramatically decreased the expression of the phosphorylation of p-AKT, cyclinD1, and CDK6 in SK-HEP1 cells (Figure 4G and H), suggesting that both cyclinD1 and CDK6 were downstream targets of AKT signaling. In addition, the results suggested that AHSA1 upregulation increased tumor growth by AKT signaling and induction of the expression of cyclinD1 and CDK6 and then regulated the cell cycle transition from G1 to S phase.
The enzyme-linked immunosorbent assay (ELISA) validation analysis showed that AHSA1 upregulation significantly increased the secretion of TGF-β in both SK-HEP1 and SMCC7721 cells (AHSA1 vs LV) (Figure 4I). SK-HEP1 cells were treated with anti-TGF-β1 blocking antibody (1 µg/mL) for 48 h. Anti-TGF-β1 reversed the effects of AHSA1 overexpression on the expression of phosphorylated AKT (Ser473) and cyclinD1, as detected by Western blotting (Figure 4J and K). Thus, the results suggested that AHSA1 integrated TGF-β/Akt-cyclinD1/CDK6 signaling in HCC cells.
Association of AHSA1 with CyclinD1, CyclinD3, and CDK6 in vivo and in HCC Specimens
Gene Expression Profiling Interactive Analysis (GEPIA) database analysis suggested that the transcriptional expression of AKT, cyclinD1, cyclinD3, and CDK6 was significantly higher in the Cancer Genome Atlas (TCGA) HCC tissues than in normal liver tissues, as detected by Pearson correlation analysis (all P < 0.05, Figure 5A). IHC staining demonstrated that AHSA1 overexpression dramatically increased the expression of cyclinD1, cyclinD3, and CDK6 in SMCC-7721 xenograft tumors compared with control tumors (all P < 0.001, Figure 5B). Our findings substantiated that AHSA1 might regulate HCC growth and metastasis via the TGF-β/Akt-cyclinD1/CDK6 signaling pathway.
Discussion
Heat shock 90 (Hsp90) proteins play an important role in stabilizing and proper folding of several hundred proteins.20 HSP90 and its partners coordinate important physiological processes such as cell survival, cell cycle control, hormone signaling, and apoptosis.21,22 AHSA1, as one of the partners of heat shock 90 kDa (heat shock protein 90, HSP90), can stimulate the ATPase of Hsp90.23 The preliminary results from previous studies of bioinformatics analysis and the results in vitro indicated that AHSA1 was associated with poor prognosis in multiple cancers and regulated cell growth, apoptosis, migration, and invasion of osteosarcoma and breast cancer.14,17,24 Furthermore, LINC00707 was silenced by targeting the miR-338-3p/AHSA1 axis in MG-63 and Saos-2 cells, thereby inhibiting cell proliferation, migration, and invasion.16 Recent reports indicated that the knockdown of AHSA1 could affect the proliferation and transformation of HCC cells; however, the mechanism of AHSA1 in HCC genesis and prognosis has not been reported yet.17
We demonstrated that AHSA1 was highly expressed and significantly correlated with invasive depth, tumor size, and TNM stage of HCC, except age, sex, metastasis, lymph node metastasis, and pathological grade in clinicopathological features. The multivariate Cox regression analysis revealed AHSA1 as a poor prognostic factor for patient survival. In addition, AHSA1 upregulation significantly induced the proliferation, colony formation, and migration of HCC cells both in vivo and in vitro. In conclusion, we suggested that AHSA1 was involved in HCC initiation and progression by controlling tumor cell proliferation and migration.
We performed gene expression by RNA-seq to further investigate the underlying mechanisms. The bioinformatics analysis indicated that the positive regulation of transcription involved in the G1/S transition of the mitotic cell cycle, and the TGF-β signaling pathway was significantly correlated with the development of HCC. We demonstrated that AHSA1 upregulation significantly decreased the percentage of tumor cells arrested in the G1/G0 phase compared with control cells. Therefore, we concluded that AHSA1 upregulation significantly induced the cell cycle transition from the G1 phase to the S phase. CyclinD1 and CDK6 are central players in such G1–S phase transition.25–27 We found that AHSA1 upregulation induced the expression of cyclinD1, cyclinD3, and CDK6 both in vitro and in vivo.
The AKT/mTOR signaling pathway is involved in cell proliferation and metabolism and thus plays an important role in tumor initiation and progression.28,29 Previous studies showed that AHSA1 expression was consistent with Akt phosphorylation levels in colon cancer cells.19 The AKT/cyclinD1 pathway modulates tumorigenesis in various cancers.30–32 Therefore, we investigated whether AHSA1 regulated the G1–S phase transition via the Akt signaling pathway. Indeed, we found that AHSA1 upregulation significantly increased the expression of cyclinD1 as well as the phosphorylation of p-AKT. MK-2206, an allosteric and highly potent and selective AKT inhibitor, suppressed AKT phosphorylation and enhanced the antitumor efficacy of standard chemotherapeutic agents or molecular targeted drugs in vitro and in vivo.33,34 Remarkably, the inhibition of AKT signaling by MK2206 not only eliminated the induced growth of tumor cells by AHSA1 upregulation but also reduced the abilities of proliferation and migration of HCC cells. In addition, MK2206 significantly reduced the expression of cyclinD1 and CDK6, indicating that both cyclinD1 and CDK6 were downstream targets of AKT signaling in HCC. Accordingly, we suggested that AHSA1 promoted HCC cell growth and metastasis through the AKT/cyclinD1 signaling pathway involved in the G1–S phase transition. The Pearson correlation analysis showed positive correlations of ASHA1 expression with the expression of phosphorylated AKT, cyclinD1, and CDK6 in HCC tumors.
TGF-β is a multifunctional cytokine that plays a role in various cancers and regulates various intracellular pathways, including drosophila mothers against decapentaplegic protein (Smad), mitogen-activated protein kinase, and phosphatidylinositol 3’-kinase– AKT pathways.35–37 The bioinformatics analysis of AHSA1 indicated that the TGF-β signaling pathway was significantly enriched in HCC, which was substantiated by ELISA. Anti-TGF-β reversed the effects of AHSA1 overexpression on the expression of phosphorylated AKT (Ser473) and cyclinD1 by Western blotting. Thus, the results suggested that AHSA1 integrated TGF-β/AKT-cyclinD1/CDK6 signaling in HCC cells. Therefore, we speculated that TGF-β might be an upstream signaling molecule of the AKT/cyclinD1/CDK6 signaling pathway.
Altogether, the results substantiated that AHSA1 was upregulated in HCC and associated with some clinicopathological features and patient’s overall survival. AHSA1 upregulation dramatically induced the proliferation, colony formation, and migration of HCC cells both in vivo and in vitro. Mechanistically, AHSA1 upregulation induced the G1–S phase transition by increasing the expression of cyclinD1, cyclinD3, and CDK6.
We further elucidated the role of the TGF-β/AKT-cyclinD1/CDK pathway in the control of the tumor development of HCC. Our results provided new insights into the carcinogenesis and disease progression of HCC, as well as a rationale for novel HCC intervention strategies (Figure 6). Therefore, AHSA1 may act as a potential prognostic biomarker of HCC.
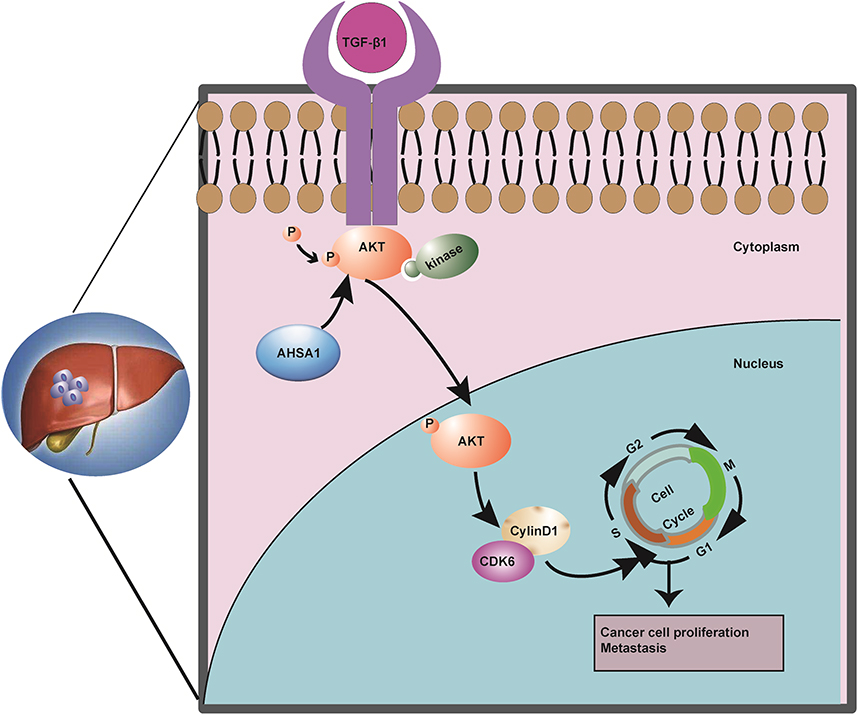 |
Figure 6 Summary of the key results in the working model. |
Ethics Statement
All patients were recruited in accordance with the company and/or institutional ethical guidelines. The samples were obtained from the Shanghai Outdo Biotech Co., Ltd. (www.superchip.com.cn/) with written informed consent.
Acknowledgments
We thank Dr. Yi Yao from Cancer Center, Renmin Hospital of Wuhan University, Wuhan, China, for their great help and discussion on techniques.
Funding
This study was funded by the Tianqing Liver Disease Research Foundation of China (Grant number: TQGB20200199).
Disclosure
The authors have no conflicts of interest to declare.
References
1. Siegel RL, Miller KD, Fuchs HE, Jemal A. Cancer statistics, 2022. CA Cancer J Clin. 2022;72(1):7–33. doi:10.3322/caac.21708
2. Xia C, Dong X, Li H, et al. Cancer statistics in China and United States, 2022: profiles, trends, and determinants. Chin Med J. 2022;135(5):584–590. doi:10.1097/CM9.0000000000002108
3. Konyn P, Ahmed A, Kim D. Current epidemiology in hepatocellular carcinoma. Expert Rev Gastroenterol Hepatol. 2021;15(11):1295–1307. doi:10.1080/17474124.2021.1991792
4. Ferlay J, Colombet M, Soerjomataram I, et al. Cancer statistics for the year 2020: an overview. Int J Cancer. 2021;149(4):778–789. doi:10.1002/ijc.33588
5. Makary MS, Ramsell S, Miller E, Beal EW, Dowell JD. Hepatocellular carcinoma locoregional therapies: outcomes and future horizons. World J Gastroenterol. 2021;27(43):7462–7479. doi:10.3748/wjg.v27.i43.7462
6. Inchingolo R, Posa A, Mariappan M, Spiliopoulos S. Locoregional treatments for hepatocellular carcinoma: current evidence and future directions. World J Gastroenterol. 2019;25(32):4614–4628. doi:10.3748/wjg.v25.i32.4614
7. Terashima T, Yamashita T, Takata N, et al. Comparative analysis of liver functional reserve during lenvatinib and sorafenib for advanced hepatocellular carcinoma. Hepatol Res. 2020;50(7):871–884. doi:10.1111/hepr.13505
8. Casadei-Gardini A, Scartozzi M, Tada T, et al. Lenvatinib versus sorafenib in first-line treatment of unresectable hepatocellular carcinoma: an inverse probability of treatment weighting analysis. Liver Int. 2021;41(6):1389–1397. doi:10.1111/liv.14817
9. Fulgenzi CAM, Talbot T, Murray SM, et al. Immunotherapy in Hepatocellular carcinoma. Curr Treat Options Oncol. 2021;22(10):87. doi:10.1007/s11864-021-00886-5
10. Marron TU, Schwartz M, Corbett V, Merad M. Neoadjuvant Immunotherapy for Hepatocellular Carcinoma. J Hepatocell Carcinoma. 2022;9:571–581.
11. Wolmarans A, Lee B, Spyracopoulos L, LaPointe P. The mechanism of Hsp90 ATPase Stimulation by Aha1. Sci Rep. 2016;6(33179). doi:10.1038/srep33179
12. Panaretou B, Siligardi G, Meyer P, et al. Activation of the ATPase activity of hsp90 by the stress-regulated cochaperone aha1. Mol Cell. 2002;10(6):1307–1318. doi:10.1016/S1097-2765(02)00785-2
13. Gu C, Wang Y, Zhang L, et al. AHSA1 is a promising therapeutic target for cellular proliferation and proteasome inhibitor resistance in multiple myeloma. J Exp Clin Cancer Res. 2022;41(1):11. doi:10.1186/s13046-021-02220-1
14. Shi W, Qi L, You XB, et al. Identification of AHSA1 as a potential therapeutic target for breast cancer: bioinformatics analysis and in vitro studies. Curr Cancer Drug Targets. 2022;22(2):142–152. doi:10.2174/1568009622666220114151058
15. Cao R, Shao J, Hu Y, et al. microRNA-338-3p inhibits proliferation, migration, invasion, and EMT in osteosarcoma cells by targeting activator of 90 kDa heat shock protein ATPase homolog 1. Cancer Cell Int. 2018;18(49). doi:10.1186/s12935-018-0551-x
16. Zhang XR, Shao JL, Li H, Wang L. Silencing of LINC00707 suppresses cell proliferation, migration, and invasion of osteosarcoma cells by modulating miR-338-3p/AHSA1 axis. Open Life Sci. 2021;16(1):728–736. doi:10.1515/biol-2021-0070
17. Li W, Liu J. The prognostic and immunotherapeutic significance of AHSA1 in pan-cancer, and its relationship with the proliferation and metastasis of hepatocellular carcinoma. Front Immunol. 2022;13:845585.
18. Wang S, Wang X, Gao Y, et al. RN181 is a tumor suppressor in gastric cancer by regulation of the ERK/MAPK-cyclin D1/CDK4 pathway. J Pathol. 2019;248(2):204–216. doi:10.1002/path.5246
19. Holmes JL, Sharp SY, Hobbs S, Workman P. Silencing of HSP90 cochaperone AHA1 expression decreases client protein activation and increases cellular sensitivity to the HSP90 inhibitor 17-allylamino-17-demethoxygeldanamycin. Cancer Res. 2008;68(4):1188–1197. doi:10.1158/0008-5472.CAN-07-3268
20. Schopf FH, Biebl MM, Buchner J. The HSP90 chaperone machinery. Nat Rev Mol Cell Biol. 2017;18(6):345–360. doi:10.1038/nrm.2017.20
21. Hoter A, El-Sabban ME, Naim HY. The HSP90 family: structure, regulation, function, and implications in health and disease. Int J Mol Sci. 2018;19(9):2560. doi:10.3390/ijms19092560
22. Prodromou C. Mechanisms of Hsp90 regulation. Biochem J. 2016;473(16):2439–2452. doi:10.1042/BCJ20160005
23. Retzlaff M, Hagn F, Mitschke L, et al. Asymmetric activation of the hsp90 dimer by its cochaperone aha1. Mol Cell. 2010;37(3):344–354. doi:10.1016/j.molcel.2010.01.006
24. Shao J, Wang L, Zhong C, Qi R, Li Y. AHSA1 regulates proliferation, apoptosis, migration, and invasion of osteosarcoma. Biomed Pharmacother. 2016;77:45–51. doi:10.1016/j.biopha.2015.11.008
25. Massagué J. G1 cell-cycle control and cancer. Nature. 2004;432(7015):298–306. doi:10.1038/nature03094
26. Casimiro MC, Velasco-Velázquez M, Aguirre-Alvarado C, Pestell RG. Overview of cyclins D1 function in cancer and the CDK inhibitor landscape: past and present. Expert Opin Investig Drugs. 2014;23(3):295–304. doi:10.1517/13543784.2014.867017
27. Nebenfuehr S, Kollmann K, Sexl V. The role of CDK6 in cancer. Int J Cancer. 2020;147(11):2988–2995. doi:10.1002/ijc.33054
28. Saxton RA, Sabatini DM. mTOR signaling in growth, metabolism, and disease. Cell. 2017;168(6):960–976. doi:10.1016/j.cell.2017.02.004
29. Miricescu D, Totan A, Stanescu S II, Badoiu SC, Stefani C, Greabu M. PI3K/AKT/mTOR signaling pathway in breast cancer: from molecular landscape to clinical aspects. Int J Mol Sci. 2020;22(1):173. doi:10.3390/ijms22010173
30. Yan S, Liu H, Liu Z, et al. CCN1 stimulated the osteoblasts via PTEN/AKT/GSK3β/cyclinD1 signal pathway in myeloma bone disease. Cancer Med. 2020;9(2):737–744. doi:10.1002/cam4.2608
31. Xi J, Sun Y, Zhang M, et al. GLS1 promotes proliferation in hepatocellular carcinoma cells via AKT/GSK3β/CyclinD1 pathway. Exp Cell Res. 2019;381(1):1–9. doi:10.1016/j.yexcr.2019.04.005
32. Cui Y, Bai Y, Yang J, et al. SIRT4 is the molecular switch mediating cellular proliferation in colorectal cancer through GLS mediated activation of AKT/GSK3β/CyclinD1 pathway. Carcinogenesis. 2021;42(3):481–492. doi:10.1093/carcin/bgaa134
33. Hirai H, Sootome H, Nakatsuru Y, et al. MK-2206, an allosteric Akt inhibitor, enhances antitumor efficacy by standard chemotherapeutic agents or molecular targeted drugs in vitro and in vivo. Mol Cancer Ther. 2010;9(7):1956–1967. doi:10.1158/1535-7163.MCT-09-1012
34. Uko NE, F GO, Matesic DF, Bowen JP. Akt Pathway Inhibitors. Curr Top Med Chem. 2020;20(10):883–900. doi:10.2174/1568026620666200224101808
35. Haque S, Morris JC. Transforming growth factor-β: a therapeutic target for cancer. Hum Vaccin Immunother. 2017;13(8):1741–1750. doi:10.1080/21645515.2017.1327107
36. Bakin AV, Rinehart C, Tomlinson AK, Arteaga CL. p38 mitogen-activated protein kinase is required for TGFbeta-mediated fibroblastic transdifferentiation and cell migration. J Cell Sci. 2002;115(Pt 15):3193–3206. doi:10.1242/jcs.115.15.3193
37. Seoane J, Pouponnot C, Staller P, Schader M, Eilers M, Massagué J. TGFbeta influences Myc, Miz-1 and Smad to control the CDK inhibitor p15INK4b. Nat Cell Biol. 2001;3(4):400–408. doi:10.1038/35070086
 © 2023 The Author(s). This work is published and licensed by Dove Medical Press Limited. The
full terms of this license are available at https://www.dovepress.com/terms
and incorporate the Creative Commons Attribution
- Non Commercial (unported, 3.0) License.
By accessing the work you hereby accept the Terms. Non-commercial uses of the work are permitted
without any further permission from Dove Medical Press Limited, provided the work is properly
attributed. For permission for commercial use of this work, please see paragraphs 4.2 and 5 of our Terms.
© 2023 The Author(s). This work is published and licensed by Dove Medical Press Limited. The
full terms of this license are available at https://www.dovepress.com/terms
and incorporate the Creative Commons Attribution
- Non Commercial (unported, 3.0) License.
By accessing the work you hereby accept the Terms. Non-commercial uses of the work are permitted
without any further permission from Dove Medical Press Limited, provided the work is properly
attributed. For permission for commercial use of this work, please see paragraphs 4.2 and 5 of our Terms.
Recommended articles
The Correlation of Centromere Protein Q with Diagnosis and Prognosis in Hepatocellular Carcinoma
He K, Xie MY, Gao XJ, Wang H, Li JD
Pharmacogenomics and Personalized Medicine 2024, 17:271-288
Published Date: 27 May 2024
BRAP Promotes the Tumorigenesis of Hepatocellular Carcinoma by Corrupting Cancer Cell Cycle Regulation and Enhancing Immune Evasion
Guo Y, Gu R, Gao F, Liu L, Deng D, Zhang Q, Wang L, Liu Q, Lan L, Cang S
Journal of Hepatocellular Carcinoma 2025, 12:2771-2793
Published Date: 16 December 2025