Back to Journals » Clinical Epidemiology » Volume 15
Age-Dependent Association Between Body Mass Index and All-Cause Mortality Among Patients with Hypertension: A Longitudinal Population-Based Cohort Study in China
Authors Huang Y ![]() , Peng J, Wang W, Zheng X, Qin G, Xu H
, Peng J, Wang W, Zheng X, Qin G, Xu H
Received 26 September 2023
Accepted for publication 28 November 2023
Published 7 December 2023 Volume 2023:15 Pages 1159—1170
DOI https://doi.org/10.2147/CLEP.S442162
Checked for plagiarism Yes
Review by Single anonymous peer review
Peer reviewer comments 3
Editor who approved publication: Professor Lars Pedersen
Yifang Huang,1,2 Jiahuan Peng,2 Weibing Wang,1 Xueying Zheng,2,* Guoyou Qin,1,2 Huilin Xu3,*
1Shanghai Institute of Infectious Disease and Biosecurity, Fudan University, Shanghai, People’s Republic of China; 2Department of Biostatistics, National Health Commission Key Laboratory of Health Technology Assessment, Ministry of Education Key Laboratory of Public Health Safety, School of Public Health, Fudan University, Shanghai, People’s Republic of China; 3Shanghai Minhang Center for Disease Control and Prevention, Shanghai, People’s Republic of China
*These authors contributed equally to this work
Correspondence: Xueying Zheng, Department of Biostatistics, National Health Commission Key Laboratory of Health Technology Assessment, Ministry of Education Key Laboratory of Public Health Safety, School of Public Health, Fudan University, 138 Yi Xue Yuan Road, Shanghai, 200032, People’s Republic of China, Email [email protected] Huilin Xu, Shanghai Minhang Center for Disease Control and Prevention, 965 Zhong Yi Road, Shanghai, 201101, People’s Republic of China, Email [email protected]
Purpose: The association between body mass index (BMI) and all-cause mortality may vary among hypertensive patients of different ages. This study aimed to investigate the age-dependent association between BMI and all-cause mortality among patients with hypertension.
Patients and Methods: A total of 212,394 participants with hypertension aged 20– 85 years from Minhang Hypertension Standardization Management System in Shanghai of China were included. Follow-up began at the time when individuals were first recorded and ended at death, loss to follow-up, or December 31, 2018, whichever came first. Additive Cox proportional hazards models with thin plate smoothing functions and conventional Cox proportional hazards models were adopted to examine the relationship between BMI, age, and mortality. The joint effect of BMI and age on mortality was assessed using a bivariate response model.
Results: We found that the BMI–mortality relationship followed a U-shaped pattern, with a trough at 26– 27 kg/m2. Compared with normal weight, underweight was associated with a 50% increased risk of premature mortality (hazard ratio 1.50, 95% confidence interval 1.43 to 1.57). Whereas among those aged 45– 59 and 60– 85 years, overweight was associated with 13% (0.87, 0.80 to 0.94) and 18% (0.82, 0.80 to 0.84) reduction in risk of death, respectively. Bivariate response model indicated a significant interaction between BMI and age (P < 0.05). Among younger and older patients, we found a descending trend for mortality risk, with BMI increasing at different age levels, whereas a reverse J-shaped relation pattern was observed among middle-aged patients.
Conclusion: The impact of BMI on all-cause mortality in hypertensive patients varies with age, and moderate weight gain may benefit longevity in middle-aged and older patients.
Keywords: body mass index, age, all-cause mortality, hypertension, generalized additive model
A Letter to the Editor has been published for this article.
Introduction
Hypertension and obesity are two major health concerns worldwide,1,2 and they are strongly associated with an elevated risk of premature death.3,4 From 1990 to 2019, the absolute number of hypertensive adults aged 30–79 years worldwide has doubled.5 Overweight or obesity has been identified as a well-documented risk factor for hypertension onset,2 and both conditions increase the risk of cardiovascular diseases (CVD), diabetes, other chronic diseases, and death.1,6 Of note, in the prognosis of hypertension, the association between body mass index (BMI) and premature death among patients with hypertension remains contentious, with mixed results reported in previous literature.7–11 Some studies revealed a strong association between a high BMI and a decreased risk of mortality in patients,7,8,11 while others reported inconsistent results.7,10 Some evidence suggested that underweight was closely associated with an elevated risk of death in patients,8–10 while others disputed this claim.7
Furthermore, because the association between BMI and mortality may be divergent across ages, the effect modification of age on this association should be noticed.12 However, previous studies explored the association between BMI, age, and mortality based on BMI categories or age subgroups.9,10,13 Such artificial classification of BMI and age cloud miss complete information of data and lead to residual confounding.14 By treating these variables as continuous, we can assess the impact of incremental changes in BMI and age on mortality risk, rather than only examining the impact of being in a specific category. Given that a nonlinear relationship between BMI and mortality had been reported,11,15 utilizing sophisticated statistical models with continuous BMI and age is necessary to provide more accurate evidence and estimates on this association.
Using data from the electronic health record (EHR) of Minhang Hypertension Standardization Management System in Shanghai, this study aimed to investigate the association of BMI with all-cause mortality among hypertensive patients of different ages in China. We hypothesized that the relation pattern of BMI and all-cause mortality among patients with hypertension may vary based on age, and there may be an interaction between BMI and age.
Materials and Methods
Study Population
Data were extracted from the EHR of Minhang Hypertension Standardization Management System in Shanghai, China. Since 2007, a basic community healthcare service has been made to manage patients with hypertension diagnosed by hospitals or community physical examinations in Minhang District, and the EHR system collected baseline and follow-up data on sociodemographic and lifestyle factors, anthropometric measurements, and medical conditions. A total of 260,416 hypertensive patients were recorded in the standardized management system and examined by a primary medical staff during 2007–2015. For an adult, hypertension was confirmed if systolic blood pressure (SBP) ≥140 mm Hg and/or diastolic blood pressure (DBP) ≥90 mm Hg.16 Follow-up began at the date of the registry of hypertension and ended at death, loss to follow-up, or December 31, 2018, whichever occurred first.
In the present study, we excluded 48,022individuals due to (1) lack of information on demographic variables (n = 2361), (2) not registered as permanent residents in Shanghai (n = 27,978), (3) <20 or >85 years old (n = 8114), (4) <3 months of follow-up duration (n = 3788), (5) missing or extreme value on height, weight, or BMI (≥40.0 kg/m2) (n = 5001), (6) missing data on other covariates (n = 780). Finally, 212,394 participants were conducted in our study (Figure S1).
Exposure
BMI at the time of hypertension diagnosis was determined by dividing the weight (in kilograms) by the square of the height (in meters).17 According to the criteria from the World Health Organization (WHO), BMI was categorized into the following groups: (1) <18.5 kg/m2 (underweight), (2) 18.5–24.9 kg/m2 (normal weight), (3) 25.0–29.9 kg/m2 (overweight), (4) ≥30.0 kg/m2 (obesity).17 To be comparable with other literature, age at the time of hypertension diagnosis was also divided into three groups: 20–44, 45–59, and 60–85 years old. In this study, both BMI and age were modeled categorically and continuously.
Outcome
The outcome of interest in this study was death from any cause. Survival time was defined as the time starting from the date of first diagnosis with hypertension to the occurrence of death, loss to follow-up, or December 31, 2018, whichever occurred first. After patients were enrolled, their mortality information was systematically recorded and verified every three months by general practitioners throughout the follow-up period. The verification of deaths was conducted using the Shanghai Vital Statistics Registration System, which compiles data from all tertiary healthcare institutions in Shanghai. The death certificates were duly affirmed by both the Minhang District and the Shanghai Municipal Center for Disease Control and Prevention (CDC).
Covariates
Potential confounding factors were determined according to the directed acyclic graph (DAG) (Figure S2). In this study, we adjusted for SBP, DBP, sex (male and female), physical exercise (never, occasionally, and regularly), smoking (yes and never), drinking (never, occasionally, and frequently), diabetes mellitus (yes and no), and family history of diseases, including hypertension (yes and no), CVD (yes and no), stroke (yes and no), and diabetes mellitus (yes and no).
Diseases were diagnosed based on the International Statistical Classification of Diseases and Related Health Problems, 10th revision (ICD-10).18 Diabetes mellitus was defined as 2-hour blood glucose ≥11.1 mmol/L (200 mg/dL) or fasting blood glucose ≥7.0 mmol/L (126 mg/dL) according to the WHO.19
Statistical Analysis
Continuous variables were described as mean and standard deviation (SD) and categorical variables as frequency and proportion. The baseline characteristics of participants based on BMI categories were compared by one-way analysis of variance, Kruskal–Wallis test, or Chi-square test, as appropriate. The Kaplan–Meier method was performed to calculate the cumulative incidence of death, and the comparison between groups was tested by Log rank test. Cox proportional hazards models were used to estimate hazard ratios (HRs) with 95% confidence intervals (CIs) to assess the association between BMI categories and all-cause mortality in all-aged hypertensive participants, further stratified by age groups (20–44, 45–59, and 60–85 years). The proportional hazards assumption was tested based on Schoenfeld residuals, and the assumption was met. We utilized the additive Cox proportional hazards model with thin plate smoothing functions to examine the exposure–response relationship of continuous BMI and age with all-cause mortality.
Independent exposure–response model was established according to additive Cox proportional hazards model,20 which could evaluate the response of all-cause mortality on the independent effects of BMI and age:
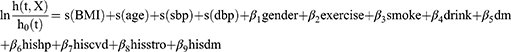
where s(BMI), s(age), and s(dbp) denote the thin plate smoothing functions of BMI, age, SBP, and DBP, respectively. The degrees of freedom (df) of these functions were determined according to the model’s generalized cross validation.20 All of the df in this model were set to 4. Exercise, smoke, drink, and dm in model (1) represent physical exercise, smoking, drinking, and diabetes mellitus, respectively; hishp, hiscvd, hisstro, and his dm in model (1) represent family history of hypertension, CVD, stroke, and diabetes mellitus, respectively.
To examine the joint effect of BMI and age on all-cause mortality, a bivariate thin plate spline smoothing function was added to establish the following bivariate surface model:
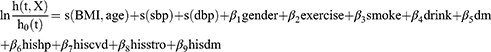
where s(BMI, age) represents a bivariate spline smoothing function of BMI and age, and the df was set to 6. The df of the other terms are the same as model (1). Incorporating a bivariate smoothing function in this model avoids the artificial classification of BMI and age, allowing for the estimation of the joint effect of BMI and age on all-cause mortality without assuming linearity.21 The bivariate exposure–response surface plots derived from model (2) were drawn to visually assess the interaction between BMI and age.
In additional sensitivity analyses, first, we further examined the effect of BMI and age on mortality among participants stratified by sex. Second, to lessen the potential influence of reverse causality and confounding, we assessed the joint effect of BMI and age on death among participants, excluding those who smoked, had been diagnosed with diabetes mellitus, or had less than 5 years of follow-up duration.4
All analyses were two-sided test with a significant level of 0.05, performed using STATA 16.0 software and the mgcv package of R 4.2.0 software.
Results
Baseline Characteristics and Mortality During Follow-Up
Of 212,394patients with hypertension aged 20–85 years old, the average age was 63.26 (SD 10.91) years old, males accounted for 46.6%; 5120 (2.4%), 130,530 (61.5%), 68,583 (32.3%), and 8161 (3.8%) participants were underweight, normal weight, overweight, and obesity, respectively (Table 1). Underweight patients had lower proportions of smoking, regular exercise, diabetes mellitus, and family history of chronic diseases than those in other BMI categories, but they were significantly older than others.
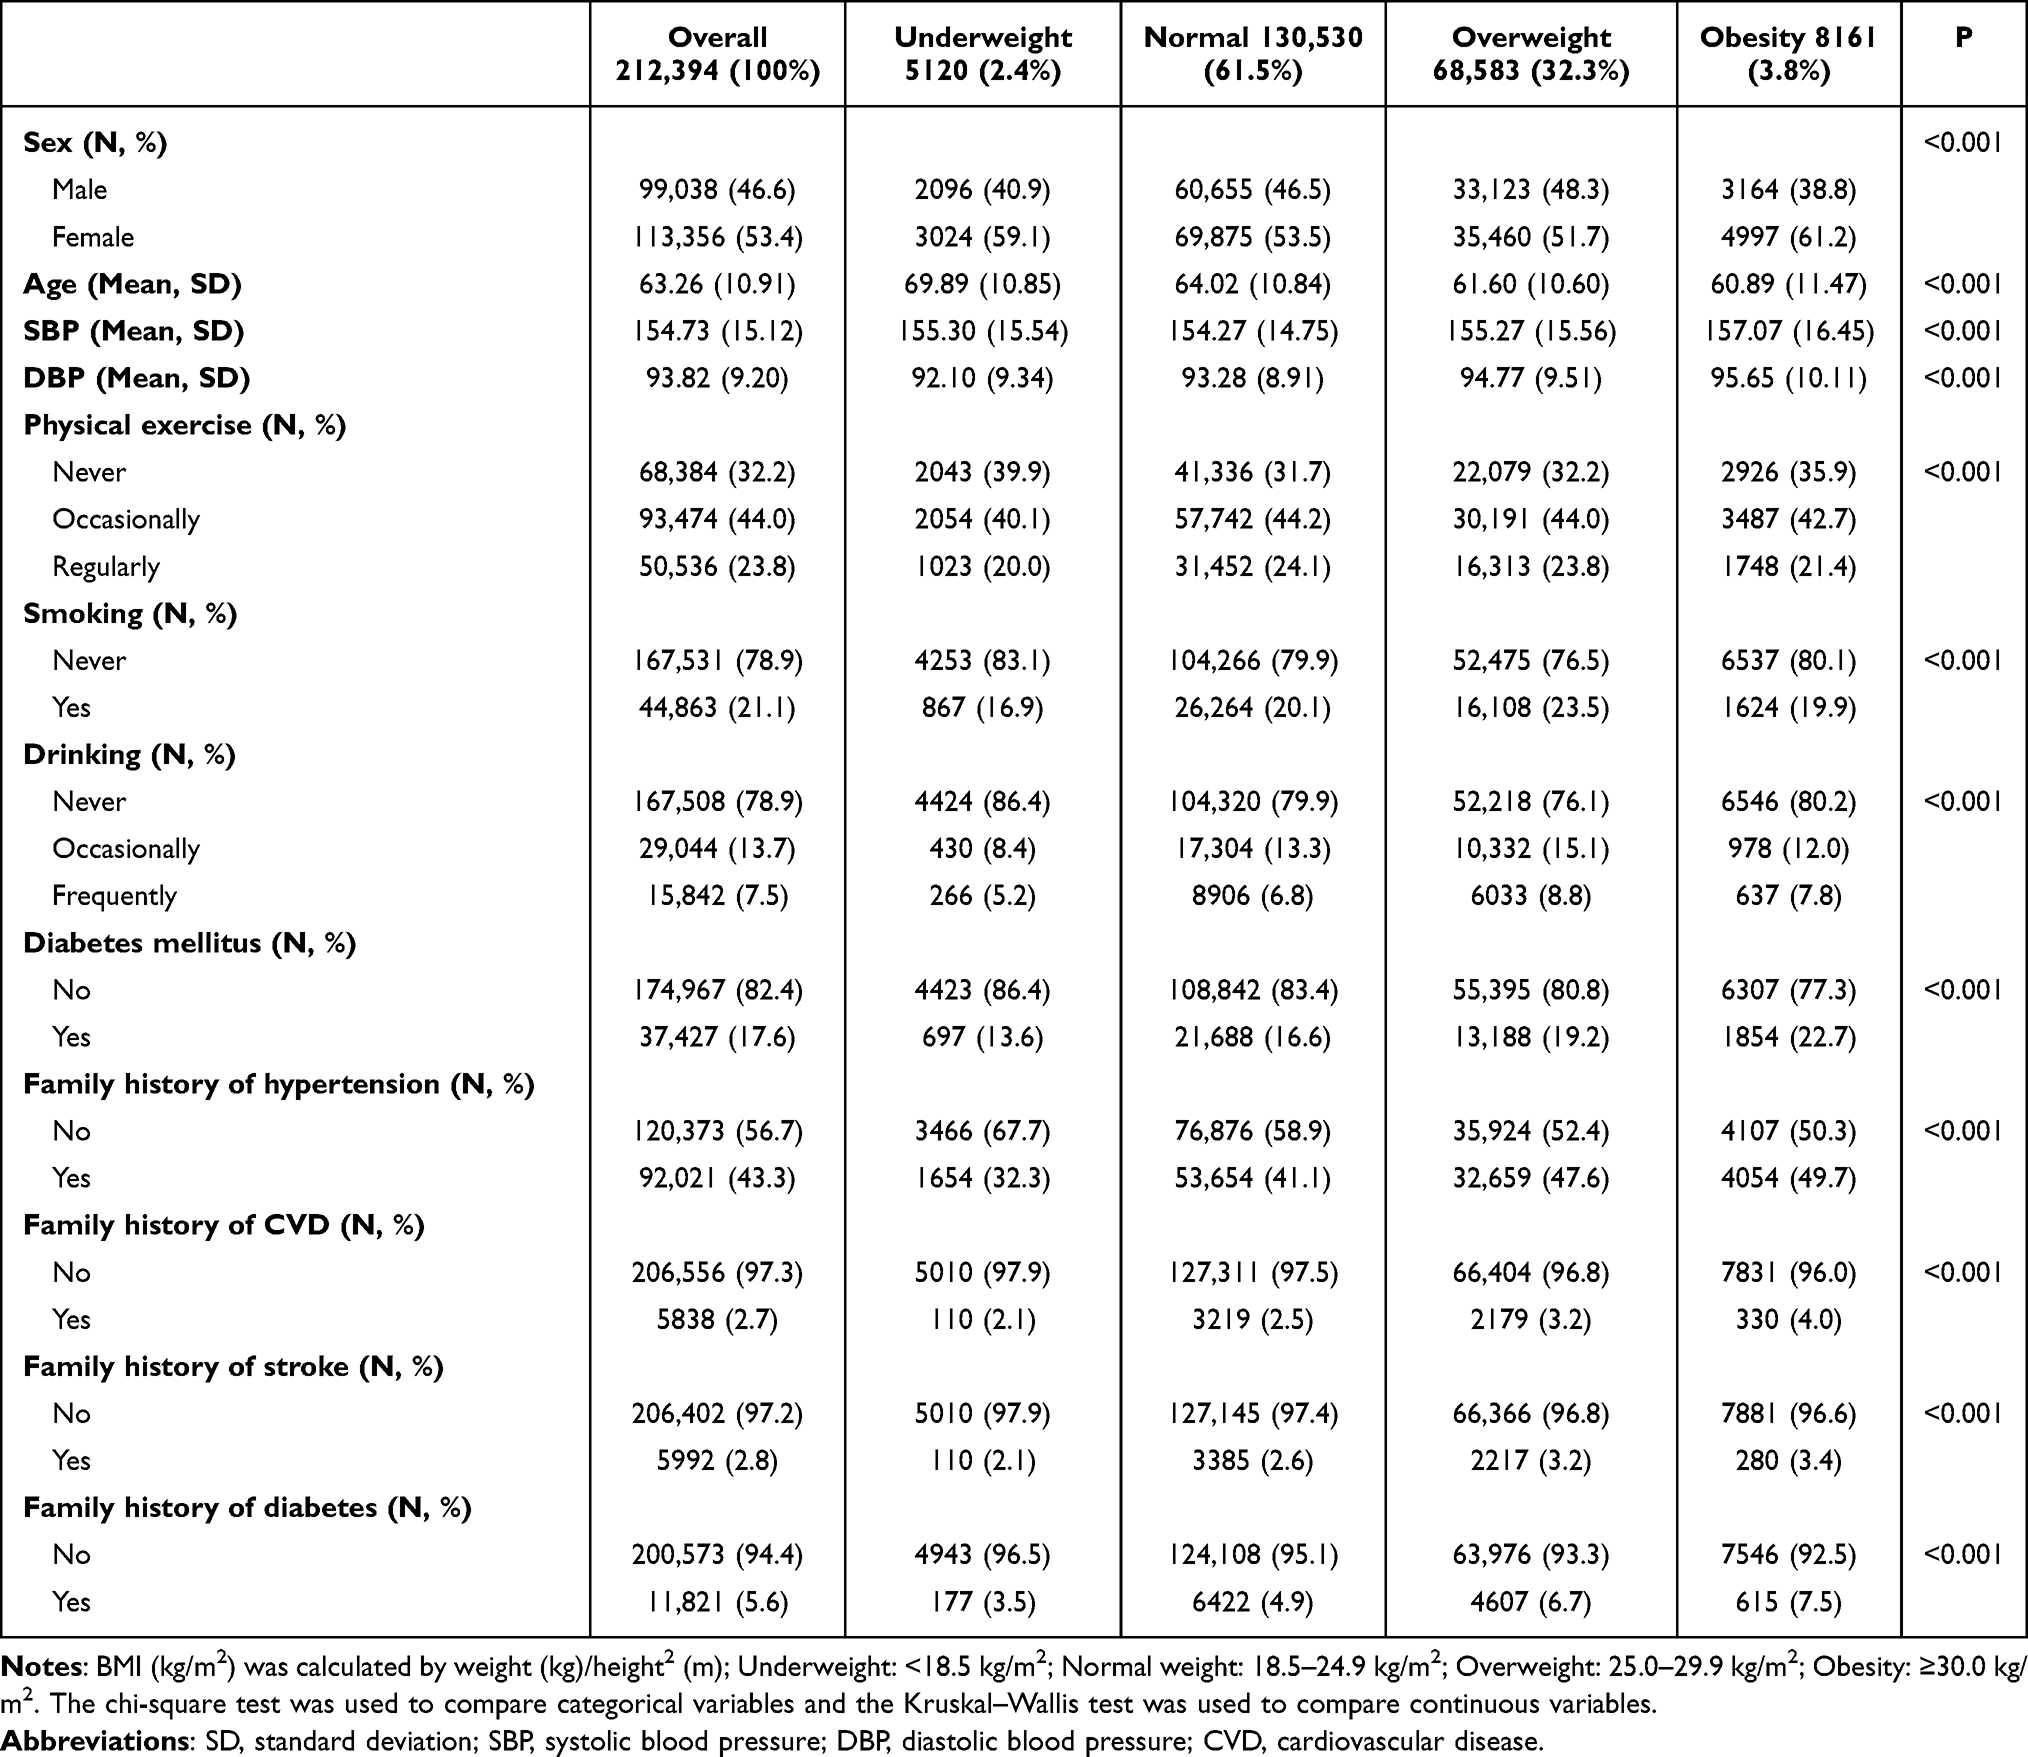 |
Table 1 Baseline Characteristics in Hypertensive Patients Stratified by BMI Categories |
Up to 11.96 years of follow-up period with a median of 9.46, 31,130 (17.79 per 1000 person-years) participants died. Underweight patients had the highest cumulative incidence of death for any cause (Figures 1 and S3). In the 45–85 years old group, overweight patients had the lowest cumulative incidence of death (Figure S3b and S3c). However, in the 20–44 years old group, the cumulative incidence of death among overweight patients was similar to that of normal-weight patients (Figure S3a).
 |
Figure 1 Cumulative incidence rate for all-cause death among hypertensive patients. BMI (kg/m2) was calculated by weight (kg)/height2 (m2); Underweight: <18.5 kg/m2; Normal weight: 18.5–24.9 kg/m2; Overweight: 25.0–29.9 kg/m2; Obesity: ≥30.0 kg/m2. |
The Effect of BMI Across Age Groups
Age and BMI nonlinearly influenced the risk of death (Figure 2). Age was positively associated with an increased risk of death (Figure 2a). The exposure–response curve of BMI and the risk of death was a U-shaped pattern regardless of age groups (Figures 2 and 3), with a trough at 26 ~ 27 kg/m2 in all age patients (Figure 2). Among hypertensives aged 20–85 years, compared with normal weight, underweight (hazard ratio 1.50, 95% confidence interval 1.43 to 1.57) was associated with a 50% increased risk of all-cause mortality, and obesity was associated with 11% increased risk (1.11, 1.04 to 1.18), while overweight was associated with 8% decreased risk (0.92, 0.90 to 0.95) (Table 2). However, among those aged 45–59 and 60–85 years, overweight was associated with 13% (0.87, 0.80 to 0.94) and 18% (0.82, 0.80 to 0.84) reduction in risk of death, respectively. Among 60–85 years old hypertensive patients, obesity (0.92, 0.86 to 0.99) was associated with a reduced risk.
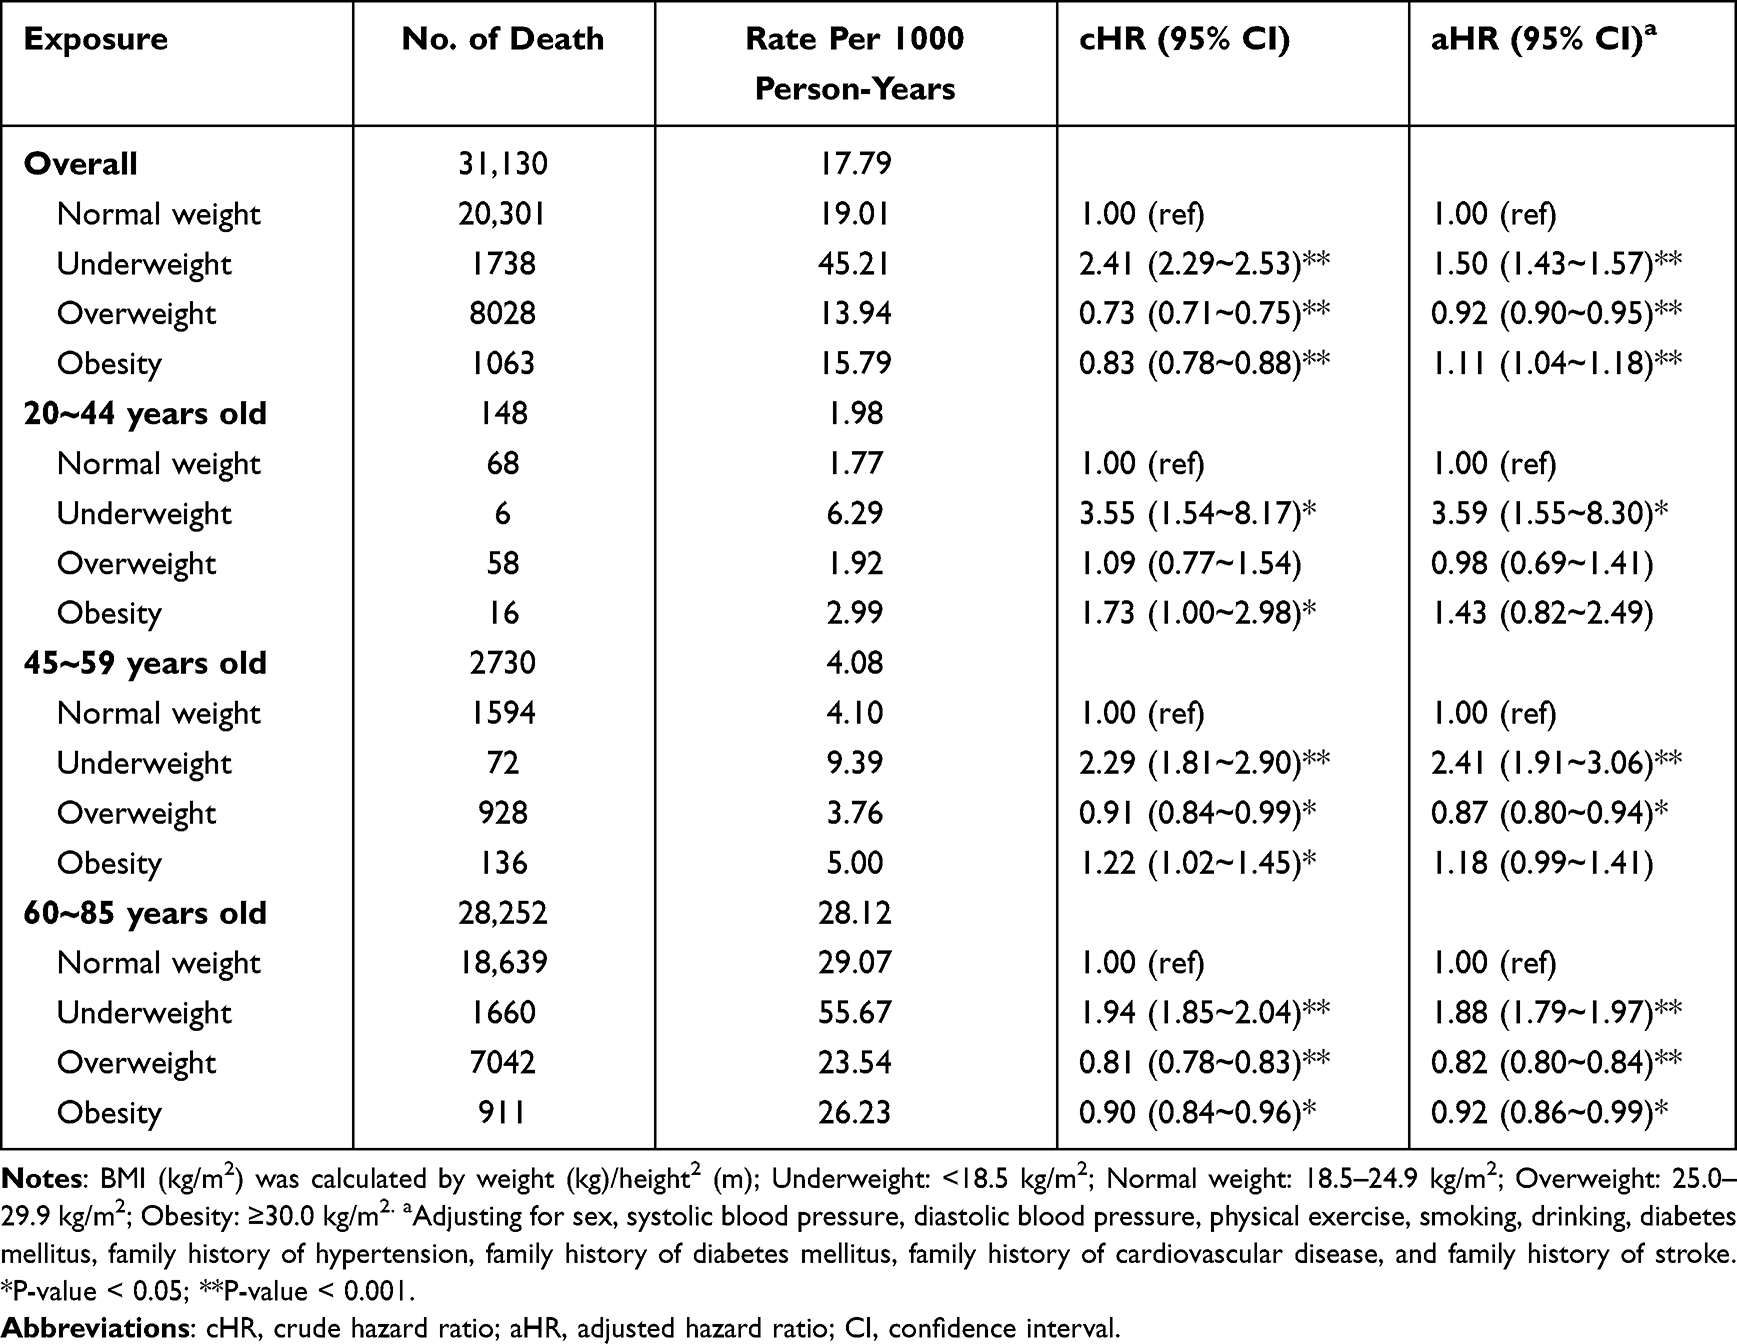 |
Table 2 The Effect of Different BMI Groups on All-Cause Mortality by Cox Proportional Hazard Regression Models |
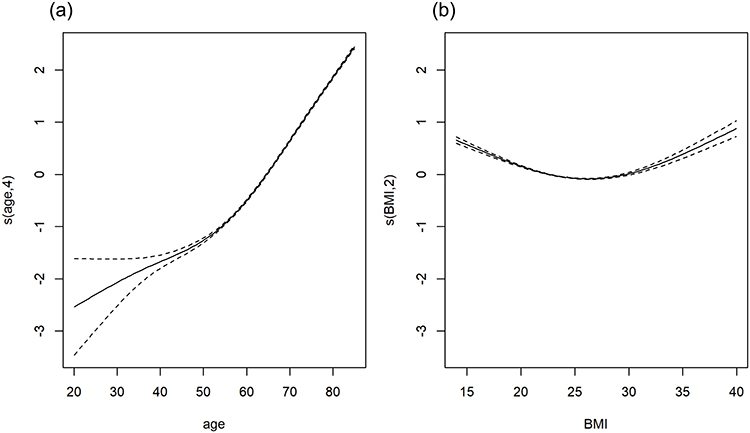 |
Figure 2 Exposure-response curves for the independent effects of BMI and age among hypertensive patients. (a) Independent effect of age; (b) Independent effect of BMI. Adjusting for sex, systolic blood pressure, diastolic blood pressure, physical exercise, smoking, drinking, diabetes mellitus, family history of hypertension, family history of diabetes mellitus, family history of cardiovascular disease, and family history of stroke. |
 |
Figure 3 Exposure–response curves for the independent effect of BMI on all-cause mortality among hypertensive patients stratified by age group. (a) 20–44 years old; (b) 45–59 years old; (c) 60–85 years old. Adjusting for sex, systolic blood pressure, diastolic blood pressure, physical exercise, smoking, drinking, diabetes mellitus, family history of hypertension, family history of diabetes mellitus, family history of cardiovascular disease, and family history of stroke. |
The Joint Effect of BMI and Age
Figure 4 displays the exposure-response surface plots for the joint effect of BMI and age on all-cause mortality at different angles. Bivariate response model indicated a significant interaction between BMI and age (P < 0.05; Figure 4). Changes were exhibited in curves of BMI across age, and the curves differed from their independent exposure–response curves. The peak of death risk was observed in those with the lowest BMI coupled with the oldest age, whereas the lowest risk was found in those with the highest BMI and the youngest age. The plots for younger and older patients showed a descending trend for mortality risk with BMI increasing at different levels of age, while a reverse J-shaped relation pattern was demonstrated in middle-aged patients with a trough at 25 to 30 kg/m2.
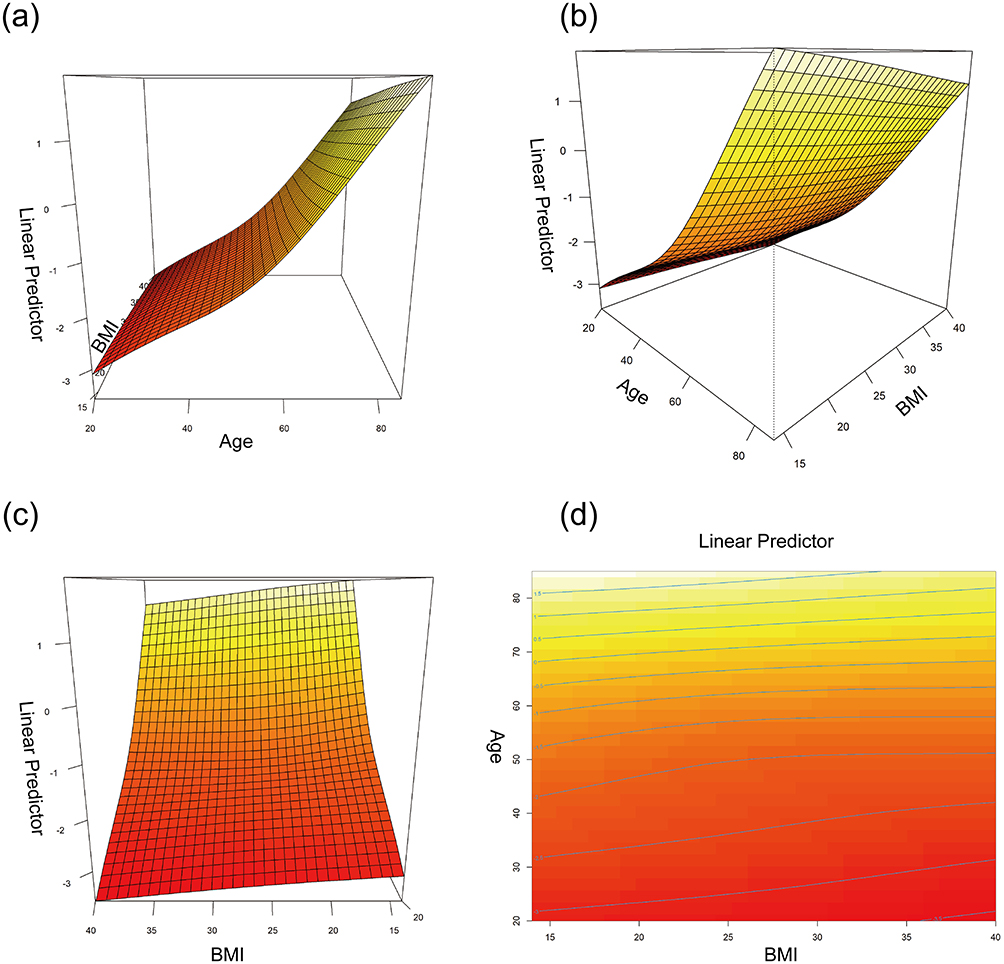 |
Figure 4 Different angles of exposure–response surface plots of the joint effect of BMI and age on all-cause mortality among hypertensive patients. The plots (a–c), and (d) represent the different angles. Adjusting for sex, systolic blood pressure, diastolic blood pressure, physical exercise, smoking, drinking, diabetes mellitus, family history of hypertension, family history of diabetes mellitus, family history of cardiovascular disease, and family history of stroke. |
Sensitivity Analyses
The sensitivity analyses yielded similar findings to the principal analyses. The patterns of the independent and joint effects of BMI and age on mortality risk were similar both in males and females (Figures S4–S6). After excluding participants who smoked, had been diagnosed with diabetes, or had less than 5 years of follow-up duration, we still observed that the associations were little changed (Figures S7 and S8).
Discussion
In this longitudinal population-based cohort study, we observed a U-shaped relation between BMI and all-cause mortality in patients with hypertension, with a trough at around 26–27 kg/m2. The exposure–response curves of BMI exhibited variations across different age levels, indicating the modifying effect of age on this relationship. Compared with patients with normal weight, underweight patients had an elevated risk of mortality in 20–85 years old hypertensives, whereas in middle-aged and older patients, overweight was related to decreased risk, and obesity was associated with reduced risk in 60–85 years old patients with hypertension. When treating both BMI and age as continuous variables, we observed a decrease in all-cause mortality as BMI increased in both younger and older patients at different levels of age, and BMI ranging from 25 to 30 kg/m2 conferred lower mortality risk than the normal range in middle-aged patients.
Our finding that underweight adults with hypertension were at high risk of mortality aligns with previous literature.8,10,22,23 A study of Chinese hypertensive participants ≥18 years old showed underweight was significantly associated with an 85% increased risk of death relative to normal weight.22 A study involving middle-aged and older hypertensive patients from southern China reported that underweight was related to a 65% higher risk for death than normal weight.8 The earlier reports from the same EHR system of Minhang showed that underweight was significantly correlated with high mortality among patients with hypertension.10,23 Nevertheless, existing evidence showed inconsistent findings. A Chinese retrospective cohort study involving hypertensive and normotensive participants aged 60 and older suggested underweight was not significantly related to an elevated risk of premature death in hypertensive patients.7 However, a nonlinear analysis in this study revealed that those with low BMI values had an increased mortality risk, and the differences may be attributed to residual confounding resulting from the artificial classification of BMI.7 Additionally, in our study, we found overweight was correlated with a reduced risk of death among 45 years old and older hypertensive patients, and particularly obesity was related to lower mortality in patients aged 60 years and older. A study recruiting Chinese hypertensive patients aged 45–75 years demonstrated that the cumulative incidence of all-cause death gradually decreased with BMI increasing, and patients aged over 60 years exhibited the optimal BMI within the obesity category.24 The Chinese study also reported a high BMI was related to a decreased risk for mortality in patients with hypertension aged 60 years and older, but they found no such significant association among those aged under 60 years.22 In our study, for younger patients, overweight and obesity were not statistically significantly associated with low mortality risk when BMI was modeled categorically, while the exposure-response surface plots revealed a more gradual decline trend in mortality with increasing BMI compared to older patients when BMI was modeled continuously. We speculated the response of mortality to a high BMI may be more sensitive in older patients than in younger patients. More epidemiological studies and animal experiments are warranted to test this hypothesis. However, some studies found inconsistent results among hypertensive patients with a high BMI.9,10 A prospective cohort study conducted among hypertensive patients aged 40 to 91 years in China revealed BMI ranging from 26 to 30 kg/m2 was not significantly correlated with all-cause mortality, while a BMI greater than 30 kg/m2 was found to be associated with a reduced risk of mortality.9 We observed a BMI greater than 30 kg/m² was significantly associated with an increased risk of mortality among patients aged 20 to 85 years. However, when taking age into account, this association was no longer present. Overweight or obesity was found to be correlated with a reduced risk in middle-aged and older patients instead. Whereas the earlier report showed middle-aged or older hypertensive patients with overweight or obesity do not exhibit a reduced risk of all-cause mortality.10 An American cohort study recruiting patients with hypertension revealed a high level of atherogenic index of plasma, which was positively associated with obesity,25 was not significantly related to a high risk of mortality in patients aged greater than 60 years.26 These differences may be attributed to the diverse ethnic populations, inadequate adjustment for covariates, and discrepant definitions of BMI categories boundaries.
The underlying mechanisms are not fully understood, but several possible explanations have been proposed. Firstly, overweight or obesity may be beneficial for survival among individuals with chronic diseases due to higher energy reserves and larger metabolic reserves produced by adiposity tissue.27 Underweight status was commonly accompanied by malnutrition, which can lead to compromised immune function and an elevated risk of infection.28 Secondly, underweight was associated with psychological disorders, and a low BMI was related to an increased risk of complete suicide.29 Thirdly, adiposity may not always confer detrimental health effects.30 It may be influenced by factors such as regional fat distribution, adaptive responses of adipose tissue to excessive caloric intake, and a specific type of fat accumulation.30 Fourthly, it has been reported that BMI may not be a reliable indicator of obesity in older adults, as it does not account for the loss of lean mass that occurs with growing age.31 Prior evidence revealed that low lean mass with obesity in older adults with hypertension had the highest risk of death versus those without low lean mass and obesity, while those with obesity but without low lean mass did not exhibit such an association.32 Overall, the relationship between BMI and mortality is complex and multifactorial. In future studies, it is important to clarify the mechanisms that underlie the association.
There are several strengths in the present study. Firstly, data were extracted from a longitudinal community-based cohort with a large sample size, extended follow-up duration, and standard operating procedures for data collection. Secondly, our study included participants spanning from 20 to 85 years old, which is a broader age range compared to previous studies. Thus, our findings can be generalizable to hypertensive adults across a wider age range. Thirdly, we utilized additive Cox proportional hazards models, with thin plate smoothing functions to draw exposure-response surface plots. This method allowed for a visual representation of the association of continuous BMI and age with all-cause mortality while avoiding residual confounding attributed to artificial classification.
Potential limitations must be noted in our study. Primarily, BMI was calculated by using self-reported weight and height. However, it has been reported that self-reported anthropometric estimates can be used in the multiethnic Asian population.33 Secondly, due to insufficient information on other chronic diseases at recruitment in the database, we just exclude those with preexisting diabetes mellitus in sensitivity analyses. Although the sensitivity analyses showed similar results, it is important to note that other chronic diseases may affect the relationship between BMI and mortality risk. However, in another study conducted in China, when excluding participants with various preexisting conditions such as coronary heart disease, stroke, cancer, or acquired organic diseases, the association between BMI and all-cause mortality remained unchanged.24 Additionally, we also excluded participants within the first 5 years of follow-up to some extent to minimize the potential impact of reverse causality. Thirdly, only the information on BMI at baseline was analyzed, and changes in BMI during follow-up may impact the observed outcome. Additional studies are warranted to explore the relationship between BMI variability and the risk of mortality among patients with hypertension in the future. Fourthly, we extracted data from Shanghai, the largest urban center in China, which may be a lack of generality for China. Therefore, future studies are needed to explore the association between different populations to confirm our findings.
Conclusion
We found a U-shaped relationship between BMI and all-cause mortality in Chinese patients with hypertension aged 20–85 years, with a trough at 26–27 kg/m2. However, the relation pattern of BMI and all-cause mortality varied by age. Therefore, taking age at diagnosis of hypertension into account in designing individualized weight management interventions may be beneficial for patients with hypertension. Our findings suggested moderate weight gain may be recommended for all-aged underweight adults with hypertension, and being overweight may benefit longevity for middle-aged and older patients.
Abbreviations
BMI, Body mass index; CVD, Cardiovascular diseases; HER, Electronic health record; SBP, systolic blood pressure; DBP, diastolic blood pressure; WHO, World Health Organization; CDC, Center for Disease Control and Prevention; DAG, Directed acyclic graph; ICD-10, International Statistical Classification of Diseases and Related Health Problems, 10th revision; SD, standard deviation; HRs, hazard ratios; CIs, confidence intervals; df, degrees of freedom.
Ethics Approval and Informed Consent
The study was approved by the Institutional Review Board of Minhang District Center for Disease Control and Prevention (NO: EC-P 2019-009). Informed consent from participants was not required, as anonymized data was collected from electronic medical records in this study.
Acknowledgments
The investigators are grateful to the dedicated participants and all research staff of the study.
Author Contributions
All authors made a significant contribution to the work reported, whether that is in the conception, study design, execution, acquisition of data, analysis, and interpretation, or in all areas; took part in drafting, revising, or critically reviewing the article; gave final approval of the version to be published; have agreed on the journal to which the article has been submitted; and agree to be accountable for all aspects of the work.
Funding
This study was funded by the National Natural Science Foundation of China (grants 82173612 and 82273730); Shanghai Rising-Star Program (21QA1401300); Shanghai Municipal Natural Science Foundation (22ZR1414900); Shanghai Municipal Science and Technology Major Project (ZD2021CY001).
Disclosure
The authors declare that they have no known competing financial interests or personal relationships that could have appeared to influence the work reported in this paper.
References
1. Blüher M. Obesity: global epidemiology and pathogenesis. Nat Rev Endocrinol. 2019;15(5):288–298. doi:10.1038/s41574-019-0176-8
2. Mills KT, Stefanescu A, He J. The global epidemiology of hypertension. Nat Rev Nephrol. 2020;16(4):223–237.
3. Collaborators GBDCo D. Global, regional, and national age-sex-specific mortality for 282 causes of death in 195 countries and territories, 1980–2017: a systematic analysis for the global burden of disease study 2017. Lancet. 2018;392(10159):1736–1788. doi:10.1016/S0140-6736(18)32203-7
4. Global BMIMC, Di Angelantonio E, Bhupathiraju S, et al. Body-mass index and all-cause mortality: individual-participant-data meta-analysis of 239 prospective studies in four continents. Lancet. 2016;388(10046):776–786. doi:10.1016/S0140-6736(16)30175-1
5. (NCD-RisC) NRFC. Worldwide trends in hypertension prevalence and progress in treatment and control from 1990 to 2019: a pooled analysis of 1201 population-representative studies with 104 million participants. Lancet. 2021;398(10304):957–980. doi:10.1016/S0140-6736(21)01330-1
6. Oparil S, Acelajado MC, Bakris GL, et al. Hypertension. Nat Rev Dis Primers. 2018;4(1):18014. doi:10.1038/nrdp.2018.14
7. Bai K, Chen X, Shi Z, et al. Hypertension modifies the associations of body mass index and waist circumference with all-cause mortality among older Chinese: a retrospective cohort study. BMC Geriatr. 2022;22(1):441. doi:10.1186/s12877-022-03057-9
8. Chung WS, Ho FM, Cheng NC, Lee MC, Yeh CJ. BMI and all-cause mortality among middle-aged and older adults in Taiwan: a population-based cohort study. Public Health Nutr. 2015;18(10):1839–1846. doi:10.1017/S136898001400281X
9. Li K, Yao C, Yang X, et al. Body mass index and the risk of cardiovascular and all-cause mortality among patients with hypertension: a population-based prospective cohort study among adults in Beijing, China. J Epidemiol. 2016;26(12):654–660. doi:10.2188/jea.JE20150323
10. Wang Y, Wang Y, Qain Y, et al. Association of body mass index with cause specific deaths in Chinese elderly hypertensive patients: Minhang community study. PLoS One. 2013;8:8.
11. Xu W, Shubina M, Goldberg SI, Turchin A. Body mass index and all-cause mortality in patients with hypertension. Obesity. 2015;23(8):1712–1720.
12. Javed AA, Aljied R, Allison DJ, Anderson LN, Ma J, Raina P. Body mass index and all-cause mortality in older adults: a scoping review of observational studies. Obes Rev. 2020;21(8):e13035. doi:10.1111/obr.13035
13. Garcia GR, Coleman NC, Pond ZA, Pope CA. Shape of BMI-mortality risk associations: reverse causality and heterogeneity in a representative cohort of US adults. Obesity. 2021;29(4):755–766. doi:10.1002/oby.23114
14. Becher H. The concept of residual confounding in regression models and some applications. Stat Med. 1992;11(13):1747–1758. doi:10.1002/sim.4780111308
15. Jayedi A, Shab-Bidar S. Nonlinear dose-response association between body mass index and risk of all-cause and cardiovascular mortality in patients with hypertension: a meta-analysis. Obes Res Clin Pract. 2018;12(1):16–28.
16. Hypertension; 2023. Available from: https://www.who.int/news-room/fact-sheets/detail/hypertension.
17. Consultation WE. Appropriate body-mass index for Asian populations and its implications for policy and intervention strategies. Lancet. 2004;363:9403):157–163.
18. International statistical classification of diseases and related health problems 10th revision; 2019. Available from: https://icd.who.int/browse10/2019/en.
19. Definition and diagnosis of diabetes mellitus and intermediate hyperglycaemia: report of a WHO/IDF consultation; 2006. Available from: https://apps.who.int/iris/handle/10665/43588.
20. Hastie T, Tibshirani R. Generalized Additive Models. London: Chapman & Hall; 1990:335.
21. Greenland S. Basic problems in interaction assessment. Environ Health Perspect. 1993;4(Suppl 4):59–66.
22. Zhou Q, Liu X, Zhao Y, et al. BMI and risk of all-cause mortality in normotensive and hypertensive adults: the rural Chinese cohort study. Public Health Nutr. 2021;24(17):5805–5814. doi:10.1017/S1368980021001592
23. Zhu J, Liu X, Zhang J, et al. Time-varying association between body mass index and all-cause mortality in patients with hypertension. Int J Obes. 2022;46(2):316–324.
24. Yang W, Li JP, Zhang Y, et al. Association between body mass index and all-cause mortality in hypertensive adults: results from the China Stroke Primary Prevention Trial (CSPPT). Nutrients. 2016;8(6):384. doi:10.3390/nu8060384
25. Zhang J-S, Yeh W-C, Tsai Y-W, Chen J-Y. The relationship between atherogenic index of plasma and obesity among adults in Taiwan. Int J Environ Res Public Health. 2022;19(22). doi:10.3390/ijerph192214864
26. Duiyimuhan G, Maimaiti N. The association between atherogenic index of plasma and all-cause mortality and cardiovascular disease-specific mortality in hypertension patients: a retrospective cohort study of NHANES. BMC Cardiovasc Disord. 2023;23(1):452. doi:10.1186/s12872-023-03451-0
27. Karampela I, Chrysanthopoulou E, Christodoulatos GS, Dalamaga M. Is there an obesity paradox in critical illness? Epidemiologic and metabolic considerations. Curr Obes Rep. 2020;9(3):231–244. doi:10.1007/s13679-020-00394-x
28. Dobner J, Kaser S. Body mass index and the risk of infection - from underweight to obesity. Clin Microbiol Infect. 2018;24(1):24–28. doi:10.1016/j.cmi.2017.02.013
29. Perera S, Eisen RB, Dennis BB, et al. Body mass index is an important predictor for suicide: results from a systematic review and meta-analysis. Suicide Life Threat Behav. 2016;46(6):697–736. doi:10.1111/sltb.12244
30. Antonopoulos AS, Tousoulis D. The molecular mechanisms of obesity paradox. Cardiovasc Res. 2017;113(9):1074–1086. doi:10.1093/cvr/cvx106
31. Wannamethee SG, Atkins JL. Muscle loss and obesity: the health implications of sarcopenia and sarcopenic obesity. Proc Nutr Soc. 2015;74(4):405–412. doi:10.1017/S002966511500169X
32. Qu Q, Guo Q, Sun J, et al. Low lean mass with obesity in older adults with hypertension: prevalence and association with mortality rate. BMC Geriatrics. 2023;23(1):619. doi:10.1186/s12877-023-04326-x
33. Roystonn K, Abdin E, Sambasivam R, et al. Accuracy of self-reported height, weight and BMI in a multiethnic Asian population. Ann Acad Med Singap. 2021;50(4):306–314. doi:10.47102/annals-acadmedsg.2020183
 © 2023 The Author(s). This work is published and licensed by Dove Medical Press Limited. The
full terms of this license are available at https://www.dovepress.com/terms
and incorporate the Creative Commons Attribution
- Non Commercial (unported, 3.0) License.
By accessing the work you hereby accept the Terms. Non-commercial uses of the work are permitted
without any further permission from Dove Medical Press Limited, provided the work is properly
attributed. For permission for commercial use of this work, please see paragraphs 4.2 and 5 of our Terms.
© 2023 The Author(s). This work is published and licensed by Dove Medical Press Limited. The
full terms of this license are available at https://www.dovepress.com/terms
and incorporate the Creative Commons Attribution
- Non Commercial (unported, 3.0) License.
By accessing the work you hereby accept the Terms. Non-commercial uses of the work are permitted
without any further permission from Dove Medical Press Limited, provided the work is properly
attributed. For permission for commercial use of this work, please see paragraphs 4.2 and 5 of our Terms.
Recommended articles
Prevalence, Awareness, and Factors Associated with Hypertension Among People Living with HIV in Eastern Uganda. A Multicentre Cross-Sectional Study
Kanyike AM, Nakawuki AW, Akech GM, Kihumuro RB, Kintu TM, Nalunkuma R, Nakandi RM, Mugabi J, Twijukye N, Bwayo D, Katuramu R
HIV/AIDS - Research and Palliative Care 2024, 16:325-335
Published Date: 2 September 2024
Prediction of Hypertension Based on Anthropometric Parameters in Adolescents in Eastern Sudan: A Community-Based Study
Saad AH, Hassan AA, Al-Nafeesah A, AlEed A, Adam I
Vascular Health and Risk Management 2024, 20:511-519
Published Date: 20 November 2024
Association Between Triglyceride Glucose Index and Hypertension According to Different Diagnostic Criteria
Hao H, Geng H, Ma M
International Journal of General Medicine 2025, 18:43-53
Published Date: 6 January 2025
Association Between Dietary Patterns and All-Cause Mortality in Individuals with Hypertension and Osteoporosis: A Retrospective Cohort Study
Guan J, Ding L, Wang Y, Zhu Z, Pan M, Du L, Yin N
Journal of Multidisciplinary Healthcare 2025, 18:3781-3791
Published Date: 30 June 2025