Back to Journals » Nature and Science of Sleep » Volume 15
Adaptation and Validation of the Turkish Version of the Ford Insomnia Response to Stress Test in University Students
Authors Uygur OF ![]() , Ahmed O
, Ahmed O ![]() , Bahar A, Hursitoglu O
, Bahar A, Hursitoglu O ![]() , Aydın EF
, Aydın EF ![]() , Chung S
, Chung S ![]() , Ozcan H, Drake CL
, Ozcan H, Drake CL ![]()
Received 2 December 2022
Accepted for publication 20 March 2023
Published 27 March 2023 Volume 2023:15 Pages 139—149
DOI https://doi.org/10.2147/NSS.S398489
Checked for plagiarism Yes
Review by Single anonymous peer review
Peer reviewer comments 2
Editor who approved publication: Dr Sarah L Appleton
Omer Faruk Uygur,1 Oli Ahmed,2 Aynur Bahar,3 Onur Hursitoglu,4 Esat Fahri Aydın,1 Seockhoon Chung,5 Halil Ozcan,1 Christopher L Drake6,7
1Department of Psychiatry, Ataturk University School of Medicine, Erzurum, Turkey; 2Department of Psychology, University of Chittagong, Chattogram, Bangladesh; 3Department of Psychiatric Nursing, Gaziantep University Faculty of Health Sciences, Gaziantep, Turkey; 4Department of Psychiatry, Sular Academy Hospital, Kahramanmaras, Turkey; 5Department of Psychiatry, Asan Medical Center, University of Ulsan College of Medicine, Seoul, Republic of Korea; 6Henry Ford Hospital Sleep Disorders and Research Center, Detroit, MI, USA; 7Department of Psychiatry and Behavioral Neurosciences, Wayne State College of Medicine, Detroit, MI, USA
Correspondence: Omer Faruk Uygur, Department of Psychiatry, Ataturk University School of Medicine, Erzurum, Turkey, Tel +90 442 344 66 66, Email [email protected]
Objective: We adapted the Ford Insomnia Response to Stress Test to Turkish (FIRST-T) and validated it.
Methods: We randomly divided 774 Turkish university students into two equal groups for exploratory (EFA) and confirmatory factor analysis (CFA). McDonald’s omega and Cronbach’s alpha values were utilized for reliability analyses. Item response theory (IRT) approach also used for psychometric properties on the full sample. For discriminant validity, study sample were classified into high and low sleep reactivity groups, and their sociodemographic and sleep data were compared.
Results: EFA results suggested a one-factor structure of the FIRST-T, which was confirmed by CFA results. The FIRST-T had solid internal reliability. Item analysis results showed that all the items could distinguish between low and high scorers. This scale showed the same construct (clinical insomnia vs good sleepers) across the sexes in multi-group CFA and differential item functioning results. In the high FIRST-T score group, sleep quality, severity of insomnia, and anxiety scores were higher. In this group, more participants had clinical insomnia according to the Insomnia Severity Index (ISI) and were poor sleepers according to the Pittsburg Sleep Quality Index (PSQI) (p < 0.01).
Conclusion: The FIRST-T has robust psychometric properties that assesses sleep reactivity among university students.
Keywords: adaptation, ford insomnia response to stress test, sleep reactivity, stress-related-insomnia, validation
Introduction
Insomnia is characterized by severe disruption in sleep quality, with negative daytime consequences, such as fatigue, attention deficit, and mood instability.1 A consensus has developed from the different population-based studies that almost one-third of the general society experience insomnia symptoms, while approximately 10% report insomnia disorder.2 Insomnia is more common in undergraduate students and affect their academic achievement.3,4 The clinical insomnia and poor sleep has been found at 15.9% and 74%, respectively, in the Turkish university student population.5
Two important risk factors that predispose to insomnia, related to the robust stress-diathesis model of insomnia, have been considered in the literature.6–9 The first is a family history of insomnia, particularly a maternal history of insomnia.10,11 However, people may not be able to distinguish reliability between acute sleep disturbance and insomnia disorder in family members, and most people are unaware of their family’s health status.11 These limitations make it difficult to identify an individual prone to insomnia based on family history alone.7
The second predictive factor for insomnia in the literature is sleep reactivity.12–16 This is also called “vulnerability to stress”-related insomnia.17 It reflects the level to which individuals experience the possibility of insomnia during stressful events. First research has found that people with high sleep reactivity experience more sleep disruption after stress in interpersonal relationships or following stimulant administration at night than do people with low sleep reactivity.12 Thus, the former demonstrates an overly reactive/sensitive sleep system.12 Researchers first used polysomnography to assess between individuals with high and low sleep reactivity following the stress of a first night in the sleep clinic.12,13 The literature supports that sleep reactivity both triggers acute sleep disturbance18 and is a predictive factor for insomnia disorder.8 Individuals with high sleep reactivity may have difficulty falling and staying asleep even after the removal of a given stressor, whereas those with low sleep reactivity may experience mild sleep disturbances after stress, but this typically does not become chronic, and sleep patterns return to normal after the stress disappears.7,17 A polygenic effect is recognized in sleep reactivity: genetic studies have found that 29–37% of sleep reactivity is hereditary and that it is higher in females than in males.19,20 Moreover, sleep reactivity leads to treatment resistance in insomnia treatment. For example, cognitive behavioral therapy for insomnia does not sufficiently provide the expected effect in individuals with high sleep reactivity.21
Laboratory stress combined with the use of objective sleep measures has provided strong validity for the measurement of sleep reactivity.7,16 However, a need for a lower-cost, fast, and easy instrument for assessing sleep reactivity was perceived. In this context, the Ford Insomnia Response to Stress Test (FIRST) was created in 2004 to estimate the level of sleep reactivity. This self-reporting test consists of nine items and shows good psychometric properties.12 It has been translated into many languages6,22–26 and is increasingly being used. Cronbach’s α coefficient was reported as 0.83 and its test–retest coefficient (r) was reported as 0.92 for the original version of the FIRST.12 Many studies have used the participants’ median FIRST score to distinguish between low and high sleep reactivity. High FIRST scores were associated with an increased percentage of stage 1 sleep on a nocturnal polysomnogram (n-PSG), longer sleep latency, and lower sleep efficiency.14 In addition, under high-stress conditions, individuals with high FIRST scores showed more arousals and stage transitions and a decreased rate of rapid eye movement sleep on an n-PSG than those with a low FIRST score.27 Sleep reactivity using the FIRST has also been validated as a predictor of insomnia following a cancer diagnosis.28 In light of the above findings, the FIRST may help as a tool to predict development of insomnia after various types of stress exposures.
We aimed to adapt the FIRST into Turkish and examine the psychometric properties of the new form. To date, no study has both tested the psychometric properties of the FIRST or assessed sleep reactivity among the Turkish population.
Materials and Methods
Adaptation of the FIRST
We completed the translation process of the scale into Turkish before the validity and reliability analysis of the scale. We carried out the scale translation and back translation processes recommended in the literature together with experts in the field of sleep.
We used the Davis method to assess content validity.29 First, we mailed the final version of FIRST-T to 12 experts in the field of sleep. Second, we received their assessments of the scale items from each expert. Lastly, we evaluated content validity index (CVI) scores for each item. CVI scores for each item were found above 0.83. Therefore, based on content validity,30 no drop or revision of any item was made.
Psychometric Tools
Sociodemographic Factors and Chronic Disease
We created an instrument requesting sociodemographic and sleep variables like age, sex, marital status, education, and previous or current sleep medicine. The presence of chronic diseases was determined by self-report. Participants were asked, “Do you have a chronic illness that requires constant medication?” (eg, diabetes, hypertension, chronic obstructive pulmonary disease, hypothyroidism, etc.) with response options of yes or no.
Ford Insomnia Response to Stress Test- Turkish version
The FIRST-T is a self-report questionnaire assessing the possibility of insomnia in response to nine specific stressful events (eg, “after a stressful experience during the day”, “before an important meeting the next day”). All items are rated: not likely = 1, somewhat likely = 2, moderately likely = 3, and very likely = 4. A total score between 9 and 36 points can be obtained from the scale. High scores represent higher levels of sleep reactivity.12
Pittsburgh Sleep Quality Index
The PSQI is a self-reported tool evaluating sleep quality in the last month. It contains seven parts: sleep time, latency, disturbance, sleep efficiency, use of sleep drug, quality of sleep, and daytime dysfunction due to sleepiness.31 Each sub-scale is pointed from 0 to 3 and the total score is derived as the sum of the scores of the seven parts. High scores represent poor sleep quality.31 In many studies conducted globally, including in Turkey, those with PSQI scores ≥ 5 were classified as poor sleepers.32 The Turkish version of PSQI has solid psychometric properties.33 We found high internal consistency (Cronbach’s α = 0.80) in the current study.
Insomnia Severity Index
The ISI is a seven-item, a self-rated index used to determine the severity of insomnia.34 It has a 5-point Likert scale used to rate each item, with a total score changing from 0 to 28. A total score above 14 indicates clinical insomnia.22–28 Boysan et al found a sufficient internal consistency coefficient (Cronbach’s α = 0.79) of the Turkish version of the ISI.35 We found robust internal consistency (Cronbach’s α = 0.80) in our study.
State–Trait Anxiety Inventory
The STAI evaluates both state and trait anxiety, in two parts. Each part consists of 20 questions that are scored using a 4-point Likert scale.36 The total score ranges between 20 and 80 for each section, with high scores showing high anxiety.36 We used the STAI in this study because both state and trait anxiety are predisposing factors for insomnia. In the present study, the STAI showed robust psychometric properties (Cronbach’s α = 0.87).
Procedure
The Gaziantep University Clinical Research Ethics Committee approved our study (decision number: 2022/114). This study was an online survey carried out in Turkey in May 2022. The researchers designed questionnaires that included a sociodemographic data form, FIRST-T, PSQI, ISI and STAI online via Google Forms. Then, we shared an online study link via WhatsApp to university students studying at various campuses of Gaziantep University through university student representatives. All participants approved an informed consent form after opening the survey link. Our study was conducted complies with the Declaration of Helsinki.
Statistical Analysis
The data were analyzed using SPSS 23.0 (IBM Corp., Armonk, NY, USA), Jamovi 2.2 (https://www.jamovi.org/download.html), and Rstudio (https://posit.co/download/rstudio-desktop/). Descriptive statistics were presented with means, or frequencies. McDonald’s ω, Cronbach’s α, inter-item correlations, and item-total score correlation coefficient were calculated for reliability analyses. The skewness–kurtosis values found out if the data is normally distributed.
Exploratory factor analysis (EFA) and confirmatory factor analysis (CFA) were used to examine the factor structure of FIRST-T. The EFA and CFA should be analyzed in diverse groups, as indicated in the literature.37–39 Hence, we randomly split all the participants into equal groups: group A (n = 387) for EFA and group B (n = 387) for CFA. We also utilized the item response theory (IRT) approach and the graded response model (GRM) to estimate slope (a), an item’s fit, and threshold values (b) for the IRT model.
We also checked the predictive validity of the FIRST-T via compared the total score of the FIRST-T between poor and good sleeper groups defined by the PSQI, and between the clinical insomnia and the non-clinical insomnia group according to the ISI, via independent t-tests. As in previous validation studies, we also divided all participants into high and low sleep reactivity groups, based on the median score of the FIRST-T.6,12,24,27 We compared sociodemographic variables, sleep quality, insomnia severity, and state–trait anxiety between these two sets.
Based on the literature, we used the following values for model fitting: the criteria of chi-square / degree of freedom < 3.0, Tucker–Lewis index > 0.95, comparative fit index (CFI) > 0.90, root-mean-square-error of approximation (RMSEA) ≤ 0.08, and a standardized root-mean-square residual close to or below 0.07 for model fitting.40,41 We accepted reliability values above 0.70. Items with a factor load > 0.32 were interpreted as meaningful. P-values < 0.05 were accepted as statistically meaningful.42,43
Results
Participants
Table 1 presents the sociodemographic and sleep variables of the whole sample. The study completed 774 university students (79.8% female and 20.2% male; Table 1). Participants’ age ranged from 18 to 41 years. The vast majority of participants were not married, and most participants lived with their families. Few participants had a chronic disease. The mean PSQI of the participants was 7.97 ± 3.94, the mean ISI was 10.31 ± 5.04, and the mean FIRST-T score was 23.42 ± 5.73. Female participants had a significantly higher FIRST score than male (24.17 ± 5.59 vs 20.47 ± 5.32).
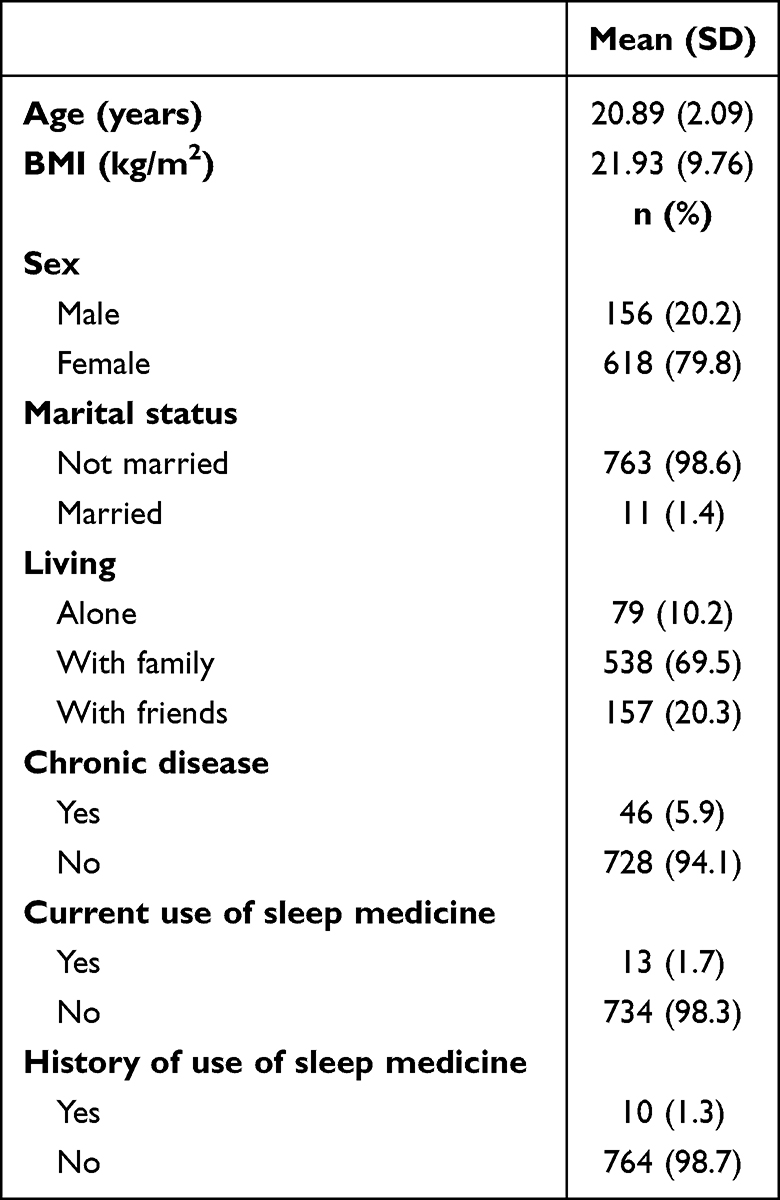 |
Table 1 Sociodemographic and Clinic Variables of Whole Sample |
Descriptive Statistics of FIRST-T
Table 2 presents the item-level properties and Table 3 presents the scale-level properties of the FIRST-T. Skewness (ranging between −0.554 and −0.647) and kurtosis values (ranging between −1.118 and −0.532) suggested normality of the item-level data.
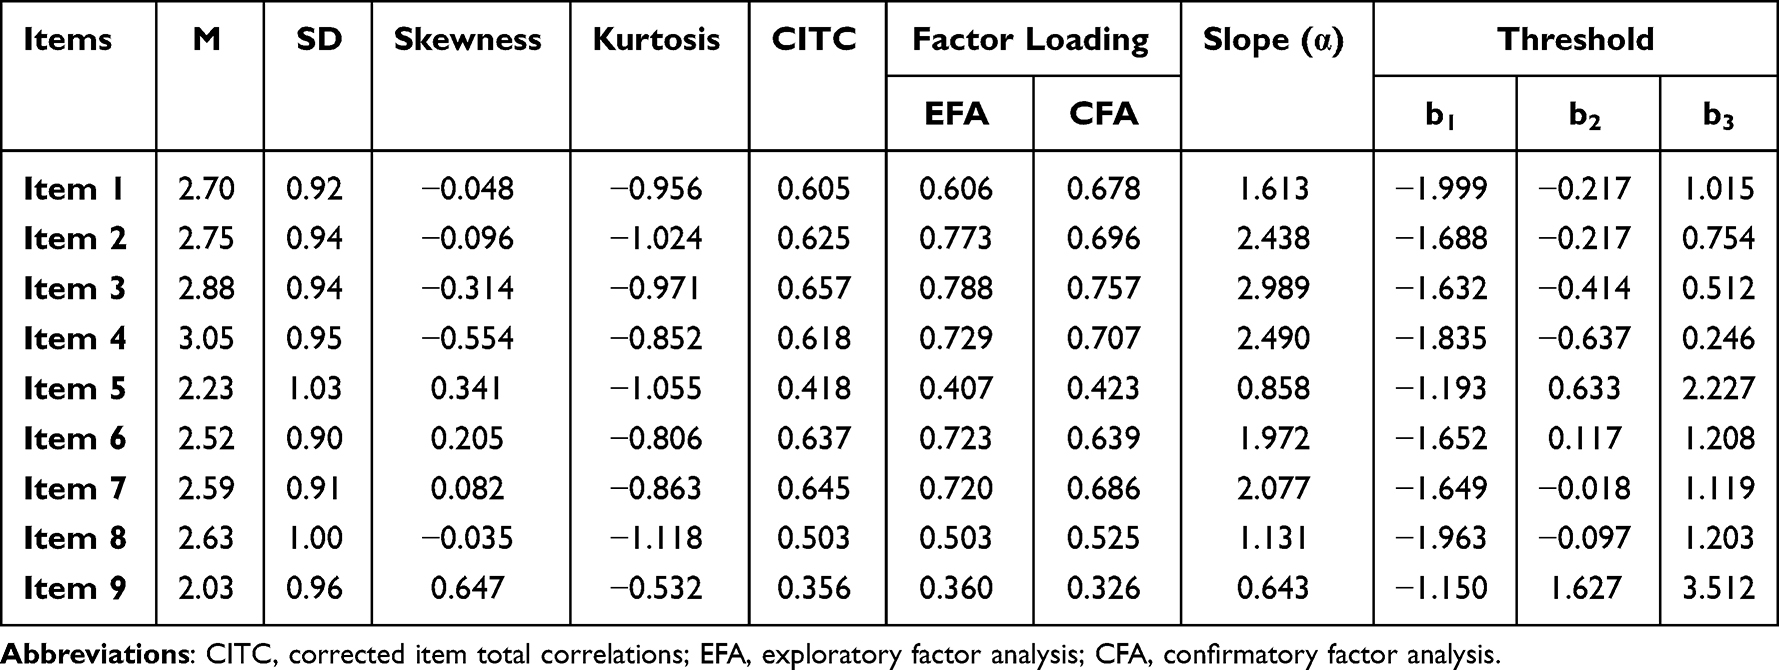 |
Table 2 Item-Level Properties of the FIRST-T |
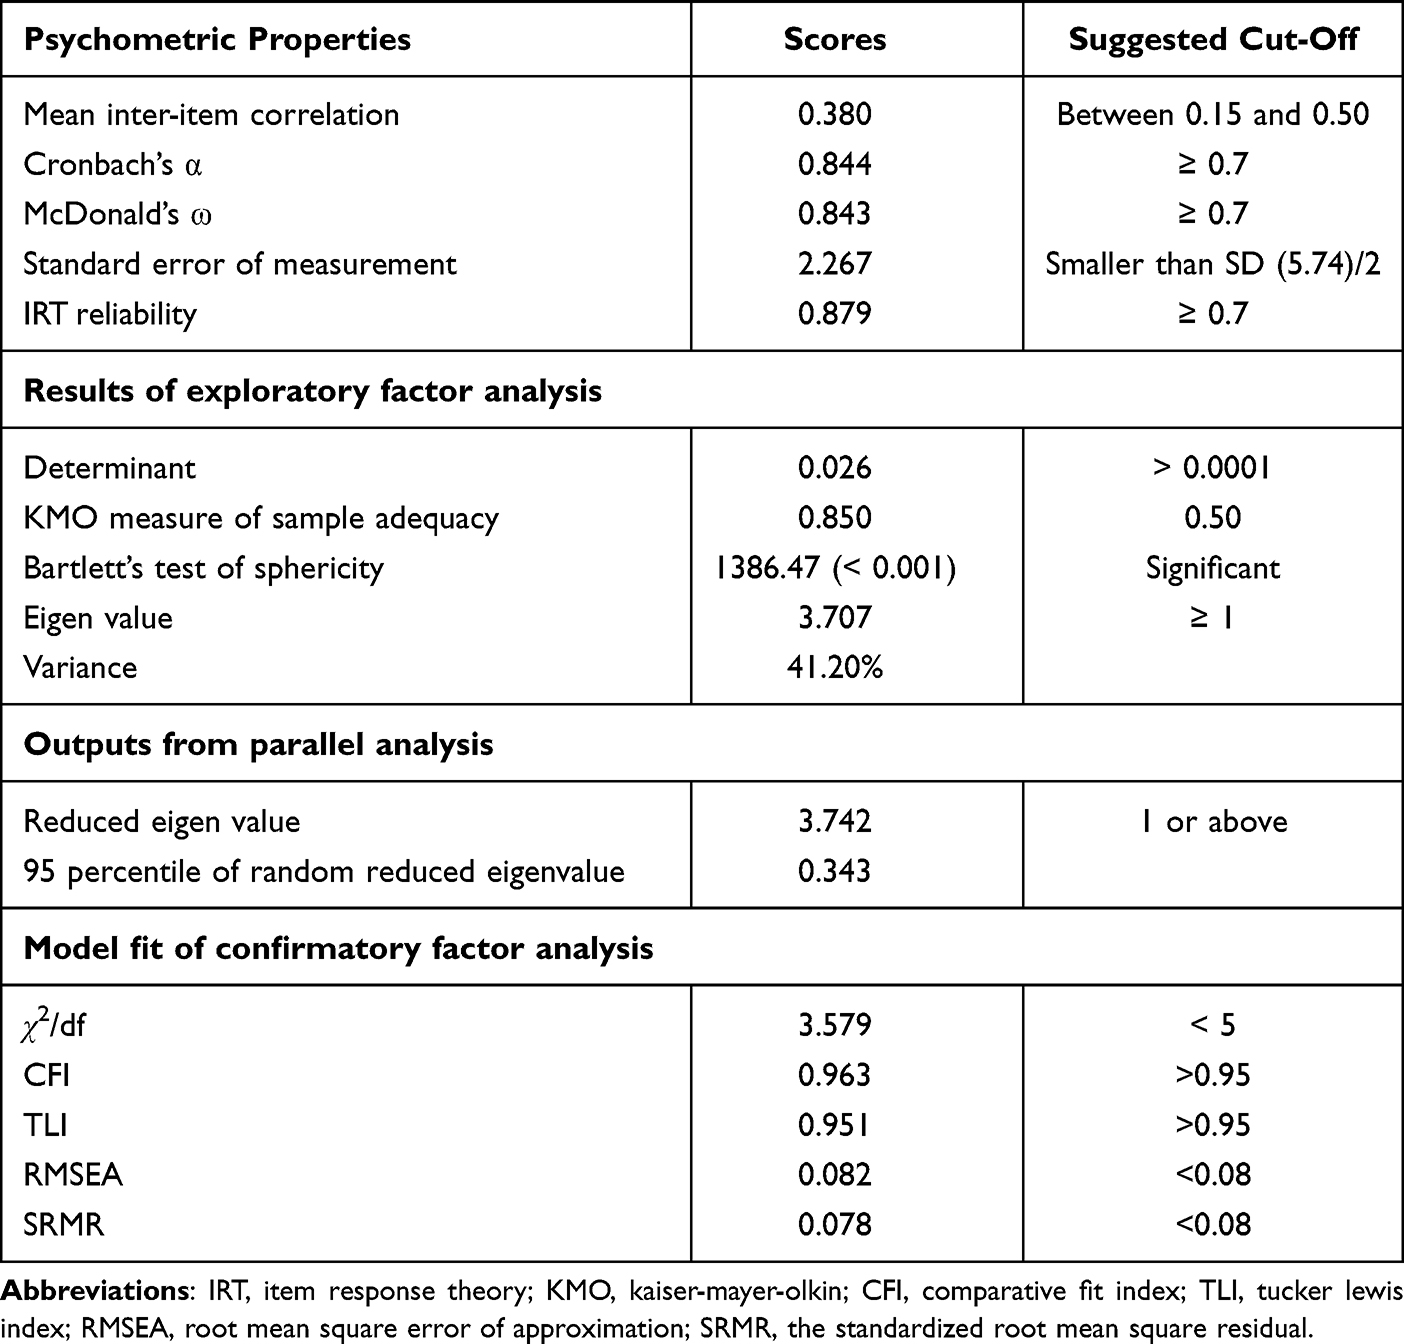 |
Table 3 Scale-Level Properties of the FIRST-T |
Factor Analysis
First, we analyzed EFA for factor analysis in group A. The Kaiser–Meyer–Olkin value (0.850), Bartlett’s test of sphericity (χ2 = 1386.47, p < 0.001), and determinant value (0.026) (Table 3) suggested the suitability of the data for exploratory factor analysis.44,45 Parallel analysis results (Table 3) suggested that only one factor had an eigenvalue above 1 (3.742). A scree plot with a reduced correlation matrix (Supplementary Figure 1) showed similar results. Factor analysis with oblimin rotation suggested that this single factor had an eigenvalue of 3.707 and explained 41.20% of the scale variance. Table 2 shows that factor loading of items in the EFA ranged between 0.360 and 0.788, which was above the recommended cut-off.43
Second, CFA was conducted in group B. Model fit statistics of confirmatory factor analysis in Table 3 presented that the one-factor structure had a good model fit (χ2/df = 3.579, TLI = 0.951, CFI = 0.963, RMSEA = 0.082, SRMR = 0.078). Factor loadings ranged between 0.326 and 0.757 (Table 2). Item 5 (0.423) and Item 9 (0.326) have relatively lower factor loadings. Figure 1 presents the factor structure of the FIRST-T based on CFA outputs. Supplementary Table 1 shows that the p-values for Δχ2 for metric and scalar invariance between male and female participants were significant. Supplementary Table 2 presents multigroup CFA results of the FIRST-T. As χ2 is sensitive to sample size, we relied on ΔCFA and ΔRMSEA. ΔCFA and ΔRMSEA values suggested that the FIRST-T demonstrated scale measurement invariance across the sexes for clinical insomnia and poor sleep quality.
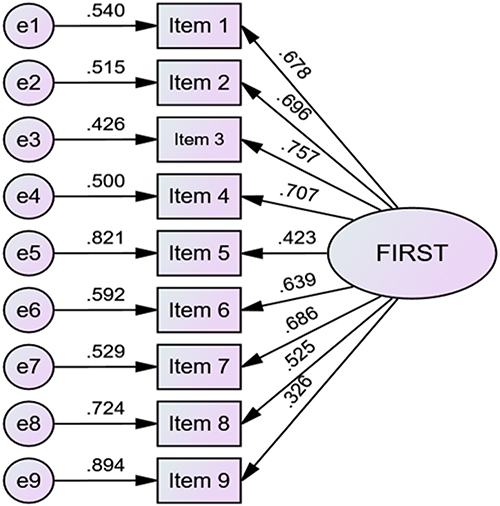 |
Figure 1 Factor structure of the FIRST-T. |
Graded Response Model
Supplementary Table 2 presents the fit of items of the FIRST-T in the graded response model. Corresponding p-values of S-χ2 for items 1, 3, 4, and 9 suggested that the fit for these items is not satisfactory. These items do not belong to the same construct. However, RMSEA values suggested that all the items belong to the same construct. As the sample size is large, we prefer here RMSEA outputs over S-χ2. Slope parameters for items of the FIRST-T ranged between 0.643 and 2.989 (Table 2). Item 9 had a low slope, items 5 and 8 had a moderate slope, item 1 had a high slope, and the rest of the items had a very slope. These slope parameters suggested that item 9 is less efficient in discriminating between low scorers and high scorers on the FIRST-T than are other items. Threshold parameters suggested that an above-average latent trait or theta is required to endorse response options, “moderately likely” and “very likely” response options, in items 5, 6, and 9, as compared to other items. However, threshold characteristic curves (Figure 2) show that the threshold curve for the response option “moderately likely” did not perform well, particularly for item 9. Item information curves (Supplementary Figure 2) showed that flat item information curves for items 5 and 9 suggest that these two items are not efficient to provide information about the latent construct assessed by the FIRST-T. The scale information curve (Figure 3) presents that the scale provides more information about the latent construct of people between −0.50 θ level to 0.75 θ level. There are two peaks in the scale information curve. These two peaks might be the polytomous nature of the data.
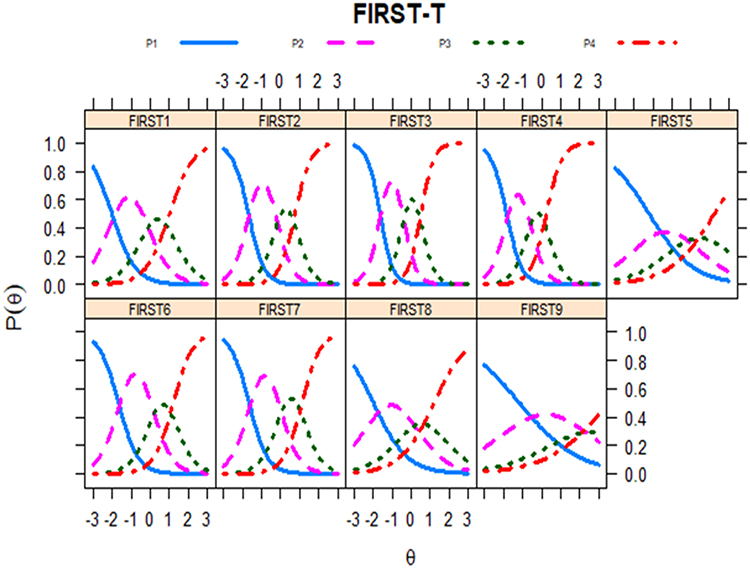 |
Figure 2 Threshold characteristic curves of the FIRST-T. |
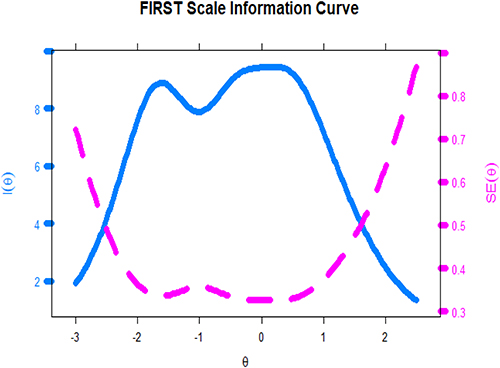 |
Figure 3 Scale information curve of the FIRST-T. |
Supplementary Table 3 and Supplementary Figures 3–8 present differential item functioning (DIF) information of the FIRST-T through likelihood ratio. Nonsignificant p-values (Supplementary Table 3) suggested the absence of differential item functioning bias across sex, having clinical insomnia and poor sleep quality. Supplementary Figures 3–5 present information about threshold level differential item functioning bias across the sexes for having clinical insomnia and poor sleep quality, respectively. Supplementary Figures 6Supplementary Figures 6–8 presents information about scale-level differential item functioning bias across the sexes, for having clinical insomnia and poor sleep quality, respectively.
Reliability Analysis
Corrected item-total correlation values in Table 1 ranged between 0.356 and 0.645, which were above the advised value ≥ 0.30.43 These corrected item-total correlation values suggested that these items can differentiate between low and high scorers in the FIRST-T. The scale has robust internal consistency (α = 0.844, ω = 0.843). The average inter-item correlation (0.380) was within the recommended cut-off. The standard error of measurement [2.267] of this scale is also below half of the standard deviation (5.74) of the total score. In addition, this scale also has good IRT reliability (0.879).
Convergent Validity (Association of FIRST-T with the PSQI, ISI, and STAI)
We used Pearson’s correlation with other tools for the convergent validity. We determined significant positive correlations between the total score of the FIRST-T and the PSQI (r = 0.36, p < 0.01), ISI (r = 0.44, p < 0.01), STAI-I (r = 0.30, p < 0.01) and STAI-II (r = 0.25, p < 0.01) scores in our study. In addition, we found a significant correlation between seven PSQI sub-dimensions and FIRST. The highest correlation between FIRST-T and PSQI sub-dimension was between sleep quality and FIRST-T (r = 0.31, p < 0.01).
Discriminant Validity (According to FIRST-T Median Score of All the Participants)
As in previous studies,6,12,22–26 we accepted the median score of the FIRST-T as the cut-off value and divided all participants into a low FIRST-T score group and a high FIRST-T score group (high sleep reactivity > 23; n = 377; mean = 28.28 ± 3.14 and low sleep reactivity ≤ 23; n = 397; mean = 18.80 ± 3.30). When we compared the two groups, the FIRST-T, PSQI, ISI, and STAI scores were statistically significantly higher in the high FIRST group. While the number of women was higher in the high FIRST group, mean age was lower than that in the low FIRST-T group. In the high FIRST group, more participants were evaluated as having clinical insomnia, according to the ISI (ISI >14), and poor sleep according to PSQI (PSQI ≥ 5). Table 4 displays more detailed information about the comparison between the two groups
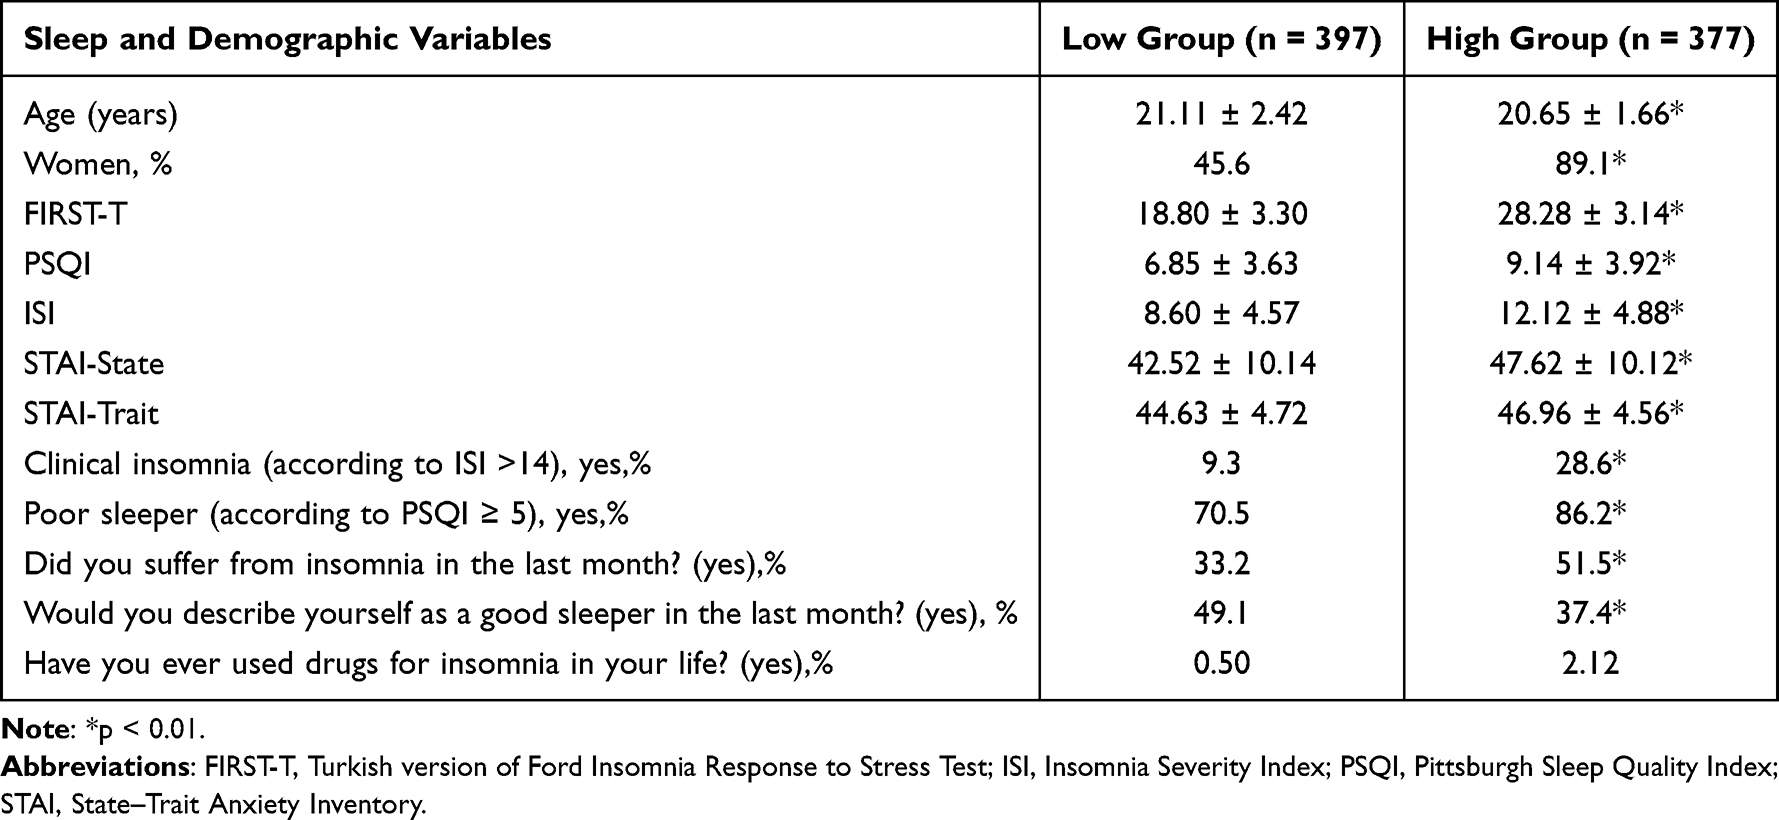 |
Table 4 Demographic and Sleep Data of All the Participants with High and Low Scores on the Ford Insomnia Response to Stress Test – Turkish Version |
Discussion
The adaptation and assertion of psychometric properties of the FIRST-T had not been examined until now. We thus produced the FIRST-T, and conducted an investigation of its validity and reliability. Unlike other studies, we examined scale items in more detail using the GRM and IRT.
We found a single-factor structure by EFA, similar to other language adaptation and validation studies of the FIRST. The factor loadings of all items were in the acceptable range. The scree plot of the FIRST-T with a reduced correlation matrix also indicated a single-factor structure. Therefore, there was no need to discard any item. However, the factor loadings of the 5th (0.40) and 9th (0.36) items were lower than the factor loadings of the other items. Low factor loadings of item 5 (after watching a frightening movie or television show) and particularly that of item 9 (before going on vacation the next day) were found in other studies.6,23,25 In a Spanish study conducted on pregnant women, a single-factor structure was found and the factor loadings of item 5 (0.35) and item 9 (0.37) were also found to be lower than those of other items.23 In the study of the German adaptation and validation of the FIRST, a single-factor structure was obtained25 and the factor loading of item 9 was found to be quite low (0.30).25 When a two- or three-factor structure was examined later, the internal consistency did not reach the desired level. Therefore a single-factor and 9-item structure was accepted in the German validation study.25 In the Japanese adaptation study, the factor loading of item 9 (0.22 for insomnia patients and 0.21 for healthy individuals) was well below the acceptable limit.6 However, since the correlation between the scales did not change when item 9 was removed, this item was retained to provide scoring consistency for comparison across studies.6 In addition, the low factor loading of item 9 in the Japanese adaptation study may have been due to cultural or racial distinctions between participants in Japan and those in the United States.6 In addition, this might be explained by the affective valence of this item which is positive (ie, vacations).46,47 Contrary to these studies, the factor loading of the item 9 was found to be 0.51 in the original study,12 while that of item 5 was 0.48, which was close to the value of 0.40 obtained in our study. The original study also accepted a 9-item single-factor structure.12
In the literature, it is recommended that CFA be applied to a different group than EFA.37,38 Thus, we randomly divided participants into two equal groups and performed EFA and CFA analyses in these separate groups. In parallel with the EFA analysis, the CFA analysis revealed a one-factor structure with good fit indices. Similarly, Spanish and German adaptation studies23,25 of the FIRST also found a one-factor structure with good CFA fit indices. However, in both studies, both EFA and CFA were analyzed on the same sample; hence, factor analysis may yield erroneous results.23,25
Furthermore, we found that the internal consistency for the FIRST-T was good (Cronbach’s α = 0.84 and McDonald’s ω = 0.85) and was similar to that of the original study (Cronbach’s α = 0.83),12 as well as the Japanese (Cronbach’s α = 0.89 for insomnia patients, Cronbach’s α = 0.87 for healthy individuals),6 Italian (Cronbach’s α = 0.86 for insomnia patients and Cronbach’s α = 0.79 for healthy individuals),22 Portuguese (Cronbach’s α = 0.81),26 German (Cronbach’s α= 0.80),25 and Spanish (Cronbach’s α = 0.81 for pregnancy)23 adaptation studies. In addition, we found the following as adequate internal consistency characteristics: average inter-item correlation (0.380), standard error of measurement (2.267), and good IRT reliability (0.879).
Unlike previous studies,6,22–26 we analyzed the performance of this scale using a GRM. Item 9 had a low slope, items 5 and 8 had moderate slopes, item 1 had a steep slope, and the rest of the items had a very slope. These results suggested that item 9 is less efficient in discriminating between individuals with low scores and those with high score on the FIRST-T than are other items. Groups with high and low sleep reactivity were formed based on median scores of 20 more in the original study,12 12 in the Spanish study,23 22 in the Portuguese study,26 and 18 in the Japanese study.6 In the German adaptation study,25 20 points and above was accepted as the cut-off value, based on the original study,12 and the median value was not used. In our study, we found it appropriate to utilize the median value as the cut-off value, since cultural, gender, and racial differences may have been present in our population more so than in the other studies.6,12,22–26 The Portuguese study26 was conducted on university students, as was our study. The fact that the median values were close to our study suggest that there may be higher cut-off scores for those at a younger age or in highly stressful environments such as higher education settings. We found significant differences between high and low FIRST-T score groups. Female participants were more common in the high FIRST-T score group, similar to previous studies, which was consistent with the information that insomnia is more common in women. Second, the mean age was significantly lower in the high FIRST-T score group than in the low FIRST-T score group. In the Japanese validation study,6 the mean age was lower in the high FIRST-T score group, similar to our study. Conversely, in the original study, the mean age was significantly higher in the high FIRST-T score group than in the low FIRST-T score group. Third, sleep quality, insomnia severity, and state–trait anxiety were higher in the high FIRST-T score group. In the Japanese validation study,6 trait anxiety was found to be higher in the high FIRST-T score group. In addition, state anxiety was higher in our study. Lastly, the participants suffering from insomnia in the past month or who self-identified as poor sleepers were more common in the high FIRST-T score group.
Limitations
The present study has several limitations. First, self-assesment instruments were used for insomnia. However, the ISI and PSQI used in our study gave similar results to clinical interviews for insomnia. Further studies should be conducted using objective measures of sleep (eg, polysomnography) for understanding the correlation between sleep reactivity and objective sleep disturbance. Second, the consistency over time of the FIRST-T was not investigated in the current study. Third, our study was an online cross-sectional design. Prospective studies are needed to better understand sleep reactivity.8 Fourth, participants were recruited from a university population (young people) and were not representative of the general population or individuals with a formal insomnia diagnosis. Fifth, the results have biase of female students with poor sleep. Finally, we did not question whether the participants had any substance use (eg, smoking, alcohol, and drugs) or other psychiatric diagnoses.
Future Recommendations
Further research with clinical samples and objective measures is warranted in Turkey. The factor structure should be reviewed and, if necessary, revisions of problematic items should be made. In addition, genetic and biochemical studies should be conducted with FIRST-T to study the genetic and biochemical connections of susceptibility to insomnia.
Conclusion
The FIRST-T has acceptable psychometric properties similar to the original version. Sleep reactivity, which was found to be significantly associated with insomnia severity, poor sleep quality, and anxiety, may help predict insomnia. The FIRST-T is the only questionnaire developed to assess sleep reactivity. However, recurring low factor loading problems in some of the items, particularly item 9, in many studies, suggests that there is scope of improvement in the assessment of sleep reactivity, including the use of more objective measures. Future studies will need to clarify whether the problems in the items are cultural or racial, or whether revisions are needed.
Human Subjects
Human subjects were included in this study. The Gaziantep University Clinical Research Ethics Committee approved our study (decision number: 2022/114). All research adhered to the tenets of the Declaration of Helsinki. Informed consent was obtained from all participants.
Data Sharing Statement
All data of the present study are available from the corresponding author upon request.
Funding
Our study did not receive any grant from anywhere.
Disclosure
All the authors declare no conflicts of interest in this study.
References
1. American Psychiatric Association. Diagnostic and Statistical Manual of Mental Disorders: DSM-5. American Psychiatric Association; 5:2013.
2. American Academy of Sleep Medicine. International Classification of Sleep Disorders.
3. Gomes AA, Tavares J, de Azevedo MH. Sleep and academic performance in undergraduates: a multi-measure, multi-predictor approach. Chronobiol Int. 2011;28(9):786–801. doi:10.3109/07420528.2011.606518
4. Kloss JD, Nash CO, Horsey SE, Taylor DJ. The delivery of behavioral sleep medicine to college students. J Adolesc Health. 2011;48(6):553–561. doi:10.1016/j.jadohealth.2010.09.023
5. Uygur OF, Uygur H, Chung S, et al. Validity and reliability of the Turkish version of the Glasgow Sleep Effort Scale. Sleep Med. 2022;98:144–151. doi:10.1016/j.sleep.2022.06.022
6. Nakajima S, Okajima I, Sasai T, et al. Validation of the Japanese version of the Ford Insomnia Response to Stress Test and the association of sleep reactivity with trait anxiety and insomnia. Sleep Med. 2014;15:196–202. doi:10.1016/j.sleep.2013.09.022
7. Kalmbach DA, Pillai V, Arnedt JT, Drake CL. Identifying at-risk individuals for insomnia using the ford insomnia response to stress test. Sleep. 2016;39(2):449–456. doi:10.5665/sleep.5462
8. Drake CL, Pillai V, Roth T. Stress and sleep reactivity: a prospective investigation of the stress-diathesis model of insomnia. Sleep. 2013;37:1295–1304. doi:10.5665/sleep.3916
9. Fernández-Mendoza J, Vela-Bueno A, Vgontzas AN, et al. Cognitive- emotional hyperarousal as a premorbid characteristic of individuals vulnerable to insomnia. Psychosom Med. 2010;72:397–403. doi:10.1097/PSY.0b013e3181d75319
10. Bastien CH, Morin CM. Familial incidence of insomnia. J Sleep Res. 2000;9:49–54. doi:10.1046/j.1365-2869.2000.00182.x
11. Dauvilliers Y, Morin C, Cervena K, et al. Family studies in insomnia. J Psychosom Res. 2005;58:271–278. doi:10.1016/j.jpsychores.2004.08.012
12. Drake CL, Richardson G, Roehrs T, Scofield H, Roth T. Vulnerability to stress-related sleep disturbance and hyperarousal. Sleep. 2004;27:285–291. doi:10.1093/sleep/27.2.285
13. Drake CL, Roth T. Predisposition in the evolution of insomnia: evidence, potential mechanisms, and future directions. Sleep Med Clin. 2006;1:333–349. doi:10.1016/j.jsmc.2006.06.005
14. Drake CL, Jefferson C, Roehrs T, Roth T. Stress-related sleep disturbance and polysomnographic response to caffeine. Sleep Med. 2006;7:567–572. doi:10.1016/j.sleep.2006.03.019
15. Drake CL, Friedman NP, Wright KP, Roth T. Sleep reactivity and insomnia: genetic and environmental influences. Sleep. 2011;34:1179–1188. doi:10.5665/SLEEP.1234
16. Bonnet MH, Arand DL. Situational insomnia: consistency, predictors, and outcomes. Sleep. 2003;26:1029–1037. doi:10.1093/sleep/26.8.1029
17. Kalmbach DA, Cuamatzi-Castelan AS, Tonnu CV, et al. Hyperarousal and sleep reactivity in insomnia: current insights. Nat Sci Sleep. 2018;10(17):193–201. doi:10.2147/NSS.S138823
18. Walker JL, Vargas I, Drake CL, Ellis JG, Muench A, Perlis ML. The natural history of insomnia: high sleep reactivity interacts with greater life stress to predict the onset of acute insomnia. Sleep. 2022;45(9):zsac149. doi:10.1093/sleep/zsac149
19. Drake CL, Scofield H, Roth T. Vulnerability to insomnia: the role of familial aggregation. Sleep Med. 2008;9:297–302. doi:10.1016/j.sleep.2007.04.012
20. Fernandez-Mendoza J, Shaffer ML, Olavarrieta-Bernardino S, et al. Cognitive-emotional hyperarousal in the offspring of parents vulnerable to insomnia: a nuclear family study. J Sleep Res. 2014;23(5):489–498. doi:10.1111/jsr.12168
21. Park K, Kim G, Lee J, Suh S. Differences in treatment effects of cognitive-behavioral therapy for insomnia based on sleep reactivity: a preliminary study. Behav Sleep Med. 2022;27:1–12. doi:10.1080/15402002.2022.2093880
22. Palagini L, Bruno RM, Paolo T, et al. Association between stress-related sleep reactivity and metacognitive beliefs about sleep in insomnia disorder: preliminary results. Behav Sleep Med. 2016;14:636–649. doi:10.1080/15402002.2015.1065406
23. Gelaye B, Zhong QY, Barrios YV, Redline S, Drake CL, Williams MA. Psychometric evaluation of the Ford Insomnia Response to Stress Test (FIRST) in early pregnancy. J Clin Sleep Med. 2016;12(4):579–587. doi:10.5664/jcsm.5696
24. Chen I, Jarrin D, Rochefort A, Lamy M, Ivers H, Morin C. Validation of the French version of the Ford insomnia response to stress test and the association between sleep reactivity and hyperarousal. Sleep Med. 2015;16:238. doi:10.1016/j.sleep.2015.02.1510
25. Dieck A, Helbig S, Drake CL, Backhaus J. Validation of the German version of the Ford Insomnia Response to Stress Test. J Sleep Res. 2018;27(3):e12621. doi:10.1111/jsr.12621
26. Marques DR, Allen Gomes AC, Drake CL, Roth T, de Azevedo MHP. Assessing stress-induced sleep reactivity in college students: the European Portuguese version of the Ford Insomnia Response to Stress Test (FIRST). Behav Sleep Med. 2018;16(4):337–346. doi:10.1080/15402002.2016.1210151
27. Petersen H, Kecklund G, D’Onofrio P, Nilsson J, Akerstedt T. Stress vulnerability and the effects of moderate daily stress on sleep polysomnography and subjective sleepiness. J Sleep Res. 2013;22:50–57. doi:10.1111/j.1365-2869.2012.01034.x
28. Rehman A, Drake CL, Shiramizu V, Fleming L. Sleep reactivity predicts insomnia in patients diagnosed with breast cancer. J Clin Sleep Med. 2022;18(11):2597–2604. doi:10.5664/jcsm.10170
29. Zamanzadeh V, Ghahramanian A, Rassouli M, Abbaszadeh A, Alavi-Majd H, Nikanfar AR. Design and Implementation Content Validity Study: development of an instrument for measuring Patient-Centered Communication. J Caring Sci. 2015;4(2):165–178. doi:10.15171/jcs.2015.017
30. Lynn MR. Determination and quantification of content validity. Nurs Res. 1986;35(6):381–385. doi:10.1097/00006199-198611000-00017
31. Buysse DJ, Reynolds CF, Monk TH, Berman SR, Kupfer DJ. The Pittsburgh Sleep Quality Index: a new instrument for psychiatric practice and research. Psychiatry Res. 1989;28:193–213. doi:10.1016/0165-1781(89)90047-4
32. Yildirim A, Boysan M. Heterogeneity of sleep quality based on the Pittsburgh Sleep Quality Index in a community sample: a latent class analysis. Sleep Biol Rhythms. 2017;15:197–205. doi:10.1007/s41105-017-0097-7
33. Ağargün MY, Kara H, Anlar Ö. The validity and reliability of the Pittsburgh Sleep Quality Index. Turk Psikiyatri Derg. 1996;7(2):107–115.
34. Bastien CH, Vallières A, Morin CM. Validation of the Insomnia Severity Index as an outcome measure for insomnia research. Sleep Med. 2001;2(4):297–307. doi:10.1016/s1389-9457(00)00065-4
35. Boysan M, Güleç M, Besiroglu L, Kalafat T. Psychometric properties of The Insomnia Severity Index in Turkish sample. Anatolia J Psychiatr. 2010;11:248–252.
36. Spielberger CD, Gorsuch RL, Lushene R, Vagg PR, Jacobs GA. Manual for the State-Trait Anxiety Inventory. Palo Alto, CA: Consulting Psychologists Press; 1983.
37. Comrey AL, Lee H. A First Cours in Factor Analysis.
38. Koyuncu I, Kilic AF. The use of exploratory and confirmatory factor analyses: a document analysis. Edu Sci. 2019;44:361–388. doi:10.15390/EB.2019.7665
39. Christ O, Schlüter E. Structural Equation Modeling Using MPlus: A Practical Introduction. Munich: Oldenbourg Verlag; 2012.
40. Brown TA. Confirmatory Factor Analysis for Applied Research. New York, NY: Guilford Press; 2006.
41. DeVellis RF. Scale Development: Theory and Applications.
42. Tabachnick BG, Fidell LS. Using Multivariate Statistics.
43. Field A. Discovering Statistics Using SPSS.
44. Pallant J. SPSS Survival Manual: A Step by Step Guide to Data Analysis Using SPSS for Windows.
45. Uygur ÖF, Orhan FÖ, Uygur H, Kandeger A, Hursitoglu O. Psychometric properties of the Turkish version of the Anxiety and Preoccupation about Sleep Questionnaire in clinical and non-clinical samples. Sleep Sci. 2022;15(1):68–74. doi:10.5935/1984-0063.20210033
46. Leu J, Wang J, Koo K. Are positive emotions just as “positive” across cultures? Emotion. 2011;11:994–999. doi:10.1037/a0021332
47. Mesquita B, Karasawa M. Different emotional lives. Cogn Emot. 2002;16:127–141. doi:10.1080/0269993014000176
 © 2023 The Author(s). This work is published and licensed by Dove Medical Press Limited. The
full terms of this license are available at https://www.dovepress.com/terms
and incorporate the Creative Commons Attribution
- Non Commercial (unported, 3.0) License.
By accessing the work you hereby accept the Terms. Non-commercial uses of the work are permitted
without any further permission from Dove Medical Press Limited, provided the work is properly
attributed. For permission for commercial use of this work, please see paragraphs 4.2 and 5 of our Terms.
© 2023 The Author(s). This work is published and licensed by Dove Medical Press Limited. The
full terms of this license are available at https://www.dovepress.com/terms
and incorporate the Creative Commons Attribution
- Non Commercial (unported, 3.0) License.
By accessing the work you hereby accept the Terms. Non-commercial uses of the work are permitted
without any further permission from Dove Medical Press Limited, provided the work is properly
attributed. For permission for commercial use of this work, please see paragraphs 4.2 and 5 of our Terms.