Back to Journals » Journal of Inflammation Research » Volume 19
A Single-Cell Transcriptomic Atlas Elucidates a Microglial Gene Signature Linking Ferroptosis to Mitochondrial Dysfunction in Epilepsy
Authors Zhong R, Yang H, Li X, Wang F, Tong T, Sun L, Lei J ![]() , Gao J
, Gao J
Received 1 November 2025
Accepted for publication 14 January 2026
Published 30 January 2026 Volume 2026:19 576674
DOI https://doi.org/10.2147/JIR.S576674
Checked for plagiarism Yes
Review by Single anonymous peer review
Peer reviewer comments 3
Editor who approved publication: Prof. Dr. Dharmappa Krishnappa
Rujie Zhong,1 Hailin Yang,1 Xiaoyu Li,1 Feiyu Wang,2 Tong Tong,1 Lijie Sun,1 Jinsong Lei,3,4 Jing Gao1
1Department of Neurology, The Affiliated Hospital of Qingdao University, Qingdao, Shandong, People’s Republic of China; 2Department of Neurology, The First Affiliated Hospital, Jiangxi Medical College, Nanchang University, Nanchang, People’s Republic of China; 3Department of Thoracic Surgery, Sun Yat-Sen University Cancer Center, Guangzhou, People’s Republic of China; 4State Key Laboratory of Oncology in South China, Collaborative Innovation Center for Cancer Medicine, Sun Yat-sen University Cancer Center, Guangzhou, Guangdong, People’s Republic of China
Correspondence: Jing Gao, Department of Neurology, The Affiliated Hospital of Qingdao University, Qingdao, Shandong, People’s Republic of China, Email [email protected] Jinsong Lei, State Key Laboratory of Oncology in South China, Collaborative Innovation Center for Cancer Medicine, Sun Yat-sen University Cancer Center, Guangzhou, Guangdong, People’s Republic of China, Email [email protected]
Background: Epilepsy is a chronic neurological disorder caused by abnormal synchronous discharges of neurons, with ferroptosis and mitochondrial dysfunction implicated in its progression. However, a lack of resolution at the level of specific cell types has obscured critical roles and molecular mechanisms within the epileptic microenvironment.
Methods: This study integrated single-nucleus RNA sequencing (snRNA-seq) and bulk RNA-seq data from epilepsy and control samples. We performed dimensionality reduction and clustering to identify 13 cell subpopulations, and then assessed the expression of ferroptosis-related genes (FRGs) and mitochondrial-related genes (MRGs) within 7 major cell types. Three machine learning algorithms were further applied to identify key genes in microglia. Subsequent analyses included immune infiltration, pathway enrichment, and drug–target interaction. Molecular docking and molecular dynamics simulations were used to evaluate the potential binding affinity of the predicted drug. In vivo validation included histopathology, mitochondrial electron microscopy, JC-1 staining, and immunohistochemistry (IHC).
Results: We identified six key genes (ATM, TGFBR1, ZEB1, PARP14, GJA1, and ALOX5), which link ferroptosis and mitochondrial dysfunction with a central role for microglia in epilepsy. These genes were associated with immune infiltration, including increased Th1 cell levels and reduced CD8+ T cell abundance. Enrichment analyses implicated these hub genes in orchestrating key epileptogenic processes, including neuroinflammatory pathways, ferroptosis, and interferon response. PARP14 was upregulated in epileptic rats, and GJA1 exhibited stable binding with bleomycin. Histopathological and mitochondrial assays confirmed the presence of ferroptosis and mitochondrial damage in epilepsy.
Conclusion: This study highlights the interplay between ferroptosis and mitochondrial dysfunction in epilepsy, identifying six key microglial genes as high-priority candidates for future mechanistic and therapeutic investigation. Notably, PARP14 is implicated in epileptogenesis for the first time. The stable binding between GJA1 and bleomycin offers a novel avenue for epilepsy treatment, warranting further experimental validation.
Keywords: epilepsy, ferroptosis, mitochondrial dysfunction, microglia, single-cell transcriptome sequencing, PARP14
Introduction
Epilepsy, a chronic brain disease affecting over 70 million people worldwide, is characterized by spontaneous and recurrent seizures. The pathogenesis of epilepsy results from the synergistic interaction of multiple mechanisms, including disrupted excitatory-inhibitory balance, neuroinflammation, ion channel abnormalities, and mitochondrial dysfunction.1,2 Despite significant advances in treatment, approximately 30% of patients develop drug-resistant epilepsy, for whom surgical interventions have limited clinical applicability.3 Consequently, identifying novel therapeutic targets through comprehensive biological analyses of epileptogenesis has become an urgent research priority.
Ferroptosis, a regulated form of cell death characterized by excessive intracellular iron accumulation, has been increasingly recognized as a critical contributor to the progression of various neurological disorders.4,5 Notably, mitochondria undergo distinct morphological and functional transformations in ferroptosis. Morphologically, these changes involve decreased bilayer membrane density, reduced volume, and diminished or absent mitochondrial cristae. Functionally, these modifications result in depolarized mitochondrial membrane potential (ΔΨm) and disrupted energy metabolism.6,7 Concurrently, mitochondrial dysfunction exacerbates oxidative stress, disrupts oxidative phosphorylation (OXPHOS), lowers neuronal excitability thresholds, and amplifies neuroinflammation, further promoting seizure generation.8,9 However, the specific molecular mechanisms linking ferroptosis and mitochondrial dysfunction in epilepsy, particularly across different cell types, remain poorly understood.
Traditional studies on epilepsy are mostly based on the brain tissue level, and it is difficult to reveal the heterogeneity of individual cell types and their specific roles in epileptogenesis. Conventional anti-seizure medications predominantly target broad-spectrum ion channels or neurotransmitter systems rather than specific pathogenic genes. Gene therapy represents a transformative therapeutic paradigm for epilepsy due to its capacity for precise targeting of pathogenic mechanisms. Existing limited studies have demonstrated significant alterations in ion channel function and synaptic transmission (involving KCNQ2/3, SCN1A, and STXBP1) in epilepsy pathogenesis.10,11 Thus, there is an urgent need to elucidate more molecular bases of epilepsy at single-cell resolution, pinpointing key cellular subtypes and signaling pathways to provide a theoretical foundation for developing new therapeutic approaches.
Single-cell transcriptomic studies explore cellular heterogeneity, revealing pathogenic subpopulations and targetable pathways in epilepsy. Machine learning, a transformative approach for analyzing biological data, has been applied to systematically identify critical genes, significantly improving the efficiency and reliability of diagnostic biomarker discovery.12–14 We combined snRNA-seq with bulk RNA-seq to explore distinct subpopulations within epileptic microenvironment. By integrating differential expression profiling, machine learning-based gene screening, intercellular communication networks, and pathway enrichment, we systematically delineated the functional roles of ferroptosis and mitochondrial dysfunction-associated molecules, particularly within microglia, during epileptogenesis. Drug-target predictions and molecular docking approaches suggested innovative treatment options. Using a pilocarpine rat model, we observed evidence of ferroptosis and mitochondrial dysfunction in epileptic rats, with immunohistochemical validation consistent with the bioinformatics findings. This research provides critical theoretical insights and potential therapeutic targets relevant to molecular subtyping and precision therapy in epilepsy.
Methods
Data Acquisition
We downloaded the epilepsy-related datasets GSE190452 and GSE256068 from the Gene Expression Omnibus (GEO) database (https://www.ncbi.nlm.nih.gov/geo/). The single-cell GSE190452 dataset includes 4 epilepsy samples and 4 control samples. Bulk transcriptome data were obtained from the GSE256068 dataset, comprising 135 epilepsy samples and 27 control samples. Gene sets analyzed in this study included 484 FRGs from the FerrDb database (http://www.zhounan.org/ferrdb/)15 and 1136 MRGs from the MitoCarta3.0 database (http://www.broadinstitute.org/mitocarta/).16
Animals
Twenty-seven six-week-old male Wistar rats (200 ± 20 g), provided by Shandong Jinan Pengyue Laboratory Animal Breeding Co., Ltd., were housed in a specific pathogen-free grade laboratory. The environmental conditions were carefully controlled, with temperature maintained at 22 ± 2 °C, humidity at 55 ± 5%, and a 12-h light/dark cycle enforced.
Single-Cell Data Quality Control and Processing
Single-cell data were first processed using the Seurat package.17 Cells with a high proportion of mitochondrial gene expression typically exhibit low RNA expression, a hallmark of cellular damage and an indicator of programmed cell death pathways.18 We employed the median absolute deviation (MAD) method to exclude cells with mitochondrial gene expression values exceeding 3 MADs above the median.19 Then, we used DoubletFinder (version 2.0.4)20 to detect and remove doublets within each sample separately.
The filtered data were globally standardized using LogNormalize, and cell cycle scores were calculated using CellCycleScoring. Hypervariable genes were detected by FindVariableFeatures. Concurrently, the ScaleData function was employed to regress out technical variations due to mitochondrial gene content, ribosomal gene content, and cell cycle phase differences. Principal component analysis (PCA) was applied to reduce the linear dimensionality of the expression matrix. Harmony was used to remove batch effects, followed by nonlinear dimensionality reduction via uniform manifold approximation and projection (UMAP). Cell annotation was conducted by integrating marker genes from the CellMarker database (http://117.50.127.228/CellMarker/),21 the PanglaoDB database (https://panglaodb.se/),22 literature reviews, and automated annotation with SingleR software.23
Machine Learning
Least Absolute Shrinkage and Selection Operator (LASSO) logistic regression was implemented using the glmnet package.24 In this study, Random Forest (RF) averaged its outcomes to rank feature importance via %IncMSE, defined as the percentage increase in prediction error after feature permutation. The top 10 diagnostic gene candidates were retained for downstream analysis. By recursively removing the features contributing the least to classification performance, the Support Vector Machine–recursive feature elimination (SVM-RFE) algorithm selected the variables most critical for distinguishing samples.
Immune Infiltration
Single-sample gene set enrichment analysis (ssGSEA) was applied to the gene expression profiles to estimate the relative abundance of 29 distinct immune cell types.25 What’s more, the correlations between the expression levels of target genes and the estimated proportions of various immune cells were systematically evaluated.
Pathway Dynamics and Transcriptional Regulatory Network Analyses
GSEA was conducted to identify differentially activated pathways between patient cohorts stratified according to key gene expression thresholds.26 The background gene set was downloaded from the Molecular Signatures Database (MSigDB) (https://www.gsea-msigdb.org/gsea/msigdb/) (version 7.0). This dataset served as the annotated background for conducting pathway subtype analyses. Differences in pathway expression between groups were assessed, and enriched gene sets (adjusted p < 0.05) were ranked by consistency score. By comprehensively scoring the gene sets of interest, gene set variation analysis (GSVA) transforms gene-level alterations into pathway-level changes, thereby enabling the inference of biological functions underlying the samples.25 The R package RcisTarget was employed to predict transcription factors.27 The normalized enrichment score (NES) for each motif is influenced by the total number of motifs present in the database. Besides the motifs originally annotated in the source dataset, we created supplementary annotation files based on motif similarity and gene sequence information.
Drug Target Prediction and Protein-Ligand Interaction Analyses
Drug prediction provides crucial support for target gene research and serves as an important link between basic research and clinical applications. We employed the Drug-Gene Interaction Database (DGIdb) to identify drugs or compounds that exhibit molecular interactions with key target genes. To further elucidate the interactions between candidate drugs and their target genes, molecular docking analyses were conducted to characterize interaction mechanisms. The structure of the protein encoded by each target gene was retrieved from the AlphaFold database (https://alphafold.com/), and the corresponding drug structures were obtained from the PubChem database (https://pubchem.ncbi.nlm.nih.gov/). Molecular docking was performed using AutoDock software with nine independent runs. The docking result with the lowest binding energy, excluding the first reference conformation, was selected for presentation. Based on the molecular docking results, molecular dynamics (MD) simulations were performed using GROMACS 2023 software.28
Lithium Chloride-Pilocarpine Model
After a one-week acclimatization period, adult rats were randomly assigned to two groups: (1) Control group, in which rats received an intraperitoneal (i.p.) injection of saline (10 mL/kg); (2) Epilepsy group, in which rats were pre-injected with lithium chloride (127 mg/kg, i.p., MilliporeSigma, Shanghai, China) 16–20 h prior. They were then administered scopolamine (1 mg/kg, i.p., MCE, Shanghai, China), followed 30 min later by pilocarpine hydrochloride (30 mg/kg, i.p., Targetmol, Shanghai, China). Seizure behaviors over the subsequent 120 min were recorded and graded according to the Racine scale as previously described:29 I, chewing and facial movements; II, neck muscle spasms and head nodding; III, bilateral forelimb clonus (with or without upright posture); IV, tail hyperextension and rearing with loss of balance; V, generalized tonic-clonic seizures with limb rigidity. Rats exhibiting stage IV or V seizures were considered to have successfully developed status epilepticus. Three rats in the epilepsy group died and were excluded from the analysis. The rats (n = 12 per group) were deeply anesthetized via inhalation of 3% isoflurane in an induction chamber. Euthanasia was then performed by transcardial perfusion, with the depth of anesthesia confirmed by the absence of a pedal withdrawal reflex.
Histopathological Examination
Fourteen days after seizures, rat brains were extracted, immersed in 4% paraformaldehyde overnight, and embedded in paraffin. Coronal sections (4 μm) were prepared using a rotary microtome and mounted on slides. As previously described,30 hematoxylin and eosin (H&E) staining was performed to assess hippocampal architecture. In addition, Prussian blue staining was employed to evaluate iron deposits in the hippocampus and cortex. Following the instructions of the respective kits, stained sections were visualized using a light microscope (Leica, Wetzlar, Germany).
Transmission Electron Microscopy (TEM)
Fourteen days after seizures, fresh hippocampal tissue (approximately 1 mm 3 in volume) was fixed in 2.5% glutaraldehyde for 24 h. After dehydration using graded acetone, the hippocampal samples were embedded in epoxy resin and sectioned into 60–80 nm ultra-thin slices. Following staining with uranyl acetate for 10 min and lead citrate for an additional 10 min, mitochondrial ultrastructure features were examined using TEM (Hitachi, Tokyo, Japan).
JC-1 Fluorescence Staining
Mitochondria were isolated from fresh rat hippocampal tissues using a tissue mitochondria isolation kit (Beyotime, Shanghai, China). Mitochondrial extract was rapidly stored in storage buffer at 4 °C and quantified for protein content. Detection of JC-1 polymers and monomers was conducted using the enhanced ΔΨm assay kit (Beyotime, Shanghai, China) and visualized under an inverted fluorescence microscope (Leica, Wetzlar, Germany).
IHC
Brain tissues were sectioned into 4 μm slices as described previously. Following dewaxing and rehydration, the sections underwent water-bath heating for antigen retrieval. Next, they were incubated overnight at 4 °C with an anti-PARP14 antibody (1:100, Affinity Biosciences, Jiangsu, China) and then treated with an anti-rabbit secondary antibody (1:100, Affinity Biosciences, Jiangsu, China). After staining with diaminobenzidine solution (ZSGB-BIO, Beijing, China) and counterstaining with hematoxylin (Biosharp, Anhui, China), all mounted sections were photographed using a microscope (Leica, Wetzlar, Germany).
Statistical Analysis
The R software package (version 4.2.2) was used to conduct all statistical analyses. Comparisons between groups were performed using the Student’s unpaired t-test. Statistical significance was defined as a p-value < 0.05.
Results
The snRNA-Seq Profiling of Epilepsy
To ensure data quality, the Seurat package was used to filter out captured outliers and cells expressing fewer than 200 genes. Subsequently, the DoubletFinder package was utilized to identify and exclude doublets, leading to a total of 41,218 retained cells. The filtering results were visualized by violin and scatter plots (Figure S1a and b). Next, 2000 hypervariable genes were identified (Figure S1c), followed by data normalization, homogenization, PCA, and Harmony integration (Figure S1d–f).
Finally, 13 cellular subgroups were identified via UMAP analysis (Figure 1a). Among these, 7 cell types were classified: oligodendrocyte precursor cell (OPC), oligodendrocyte, inhibitory neurons, excitatory neurons, microglia, astrocyte, and endothelial cell (Figure 1b). Additionally, a bubble plot illustrating the classical markers of each cell type (Figure 1c) and bar plots showing the cell proportions for each group (Figure 1d) were generated.
 |
Figure 1 Single-cell annotation. (a) Uniform manifold approximation and projection (UMAP) visualization revealing 13 cellular subgroups. (b) Annotation of the 13 subgroups into 7 cell categories including oligodendrocyte precursor cell (OPC), oligodendrocyte, inhibitory neurons, excitatory neurons, microglia, astrocyte, and endothelial cell. (c) Bubble plot showing classical markers of the 7 cell types. (d) Bar charts depicting the proportional composition of each cell type in both groups. |
FRGs Analysis in Microglia
FRGs sets in single-cell data were evaluated using five distinct methods: AUCell, UCell, singscore, ssGSEA, and AddModuleScore.31 These scores were subsequently integrated into a comprehensive composite metric. The results demonstrated that ferroptosis scores were higher in microglia, with significant upregulation observed in the disease group (Figure 2a and b). To compare the disease group with controls, we applied the FindMarkers function to identify 606 differentially expressed genes (DEGs) in microglia, applying a stringent threshold of logFC > 0.25 and adjusted p-value < 0.05 (Figure 2c). By intersecting these DEGs with 484 FRGs, we obtained 20 overlapping genes involved in ferroptosis (Figure 2d). These genes included CYBB, FTL, FTH1, TMSB4X, TGFBR1, TLR4, BACH1, RBMS1, MEF2C, PARP14, SAT1, HSPA5, ALOX5, PARP8, ZEB1, PTPN18, GJA1, HMOX1, ATM, and JUN.
 |
Figure 2 Heterogeneity in ferroptosis-related genes (FRGs) expression. (a) Bubble plot showing FRGs expression scores across the 7 cell types. (b) Violin plot showing differences in FRGs scores (****P < 0.0001). (c) Volcano plot representing differentially expressed genes (DEGs) identified. (d) Venn diagram illustrating the overlap between DEGs and FRGs. |
Correlation and Machine Learning Analysis of Mitochondrial Genes in Bulk RNA-Seq Identifies Epilepsy Biomarkers
A total of 1136 MRGs were obtained, and mitochondrial pathway activity in the samples was subsequently quantified using ssGSEA. Correlation analysis was then performed to assess the association between ssGSEA scores and the expression of 20 overlapping FRGs, with a threshold of p < 0.05 (Figure 3a–L). Finally, 12 genes significantly related to mitochondrial function were identified, including ALOX5, ATM, BACH1, CYBB, GJA1, HMOX1, JUN, PARP8, PARP14, TGFBR1, TLR4, and ZEB1.
 |
Figure 3 Correlation analysis between intersecting genes and mitochondrial scores. (a–l) Scatter plots showing the correlations between mitochondrial pathway activity, quantified by single-sample gene set enrichment analysis (ssGSEA) scores, and the expression levels of ALOX5, ATM, BACH1, CYBB, GJA1, HMOX1, JUN, PARP8, PARP14, TGFBR1, TLR4, and ZEB1. |
We applied three machine learning methods to identify key epilepsy-associated genes from the initial 12 genes. LASSO regression identified 7 genes as potential signature biomarkers for epilepsy (Figure 4a and b). Complementarily, the RF algorithm selected the top 10 most relevant candidates (Figure 4c). For feature screening via SVM-RFE, the highest classification accuracy was achieved with 9 feature genes (Figure 4d). The intersection of the three algorithms revealed six consensus genes (ATM, TGFBR1, ZEB1, PARP14, GJA1, and ALOX5) as the most promising signatures for further investigation (Figure 4e).
 |
Figure 4 Construction of machine learning models. (a) The trajectories of Least Absolute Shrinkage and Selection Operator (LASSO) regression coefficients and the optimal gene combination at the minimum lambda value. (b) Minimum lambda determined via ten-fold cross-validation in LASSO regression. (c) Top 10 signature genes identified by the Random Forest (RF) algorithm. (d) Top 9 signature genes selected by the Support Vector Machine-recursive feature elimination (SVM-RFE) algorithm, achieving peak classification accuracy. (e) Venn diagram showing six consensus genes identified by all three algorithms. |
Immune Infiltration Analysis
We characterized the immune infiltration landscape by quantifying immune cell proportions and their intercorrelations (Figure 5a and b). Compared with controls, disease samples exhibited significantly elevated APC co-stimulation and Th1 cell levels but reduced CD8+ T cell abundance (Figure 5c). Furthermore, the relationships between hub genes and immune cell abundances were explored. Specifically, ATM, TGFBR1, PARP14, GJA1, and ALOX5 showed significant negative correlations with CD8+ T cells while positively correlating with multiple immune features, such as APC co-inhibition, CCR, checkpoint, and HLA. ZEB1, TGFBR1, and GJA1 displayed strong negative correlations with T cell co-stimulation (Figure 5d). In the immune microenvironment, systematic evaluation of hub genes and various immune factors, including chemokines, receptors, major histocompatibility complexes (MHC), immunoinhibitors, and immunostimulators, revealed that these key genes significantly modulate immune cell infiltration (Figure 6a–e).
 |
Figure 5 Immune infiltration landscape. (a) Compositional analysis of 23 types of immune-infiltrating cells. (b) Pearson’s correlation coefficients among 23 immune-infiltrating cells. (c) Comparative violin plots of differentially abundant immune cells. (d) Heatmap illustrating correlation coefficients between candidate genes and various immune cell populations. *P < 0.05, **P < 0.01, ***P < 0.001, ns = no significance. |
 |
Figure 6 Hub gene-immune factor correlations. (a–e) Significant associations between critical genes and chemokines (a), receptors (b), major histocompatibility complexes (MHC) (c), immunoinhibitors (d), and immunostimulators (e).*P < 0.05, **P < 0.01. |
Functional Enrichment and Transcriptional Regulation of Epilepsy Hub Genes
GSEA showed that ATM is enriched in cytokine-cytokine receptor interaction, antigen processing and presentation, and Toll-like receptor signaling pathway (Figure 7a). TGFBR1 is enriched in NF-κB signaling pathway, B cell receptor signaling pathway, and Th17 cell differentiation (Figure 7b). ZEB1 is enriched in Th1 and Th2 cell differentiation, JAK-STAT signaling pathway, and NOD-like receptor signaling pathway (Figure 7c). PARP14 is enriched in NF-κB signaling pathway, TNF signaling pathway, and IL-17 signaling pathway (Figure 7d). GJA1 is enriched in ferroptosis, JAK-STAT signaling pathway, and PPAR signaling pathway (Figure 7e). ALOX5 is enriched in ferroptosis, Toll-like receptor signaling pathway, and NOD-like receptor signaling pathway (Figure 7f).
 |
Figure 7 Gene set enrichment analysis (GSEA) of hub genes associated with epilepsy. (a–f) Significantly enriched Kyoto Encyclopedia of Genes and Genomes (KEGG) pathways identified for ATM (a), TGFBR1 (b), ZEB1 (c), PARP14 (d), GJA1 (e), and ALOX5 (f), respectively. |
GSVA revealed that ATM is enriched in mitotic spindle and interferon-alpha response (Figure 8a). TGFBR1 is enriched in allograft rejection and androgen response (Figure 8b). ZEB1 is enriched in IL2-STAT5 signaling and KRAS signaling up (Figure 8c). PARP14 and ALOX5 are both enriched in interferon-gamma response and interferon-alpha response (Figure 8d and f). GJA1 is enriched in Notch signaling and TGFB signaling (Figure 8e).
 |
Figure 8 Gene set variation analysis (GSVA) of hub gene pathway activity. (a–f) Pathways enriched in high-expression and low-expression clusters for ATM (a), TGFBR1 (b), ZEB1 (c), PARP14 (d), GJA1 (e), and ALOX5 (f), using the Hallmark gene set as the background. |
Using the six key genes (ATM, TGFBR1, ZEB1, PARP14, GJA1, and ALOX5) as input, we performed motif enrichment analysis. The cisbp__M1271 motif emerged as the top-scoring regulatory element (NES: 5.72). Figure 9a and b displays all significantly enriched motifs alongside their associated transcription factors, revealing the transcriptional regulatory network during epileptogenesis.
 |
Figure 9 Transcriptional regulatory network of epilepsy-associated genes. (a) Network illustrating the connections between six key genes (ATM, TGFBR1, ZEB1, PARP14, GJA1, and ALOX5) and their corresponding transcription factors. (b) Enriched binding motifs and their cognate transcription factors, with cisbp__M1271 (NES: 5.72) identified as the most significant regulatory element. |
Single-Cell Expression Profiling of Key Genes and Immunometabolic Pathways
Using the Seurat R package, we analyzed single-cell expression patterns of key epilepsy-associated genes via the DotPlot and FeaturePlot functions, and found that PARP14, ATM, TGFBR1, and ALOX5 were highly expressed in microglia (Figure 10a and b). We employed AUCell to quantify the activity of genes related to immunometabolic pathways and used bubble plot for visualization to confirm expression differences of genes involved in these pathways. AUCell quantification demonstrated significant enrichment of these genes in immunometabolic pathways, particularly Notch signaling, mitotic spindle, and PI3K-Akt-mTOR signaling (Figure 10c).
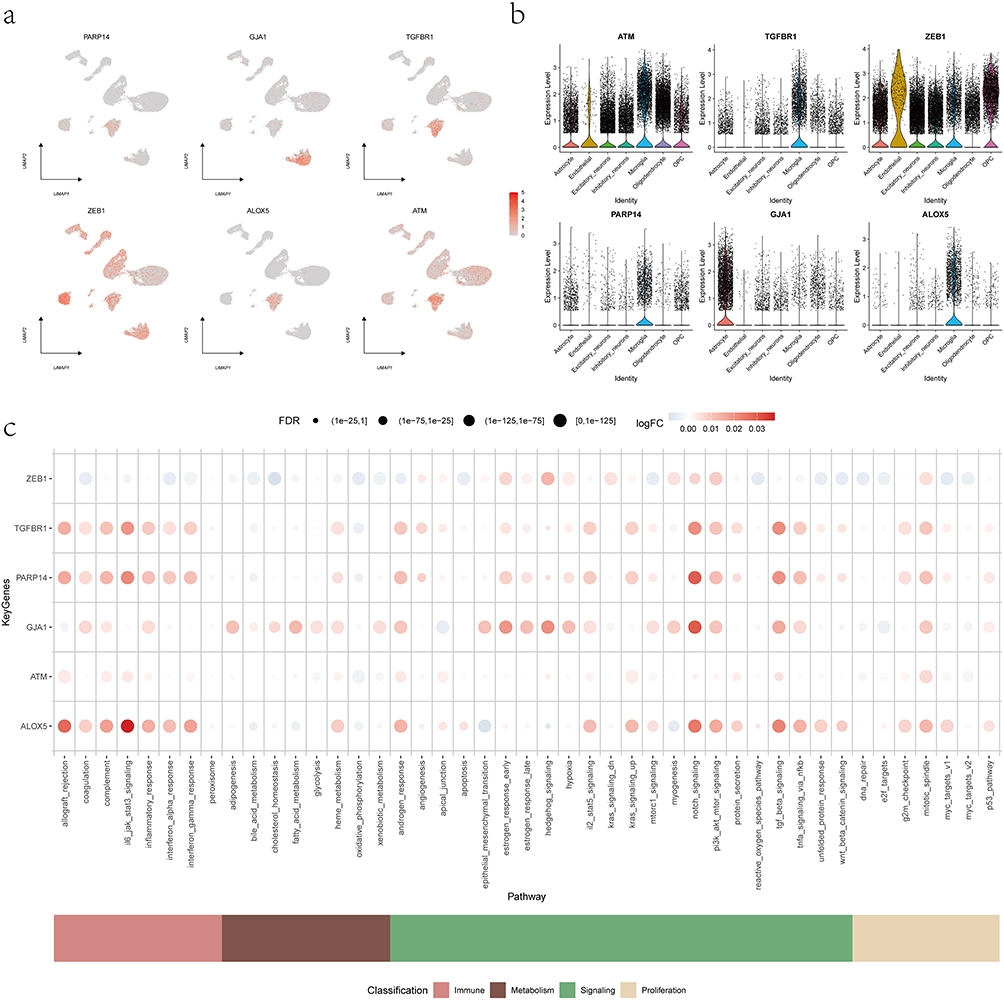 |
Figure 10 Single-cell expression and immunometabolic pathway activity of key genes. (a) Featureplot showing the normalized expression levels of key genes across 13 distinct cell clusters. (b) Dotplot depicting cell-type-specific expression distributions, with the highest expression in microglial populations. (c) Bubble plot illustrating differential activity of immunometabolic pathways associated with key genes. |
Drug Target Prediction Analysis
We utilized DGIdb to predict potential antiepileptic drugs targeting the key genes (ATM, TGFBR1, ZEB1, PARP14, GJA1, and ALOX5). This analysis may accelerate the development of antiepileptic drugs and lay a foundation for future translational validation. As shown in Table S1, 78 drugs were predicted for ATM, including TUVUSERTIB and ATR INHIBITOR ART0380. Seven drugs were predicted for TGFBR1, including VACTOSERTIB and METELIMUMAB. Three drugs were predicted for ZEB1, including SALINOMYCIN and OXALIPLATIN. Eleven drugs were predicted for GJA1, such as BLEOMYCIN and SELENIUM. Thirty-four drugs were predicted for ALOX5, including ZILEUTON and ATRELEUTON.
Molecular Docking and MD Simulation Reveal Stable Binding of GJA1 with Bleomycin
Based on interaction scores and drug approval status, GJA1 and bleomycin were selected as the exploratory drug target and ligand in this study. The docking binding energy is presented in Table 1. Structural docking results are visualized in Figure 11a. These results show that GJA1 exhibits strong binding affinity to bleomycin, as reflected by the binding energy (−6.0 kcal/mol).
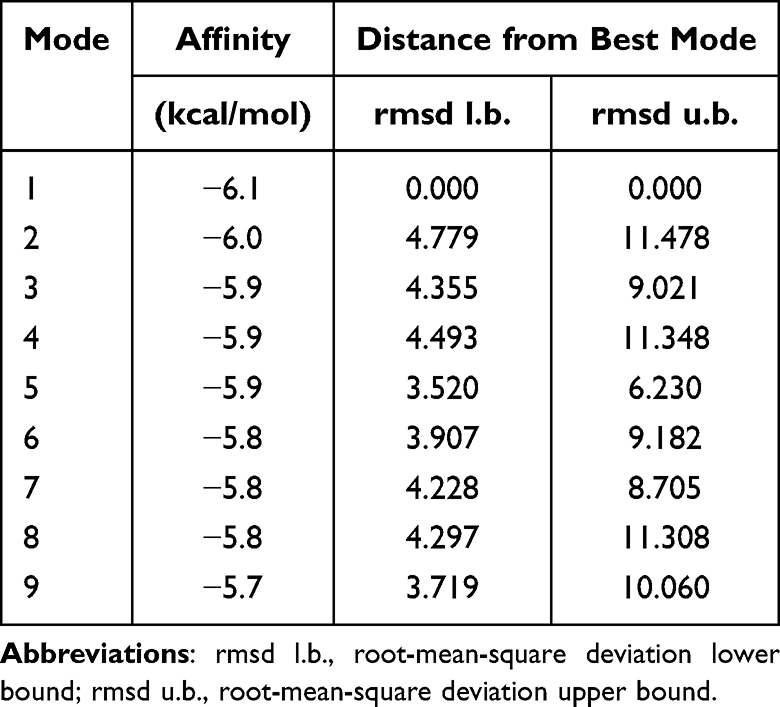 |
Table 1 Binding Energy of Bleomycin to GJA1 |
 |
Figure 11 Molecular docking and molecular dynamics (MD) simulation results of GJA1 with bleomycin. (a) Docking structure of the GJA1-bleomycin complex visualized using PyMOL software. (b) Root-mean-square deviation (RMSD) plot elucidating fluctuations of the complex. (c) Radius of gyration (Rg) plot evaluating the structural compactness of the complex. (d) Root-mean-square fluctuation (RMSF) plot depicting residue-specific flexibility and structural stability of the complex. (e) Hydrogen-bond plot identifying stabilizing intermolecular interactions within the complex. (f) Solvent-accessible surface area (SASA) plot reflecting intermolecular interactions and solvation effects of the complex. |
The GJA1-bleomycin complex revealed significant fluctuations in the ligand binding site between 40,000 and 60,000 ps (Figure 11b and f), indicative of binding site rearrangement. Following this transition period (>60,000 ps), the complex achieved structural stability, as evidenced by three convergent metrics: (1) convergence of root-mean-square deviation (RMSD) values (Figure 11b); (2) stabilization of the radius of gyration (Rg) (Figure 11c); and (3) plateauing of the buried solvent-accessible surface area (SASA) (Figure 11f). These collectively demonstrate the establishment of a new stable binding pose. Residue-specific flexibility analysis via root-mean-square fluctuation (RMSF) measurements showed limited fluctuations (Figure 11d), with most residues exhibiting RMSF values below 2 Å. Stabilized hydrogen-bond occupancy indicates the persistence of intermolecular hydrogen bonds between the protein and ligand (Figure 11e). Collectively, these structural and dynamic analyses confirm that the GJA1-bleomycin complex forms a stable binding interface.
Morphological and Functional Characterization in Pilocarpine-Induced Epileptic Rats
H&E staining was performed for histological analysis to assess pilocarpine-induced hippocampal neuronal damage. Compared to the respective control group, the hippocampal dentate gyrus (DG), cornu ammonis 1 (CA1), and cornu ammonis 3 (CA3) regions of epileptic rats exhibited significant neuronal loss, condensed nuclei, swollen cytoplasm, widened intercellular gaps, and irregular cellular morphology (as indicated by arrows, Figure 12a). To elucidate the involvement of ferroptosis in epileptogenesis, Prussian blue staining was employed to detect free iron accumulation in the tissue. In the epilepsy group, distinct Prussian blue-positive hemosiderin deposits were observed, indicating pathological iron deposition (Figure 12b).
 |
Figure 12 Histopathological examination and mitochondrial assessment. (a) Representative hematoxylin and eosin (H&E) staining images. Green arrows indicate neurons with normal morphology. Red arrows point to representative pathological features, including neuronal loss and nuclear condensation. (b) Prussian blue staining of the hippocampus and cerebral cortex. Red arrows show iron particle deposition in epilepsy rats. (c) Representative transmission electron microscopy (TEM) images (Arrowheads indicate mitochondria). (d) Representative images using the JC-1 fluorescent probe. (e and f) Quantitative analyses of fluorescence intensities, showing JC-1 aggregates (e) and JC-1 monomers (f) Data are presented as mean ± SD. n = 6. ****P < 0.0001. |
Epileptic seizures cause significant structural and functional mitochondrial impairments in the hippocampus. Representative images of TEM revealed intact nuclear membranes and clearly defined mitochondrial cristae in controls. As shown in Figure 12c, epileptic rats exhibited pathological features, including increased mitochondrial membrane density, cristae fragmentation, irregular swelling, and vacuolar degeneration (indicated by arrows). Notably, autophagosomes—double-membrane structures encapsulating damaged mitochondria—were markedly more abundant in the epileptic hippocampus. To further evaluate mitochondrial dysfunction associated with ferroptosis, JC-1 staining was conducted to evaluate changes in ΔΨm. The epilepsy group showed increased levels of JC-1 monomers (green) and decreased levels of JC-1 aggregates (red) compared with the control group, indicating a collapse of ΔΨm during pilocarpine-induced ferroptosis (Figure 12d–f). This finding aligns with ultrastructural mitochondrial defects observed by TEM, collectively suggesting ferroptosis-driven bioenergetic failure.
To further elucidate the expression of candidate genes, IHC staining was performed to analyze different hippocampal regions in both groups. PARP14 expression was significantly higher in pilocarpine-induced epileptic rats compared to controls, validating our previous findings (Figure 13a–d).
 |
Figure 13 IHC analysis of PARP14 expression. (a) Representative IHC staining images of PARP14. Quantitative analyses of PARP14 protein expression in the hippocampal (b) dentate gyrus (DG), (c) cornu ammonis 1 (CA1), and (d) cornu ammonis 3 (CA3) subregions. Data are presented as mean ± SD. n = 6. *P < 0.05, ***P < 0.001, ****P < 0.0001. |
Discussion
Our study focuses on the roles of ferroptosis and mitochondrial dysfunction in epileptogenesis. We employed single-cell transcriptome sequencing combined with machine learning to identify pivotal candidate genes. These findings establish a molecular framework that could inform the future development of diagnostic tools and provide new directions for the discovery of antiepileptic drugs.
Through integrative analysis of multiple single-cell datasets, we identified seven distinct cellular subpopulations to investigate alterations in cell-type proportions following epilepsy. Leveraging FerrDb, we employed five computational methods to assess ferroptosis activity at single-cell resolution. Intriguingly, microglia exhibited markedly elevated ferroptosis scores, with a significant increase in epilepsy samples. As the primary immune cells in the brain, microglia accumulate iron deposits that interact synergistically with inflammatory responses, thereby exacerbating damage to the central nervous system.32 Microglia, among the most iron-retentive cells in the brain, exacerbate ferroptosis-driven neurodegeneration via the vesicle trafficking gene SEC24B.33 As versatile sentinels of the central nervous system, microglia represent promising therapeutic targets; our investigation into their regulatory mechanisms in epilepsy thus provides novel insights for developing targeted anti-seizure interventions.
Building upon the identified microglial gene signatures at the intersection of epilepsy and ferroptosis, we integrated mitochondrial functional correlation analysis with three machine learning algorithms, ultimately identifying six hub genes (ATM, TGFBR1, ZEB1, PARP14, GJA1, and ALOX5). This study uncovers novel genes that link ferroptosis and mitochondrial dysfunction in epilepsy, which have not been previously described. ATM (ataxia telangiectasia mutated) acts as the primary sensor of DNA double-strand break damage. Activation of ATM, mediated by DNA damage, promotes acetylation of p53 and NF-κB, which exacerbates neuroinflammation and accelerates cellular senescence, thereby indirectly contributing to epileptogenesis.34,35 ATM deficiency increases hippocampal neuronal excitability through dysregulated expression of the potassium-chloride cotransporter KCC2 and impaired gamma-aminobutyric acidergic (GABAergic) synaptic inhibition.36 ATM promotes ferroptosis by phosphorylating the nuclear receptor coactivator 4, which increases intracellular labile iron levels.37 Moreover, its deficiency disrupts mitochondrial function, manifesting as impaired mitophagy, aberrant mitochondrial accumulation, dysregulated energy metabolism, and elevated reactive oxygen species (ROS) levels.38 TGFBR1 (transforming growth factor-beta receptor 1) orchestrates diverse pathophysiological processes, such as cell proliferation, differentiation, and apoptosis, by mediating signaling cascades of the TGFB superfamily.39 In temporal lobe epilepsy (TLE) patients, upregulated TGFB1 expression in brain tissue activates the TGFBR1-Smad2/3 signaling pathway, thereby driving astrocyte proliferation and glial scar formation.40 Additionally, microglia modulate myelin growth and integrity via the TGFB1-TGFBR1 axis in neurodegenerative diseases.41 ZEB1 (zinc finger E-box binding homeobox 1), a master regulator of epithelial-mesenchymal transition, modulates ferroptosis and mitochondrial function through heat shock protein family A (Hsp70) member 5 (HSPA5)-mediated pathways.42 Previous studies have identified ZEB1 as a pathogenic gene in Fuchs’ corneal dystrophy (FCD), a condition linked to epileptogenic lesions.43 GJA1 (gap junction protein alpha 1) forms functional gap junctions between astrocytes, propagating pro-inflammatory signals that exacerbate epileptogenesis.44 It regulates mitochondrial homeostasis in cardiomyocytes by coordinating ion transport, energy metabolism, and stress defense mechanisms. In vitro silencing of GJA1 markedly impairs mitochondrial energetics, as evidenced by depolarized ΔΨm and diminished adenosine triphosphate (ATP) synthesis.45,46 ALOX5 (arachidonate 5-lipoxygenase), a key enzyme in arachidonic acid metabolism, drives ferroptosis by mediating lipid peroxidation. Mitochondrial DNA stress and dysfunction exacerbate ALOX5-dependent ferroptosis via activation of the cyclic GMP-AMP synthase (cGAS)/stimulator of interferon genes (STING) pathway.47 Additionally, ALOX5 promotes glutamate hyperexcretion by activating the Ca2+/calmodulin-dependent protein kinase II (CAMKII)-mediated phosphorylation of synapsin I, thereby exacerbating seizure initiation.48
This study provides the first evidence implicating PARP14 in epileptogenesis, offering a novel mechanistic perspective on epilepsy. As a member of the poly ADP-ribose polymerase (PARP) family, PARP14 modulates cellular stress responses and immune signaling pathways. Notably, activation of the PARP family is known to influence lipid metabolism.49 NAD+ serves as an essential coenzyme for mitochondrial function and participates in the tricarboxylic acid (TCA) cycle. PARP1 and PARP2 impair mitochondrial homeostasis through NAD+ depletion.50 PARP14, as a member of the PARP family, may similarly disrupt mitochondrial integrity via ADP-ribosylation activity-mediated NAD+ consumption. Emerging evidence demonstrates that PARP1 stabilizes ALOX5 via post-translational protein modification in neutrophils, thereby accelerating lung cancer progression.51 By analogy, PARP14 may drive epilepsy-associated neuroinflammation by promoting ALOX5-mediated lipid peroxidation. Previous studies have identified PARP14 as a shared ferroptosis marker gene in diabetic retinopathy and atherosclerosis, with its expression correlating with immune infiltration in patients with these conditions.52 Our study provides the first evidence that PARP14 contributes to epileptogenesis via ferroptosis and mitochondrial dysfunction, uncovering a previously unrecognized mechanistic link. We investigated the regulatory role of PARP14 in pilocarpine-induced rat models of epilepsy. IHC analysis revealed significant upregulation of PARP14 expression during epileptogenesis, consistent with our findings. A limitation of our study is its reliance on rat models, which may not fully recapitulate human epileptogenesis. In subsequent studies, we will selectively knockout PARP14 in microglia and employ adeno-associated virus (AAV)-mediated PARP14 overexpression in the hippocampus to further investigate its roles in epilepsy, with particular emphasis on its regulation of ferroptosis and mitochondrial dysfunction.
Studies have revealed that epileptic foci harbor a hyperinflammatory immune microenvironment, characterized by aberrant microglial activation, peripheral immune cell infiltration, and enhanced microglia–T cell crosstalk that exacerbates neuroinflammation.53–55 A previous study demonstrated elevated Th1 cell levels in both TLE patients and animal models, where these cells modulate microglial activation—a finding consistent with our current immune infiltration analysis.56 Biallelic loss-of-function mutations in TGFB1 cause central nervous system disorders characterized by epilepsy, cerebral atrophy, and posterior leukoencephalopathy.39,57 Consistent with these prior findings, our study identified positive correlations between the expression of genes (ATM, TGFBR1, ZEB1, PARP14, GJA1, and ALOX5) and TGFB1 expression, reinforcing their potential synergistic roles in epileptogenic pathways. Their correlations with specific immune modulators also allow us to hypothesize how this gene signature might reshape concrete microglial effector functions, moving beyond general immune infiltration. First, the positive correlation with CSF1R (colony stimulating factor 1 receptor) suggests a potential modulation of the core signaling pathway that governs microglial general phagocytic capacity for cellular debris.58 Second, the significant associations with the neuronal fractalkine (CX3CL1)-microglial fractalkine receptor (CX3CR1) signaling—displaying a decoupled pattern (negative correlation with the ligand CX3CL1 and positive correlation with the receptor CX3CR1)—point toward a specific dysregulation of the neuron-to-microglia communication vital for synapse-specific pruning.59 Third, the strong correlations with a suite of MHC molecules, particularly MHC class II components, indicate an enhanced antigen-presenting and immunologically active phagocytic phenotype. 60 Collectively, these associations suggest a microglial reprogramming that is poised to exacerbate neuroinflammation and synaptic instability, thereby reinforcing their synergistic roles in epileptogenesis.
Through systematic analysis of signaling pathways, we elucidated the biological mechanisms underlying epilepsy progression. GSEA revealed that ATM is enriched in cytokine–cytokine receptor interactions. Evidence has shown that seizures induce BBB disruption, which activates microglia and elevates pro-inflammatory cytokines, ultimately triggering inflammasome activation via Toll-like receptor signaling.55,61 ALOX5 is enriched in pathways including Toll-like receptor signaling and ferroptosis. Toll-like receptor 4 (TLR4) is activated by the endogenous ligand high-mobility group box 1 (HMGB1), which promotes neuronal hyperexcitability through NF-κB pathway activation, thereby driving epileptogenesis.62,63 TGFBR1 and PARP14 are involved in the NF-κB signaling pathway, a key driver of epilepsy. Activated NF-κB drives astrocyte proliferation and polarizes microglia toward the pro-inflammatory M1 phenotype, releasing inflammatory mediators and enzymes that exacerbate neuroinflammation and oxidative stress.64 ZEB1 and GJA1 are enriched in the JAK-STAT signaling pathway, which regulates immune function and inflammatory responses. Clossen and his colleagues demonstrated that JAK-STAT inhibitors prolong seizure latency, reduce seizure frequency, and ameliorate synaptic plasticity impairments in epileptic models.65 In addition, GSVA revealed that elevated expression of ATM, PARP14, and ALOX5 is linked to interferon-alpha signaling. Studies indicate that interferon-alpha signaling may contribute to epileptogenesis through multiple mechanisms, including neuroinflammation, synaptic plasticity dysregulation, and BBB disruption.66,67 ZEB1 is highly expressed in the IL2-STAT5 signaling pathway. TGFBR1 and GJA1 both participate in the TGFB/Smad signaling pathway, coordinately regulating immunosuppressive processes. Integrative analysis of differential gene expression and functional enrichment reveals that these key genes contribute to epilepsy pathogenesis through interconnected pathways, including neuroinflammation, immune dysregulation, and ferroptosis.
Through DGIdb, we computationally predicted a panel of drugs potentially interacting with the key genes. A subsequent literature review identified several pharmacologic agents with potential therapeutic efficacy for epilepsy treatment. SULFASALAZINE inhibits the cystine/glutamate antiporter, thereby decreasing glutamate release and blocking glioma-associated seizures.68 MELATONIN, an indoleamine primarily secreted by the pineal gland, has been demonstrated to attenuate epileptiform activity through its well-established neuroprotective, antioxidant, and anti-cytotoxic properties.69 MONTELUKAST modulates cysteinyl leukotrienes—implicated in BBB disruption—effectively suppressing epileptogenesis and reducing seizure frequency in vivo.70 SALINOMYCIN induces genotoxic DNA damage and exhibits synergistic effects with radiotherapy, significantly delaying glioblastoma progression.71 Glioblastoma and epilepsy are interconnected through complex bidirectional pathophysiological relationships involving tumor microenvironment alterations, aberrant neuronal excitability, and crosstalk between molecular pathways.72 FLUNARIZINE DIHYDROCHLORIDE, a selective calcium channel blocker, has been used for the prophylactic management of epilepsy, with particular efficacy in patients with comorbid migraine.73 VALPROIC ACID, one of the most widely used antiseizure medications since its approval in 1978, exerts antiepileptic effects through multiple mechanisms, including GABAergic potentiation, ion channel modulation, and epigenetic regulation.74 EVEROLIMUS, an mTOR inhibitor derived from rapamycin, reduces neuronal hyperexcitability by prolonging the opening of Ca2⁺ and K⁺ channels, thereby decreasing seizure frequency.75 METHYLENE BLUE ANHYDROUS, a phenothiazine derivative, exhibits neuroprotective effects against acute seizures by scavenging ROS, modulating glutamatergic neurotransmission, and restoring mitochondrial bioenergetics.76
Molecular docking and MD simulation are employed to analyze protein-ligand structures, investigating complex stability, dynamics, geometry, and binding affinity. These approaches provide temporal trajectories of atomic motions, offering novel hypotheses for structural interactions and drug development. This study represents the first application of temporal trajectory analysis to characterize the interaction between GJA1 and bleomycin. Our findings demonstrate that GJA1 forms a stable binding conformation with bleomycin, as evidenced by an RMSD < 2 Å, stable hydrogen-bond occupancy, and consistent structural stability and compactness. These structural data support a potential mechanism whereby bleomycin binding could modulate intercellular communication between neurons and astrocytes. Bleomycin, a glycopeptide antibiotic, exhibits dose-dependent pharmacological effects in vivo and is clinically employed as a first-line therapeutic agent for Hodgkin’s lymphoma and testicular carcinomas.77 At low concentrations, bleomycin has been shown to activate the Kelch-like ECH-associated protein 1 (KEAP1)/nuclear factor erythroid 2-related factor 2 (Nrf2) signaling axis, resulting in the subsequent nuclear accumulation of Nrf2 and enhanced expression of Phase II detoxification enzymes such as glutamate-cysteine ligase and heme oxygenase-1.78 At elevated concentrations, bleomycin forms redox-active complexes with intracellular ferrous iron, thereby inducing ferroptosis in neoplastic cells. Bleomycin-mediated activation of GJA1 in pulmonary epithelial cells promotes fibrogenesis.77,79 Integrated GSEA and GSVA analyses reveal that GJA1 serves as a pivotal signaling hub within epileptic networks by orchestrating crosstalk among multiple pathways, including JAK-STAT, PPAR, ferroptosis, Notch, and TGFB signaling pathways. Intriguingly, bleomycin may modulate epileptogenesis through analogous mechanisms in neuronal systems. Future investigations should incorporate retrospective clinical analyses of seizure incidence in bleomycin-treated oncology patient cohorts to establish evidence-based dosing parameters that optimize therapeutic efficacy while minimizing neurotoxicity.
This study has certain limitations that warrant further improvement. The snRNA-seq samples included in this study are relatively limited, which may introduce bias and restrict the generalizability of our analysis. Additionally, while we focused on a microglia-enriched signature, the potential roles and interactions of the identified pathways in other critical cell types, including neurons and astrocytes, within the epileptic neurovascular unit were not fully explored. The functional implications of the key genes are inferred from bioinformatic correlations and pathway analysis. Although we observed consistent trends across public datasets, validation in diverse models (including clinical specimens) and across broader neuroanatomical regions will be essential to confirm the translational relevance of this gene signature. Furthermore, subsequent studies should conduct a series of functional verification experiments, including overexpression and knockout assays of the six key genes, to further confirm the reliability of our conclusions.
Conclusion
We identified a six-gene signature (ATM, TGFBR1, ZEB1, PARP14, GJA1, and ALOX5) centered in microglia that is associated with ferroptosis and mitochondrial dysfunction in epilepsy. Subsequent analyses explored their correlations with immune infiltration, signaling pathways, and transcriptional regulatory networks. In vitro experimental validation further demonstrated that PARP14 is upregulated during seizures, a previously unrecognized molecular insight for epilepsy research. Pharmacological prediction analysis based on these key genes provided a promising direction for mitigating seizures, with particular emphasis on bleomycin’s potential role in modulating GJA1. These findings prioritize these genes as high-value candidates for future functional and therapeutic exploration in epilepsy.
Abbreviations
snRNA-seq, single-nucleus RNA sequencing; FRGs, ferroptosis-related genes; MRGs, mitochondrial-related genes; GEO, Gene Expression Omnibus; PCA, principal component analysis; UMAP, uniform manifold approximation and projection; ssGSEA, single-sample gene set enrichment analysis; GSVA, gene set variation analysis; ATM, ataxia telangiectasia mutated; TGFBR1, transforming growth factor-beta receptor 1; ZEB1, zinc finger E-box binding homeobox 1; GJA1, gap junction protein alpha 1; ALOX5, arachidonate 5-lipoxygenase; PARP14, poly ADP-ribose polymerase 14.
Data Sharing Statement
All data are available from the GEO database (https://www.ncbi.nlm.nih.gov/geo/), ferroptosis database (http://www.zhounan.org/ferrdb), and the MitoCarta3.0 database (http://www.broadinstitute.org/mitocarta). The datasets used and analyzed during the current study are available from the corresponding author (Jing Gao) on reasonable request.
Ethics Approval and Consent to Participate
The animal experiments in this study were approved by the Medical Ethics Committee of Affiliated Hospital of Qingdao University (Approval number: QYFYWZLL30415). All rats were provided by Shandong Jinan Pengyue Laboratory Animal Breeding Co., Ltd., holding the license number SCXK (Lu) 2022 0006. All animal procedures were performed in accordance with the Guide for the Care and Use of Laboratory Animals: Eighth Edition. This study used only de-identified human data from publicly accessible databases and was therefore exempt from ethical review under Items 1 and 2 of Article 32 of “the Measures for Ethical Review of Life Science and Medical Research Involving Human Subjects”. All methods were reported in accordance with ARRIVE guidelines.
Acknowledgments
We sincerely appreciate the Laboratory Animal Center of the Affiliated Hospital of Qingdao University for providing professional animal care.
Author Contributions
Rujie Zhong: Conceptualization, Formal analysis, Methodology, Writing—original draft, Writing—review and editing. Hailin Yang: Investigation, Methodology. Xiaoyu Li: Methodology, Data curation. Feiyu Wang: Conceptualization, Supervision. Tong Tong: Methodology, Data curation. Lijie Sun: Investigation, Methodology. Jinsong Lei: Formal analysis, Supervision, Writing—review and editing. Jing Gao: Conceptualization, Funding acquisition, Supervision, Writing—review and editing. All authors took part in drafting, revising or critically reviewing the article; gave final approval of the version to be published; have agreed on the journal to which the article has been submitted; and agree to be accountable for all aspects of the work.
Funding
This work was supported by grants from Health Science and Technology Project of Shandong Province (202403070986) and post-doctoral foundation of Qingdao University, China (RZ1900011598).
Disclosure
The authors declare no competing interests in this work.
References
1. Feigin VL, Vos T, Nair BS.; GBD Epilepsy Collaborators. Global, regional, and national burden of epilepsy, 1990–2021: a systematic analysis for the global burden of disease study 2021. Lancet Public Health. 2025;10:e203–25. doi:10.1016/S2468-2667(24)00302-5
2. Thijs RD, Surges R, O’Brien TJ, Sander JW. Epilepsy in adults. Lancet. 2019;393:689–701. doi:10.1016/S0140-6736(18)32596-0
3. Kwan P, Brodie MJ. Early identification of refractory epilepsy. N Engl J Med. 2000;342:314–319. doi:10.1056/NEJM200002033420503
4. Yao M-Y, Liu T, Zhang L, Wang M-J, Yang Y, Gao J. Role of ferroptosis in neurological diseases. Neurosci Lett. 2021;747:135614. doi:10.1016/j.neulet.2020.135614
5. Dixon SJ, Lemberg KM, Lamprecht MR, et al. Ferroptosis: an iron-dependent form of nonapoptotic cell death. Cell. 2012;149:1060–1072. doi:10.1016/j.cell.2012.03.042
6. Mao C, Liu X, Zhang Y, et al. DHODH-mediated ferroptosis defence is a targetable vulnerability in cancer. Nature. 2021;593:586–590. doi:10.1038/s41586-021-03539-7
7. Wu H, Wang F, Ta N, Zhang T, Gao W. The multifaceted regulation of mitochondria in ferroptosis. Life. 2021;11:222. doi:10.3390/life11030222
8. Su Y, Cao N, Zhang D, Wang M. The effect of ferroptosis-related mitochondrial dysfunction in the development of temporal lobe epilepsy. Ageing Res Rev. 2024;96:102248. doi:10.1016/j.arr.2024.102248
9. Vander Heiden MG, Cantley LC, Thompson CB. Understanding the Warburg effect: the metabolic requirements of cell proliferation. Science. 2009;324:1029–1033. doi:10.1126/science.1160809
10. Donnan AM, Schneider AL, Russ-Hall S, Churilov L, Scheffer IE. Rates of status epilepticus and sudden unexplained death in epilepsy in people with genetic developmental and epileptic encephalopathies. Neurology. 2023;100:e1712–e1722. doi:10.1212/WNL.0000000000207080
11. Varghese N, Moscoso B, Chavez A, et al. KCNQ2/3 gain-of-function variants and cell excitability: differential effects in CA1 versus L2/3 pyramidal neurons. J Neurosci. 2023;43:6479–6494. doi:10.1523/JNEUROSCI.0980-23.2023
12. Zhao Z, Wang Q, Zhao F, et al. Single-cell and transcriptomic analyses reveal the influence of diabetes on ovarian cancer. BMC Genomics. 2024;25:1. doi:10.1186/s12864-023-09893-2
13. Chen G, Qi H, Jiang L, et al. Integrating single-cell RNA-Seq and machine learning to dissect tryptophan metabolism in ulcerative colitis. J Transl Med. 2024;22:1121. doi:10.1186/s12967-024-05934-w
14. Guan R, Li C, Gu F, et al. Single-cell transcriptomic landscape and the microenvironment of normal adjacent tissues in hypopharyngeal carcinoma. BMC Genomics. 2024;25:489. doi:10.1186/s12864-024-10321-2
15. Zhou N, Bao J. FerrDb: a manually curated resource for regulators and markers of ferroptosis and ferroptosis-disease associations. Database. 2020;2020:baaa021. doi:10.1093/database/baaa021
16. Rath S, Sharma R, Gupta R, et al. MitoCarta3.0: an updated mitochondrial proteome now with sub-organelle localization and pathway annotations. Nucleic Acids Res. 2021;49:D1541–D1547. doi:10.1093/nar/gkaa1011
17. Hao Y, Hao S, Andersen-Nissen E, et al. Integrated analysis of multimodal single-cell data. Cell. 2021;184:3573–3587.e29. doi:10.1016/j.cell.2021.04.048
18. Ilicic T, Kim JK, Kolodziejczyk AA, et al. Classification of low quality cells from single-cell RNA-seq data. Genome Biol. 2016;17:29. doi:10.1186/s13059-016-0888-1
19. Li J, Wu C, Hu H, et al. Remodeling of the immune and stromal cell compartment by PD-1 blockade in mismatch repair-deficient colorectal cancer. Cancer Cell. 2023;41:1152–1169.e7. doi:10.1016/j.ccell.2023.04.011
20. McGinnis CS, Murrow LM, Gartner ZJ. DoubletFinder: doublet detection in single-cell rna sequencing data using artificial nearest neighbors. Cell Syst. 2019;8:329–337.e4. doi:10.1016/j.cels.2019.03.003
21. Hu C, Li T, Xu Y, et al. CellMarker 2.0: an updated database of manually curated cell markers in human/mouse and web tools based on scRNA-seq data. Nucleic Acids Res. 2023;51:D870–D876. doi:10.1093/nar/gkac947
22. Franzén O, Gan L-M, Björkegren JLM. PanglaoDB: a web server for exploration of mouse and human single-cell RNA sequencing data. Database. 2019;2019:baz046. doi:10.1093/database/baz046
23. Aran D, Looney AP, Liu L, et al. Reference-based analysis of lung single-cell sequencing reveals a transitional profibrotic macrophage. Nat Immunol. 2019;20:163–172. doi:10.1038/s41590-018-0276-y
24. Friedman J, Hastie T, Tibshirani R. Regularization paths for generalized linear models via coordinate descent. J Stat Softw. 2010;33:1–22. doi:10.18637/jss.v033.i01
25. Hänzelmann S, Castelo R, Guinney J. GSVA: gene set variation analysis for microarray and RNA-seq data. BMC Bioinf. 2013;14:7. doi:10.1186/1471-2105-14-7
26. Yu G, Wang L-G, Han Y, He Q-Y. clusterProfiler: an R package for comparing biological themes among gene clusters. OMICS. 2012;16:284–287. doi:10.1089/omi.2011.0118
27. Aibar S, González-Blas CB, Moerman T, et al. SCENIC: single-cell regulatory network inference and clustering. Nat Methods. 2017;14:1083–1086. doi:10.1038/nmeth.4463
28. Sahil M, Sarkar S, Mondal J. Long-time-step molecular dynamics can retard simulation of protein-ligand recognition process. Biophys J. 2023;122:802–816. doi:10.1016/j.bpj.2023.01.036
29. Racine RJ. Modification of seizure activity by electrical stimulation. II. Motor seizure. Electroencephalogr Clin Neurophysiol. 1972;32:281–294. doi:10.1016/0013-4694(72)90177-0
30. Yang R, Gao W, Wang Z, et al. Polyphyllin I induced ferroptosis to suppress the progression of hepatocellular carcinoma through activation of the mitochondrial dysfunction via Nrf2/HO-1/GPX4 axis. Phytomedicine. 2024;122:155135. doi:10.1016/j.phymed.2023.155135
31. Sun X, Nong M, Meng F, et al. Architecting the metabolic reprogramming survival risk framework in LUAD through single-cell landscape analysis: three-stage ensemble learning with genetic algorithm optimization. J Transl Med. 2024;22:353. doi:10.1186/s12967-024-05138-2
32. Liu S, Gao X, Zhou S. New target for prevention and treatment of neuroinflammation: microglia iron accumulation and ferroptosis. ASN Neuro. 2022;14:17590914221133236. doi:10.1177/17590914221133236
33. Ryan SK, Zelic M, Han Y, et al. Microglia ferroptosis is regulated by SEC24B and contributes to neurodegeneration. Nat Neurosci. 2023;26:12–26. doi:10.1038/s41593-022-01221-3
34. Zhao J, Zhang L, Lu A, et al. ATM is a key driver of NF-κB-dependent DNA-damage-induced senescence, stem cell dysfunction and aging. Aging. 2020;12:4688–4710. doi:10.18632/aging.102863
35. Yan P, Li Z, Xiong J, et al. LARP7 ameliorates cellular senescence and aging by allosterically enhancing SIRT1 deacetylase activity. Cell Rep. 2021;37:110038. doi:10.1016/j.celrep.2021.110038
36. Pizzamiglio L, Focchi E, Cambria C, et al. The DNA repair protein ATM as a target in autism spectrum disorder. JCI Insight. 2021;6:e133654,133654. doi:10.1172/jci.insight.133654
37. Wu H, Liu Q, Shan X, Gao W, Chen Q. ATM orchestrates ferritinophagy and ferroptosis by phosphorylating NCOA4. Autophagy. 2023;19:2062–2077. doi:10.1080/15548627.2023.2170960
38. Valentin-Vega YA, Maclean KH, Tait-Mulder J, et al. Mitochondrial dysfunction in ataxia-telangiectasia. Blood. 2012;119:1490–1500. doi:10.1182/blood-2011-08-373639
39. Blobe GC, Schiemann WP, Lodish HF. Role of transforming growth factor beta in human disease. N Engl J Med. 2000;342:1350–1358. doi:10.1056/NEJM200005043421807
40. Pan X, Gong X, Pan L, Lu L. Erythropoietin relieves neuronal apoptosis in epilepsy rats via TGF-β/Smad signaling pathway. Cell Mol Biol. 2023;69:239–243. doi:10.14715/cmb/2023.69.10.35
41. McNamara NB, Munro DAD, Bestard-Cuche N, et al. Microglia regulate central nervous system myelin growth and integrity. Nature. 2023;613:120–129. doi:10.1038/s41586-022-05534-y
42. Wan J, Shen F, Ding J, Ye D. ZEB1 silencing protects against ferroptosis and mitochondrial dysfunction in osteoarthritis by inhibiting HSPA5 expression. Immunopharmacol Immunotoxicol. 2025;47:563–576. doi:10.1080/08923973.2025.2520309
43. Rao BS, Ansar S, Arokiasamy T, et al. Analysis of candidate genes ZEB1 and LOXHD1 in late-onset fuchs’ endothelial corneal dystrophy in an Indian cohort. Ophthalmic Genet. 2018;39:443–449. doi:10.1080/13816810.2018.1474367
44. Li D, Wang Y, Guo Y, Wang W. Bioinformatics analysis reveals multiple functional changes in astrocytes in temporal lobe epilepsy. Brain Res. 2024;1831:148820. doi:10.1016/j.brainres.2024.148820
45. Zhang -L-L, Chen G-H, Tang R-J, et al. Levosimendan reverses cardiac malfunction and cardiomyocyte ferroptosis during heart failure with preserved ejection fraction via connexin 43 signaling activation. Cardiovasc Drugs Ther. 2024;38:705–718. doi:10.1007/s10557-023-07441-4
46. Wang J-D, Shao Y, Liu D, Liu N-Y, Zhu D-Y. Rictor/mTORC2 involves mitochondrial function in ES cells derived cardiomyocytes via mitochondrial connexin 43. Acta Pharmacol Sin. 2021;42:1790–1797. doi:10.1038/s41401-020-00591-3
47. Li C, Zhang Y, Liu J, Kang R, Klionsky DJ, Tang D. Mitochondrial DNA stress triggers autophagy-dependent ferroptotic death. Autophagy. 2021;17:948–960. doi:10.1080/15548627.2020.1739447
48. Guan Q, Wang Z, Zhang K, et al. CRISPR/Cas9-mediated neuronal deletion of 5-lipoxygenase alleviates deficits in mouse models of epilepsy. J Adv Res. 2024;63:73–90. doi:10.1016/j.jare.2024.07.018
49. Szántó M, Gupte R, Kraus WL, Pacher P, Bai P. PARPs in lipid metabolism and related diseases. Prog Lipid Res. 2021;84:101117. doi:10.1016/j.plipres.2021.101117
50. Houtkooper RH, Cantó C, Wanders RJ, Auwerx J. The secret life of NAD+: an old metabolite controlling new metabolic signaling pathways. Endocr Rev. 2010;31:194–223. doi:10.1210/er.2009-0026
51. Han L, Chen Y, Huang N, et al. Cancer-educated neutrophils promote lung cancer progression via PARP-1-ALOX5-mediated MMP-9 expression. Cancer Biol Med. 2024;21:175–192. doi:10.20892/j.issn.2095-3941.2023.0248
52. Li C, Cai Q. Two ferroptosis-specific expressed genes NOX4 and PARP14 are considered as potential biomarkers for the diagnosis and treatment of diabetic retinopathy and atherosclerosis. Diabetol Metab Syndr. 2024;16:61. doi:10.1186/s13098-024-01301-3
53. Ravikumar M, Uvarajan D, Durairaj B. Targeting neuroimmune pathways in epilepsy: advances in mechanisms and emerging therapeutics. Neurochem Res. 2025;50:244. doi:10.1007/s11064-025-04489-6
54. Kumar P, Lim A, Hazirah SN, et al. Single-cell transcriptomics and surface epitope detection in human brain epileptic lesions identifies pro-inflammatory signaling. Nat Neurosci. 2022;25:956–966. doi:10.1038/s41593-022-01095-5
55. Hou Y, Chen Z, Wang L, et al. Characterization of immune-related genes and immune infiltration features in epilepsy by multi-transcriptome data. J Inflamm Res. 2022;15:2855–2876. doi:10.2147/JIR.S360743
56. Wang J, Wu Y, Chen J, et al. Th1/Th2 imbalance in peripheral blood echoes microglia state dynamics in CNS during TLE progression. Adv Sci. 2024;11:e2405346. doi:10.1002/advs.202405346
57. Kotlarz D, Marquardt B, Barøy T, et al. Human TGF-β1 deficiency causes severe inflammatory bowel disease and encephalopathy. Nat Genet. 2018;50:344–348. doi:10.1038/s41588-018-0063-6
58. Bohlen CJ, Bennett FC, Tucker AF, Collins HY, Mulinyawe SB, Barres BA. Diverse requirements for microglial survival, specification, and function revealed by defined-medium cultures. Neuron. 2017;94:759–773.e8. doi:10.1016/j.neuron.2017.04.043
59. Faust TE, Lee Y-H, O’Connor CD, et al. Microglia-astrocyte crosstalk regulates synapse remodeling via wnt signaling. Cell. 2025;188:5212–5230.e21. doi:10.1016/j.cell.2025.08.023
60. Unanue ER, Turk V, Neefjes J. Variations in MHC class II antigen processing and presentation in health and disease. Annu Rev Immunol. 2016;34:265–297. doi:10.1146/annurev-immunol-041015-055420
61. Bauer J, Becker AJ, Elyaman W, et al. Innate and adaptive immunity in human epilepsies. Epilepsia. 2017;58(Suppl 3):57–68. doi:10.1111/epi.13784
62. Acioglu C, Heary RF, Elkabes S. Roles of neuronal toll-like receptors in neuropathic pain and central nervous system injuries and diseases. Brain Behav Immun. 2022;102:163–178. doi:10.1016/j.bbi.2022.02.016
63. Chaudhary A, Mehra P, Keshri AK, Rawat SS, Mishra A, Prasad A. The emerging role of toll-like receptor-mediated neuroinflammatory signals in psychiatric disorders and acquired epilepsy. Mol Neurobiol. 2024;61:1527–1542. doi:10.1007/s12035-023-03639-7
64. Cai M, Lin W. The function of NF-Kappa B during epilepsy, a potential therapeutic target. Front Neurosci. 2022;16:851394. doi:10.3389/fnins.2022.851394
65. Clossen BL, Reddy DS. Novel therapeutic approaches for disease-modification of epileptogenesis for curing epilepsy. Biochim Biophys Acta Mol Basis Dis. 2017;1863:1519–1538. doi:10.1016/j.bbadis.2017.02.003
66. Sase S, Takanohashi A, Vanderver A, Almad A. Astrocytes, an active player in Aicardi-Goutières syndrome. Brain Pathol. 2018;28:399–407. doi:10.1111/bpa.12600
67. Sun H, Ma D, Cheng Y, et al. The JAK-STAT signaling pathway in epilepsy. Curr Neuropharmacol. 2023;21:2049–2069. doi:10.2174/1570159X21666221214170234
68. Campbell SL, Buckingham SC, Sontheimer H. Human glioma cells induce hyperexcitability in cortical networks. Epilepsia. 2012;53:1360–1370. doi:10.1111/j.1528-1167.2012.03557.x
69. Vasileva Z. Melatonin and Epilepsy. Folia Med. 2021;63:827–833. doi:10.3897/folmed.63.e58637
70. Fleck J, Temp FR, Marafiga JR, et al. Montelukast reduces seizures in pentylenetetrazol-kindled mice. Braz J Med Biol Res. 2016;49:e5031. doi:10.1590/1414-431X20155031
71. Lim YC, Ensbey KS, Offenhäuser C, et al. Simultaneous targeting of DNA replication and homologous recombination in glioblastoma with a polyether ionophore. Neuro Oncol. 2020;22:216–228. doi:10.1093/neuonc/noz159
72. Golab F, Hajimirzaei P, Zarbakhsh S, et al. Interplay of neuroinflammation and epilepsy in glioblastoma multiforme: mechanisms and therapeutic implications. J Mol Neurosci. 2025;75:68. doi:10.1007/s12031-025-02335-6
73. Upadhyay SK, Ali SM. Molecular recognition of flunarizine dihydrochloride and β-cyclodextrin inclusion complex by NMR and computational approaches. Chem Cent J. 2018;12:33. doi:10.1186/s13065-018-0395-4
74. Romoli M, Mazzocchetti P, D’Alonzo R, et al. Valproic Acid and epilepsy: from molecular mechanisms to clinical evidences. Curr Neuropharmacol. 2019;17:926–946. doi:10.2174/1570159X17666181227165722
75. Aronica E, Specchio N, Luinenburg MJ, Curatolo P. Epileptogenesis in tuberous sclerosis complex-related developmental and epileptic encephalopathy. Brain. 2023;146:2694–2710. doi:10.1093/brain/awad048
76. Wang Y-F, Luo Y, Hou G-L, et al. Pretreatment with methylene blue protects against acute seizure and oxidative stress in a kainic acid-induced status epilepticus model. Med Sci Monit. 2021;27:e933469. doi:10.12659/MSM.933469
77. Della Latta V, Cecchettini A, Del Ry S, Morales MA. Bleomycin in the setting of lung fibrosis induction: from biological mechanisms to counteractions. Pharmacol Res. 2015;97:122–130. doi:10.1016/j.phrs.2015.04.012
78. Zhang Z, Qu J, Zheng C, et al. Nrf2 antioxidant pathway suppresses Numb-mediated epithelial-mesenchymal transition during pulmonary fibrosis. Cell Death Dis. 2018;9:83. doi:10.1038/s41419-017-0198-x
79. Pei Z, Qin Y, Fu X, et al. Inhibition of ferroptosis and iron accumulation alleviates pulmonary fibrosis in a bleomycin model. Redox Biol. 2022;57:102509. doi:10.1016/j.redox.2022.102509
 © 2026 The Author(s). This work is published and licensed by Dove Medical Press Limited. The
full terms of this license are available at https://www.dovepress.com/terms
and incorporate the Creative Commons Attribution
- Non Commercial (unported, 4.0) License.
By accessing the work you hereby accept the Terms. Non-commercial uses of the work are permitted
without any further permission from Dove Medical Press Limited, provided the work is properly
attributed. For permission for commercial use of this work, please see paragraphs 4.2 and 5 of our Terms.
© 2026 The Author(s). This work is published and licensed by Dove Medical Press Limited. The
full terms of this license are available at https://www.dovepress.com/terms
and incorporate the Creative Commons Attribution
- Non Commercial (unported, 4.0) License.
By accessing the work you hereby accept the Terms. Non-commercial uses of the work are permitted
without any further permission from Dove Medical Press Limited, provided the work is properly
attributed. For permission for commercial use of this work, please see paragraphs 4.2 and 5 of our Terms.
Recommended articles
Analysis of the Immunoinflammatory Microenvironment Characteristics of Epilepsy Based on Single-Cell Transcriptomics
Chen Y, Zhang W, Xin M, Liu M, Zhang T, Xiao J, Liang J, Wu X
Journal of Inflammation Research 2026, 19:573666
Published Date: 12 January 2026