")
Back to Journals » International Journal of Nanomedicine » Volume 17
A Selective Reduction of Osteosarcoma by Mitochondrial Apoptosis Using Hydroxyapatite Nanoparticles
Authors Wu H, Liu S, Chen S, Hua Y, Li X, Zeng Q, Zhou Y, Yang X, Zhu X , Tu C , Zhang X
Received 31 May 2022
Accepted for publication 18 August 2022
Published 25 August 2022 Volume 2022:17 Pages 3691—3710
DOI https://doi.org/10.2147/IJN.S375950
Checked for plagiarism Yes
Review by Single anonymous peer review
Peer reviewer comments 3
Editor who approved publication: Dr Farooq A. Shiekh
Hongfeng Wu,1,2 Shuo Liu,1,2 Siyu Chen,1,2 Yuchen Hua,1,2 Xiangfeng Li,1,2 Qin Zeng,1– 3 Yong Zhou,4 Xiao Yang,1,2 Xiangdong Zhu,1,2 Chongqi Tu,4 Xingdong Zhang1– 3
1National Engineering Research Center for Biomaterials, Sichuan University, Chengdu, 610064, People’s Republic of China; 2College of Biomedical Engineering, Sichuan University, Chengdu, 610064, People’s Republic of China; 3NMPA Key Laboratory for Quality Research and Control of Tissue Regenerative Biomaterials & Institute of Regulatory Science for Medical Devices & NMPA Research Base of Regulatory Science for Medical Devices, Sichuan University, Chengdu, 610064, People’s Republic of China; 4Department of Orthopedics, West China Hospital, Sichuan University, Chengdu, 610041, People’s Republic of China
Correspondence: Qin Zeng; Xiangdong Zhu, National Engineering Research Center for Biomaterials, Sichuan University, NO. 29 Wangjiang Road, Chengdu, 610064, People’s Republic of China, Email [email protected]; [email protected]
Background: In recent years, using hydroxyapatite nanoparticles (HANPs) for tumor therapy attracted increasing attention because HANPs were found to selectively suppress the growth of tumor cells but exhibit ignorable toxicity to normal cells.
Purpose: This study aimed to investigate the capacities of HANPs with different morphologies and particle sizes against two kinds of osteosarcoma (OS) cells, human OS 143B cells and rat OS UMR106 cells.
Methods: Six kinds of HANPs with different morphologies and particle sizes were prepared by wet chemical method. Then, the antitumor effect of these nanoparticles was characterized by means of in vitro cell experiments and in vivo tumor-bearing mice model. The underlying antitumor mechanism involving mitochondrial apoptosis was also investigated by analysis of intracellular calcium, expression of apoptosis-related genes, reactive oxygen species (ROS), and the endocytosis efficiency of the particles in tumor cells.
Results: Both in vitro cell experiments and in vivo mice model evaluation revealed the anti-OS performance of HANPs depended on the concentration, morphology, and particle size of the nanoparticles, as well as the OS cell lines. Among the six HANPs, rod-like HANPs (R-HANPs) showed the best inhibitory activity on 143B cells, while needle-like HANPs (N-HANPs) inhibited the growth of UMR106 cells most efficiently. We further demonstrated that HANPs induced mitochondrial apoptosis by selectively raising intracellular Ca2+ and the gene expression levels of mitochondrial apoptosis-related molecules, and depolarizing mitochondrial membrane potential in tumor cells but not in MC3T3-E1, a mouse pre-osteoblast line. Additionally, the anti-OS activity of HANPs also linked with the endocytosis efficiency of the particles in the tumor cells, and their ability to drive oxidative damage and immunogenic cell death (ICD).
Conclusion: The current study provides an effective strategy for OS therapy where the effectiveness was associated with the particle morphology and cell line.
Keywords: hydroxyapatite nanoparticles, osteosarcoma, material features, cell line, mitochondrial apoptosis
Introduction
Osteosarcoma (OS) is a type of primary malignant bone tumor originating from mesenchymal cells. It usually germinates in the distal femur and proximal tibial metaphysis in children and adolescents.1,2 The current clinical treatment of OS is extensive tumor resection combined with neoadjuvant chemotherapy or radiotherapy. However, this treatment is usually accompanied with the low cure rate and the poor prognosis of patients due to high invasiveness, lung metastasis and multidrug resistance of OS.3,4 So far, many efforts have been made towards more effective strategies for OS therapy in preclinical studies or clinical studies. These strategies mainly include gene regulatory therapy,5–7 immunotherapy,8,9 targeted therapy10,11 and so on. However, there is still a long way to go for these research strategies used in clinical because of unsatisfactory therapeutic effect and failure in achievement of the long-term survival of patients.
Alternatively, the application of nanomaterials such as polymers or metal materials for cancer therapy attracted increasing attention of many researchers in recent years. But most nanomaterials are usually associated with evident toxicity to the body. For example, metal materials released toxic ions in the body for a long time,12,13 and inorganic materials such as titanium dioxide (TiO2) inhibited the activity of normal cells.14 By contrast, hydroxyapatite [Ca10(PO4)6(OH)2, HA], the main inorganic constituent of human bone and teeth, has been widely used in biomedical field due to their excellent bioactivity and biocompatibility.14–22 Moreover, the good antitumor activity of HA nanoparticles (HANPs) has been widely investigated in many advanced tumors such as bone tumor,23 breast cancer and melanoma,14,24,25 since they were found to inhibit the proliferation of Ca-9 tumor cells in vitro by Aoki et al in 1993.26 Interestingly, HANPs exhibited multifunctional and distinctive activity which depended on the cell lines. Zhang et al found that the HANPs could not only inhibit tumor growth but also promote bone regeneration.14 We hypothesized that the unique characteristic of HANPs made it suitable for OS therapy and sought to investigate how the particle morphology and size impact the anti-OS effect.
Taken together, to test the anti-OS activity of HANPs in the present study, we selected six kinds of HANPs with three typical morphologies, ie, granular, rod-like and needle-like, each shape with two different sizes. To study the selective effect of HANPs on various cells, two kinds of OS cells, human OS 143B cell line derived from human bone tissue, rat OS UMR106 cell line induced by injecting radioisotope phosphorus,32 and a mouse pre-osteoblast MC3T3-E1 cell line were used in the in vitro cell experiment and in vivo animal study. We systematically investigated the function of HANPs on different cell lines by primarily using in vitro cytotoxicity assay, endocytosis assay, measurement of intracellular Ca2+, reactive oxygen species (ROS), the expression of mitochondrial apoptosis-related molecules, and evaluation of the anti-OS effect in the tumor-bearing mice model. The results indicated that HANPs exhibited good activity against OS cells due to selective initiation of mitochondrial apoptosis in the tumor cells but not in MC3T3-E1 cells. And the antitumor capacity was dependent on nanoparticle morphology and OS cell line (Scheme 1). This study offers an effective strategy for OS therapy.
 |
Scheme 1 Schematic diagram of anti-OS effect of HANPs associated with the morphology of particles and OS cell source. Among the six HANPs with different morphologies and particle sizes, the rod-like HANPs inhibit the growth of 143B cells most efficiently in vitro and in vivo, while needle-like HANPs are strongest to suppress the proliferation of UMR106 cells. The anti-OS capacity of HANPs correlates with the morphology of particles, endocytosis efficiency, the levels of intracellular Ca2+, oxidative damage, immunogenic cell death (ICD) and mitochondrial apoptosis, as well as the cell source. |
Materials and Methods
Materials
Fetal bovine serum (FBS) was purchased from Thermo Fisher Scientific (Gibco, Waltham, MA, USA). Dulbecco’s Modified Eagle Medium (DMEM), Minimum Essential Medium α (α-MEM), 1% penicillin–streptomycin solution, phosphate-buffered solution (PBS) and Trypsin-0.25% EDTA were purchased from Hyclone (Logan, Utah, USA). DMEM that contains 1.5 g/mL NaHCO3 was purchased from iCell Bioscience Inc. (Shanghai, China). Cell Counting Kit-8 (CCK-8) and JC-1 MitoMP Detection Kit were purchased from Dojindo Laboratories (Kumanoto, Japan). Cell-LightTM EdU Apollo 567 In Vitro Kit was purchased from RiboBio Co., Ltd. (Guangzhou, China). 2-(4-Amidinophenyl)-6-indolecarbamidine dihydrochloride (DAPI) and Fluo-3 AM were purchased from Beyotime Institute of Biotechnology (Shanghai, China). Fluorescein diacetate (FDA) and propidium iodide (PI) were purchased from Sigma-Aldrich (St Louis, MO, USA). Matrigel and Fluorescein isothiocyanate (FITC) Annexin V Apoptosis Detection Kit I was purchased from BD Biosciences (Franklin Lakes, NJ, USA). Fluorescein Isothiocyanate (FITC) was purchased from Beijing Solarbio Science & Technology Co. Ltd. (Beijing, China). Reactive Oxygen Species Assay Kit was purchased from Nanjing JianCheng Bioengineering Institute (Nanjing, China). The RNeasy Mini Kit was purchased from Qiagen (Hilden, Germany). The iScript™ gDNA Clear cDNA Synthesis kit and SsoFast™ EvaGreen Supermix were purchased from BioRad Laboratories Inc. (Hercules, CA, USA). The TUNEL Kit, Ki-67, cyclin D1, CD31 and cytochrome C primary antibody were obtained from Servicebio (Wuhan, China). The calreticulin (CRT) primary antibody was purchased from Abcam (Cambridgeshire, UK).
Preparation and Characterization of Hydroxyapatite Nanoparticles (HANPs)
The six types of HANPs with different morphologies and particle sizes were named granular HANPs-1 (G-HANPs-1), granular HANPs-2 (G-HANPs-2), rod-like HANPs-1 (R-HANPs-1), rod-like HANPs-2 (R-HANPs-2), needle-like HANPs-1 (N-HANPs-1) and needle-like HANPs-2 (N-HANPs-2), respectively. The particles were synthesized according to our previous studies.14,25 In brief, the six HANPs were prepared by using chemical precipitation method with PEG2000 as template to improve the dispersion of particles. The morphology of the six HANPs was controlled by regulating the synthesis process parameters including the initial input of reactant concentration and post-treatment of the synthesized slurry such as hydrothermal treatment, calcination and drying methods. Among the six HANPs, G-HANPs-1 was synthesized by inputting 0.5 mol/L Ca(NO3)2·4H2O and 0.3 mol/L (NH4)2HPO4 and drying at 60°C. G-HANPs-2 was prepared by calcination at 700°C for 1 h in a muffle furnace. R-HANPs-1 and R-HANPs-2 were obtained by hydrothermal heating for 12 h at 150°C and 120°C, respectively. N-HANPs-1 was synthesized with an initial input of 0.1 mol/L Ca(NO3)2·4H2O and 0.06 mol/L (NH4)2HPO4 and drying at 60°C. N-HANPs-2 was prepared by mixing 0.5 mol/L Ca(NO3)2·4H2O and 0.5 mol/L (NH4)2HPO4 with a Ca/P volume ratio of 1.67, followed by lyophilization for 24 h and calcination for 2 h in a muffle furnace at 300°C (Figure S1A). The morphology and particle size of HANPs were observed by the Transmission Electron Microscope (TEM, FEI Tecnai G2F20, USA). According to the TEM images, the particle size of HANPs was evaluated by using Nano Measure software 1.2 to count at least 70 nanoparticles in the representative image of each group.
Culture of OS Cells and Mouse Pre-Osteoblast
Human OS cell line (143B), rat OS cell line (UMR106) and mouse pre-osteoblast line (MC3T3-E1) were purchased from iCell Bioscience Inc (China). 143B cells, UMR106 cells and MC3T3-E1 cells were cultured in DMEM that contains 1.5 g/mL NaHCO3 and а-MEM, respectively, at 37°C under 5% CO2 atmosphere. All the mediums for cell culture were supplemented with 10% FBS and 1% penicillin–streptomycin solution. 143B cells, UMR106 cells and MC3T3-E1 cells were seeded in 24-well plates at a density of 2.0×10⁴ cells/well, 1.5×10⁴ cells/well and 1.0×10⁴ cells/well, respectively. After incubation for 4 h, HANPs suspensions at different concentrations (100, 200, 400 and 800 μg/mL) in medium were treated to the cells and co-cultured for 4, 24, 48 or 72 h for the following studies.
The Cell Viability Assay
Cell viability was measured by CCK-8 assay according to the previously described method.25 The control group has the cells without HANPs treatment. The blank group contained only the media with neither of the cells nor HANPs. The optical density (OD) value was detected at the wavelength of 450 nm via a multimode microplate reader (Tecan Infinite 200pro, Switzerland), and the cell viability (%) was calculated according to Equation 1.
Cell viability (%) = ([OD]test − [OD]blank)/([OD]control − [OD]blank) × 100%.(1)
The Cell Proliferation Assay
The cell proliferation was measured by Cell-LightTM EdU Apollo 567 In Vitro Kit. After MC3T3-E1 cells were co-cultured with HANPs at the concentration of 400 µg/mL for 1, 2 and 3 days respectively, the cells were treated according to the kit’s instructions. The images were collected under a fluorescent inverted microscope (Leica-DMI4000B, Germany), and 3–5 visual fields were randomly selected for each sample. Red represents proliferative cells, and blue represents all living cells. The formula of the cell proliferation rate (%) was calculated according to Equation 2.
Cell proliferation rate (%) = (red fluorescent cells/blue fluorescent cells) × 100%.(2)
The Confocal Laser Scanning Microscopy (CLSM) Observation of OS Cells and Mouse Pre-Osteoblast
After the three kinds of cells were co-cultured with HANPs at the concentration of 400 µg/mL for 1, 2 and 3 days, respectively, the live/dead cells were stained with FDA (Ex/Em = 488/520 nm) and PI (Ex/Em = 535/615 nm), and the cell nuclei were dyed with DAPI (Ex/Em = 405/454 nm). The cells were then observed by CLSM (Zeiss LSM880, USA).
The Analysis of Cellular Uptake Efficiency in OS Cells and Mouse Pre-Osteoblast
The intracellular uptake efficiency of HANPs into 143B, UMR106 and MC3T3-E1 cells was measured by FCS (BD FACSCanto II, USA). The six HANPs were labeled with FITC, following a reported method.27 After the cells were co-cultured with the FITC-HANPs (Ex/Em = 488/520 nm) at the concentration of 400 µg/mL for 4 h, the culture media were removed, and the cells were washed with PBS, trypsinized, collected, re-suspended in ice-cold FACS buffer, and determined by FCS.
The Intracellular Ca2+ of OS Cells and Mouse Pre-Osteoblast
The levels of intracellular Ca2+ of 143B, UMR106 and MC3T3-E1 cells were measured by a fluorescent dye, Fluo-3 AM (Ex/Em = 488/525 nm). After the cells were co-cultured with the HANPs at the concentration of 400 µg/mL for 1, 2 and 3 days, the media was discarded, and the cells were washed once with PBS (pH 7.4), trypsinized, collected by centrifugation (1500 rpm, 5 min), re-suspended in Fluo-3 AM dye with a final concentration of 1 μM and cultured at 37°C for 40 min. Then, the cells were washed twice to remove residual Fluo-3 AM dye, allowed to stay in PBS at 37°C for 20 min, and analyzed by a multimode microplate reader (Tecan Infinite 200pro, Switzerland).
The Estimation of Mitochondrial Membrane Potential (Δψm) of OS Cells and Mouse Pre-Osteoblast
The levels of Δψm of 143B, UMR106 and MC3T3-E1 cells were measured using JC-1 MitoMP Detection Kit. After co-culturing with the HANPs at the concentration of 400 µg/mL for 1, 2 and 3 days, the media were discarded and the cells were washed with PBS, trypsinized, collected, re-suspended in JC-1 working solution (143B and UMR106 cells: 2 μmol/L; MC3T3-E1 cells: 4 μmol/L) and incubated at 37°C under an atmosphere of 5% CO2 for 30 min. Subsequently, the cells were washed twice with HBSS, soaked in Imaging Buffer Solution, and qualitatively analyzed by CLSM and quantitatively analyzed by fluorescence microplate reader (Green, Ex/Em = 488/525 nm; Red, Ex/Em = 535/585 nm; SYNERGY H1; BioTek, USA).
The Detection of Intracellular ROS of OS Cells and Mouse Pre-Osteoblast
The levels of intracellular ROS from 143B, UMR106 and MC3T3-E1 cells were evaluated via intracellular conversion of 2,7-dichlorofluorescein diacetate (DCFH/DA) into a fluorescent product DCF using Reactive Oxygen Species Assay Kit (Ex/Em=500/525 nm). After exposure of the cells to HANPs in the medium at the concentration of 400 µg/mL for 1, 2 and 3 days, the media were removed, and the cells were washed with PBS, trypsinized, collected, re-suspended in DCFH-DA (10 μM) at 37°C for 30 min. The level of intracellular ROS was measured by a multimode microplate reader.
The Cell Apoptosis Assay for OS Cells
The apoptosis of 143B cells and UMR106 cells was detected by fluorescein isothiocyanate (FITC) Annexin V Apoptosis Detection Kit. After 143B cells or UMR106 cells were co-cultured with HANPs at the concentration of 400 µg/mL for 1 and 3 days, respectively, the cells were stained with Annexin V FITC/PI according to the instruction of the staining kit and immediately detected by flow cytometry (FCS, Beckman-CytoFLEX, China).
The Quantitative Real-Time PCR (qRT-PCR) for OS Cells and Mouse Pre-Osteoblast
After 143B, UMR106 or MC3T3-E1 cells were co-cultured with the HANPs at the concentration of 400 µg/mL for 1, 2 and 3 days, the total RNA from the cells was extracted using Buffer RLT from RNeasy Mini Kit. The extracted RNA was converted into cDNA using the iScriptTM cDNA Synthesis kit. Then, the SsoFastTM EvaGreen® kit was used to combine cDNA with the primers of the target gene, and the expression levels of the target gene were obtained by a CFX96™ system (Bio-Rad). The gene primer sequences of the present study are shown in Table S1.
Construction of the OS Animal Model
Balb/c nude mice (female, 5 weeks old, weighing 16.22 ± 0.67 g) were purchased from GemPharmatech Co., Ltd (China). All the animal experiments were approved by the Animal Care and Use Committee of Sichuan University in accordance with the guidelines of the Chinese Society of Laboratory Animals on animal welfare. All mice were randomly divided into 14 groups, including seven groups for 143B mice model and seven groups for UMR106 mice model. Each mice model had one control group without HANPs treatment and six experimental groups with the six HANPs treatments. The mixture containing Matrigel (50 μL), 143B cells (1 × 10⁷ cells/mL) or UMR106 cells (5 × 10⁶ cells/mL) with 50 μL HANPs suspension (50 mg/kg) (or complete medium for control group) were subcutaneously injected into the back of each mouse.14,24,25 Then, the growth of tumor tissue of each nude mice was monitored.
Evaluation of the Antitumor Effect of HANPs in vivo
During the observation period, the mice were weighed every 3 or 4 days. The length and width of the tumor tissue on each mouse was measured with a vernier caliper according to the equation: tumor volume (mm3) = (length × width2)/2.24,28 At the end of the animal observation period (143B, 4 weeks; UMR106, 3 weeks), all mice were euthanized, and the tumor tissue was isolated, weighed, and fixed in 10% neutral formalin. Then, the tissue samples were embedded in paraffin and stained with hematoxylin–eosin (H&E) and immunocytochemistry for histopathological analysis. Immunocytochemistry staining was also performed to observe the expression of TUNEL, Ki-67 (143B, 1:500, GB13030-2; UMR106, 1:2000, GB111141), cyclin D1 (1:400; GB13079), CD31 (1:2000; GB13428), cytochrome C (1:1000; GB11080) and CRT (1:100; ab92516).
Biosafety Assessment of HANPs
The tissues including heart, liver, spleen, lung and kidney from the aforementioned sacrificed mice were detached, and fixed with 10% neutral formalin for H&E staining. Blood was collected by cardiac puncture of each mouse for haematological studies with an automatic hematology analyzer (Mindray-BC-2800Vet, China). The serum sample was obtained by centrifugation of the whole blood at 5000 rpm/min for 15 min, and the biochemical analysis of the serum was then performed by an automatic biochemical analyzer (Mindray-BS-240VET, China). The serum biochemical indicators included liver function (ALT and AST), renal function (CREA and UREA), blood phosphorus and blood calcium.
Statistical Analysis
All experimental data were represented as mean ± SD, and the data were obtained from at least three parallel samples for each experimental condition. Statistical analyses were performed with one-way analysis of variance (ANOVA) using SPSS 20.0. The level of P<0.05 were considered as statistically significant of experimental data.
Results
Characterization of HANPs
Six HANPs with different morphologies and particle sizes were successfully prepared by wet chemical method combined with different post-treatment. These HANPs were typically granular (G-HANPs), rod-like (R-HANPs) and needle-like (N-HANPs). Each morphology had two particle sizes, small ones called G-HANPs-1, R-HANPs-1, N-HANPs-1 and bigger ones named G-HANPs-2, R-HANPs-2, N-HANPs-2 (Figure S1A). The preliminary XRD results showed that the characteristic peaks of the six HANPs correspond to those of the HA standard (JCPDS: 09–0432), indicating a pure HA phase (Figure S1B). The morphology and particle size of the as-prepared HANPs were characterized by TEM. The results revealed that all the six HA were nano-scale. Both G-HANPs-1 and G-HANPs-2 were granular with the particle sizes of 13.80 ± 2.62 nm and 33.80 ± 5.09 nm, respectively. R-HANPs-1 and R-HANPs-2 were rod-like with different aspect ratios, and their long diameter was 52.60 ± 5.65 nm and 67.00 ± 12.72 nm, their short diameter was 28.75 ± 2.69 nm and 29.13 ± 5.17 nm, respectively. N-HANPs-1 was needle-like with a length of 46.39 ± 6.14 nm and a width of 7.66 ± 1.10 nm, and N-HANPs-2 was needle-like with a length of 87.59 ± 10.12 nm and a width of 29.37 ± 4.74 nm (Figure S1C).
Cell Relative Viability
The relative viability of OS cells (143B and UMR106 cells) in vitro was evaluated by CCK-8, Edu and FDA/PI staining assays following treatment of the six HANPs with different concentration and incubation duration. The results from CCK-8 assay indicated that the viability of 143B cells was associated with the incubation duration and the concentration of the six HANPs. One-day incubation showed ignorable cytotoxicity to or even promoted the proliferation of 143B cells, while three-day incubation significantly reduced the viability of 143B cells. The six HANPs from 100 to 400 μg/mL inhibited the growth of 143B cells in a concentration-dependent manner, but a higher concentration of HANPs at 800 μg/mL did not lead to a higher cytotoxicity. Among the six HANPs, a short size of R-HANPs (R-HANPs-1) showed the persistent and the strongest inhibitory effect on the cell viability (21.47%) following the treatment for 3 days (Figure 1A). Similar to the effect on 143B cells, all the six HANPs inhibited the proliferation of UMR106 cells in a concentration-dependent manner. However, differences were in that the viability of UMR106 cells reduced following only 1-day incubation. Prolonged incubation even resulted in a lower cytotoxicity. Among the six HANPs, only the needle-like (N-HANPs-1 and N-HANPs-2) showed a persistent inhibitory effect on the growth of UMR106 cells. Moreover, we found the particle size of HANPs did not obviously impact their cytotoxicity to UMR106 cells (Figure 1B). Additionally, the viability of MC3T3-E1 cells, a mouse pre-osteoblast line, was also inhibited by HANPs at a high concentration of 400 or 800 µg/mL, which was measured by CCK-8 assay (Figure S2). This result was contrary to that from Edu and FDA/PI staining assay which showed that HANPs at the concentration of 400 µg/mL had little inhibitory activity on the proliferation of MC3T3-E1 cells (Figures S3 and S4C). FDA/PI staining results further confirmed that HANPs suppressed the proliferation of the two OS cells (Figure S4A-B). Together, these results indicated that HANPs selectively inhibited the growth of OS cells. Among the six HANPs at the concentration of 400 µg/mL, R-HANPs-1 most strongly inhibited the proliferation of 143B cells, while N-HANPs showed the greatest inhibitive effect in UMR106 cells.
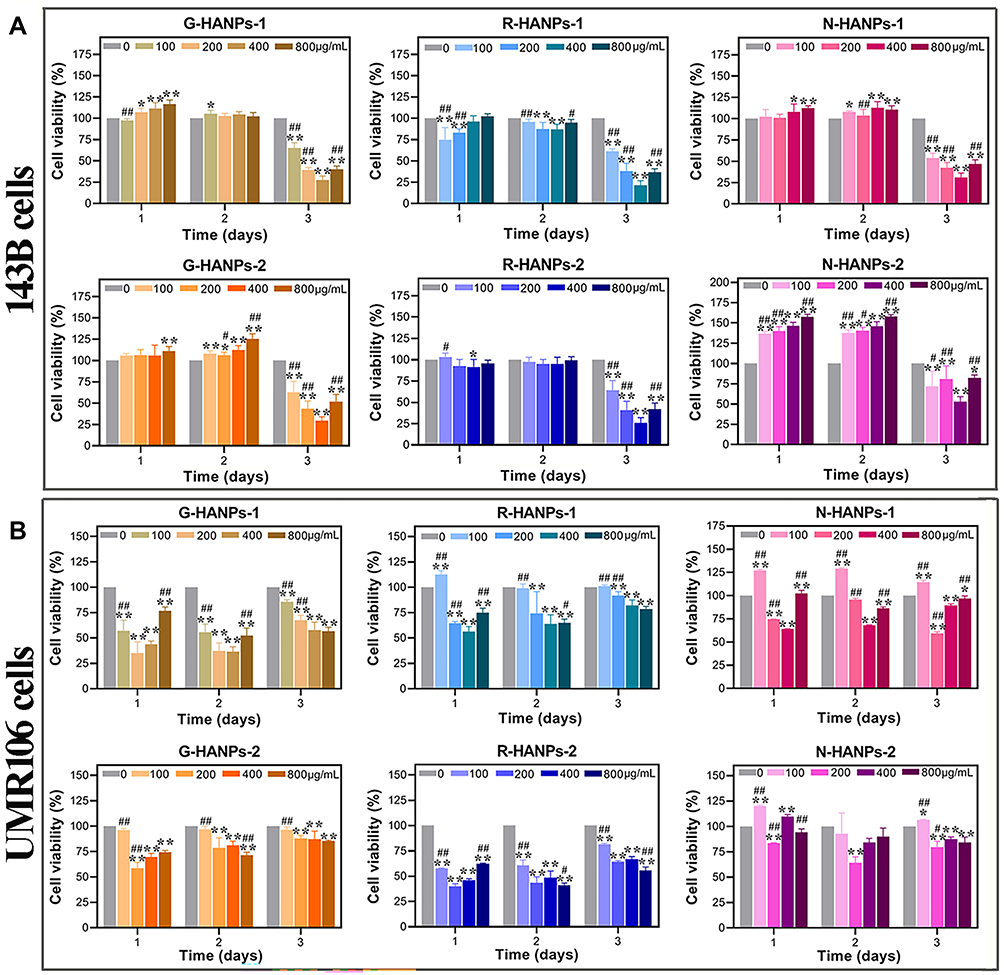 |
Figure 1 Among the six HANPs, R-HANPs had the strongest inhibitory effect on the viability of 143B cells, and N-HANPs had the strongest inhibitory effect on the viability of UMR106 cells. The viabilities of 143B (A) and UMR106 (B) cells after the cells were treated with six HANPs at the different concentration of 100, 200, 400 and 800 μg/mL for 1, 2 and 3 days (n=3; vs 0 μg/mL, *P<0.05, **P<0.01; vs 400 μg/mL, #P<0.05, ##P<0.01). |
Intracellular Uptake Assay
We then tested the cellular uptake efficiency of HANPs in 143B, UMR106 and MC3T3-E1 cells, respectively. The FCS results showed that all the six HANPs could be internalized into the OS cells and MC3T3-E1 cells. Among the six HANPs, R-HANPs-1 and N-HANPs-1 had the greatest endocytosis efficiency in 143B cells. The mean fluorescence intensity of R-HANPs-1 was slightly higher than that of N-HANPs-1 despite no statistical difference between these two groups (Figure 2A and B). N-HANPs-1 and N-HANPs-2 had the highest endocytosis efficiency in UMR106 cells (Figure 2C and D). Additionally, the endocytosis efficiency of all HANPs but N-HANPs-1 reduced in MC3T3-E1 (Figure S5), compared to that in 143B (Figure 2A and B) and UMR106 cells (Figure 2C and D).
 |
Figure 2 HANPs could be endocytosed into 143B and UMR106 cells. Among the six HANPs, R-HANPs-1 had the highest internalization efficiency in 143B cells, and N-HANPs had the highest internalization efficiency in UMR106 cells. The representative flow cytometer histograms (A and C) and mean fluorescence intensity (B and D) of 143B (a, b) and UMR106 (C and D) cells after the cells treated with the six FITC-HANPs at the concentration of 400 μg/mL for 4 h (n=3; for 143B cells: vs control, **P<0.01; vs R-HANPs-1, $$P<0.01; for UMR106 cells: vs control, **P<0.01; vs N-HANPs-1, ++P<0.01; vs N-HANPs-2, &&P<0.01). |
The Levels of Intracellular Ca2+, Δψm and ROS
Since HANPs entered OS cells was observed, we next investigated the levels of intracellular Ca2+, Δψm, ROS of the cells. We found intracellular Ca2+ level was increased in the OS cells along the incubation time after HANPs treatments (Figure 3A and B). In contrast, HANPs treatment did not result in obvious change in the Ca2+ production in MC3T3-E1 cells compared to the control without HANPs (Figure S6A). We further observed the Δψm in 143B and UMR106 cells reduced (Figures 3C and S6B-C, E-F), but no such phenomenon occurred in MC3T3-E1 cells (Figure S6D, G) after 1 or 3 days co-culture of six HANPs and cells. Among the six HANPs, R-HANPs-1 had the strongest effect on inducing mitochondrial apoptosis in 143B cells, and N-HANPs showed the strongest effect on inducing mitochondrial apoptosis in UMR106 cells. This trend was consistent with the oxidative damage experiment. The relative ROS levels of the 143B cells following HANPs treatment were higher than that of the control group. The relative ROS levels in all the HANPs groups increased along with the co-culturing time from 1 to 3 days (Figure 3D). At the same time, among the six HANPs, G-HANPs-1, N-HANPs-1 and N-HANPs-2 caused the continuous increase of the ROS in UMR106 cells along with co-culturing time, while the other three HANPs led to gradually reduced ROS levels in UMR106 cells (Figure 3E). However, the relative ROS fluorescence intensities of the MC3T3-E1 cells in all experimental groups were lower than that of the control group from 1 to 3 days (Figure S7). Taken together, these results suggested the selective effect of HANPs to induce the increase of intracellular Ca2+ and ROS, decrease of Δψm in OS cells but not in MC3T3-E1 cells.
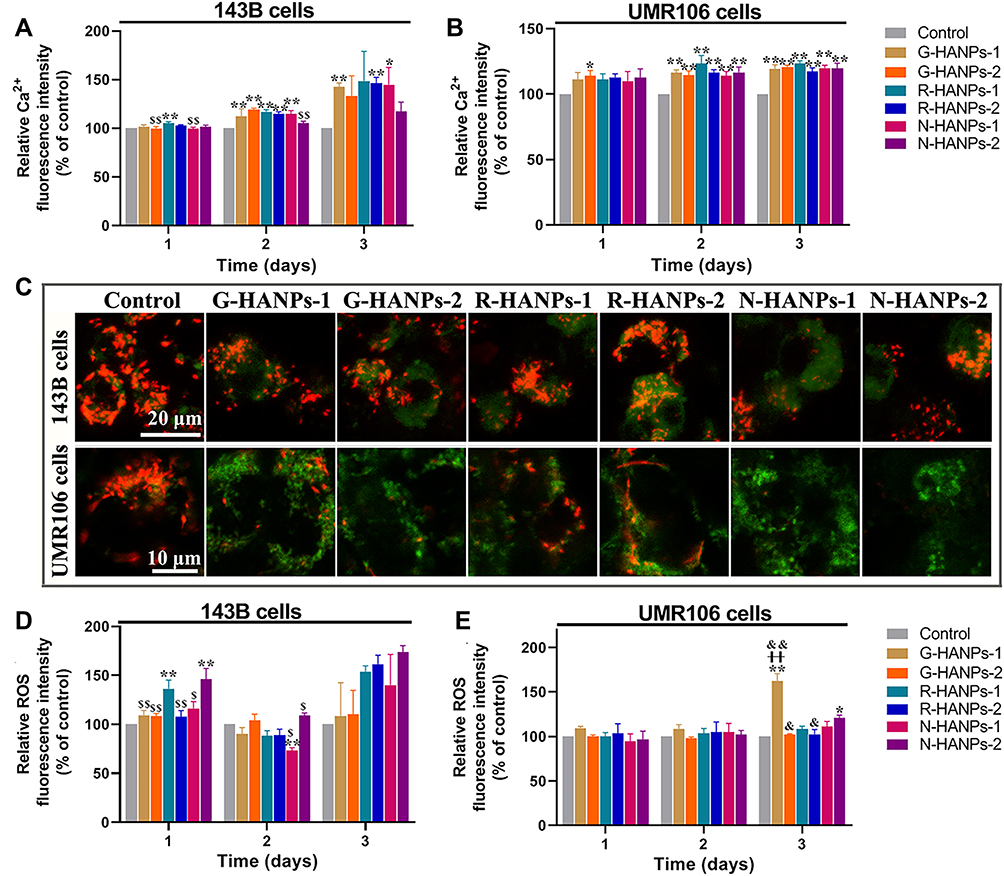 |
Figure 3 HANPs increased the level of intracellular Ca2+, depolarized mitochondria membrane potential and promoted ROS production of the tumor cells. The relative intracellular Ca2+ fluorescence intensity of 143B (A) and UMR106 (B) cells after the cells were treated with six HANPs at the concentration of 400 μg/mL for 1, 2 and 3 days. The representative CLSM images of 143B and UMR106 cells by JC-1 staining after the cells were treated with six HANPs at the concentration of 400 μg/mL for 3 days (n=3; after HANPs treatment, the corresponding red fluorescence (JC-1 aggregates) decreased, while the corresponding green fluorescence (JC-1 monomers) increased, indicating that mitochondrial depolarization occurred in tumor cells after HANPs treatments) (C). The relative ROS fluorescence intensity in 143B (D) and UMR106 (E) cells after the cells were treated with six HANPs at the concentration of 400 μg/mL for 1, 2 and 3 days (n=3; for 143B cells: vs control, *P<0.05,**P<0.01; vs R-HANPs-1, $P<0.05, $$P<0.01; for UMR106 cells: vs control, *P<0.05,**P<0.01; vs N-HANPs-1, ++P<0.01; vs N-HANPs-2, &P<0.05, &&P<0.01). |
Cell Apoptosis Induced by Different HANPs
The cell apoptosis was analyzed qualitatively and quantitatively based on DAPI staining and FCS. The representative CLSM images indicated that the nuclei of 143B or UMR106 cells following HANPs treatment for 3 d turned shrank and fragmented, showing the signs of apoptosis (Figures 4A and S8A-B).14,25 However, no obvious change in the nuclei morphology of MC3T3-E1 cells in HANPs groups was observed compared to the control group (Figure S8C). FCS results from Annexin V FITC/PI staining showed that the apoptosis rate of all experimental groups was higher than that of the control group following 1- or 3-day incubation. With the extension of co-culturing time, the apoptosis rate, especially late apoptosis obviously increased in each experimental group. At day 3, the total apoptosis proportions of 143B cells following six HANPs treatment were 11.92%, 22.02%, 14.02%, 16.69%, 16.51% and 6.29%, respectively, while 6.83% in the control group without HANPs treatment (Figures 4B, C and S9A). At day 3, the total apoptosis percentages of UMR106 cells in G-HANPs-1, G-HANPs-2, R-HANPs-1, R-HANPs-2, N-HANPs-1 and N-HANPs-2 were 8.56%, 14.97%, 15.70%, 15.87%, 13.52% and 12.51%, respectively, while 5.73% in the control group (Figures 4d, E and S9B). These results indicated that among the six HANPs, R-HANPs-1 induced the apoptosis of 143B cells most effectively, and N-HANPs sustainably induced the apoptosis of UMR106 cells.
 |
Figure 4 HANPs induced the apoptosis of 143B and UMR106 cells. The typical CLSM images of 143B and UMR106 cells stained with nuclei (blue) after the cells were treated with six HANPs at the concentration of 400 μg/mL for 3 days (n=3; white triangle: the nucleus shrinkage or fragmentation) (A). The apoptosis rates obtained by double-staining with Annexin V-FITC/PI of 143B (B and C) and UMR106 (D and E) cells after the cells treated with six HANPs at the concentration of 400 μg/mL for 1 (B and D) and 3 (C and E) days (n=3). |
Detection of Mitochondria Apoptosis-Related Molecules
The rise of intracellular Ca2+ and ROS, and the loss of Δψm might cause the mitochondria-related apoptosis. We next investigated the gene expression levels of mitochondria apoptosis-related proteins such as p53, Bax, Bcl-2 and caspase proteins by qRT-PCR. Of these proteins, p53 suppresses tumor growth, Bax is pro-apoptotic while Bcl-2 anti-apoptotic29,30; caspase-3, as a key apoptotic executioner, can be activated by caspase-8 and caspase-9.31–33 The results showed that the levels of these genes were up-regulated in 143B cells after the six HANPs treatment for 1 or 3 days (Figure 5A). Gene expression levels of caspase-3 and caspase-8 in 143B and UMR106 cells were increasingly up-regulated from 1 to 3 days by the addition of HANPs, while that of caspase-9 became lower than the control group after 2 or 3 days’ incubation of HANPs. HANPs also showed the similar function in UMR106 cells to that in 143B cells for the up-regulation of all the tested genes. However, among the six HANPs, only the N-HANPs up-regulated gene expression along with the incubation duration from 1 to 3 days (Figure 5B). HANPs did not up-regulate the expression level of all the apoptosis-related genes except Bcl-2 in MC3T3-E1 cells compared to the control group (Figure S10). Therefore, HANPs selectively induced mitochondria-related apoptosis in 143B and UMR106 cells but not in MC3T3-E1 cells.
 |
Figure 5 HANPs activated mitochondria apoptotic signaling in 143B and UMR106 cells. The gene expression level of mitochondria apoptosis related molecules in 143B (A) and UMR106 (B) cells after the cells were treated with six HANPs at the concentration of 400 μg/mL for 1, 2 and 3 days (n=3; for 143B cells: vs control, *P<0.05,**P<0.01; vs R-HANPs-1, $P<0.05, $$P<0.01; for UMR106 cells: vs control, *P<0.05,**P<0.01; vs N-HANPs-1, +P<0.05, ++P<0.01; vs N-HANPs-2, &P<0.05, &&P<0.01). |
Antitumor Effect of HANPs in vivo
Based on the in vitro results, we then examined the antitumor effect of HANPs in OS-bearing Balb/c nude mice models. After subcutaneously inoculated with tumor cells and HANPs, tumor growth and body weight were monitored every 3 or 4 days (143B: 28 days; UMR106: 21 days) (Figure S11). In 143B or UMR106 OS-bearing mice model, there was no significant difference in body weight between the control group and all the experimental groups (Figure 6A and F). For 143B model, tumors were observed at day 7 and grew sharply in the control group. But the growth of tumors was delayed by the addition of HANPs at day 7 after tumor inoculation. At each time point, tumor volume was smaller in the R-HANPs-1 group than that in the other six groups (Figures 6B and S11A). For UMR106 model, the tumor appeared in the control group and all experimental groups at day 5. After day 13 and 21, the tumor sizes in the control group increased gradually. Among the six HANPs, only N-HANPs-1 and N-HANPs-2 presented the continuous inhibition on the tumor tissue. And tumor tissue in N-HANPs-1 and N-HANPs-2 was the smallest among the seven groups at each observation time point since day 9 (Figures 6G and S11B).
 |
Figure 6 All the six HANPs inhibited the growth of 143B tumor tissues, while only N-HANPs inhibited the growth of UMR106 in the tumor-bearing mice model. Body weight (A and F) and tumor volume (B and G) in 143B (A and B) and UMR106 (F and G) OS-bearing mice after treated with six HANPs during the observation period. The typical images of tumors resected from 143B (C) and UMR106 (H) OS-bearing mice at day 28 and 21, respectively. The quantitative analysis of the resected tumor weight (D and I) and tumor volume (E and J) in 143B (D and E) and UMR106 (I and J) OS-bearing mice day 28 and 21, respectively (n=5; for 143B nude mice: vs control, *P<0.05, **P<0.01; vs R-HANPs-1, $P<0.05; for UMR106 nude mice: vs control, *P<0.05, **P<0.01; vs N-HANPs-1, +P<0.05, ++P<0.01; vs N-HANPs-2, &P<0.05, &&P<0.01). H&E staining of the resected tumor tissue in 143B (k) and UMR106 (l) OS-bearing mice at day 28 and 21, respectively (scale bar: 250 μm). |
At the last day of monitoring period (143B: 28 days; UMR106: 21 days), tumors were isolated from each OS-bearing mouse and weighed. For 143B tumor, the results showed tumor sizes in the experimental group were significantly smaller than those of the control group. Among the six HANPs, the tumor tissue treated with R-HANPs-1 was smallest (Figure 6C-E). For UMR106 tumor, abundant blood vessels could be observed in the tumors for the control groups, G-HANPs-2, R-HANPs-1 and R-HANPs-2. Among the six HANPs, N-HANPs presented the best antitumor efficiency (Figure 6H-J). The above results indicated the antitumor performance of HANPs was related to their morphology and particle size. Among the six HANPs, R-HANPs with a shorter size in long diameter showed the best anti-143B-tumor effect, and N-HANPs showed the best anti-UMR106-tumor effect.
Histopathological Analysis in vivo
To further verify the antitumor effect of HANPs, we next examined the histopathology of tumor tissue by H&E staining. As indicated by the H&E staining images, the tumor cells in the control groups were compact with obvious blood vessels that support the tumor growth. HANPs-treated tumor tissues, especially R-HANPs-1-treated 143B and N-HANPs-treated UMR106 cell tumors, turned obvious loose, indicating fewer cells than that in the control group (Figure 6K-L). Results from TUNEL staining revealed that HANPs induced the apoptosis of tumor cells. The relative apoptosis rate contrasted with the levels of Ki-67, cyclin D1 and CD31, indicating that HANPs suppressed the proliferation and G1–S transition of tumor cells, as well as the vascular differentiation. Mitochondria damage was then observed by the elevation of cytochrome C in the HANPs-treated tumors. Moreover, we found HANPs induced the immunogenic cancer cell death (ICD) due to the highly expressed CRT detected in the HANPs-treated tumor tissues (Figures 7 and 8). Together, the addition of HANPs promoted the apoptosis and ICD of tumor cells, and inhibited the proliferation and vessel differentiation in both of 143B and UMR106 tumor.
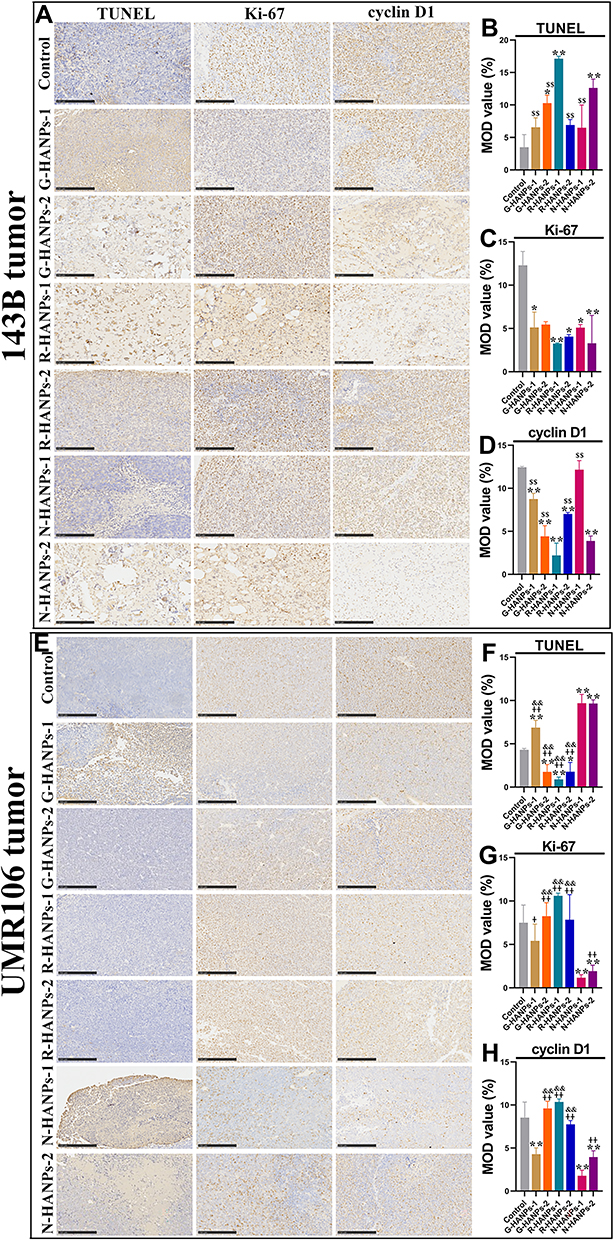 |
Figure 7 HANPs induced the apoptosis, inhibited the proliferation of OS tumor cells. Immunohistochemical staining and semi-quantification of TUNEL, Ki-67 and cyclin D1 of the resected 143B tumor tissues (A-D) and UMR106 tumor tissues (E-H) at day 28 and 21, respectively (for 143B nude mice: vs control, *P<0.05, **P<0.01; vs R-HANPs-1, $$P<0.01; for UMR106 nude mice: vs control, *P<0.05, **P<0.01; vs N-HANPs-1, +P<0.05, ++P<0.01; vs N-HANPs-2, &&P<0.01, scale bar: 250 μm). |
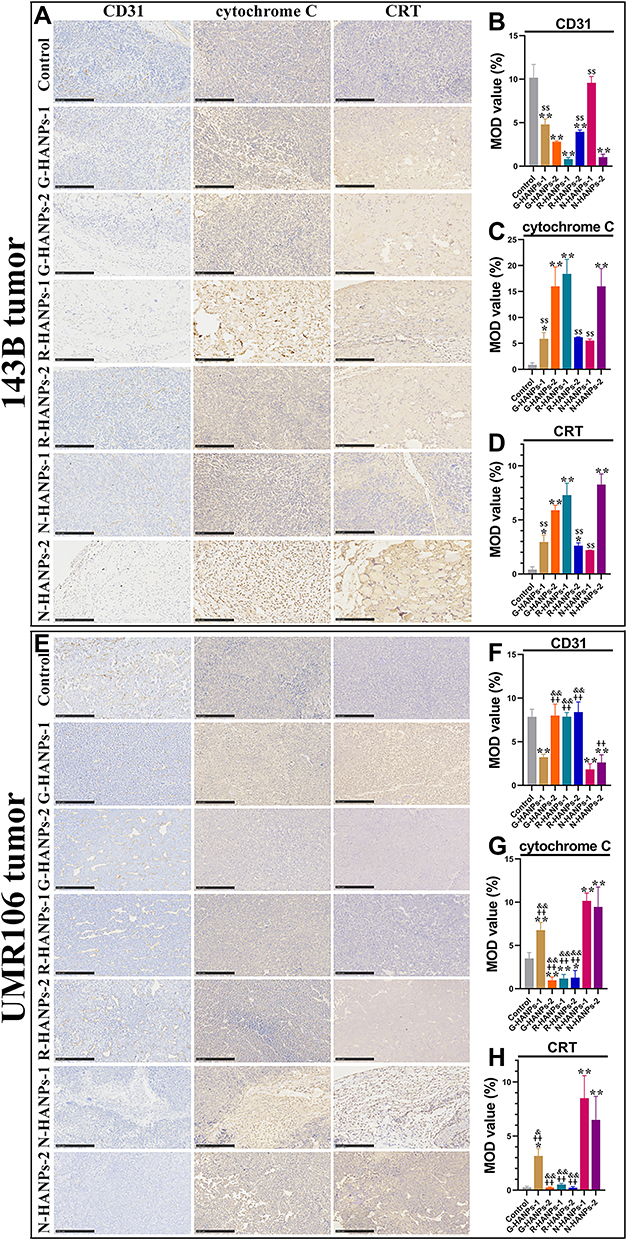 |
Figure 8 HANPs induced the apoptosis, inhibited the vascular differentiation and promoted CRT expression level in OS tumors. Immunohistochemical staining and semi-quantification of CD31, cytochrome C and CRT of the resected 143B tumor tissues (A-D) and UMR106 tumor tissues (E-H) at day 28 and 21, respectively (for 143B nude mice: vs control, *P<0.05, **P<0.01; vs R-HANPs-1, $$P<0.01; for UMR106 nude mice: vs control, *P<0.05, **P<0.01; vs N-HANPs-1, ++P<0.01; vs N-HANPs-2, &P<0.05, &&P<0.01, scale bar: 250 μm). |
In addition to verifying the biosafety of HANPs, H&E staining and hematological test were performed. The images from H&E staining indicated that the heart, liver, spleen, lung, and kidney of each mouse showed normal tissue morphology, and no obvious infiltrations of inflammatory cells (Figure S12). As shown in Tables S2 and S3, compared to the control group, HANPs treatment did not lead to any change for the levels of all the tested blood routine data or the blood calcium and blood phosphorus, and exhibited no damage to liver function (ALT and AST), kidney function (CREA and UREA) (Figure S13). The above results indicated that HANPs are safe for OS therapy in vivo.
Discussion
This study was proposed to investigate the activity of HANPs against OS. OS is a representative primary malignant bone tumor with bimodal age distribution and is common in children and adolescents.34 With advances in clinical surgical treatment and neoadjuvant chemotherapy, the mortality rates of patients decreased significantly and the prognosis improved.3 However, patients with recurrent or metastatic have a poor prognosis, with a 5-year survival rate lower than 20%.35 Nanotechnologies might be promising strategies for OS therapy. In recent years, HANPs exhibited excellent antitumor performance, and can prevent lung metastasis of tumor.14,24,25,36 Zhang et al found that HANPs could effectively inhibit tumor growth, prevent tumor metastasis and improve the survival rate of tumor-bearing rabbits.14 These studies suggested that HANPs might be potential nanomaterials to prevent the growth of OS.
The physicochemical properties (ie, morphology, size, crystallinity) of HANPs were pivotal for their activity against tumor cells. Motskin et al showed that rod-like HANPs had obvious advantages over spherical nanoparticles in cellular uptake.37 Li et al found that the rod-like HANPs with a crystallinity of 45.60% were the most prominent to suppress the growth of A375 and SK-MEL-28 melanoma cells among three types of HANPs with different morphology and crystallinity.24 This study demonstrated the crucial role of morphology of HANPs against OS. These HANPs had three kinds of morphologies, granular, rod-like and needle-like, and two particle sizes for each morphology, all of which showed great inhibitory effect on two OS cells. The anti-OS activity depended on the morphology, particle size as well as the cell line. Among the six HANPs, rod-like HANPs (R-HANPs) showed the best inhibitory activity on 143B cells, while needle-like HANPs (N-HANPs) inhibited the growth of UMR106 cells most efficiently. This result was further confirmed by using OS-bearing tumor mice model. We then demonstrated that the morphology of HANPs regulated the endocytosis of the particles in tumor cells. The endocytosis efficiency and the concentration of the particles correlated with their activity against tumor cells in vitro and in vivo.
It is interesting that the cells including tumor cells or normal cells showed different sensitivity to HANPs. Following 1-day incubation with HANPs, OS cell line 143B cells and MC3T3-E1 pre-osteoblast proliferated more than that without HANPs treatment, while the viability of another OS cell line UMR106 cells decreased. The toxicity of HANPs to 143B cells appeared after 3 days’ incubation while prolonged treatment of the particles did not show more toxicity to UMR106 cells. It has been reported that materials have different antitumor effects on different OS cell lines due to phenotypic and genetic differences among OS cell lines.38,39 The 143B cell line is a thymidine kinase-deficient and highly invasive human OS cell line.40 The UMR106 cell line is a transplantable rat OS clone cell line induced by injection of radioisotope phosphorus.32,41 The main application directions of these two cell lines are different. Generally, 143B cells were widely used in anti-OS studies in vitro or in vivo, while UMR106 cells were considered as osteoblasts, which are usually applied in osteogenic studies.42–46 Then we found HANPs selectively initiated the mitochondrial apoptosis by inducing the increase of ROS and mitochondria-related apoptotic genes, loss of mitochondrial membrane potential in both OS cells, but did not in MC3T3-E1 cells. This selective inhibition of tumor cells but not of normal cells such as MSC and HSF cells by HANPs was previously reported in some studies.14,25,36 Although the mechanism by which cells responded differently remains unknown, we speculated it might be due to their intrinsic regulation function between the tumor cells and normal cells such as particle-cell association, expression levels of inflammatory cytokines or stage of cell differentiation.47
Ca2+ is an important second messenger widely existing in various cells, which participates in and controls almost all life processes involving the proliferation and migration of tumor cells.48 A large amount of studies have found that imbalance of Ca2+ homeostasis may interfere with cell metabolism, leading to apoptosis.49–51 Yin et al found that Ca2+ released from curcumin and transferrin co-loaded CaO2 NPs further activated mitochondrial apoptotic signaling pathways in cell injury.51 HANPs is a weakly alkaline inorganic salt, which can dissolve and release certain Ca2+ and PO43- in an acidic lyso/endosome. It is reasonable that more HANPs in the cytoplasm might lead to increased intracellular Ca2+ load. However, a small part of the Ca2+ produced by its degradation can quickly enter the blood and be distributed to various organs and tissues of the body for metabolism through blood circulation, excreted from feces and urine mainly through liver and kidney. Most of the remaining Ca2+ can be deposited in bone tissue in the form of insoluble bone mineral salts, which did not participate in calcium metabolism and carry out calcium circulation through bone growth and remodeling.52 This may also be the reason why the addition of HANPs do not cause the increase of Ca2+ concentration in pre-osteoblasts. In the tumor cells, HANPs released large amounts of Ca2+ when HANPs were exposed to the acidic tumor microenvironment. The subsequent elevation of intracellular calcium activated mitochondria-related apoptosis pathways, caused cell damage and apoptosis.
Mitochondrial function plays an important role in tumorigenesis, metastasis, and chemotherapy resistance. During apoptosis, mitochondria release cytochrome C from the cytoplasm that activates the caspase pathway in tumor cells.53 Cytochrome c is primarily known for its function for ATP synthesis in the mitochondria.54 As a pro-apoptotic protein, Bax can also promote mitochondrial cytochrome C releases and induce caspase cascade reaction. Meanwhile, the ROS level in cells increased, resulting in DNA damage that can activate p53 expression and induce apoptosis.55,56 Mitochondrial apoptosis pathways include endogenous caspase-9 apoptosis pathways activated by mitochondrial injury and exogenous caspase-8 apoptosis pathways activated by recruitment of death-inducing signal complexes.31–33 Interestingly, based on PCR results, we found that caspase-8 gene expression was higher than caspase-9 in 143B and UMR106 cells treated with the six HANPs. Therefore, these results suggested HANPs brought exogenous damage to the cells. Cyclin D1 is an important G1/S specific Cyclin. Mutation, amplification or overexpression of Cyclin D1 can change the cell cycle process in a variety of tumors and may lead to tumorigenesis.59,60 Cyclin D1 thus serves as an important target for cancer treatments.57,58 In this study, we further found HANPs downregulated the expression of Cyclin D1, which may potentially result in the reduction of the tumors.
Moreover, we observed the up-regulation of calreticulin (CRT) in HANPs-treated tumor cells CRT is one of the major calcium-binding proteins in the endoplasmic reticulum in the immune cells to cause immunogenic cell death (ICD) in the body.61–63 The ICD effect induced the release of “danger signals” that elicited the innate immune response in mice. The impact of HANPs on induction of immune response against tumor cells will be explored in the following work. Additionally, we demonstrated that HANPs could not cause organic lesions and inflammatory reactions in organs, which is consistent with previous studies that showed HANPs generally had little inhibitory effect on normal tissue cells, or even promoted the proliferation of normal cells.14,24,25 Hence, our results preliminarily confirmed that HANPs had excellent anti-OS performance and good biosafety. Given the selective inhibition of tumor cells but not of normal cells, HANPs are good candidate nanomaterials for OS therapy in clinic.
Conclusion
In summary, the prepared six kinds of HANPs selectively inhibited the growth of OS cells in vitro and in vivo by selectively inducing the increased intracellular calcium and mitochondrial apoptosis in the OS tumor cells but not in the mouse pre-osteoblast. The anti-OS activity of HANPs was associated with the morphology, and concentration of the particles, as well as the OS cell lines. Among the six HANPs, rod-like HANPs (R-HANPs) showed the best inhibitory activity on 143B cells, while needle-like HANPs (N-HANPs) had inhibited the growth of UMR106 cells most efficiently. The inhibition activity of HANPs against OS also involved the endocytosis efficiency of the particles, and their ability to drive oxidative damage and ICD of the tumor cells. Additionally, HANPs showed no obvious systemic toxicity to the mice. Therefore, this work confirmed that HANPs were safe and effective for OS therapy and underlined the crucial roles of particle morphology and the cell source in determining the antitumor activity of the particles. This work directs the rational design of nanoparticles for tumor therapy. Since the ICD effect was observed by the introduction of HANPs, the follow-up study will focus on how the particles regulate the tumor immune microenvironment.
Acknowledgments
This work was supported by National Key Research and Development Program of China (grant No. 2017YFB0702600), Sichuan Science and Technology Program (grant No. 2020YFS0039), National Natural Science Foundation of China (grant No. 81901685) and the Fundamental Research Funds for the Central Universities (grant No. YJ201915).
Disclosure
The authors report no conflicts of interest in this work.
References
1. Saraf AJ, Fenger JM, Roberts RD. Osteosarcoma: accelerating progress makes for a hopeful future. Front Oncol. 2018;8:8. doi:10.3389/fonc.2018.00008
2. Noone A-M, Cronin KA, Altekruse SF, et al. Cancer Incidence and survival trends by subtype using data from the Surveillance Epidemiology and End Results Program, 1992-2013. Cancer Epidemiol Biomarkers Prevention. 2017;26(4):632–641. doi:10.1158/1055-9965.EPI-16-0520
3. Isakoff MS, Bielack SS, Meltzer P, Gorlick R. Osteosarcoma: current treatment and a collaborative pathway to success. J Clin Oncol. 2015;33(27):3029–U3127. doi:10.1200/JCO.2014.59.4895
4. Cao J, Han X, Qi X, Jin X, Li X. TUG1 promotes osteosarcoma tumorigenesis by upregulating EZH2 expression via mild-144-3p. Int J Oncol. 2017;51(4):1115–1123. doi:10.3892/ijo.2017.4110
5. Zhu K-P, Zhang C-L, Ma X-L, Hu J-P, Cai T, Zhang L. Analyzing the interactions of mRNAs and ncRNAs to predict competing endogenous RNA networks in osteosarcoma chemo-resistance. Molecular Therapy. 2019;27(3):518–530. doi:10.1016/j.ymthe.2019.01.001
6. Wu Y, Xie Z, Chen J, et al. Circular RNA circTADA2A promotes osteosarcoma progression and metastasis by sponging miR-203a-3p and regulating CREB3 expression. Mol Cancer. 2019;18(1):18. doi:10.1186/s12943-019-0948-8
7. Mirabello L, Zhu B, Koster R, et al. Frequency of pathogenic germline variants in cancer-susceptibility genes in patients with osteosarcoma. JAMA Oncol. 2020;6(5):724–734. doi:10.1001/jamaoncol.2020.0197
8. Campbell BB, Light N, Fabrizio D, et al. Comprehensive analysis of hypermutation in human cancer. Cell. 2017;171(5):
9. Liao Y, Chen L, Feng Y, et al. Targeting programmed cell death ligand 1 by CRISPR/Cas9 in osteosarcoma cells. Oncotarget. 2017;8(18):30276–30287. doi:10.18632/oncotarget.16326
10. Weigel B, Malempati S, Reid JM, et al. Phase 2 trial of cixutumumab in children, adolescents, and young adults with refractory solid tumors: a report from the Children’s Oncology Group. Pediatr Blood Cancer. 2014;61(3):452–456. doi:10.1002/pbc.24605
11. Pappo AS, Vassal G, Crowley JJ, et al. A Phase 2 Trial of R1507, a monoclonal antibody to the insulin-like growth factor-1 receptor (IGF-1R), in patients with recurrent or refractory rhabdomyosarcoma, osteosarcoma, synovial sarcoma, and other soft tissue sarcomas results of a sarcoma alliance for research through collaboration study. Cancer. 2014;120(16):2448–2456. doi:10.1002/cncr.28728
12. Zhu Y, Wu J, Chen M, et al. Recent advances in the biotoxicity of metal oxide nanoparticles: impacts on plants, animals and microorganisms. Chemosphere. 2019;2:237.
13. Rana A, Yadav K, Jagadevan S. A comprehensive review on green synthesis of nature-inspired metal nanoparticles: mechanism, application and toxicity. J Clean Prod. 2020;1:272.
14. Zhang K, Zhou Y, Xiao C, et al. Application of hydroxyapatite nanoparticles in tumor-associated bone segmental defect. Sci Adv. 2019;5(8). doi:10.1126/sciadv.aax6946.
15. Quan H, He Y, Sun J, et al. Chemical self-assembly of multifunctional hydroxyapatite with a coral-like nanostructure for osteoporotic bone reconstruction. ACS Appl Mater Interfaces. 2018;10(30):25547–25560. doi:10.1021/acsami.8b09879
16. Fu Z, Cui J, Zhao B, Shen SGF, Lin K. An overview of polyester/hydroxyapatite composites for bone tissue repairing. J Orthopaedic Translation. 2021;28:118–130. doi:10.1016/j.jot.2021.02.005
17. Lee W-H, Loo C-Y, Rohanizadeh R. Functionalizing the surface of hydroxyapatite drug carrier with carboxylic acid groups to modulate the loading and release of curcumin nanoparticles. Materials Sci Eng C-Materials Biol. 2019;99:929–939. doi:10.1016/j.msec.2019.02.030
18. Dong X, Sun Y, Li Y, et al. Synergistic combination of bioactive hydroxyapatite nanoparticles and the chemotherapeutic doxorubicin to overcome tumor multidrug resistance. Small. 2021;17(18):2007672. doi:10.1002/smll.202007672
19. Munir MU, Ihsan A, Javed I, et al. Controllably biodegradable hydroxyapatite nanostructures for cefazolin delivery against antibacterial resistance. ACS Omega. 2019;4(4):7524–7532. doi:10.1021/acsomega.9b00541
20. Munir MU, Ihsan A, Sarwar Y, et al. Hollow mesoporous hydroxyapatite nanostructures; smart nanocarriers with high drug loading and controlled releasing features. Int J Pharm. 2018;544(1):112–120. doi:10.1016/j.ijpharm.2018.04.029
21. Munir MU, Salman S, Ihsan A, Elsaman T. Synthesis, characterization, functionalization and bio-applications of hydroxyapatite nanomaterials: an overview. Int J Nanomedicine. 2022;17:1903. doi:10.2147/IJN.S360670
22. Munir MU, Salman S, Javed I, et al. Nano-hydroxyapatite as a delivery system: overview and advancements. Artif Cells, Nanomed Biotechnol. 2021;49(1):717–727. doi:10.1080/21691401.2021.2016785
23. Li X, Wang Y, Chen Y, et al. Hierarchically constructed selenium-doped bone-mimetic nanoparticles promote ROS-mediated autophagy and apoptosis for bone tumor inhibition. Biomaterials. 2020;2:257.
24. Li Z, Tang J, Wu H, et al. A systematic assessment of hydroxyapatite nanoparticles used in the treatment of melanoma. Nano Res. 2020;13(8):2106–2117. doi:10.1007/s12274-020-2817-6
25. Wu H, Li Z, Tang J, et al. The in vitro and in vivo anti-melanoma effects of hydroxyapatite nanoparticles: influences of material factors. Int J Nanomedicine. 2019;14:1177–1191. doi:10.2147/IJN.S184792
26. Aoki H, Ohgaki M, Kano S. Effects of Adriacin-absorbing hydroxyapatite-sol on Ca-9 cell growth. J Med. 1993;27(1):39–44.
27. Setyawati MI, Tay CY, Chia SL, et al. Titanium dioxide nanomaterials cause endothelial cell leakiness by disrupting the homophilic interaction of VE-cadherin. Nat Commun. 2013;4:854.
28. Tomayko MM, Reynolds CP. Determination of subcutaneous tumor size in athymic (nude) mice. Cancer Chemother Pharmacol. 1989;24(3):148–154. doi:10.1007/BF00300234
29. Kruiswijk F, Labuschagne CF, Vousden KH. p53 in survival, death and metabolic health: a lifeguard with a licence to kill. Nat Rev Mol Cell Biol. 2015;16(7):393–405. doi:10.1038/nrm4007
30. Tay CY, Fang W, Setyawati MI, et al. Nano-hydroxyapatite and nano-titanium dioxide exhibit different subcellular distribution and apoptotic profile in human oral epithelium. ACS Appl Mater Interfaces. 2014;6(9):6248–6256. doi:10.1021/am501266a
31. Yuan Y, Liu C, Qjan J, Wang J, Zhang Y. Size-mediated cytotoxicity and apoptosis of hydroxyapatite nanoparticles in human hepatoma HepG2 cells. Biomaterials. 2010;31(4):730–740. doi:10.1016/j.biomaterials.2009.09.088
32. Vandenabeele P, Galluzzi L, Vanden Berghe T, Kroemer G. Molecular mechanisms of necroptosis: an ordered cellular explosion. Nat Rev Mol Cell Biol. 2010;11(10):700–714. doi:10.1038/nrm2970
33. Wang Y, Wang J, Hao H, et al. In vitro and in vivo mechanism of bone tumor inhibition by selenium-doped bone mineral nanoparticles. ACS Nano. 2016;10(11):9927–9937. doi:10.1021/acsnano.6b03835
34. Raimondi L, De Luca A, Gallo A, et al. Osteosarcoma cell-derived exosomes affect tumor microenvironment by specific packaging of microRNAs. Carcinogenesis. 2020;41(5):666–677. doi:10.1093/carcin/bgz130
35. Luetke A, Meyers PA, Lewis I, Juergens H. Osteosarcoma treatment–where do we stand? A State Art Review. 2014;40(4):523–532.
36. Zhao H, Wu C, Gao D, et al. Antitumor effect by hydroxyapatite nanospheres: activation of mitochondria dependent apoptosis and negative regulation of phosphatidylinositol-3-kinase/protein kinase B pathway. Acs Nano. 2018;12(8):7838–7854. doi:10.1021/acsnano.8b01996
37. Motskin M, Wright DM, Muller K, et al. Hydroxyapatite nano and microparticles: correlation of particle properties with cytotoxicity and biostability. Biomaterials. 2009;30(19):3307–3317. doi:10.1016/j.biomaterials.2009.02.044
38. Park YB, Park MJ, Kimura K, Shimizu K, Lee SH, Yokota J. Alterations in the INK4a/ARF locus and their effects on the growth of human osteosarcoma cell lines. Cancer Genet Cytogenet. 2002;133(2):105–111. doi:10.1016/S0165-4608(01)00575-1
39. Hansen MF. Genetic and molecular aspects of osteosarcoma. J Musculoskelet Neuronal Interact. 2002;2(6):554–560.
40. Chen Z, Wu J, Guo Q. Actein inhibits cell proliferation and migration in human osteosarcoma. Med Sci Monitor. 2016;22:1609–1616. doi:10.12659/MSM.898483
41. Martin TJ, Ingleton PM, Underwood JCE, Michelangeli VP, Hunt NH, Melick RA. Parathyroid hormone-responsive adenylate-cyclase in induced transplantable osteogenic rat sarcoma. Nature. 1976;260(5550):436–438. doi:10.1038/260436a0
42. Hagi T, Nakamura T, Kita K, Iino T, Asanuma K, Sudo A. Anti-tumour effect of tocilizumab for osteosarcoma cell lines. Bone Joint Res. 2020;9(11):821–826. doi:10.1302/2046-3758.911.BJR-2020-0123.R1
43. Lu PW-A, Lin R-C, Yang J-S, et al. GO-Y078, a curcumin analog, induces both apoptotic pathways in human osteosarcoma cells via activation of JNK and p38 signaling. Pharmaceuticals. 2021;14(6):497. doi:10.3390/ph14060497
44. Duan -D-D, Xie H, Shi H-F, et al. Hint1 overexpression inhibits the cell cycle and induces cell apoptosis in human osteosarcoma cells. Onco Targets Ther. 2020;13:8223–8232. doi:10.2147/OTT.S242344
45. Carrillo-Lopez N, Panizo S, Alonso-Montes C, et al. Direct inhibition of osteoblastic Wnt pathway by fibroblast growth factor 23 contributes to bone loss in chronic kidney disease. Kidney Int. 2016;90(1):77–89. doi:10.1016/j.kint.2016.01.024
46. Feger M, Hase P, Zhang B, et al. The production of fibroblast growth factor 23 is controlled by TGF-β2. Int J Med. 2017;7(1):1–7.
47. Zhao X, Ng S, Heng BC, et al. Cytotoxicity of hydroxyapatite nanoparticles is shape and cell dependent. Arch Toxicol. 2013;87(6):1037–1052. doi:10.1007/s00204-012-0827-1
48. An J, Zhang K, Wang B, et al. Nanoenabled disruption of multiple barriers in antigen cross-presentation of dendritic cells via calcium interference for enhanced chemo-immunotherapy. Acs Nano. 2020;14(6):7639–7650. doi:10.1021/acsnano.0c03881
49. Lin L-S, Huang T, Song J, et al. Synthesis of copper peroxide nanodots for H2O2 self-supplying chemodynamic therapy. J Am Chem Soc. 2019;141(25):9937–9945. doi:10.1021/jacs.9b03457
50. Marchi S, Patergnani S, Missiroli S, et al. Mitochondrial and endoplasmic reticulum calcium homeostasis and cell death. Cell Calcium. 2018;69:62–72. doi:10.1016/j.ceca.2017.05.003
51. Yin Y, Jiang T, Hao Y, et al. Cascade catalytic nanoplatform based on ions interference strategy for calcium overload therapy and ferroptosis. Int J Pharm. 2021;606.
52. Menendez-Proupin E, Cervantes-Rodriguez S, Osorio-Pulgar R, Franco-Cisterna M, Camacho-Montes H, Fuentes ME. Computer simulation of elastic constants of hydroxyapatite and fluorapatite. J Mech Behav Biomed Mater. 2011;4(7):1011–1020. doi:10.1016/j.jmbbm.2011.03.001
53. Huang S-T, Bi K-W, Kuo H-M, et al. Phyllanthus urinaria induces mitochondrial dysfunction in human osteosarcoma 143B cells associated with modulation of mitochondrial fission/fusion proteins. Mitochondrion. 2014;17:22–33. doi:10.1016/j.mito.2014.05.002
54. Xu Z, Liu C, Wei J, Sun J. Effects of four types of hydroxyapatite nanoparticles with different nanocrystal morphologies and sizes on apoptosis in rat osteoblasts. J Applied Toxicol. 2012;32(6):429–435. doi:10.1002/jat.1745
55. Garg AD, Dudek AM, Ferreira GB, et al. ROS-induced autophagy in cancer cells assists in evasion from determinants of immunogenic cell death. Autophagy. 2013;9(9):1292–1307. doi:10.4161/auto.25399
56. Feng Y, Clayton J, Yake W, et al. Resveratrol derivative, Trans-3, 5, 4 ‘-trimethoxystilbene sensitizes osteosarcoma cells to apoptosis via ROS-induced caspases activation. Oxid Med Cell Longev. 2021;2021:849.
57. Mortezaee K, Salehi E, Mirtavoos-mahyari H, et al. Mechanisms of apoptosis modulation by curcumin: implications for cancer therapy. J Cell Physiol. 2019;234(8):12537–12550. doi:10.1002/jcp.28122
58. Chohan TA, Qayyum A, Rehman K, Tariq M, Akash MSH. An insight into the emerging role of cyclin-dependent kinase inhibitors as potential therapeutic agents for the treatment of advanced cancers. Biomed Pharmacother. 2018;107:1326–1341. doi:10.1016/j.biopha.2018.08.116
59. Liu L, Zhang H, Shi L, et al. Inhibition of Rac1 activity induces G1/S phase arrest through the GSK3/cyclin D1 pathway in human cancer cells. Oncol Rep. 2014;32(4):1395–1400. doi:10.3892/or.2014.3388
60. Azevedo-Barbosa H, Ferreira-Silva GA, Silva CF, et al. Phenylpropanoid-based sulfonamide promotes cyclin D1 and cyclin E down-regulation and induces cell cycle arrest at G1/S transition in estrogen positive MCF-7 cell line. Toxicol Vitro. 2019;59:150–160. doi:10.1016/j.tiv.2019.04.023
61. Dai Z, Tang J, Gu Z, et al. Eliciting immunogenic cell death via a unitized nanoinducer. Nano Lett. 2020;20(9):6246–6254. doi:10.1021/acs.nanolett.0c00713
62. Galluzzi L, Buque A, Kepp O, Zitvogel L, Kroemer G. Immunogenic cell death in cancer and infectious disease. Nat Rev Immunol. 2017;17(2):97–111. doi:10.1038/nri.2016.107
63. Yang S, Shim MK, Kim WJ, et al. Cancer-activated doxorubicin prodrug nanoparticles induce preferential immune response with minimal doxorubicin-related toxicity. Biomaterials. 2021;2:272.
 © 2022 The Author(s). This work is published and licensed by Dove Medical Press Limited. The full terms of this license are available at https://www.dovepress.com/terms.php and incorporate the Creative Commons Attribution - Non Commercial (unported, v3.0) License.
By accessing the work you hereby accept the Terms. Non-commercial uses of the work are permitted without any further permission from Dove Medical Press Limited, provided the work is properly attributed. For permission for commercial use of this work, please see paragraphs 4.2 and 5 of our Terms.
© 2022 The Author(s). This work is published and licensed by Dove Medical Press Limited. The full terms of this license are available at https://www.dovepress.com/terms.php and incorporate the Creative Commons Attribution - Non Commercial (unported, v3.0) License.
By accessing the work you hereby accept the Terms. Non-commercial uses of the work are permitted without any further permission from Dove Medical Press Limited, provided the work is properly attributed. For permission for commercial use of this work, please see paragraphs 4.2 and 5 of our Terms.