Back to Journals » Journal of Multidisciplinary Healthcare » Volume 16
A Scale Development for Visual Literacy on Health Students and Professionals
Received 10 June 2023
Accepted for publication 25 September 2023
Published 25 October 2023 Volume 2023:16 Pages 3129—3141
DOI https://doi.org/10.2147/JMDH.S416196
Checked for plagiarism Yes
Review by Single anonymous peer review
Peer reviewer comments 2
Editor who approved publication: Dr Scott Fraser
Ya-Huei Wang,1,2 Hung-Chang Liao3,4
1Department of Applied Foreign Languages, Chung Shan Medical University, Taichung, Taiwan; 2Department of Medical Education, Chung Shan Medical University Hospital, Taichung, Taiwan; 3Department of Health Policy and Management, Chung Shan Medical University, Taichung, Taiwan; 4Department of Medical Management, Chung Shan Medical University Hospital, Taichung, Taiwan
Correspondence: Hung-Chang Liao, Department of Health Policy and Management, Chung Shan Medical University, No. 110, Sec. 1, Jianguo N. Road, Taichung, Taiwan, Tel +886-4-2473-0022 (ext. 12125), Email [email protected]
Objective: Viewing that there is a lack of valid and reliable measures to assess visual literacy in clinical and healthcare settings, this study aimed to develop a visual literacy scale to assess health students’ and professionals’ visual literacy, by which teachers can further help them sharpen their visual literacy skills and sensitivity to let them reach effective communication in clinical and healthcare settings.
Methods: The scale was constructed according to Slavec and Drnovšek’s three-phase scale development process: theoretical significance and existence of the scale construct, representative data collection and appropriate data collection methods, and statistical analysis of data collection and statistical evidence of the scale construct. To investigate the psychometrical properties, the researchers first performed a pilot study on randomly selected 464 health students and professionals, using exploratory factor analysis (EFA) with SPSS to derive the hidden factor structure, and then on randomly selected 303 participants, using confirmatory factor analysis (CFA) with AMOS to validate the derived factor structure. Internal consistency, convergent validities, discriminant validities, and goodness-of-fit indices were also examined in the study.
Results: After going through the EFA, 30 items in three factors were identified: “allegorical meaning” (12 items), “explicit meaning” (10 items), and “symbolic meaning” (8 items). The three factors explained 73.191 of the total variance. The CFA generated the same three factors and 22 items: “allegorical meaning” (12 items), “explicit meaning” (4 items), and “symbolic meaning” (6 items). The three factors accounted for 75.022% of variance. Both the EFA and CFA models demonstrated satisfactory goodness-of-fit and good convergent and discriminant validities. Regarding the reliabilities, the Cronbach’s alpha values in the EFA and CFA models were all above 0.90.
Conclusion: The findings have demonstrated that the VLS-HSP can be a formal instrument to measure visual literacy on health students and professionals.
Keywords: humanistic professional awareness, healthcare students and providers, scale development, psychometric properties
Introduction
Effective communication between patients and health professionals involves using all the senses, as well as written texts, to see beyond the disease and to interpret from patients’ facial expression or body languages to realize their suffering. In other words, health professionals should respect the patient as a whole person with humanness, not as the symptoms of sickness.1 Therefore, in order to have effective communication with patients and their families, health professionals should equip themselves with observation ability and visual literacy to read the interactive meanings of images. However, it is not an easy way to read images.
With the rapid advancement of the Internet and audiovisual media, visual images have become an indispensable tool of communication today. However, some visual images conceal many ideologies and messages hidden in the images, which may not be perceived by students. Debes2 first introduced the term “visual literacy” in 1968 as a set of visual abilities to observe and integrate other sensory experiences to develop visual abilities. Visually literate people are able to identify and understand not only visible actions and objects, but also symbols encountered. Moreover, they are able to understand, appreciate, and communicate with others through visual images. The International Visual Literacy Association (IVLA)3 gave a brief definition to visual literacy, saying that visual literacy is the ability to realize and generate visual information. The process of understanding and generating visual images actually includes two parts: decoding and encoding. One is the ability to capture or read (decode) meaningful verbal messages from images, and the other is the ability to use design elements (lines, shapes, colors, and proportions) to generate visual communication, in order to convey (encode) messages through external forms and symbols.4
Because visual literacy involves the ability to generate meaning from visual images (ie decode) and to synthesize meaningful visual images (ie encode),5 it demands a series of competencies to let people discover, interpret, assess, use, and create images and visual aids efficiently. In health and medical care, with visual literacy, health and medical care students and professionals may use the decoding and encoding techniques to figure out the messages patients intend to express. If patients are embarrassed, fearful, or reluctant to consult doctors or other health professionals, such patients may withhold providing information to professionals.6 However, with the presence of facial expressions, body language, and emotional features, such as visual cues, health professionals can take these nonverbal cues as visual images to figure out the intended meaning, which thus helps them decide what they can do to care for their patients.7 Moreover, when patients are in a coma or in a state of intoxication, they may fail to express their ill symptoms to health professionals. However, with visual literacy, professionals can observe patients’ emotion, body languages, or facial expressions, such as pallor, perspiration, erythema, as nonverbal cues to provide patients in-time healthcare.8 As Katz and Khoshbin9 indicated, visual literacy can improve health professionals’ diagnostic skills and empathy with patients, along with their intellectual inquisitiveness and critical thinking.
In other words, in medical and health care, visual literacy skills, along with observation skills, can be particularly useful for visual-oriented professionals, such as dermatologists and radiologists, who use pattern recognition and visual literacy skills to identify and read visual images in physical examination results and associate them with a given diagnosis. With visual literacy, dermatologists can be skilled in pattern recognition to diagnose dermatologic conditions and identify subtle differences in test results. Likewise, radiologists need visual literacy skills when examining various imaging modes.10 With no acquisition of visual literacy, it would be difficult to read the visual information derived from visual images or a sequence of visual images. On the surface, it would seem that visual images, in a sequence of panels, are easy to understand. Readers/spectators may think that these sequential images are only but a presentation (narrative) of certain events (meaning), ignoring the potential complexity of narrative storytelling functions of visual images.11 From the perspective of linguistic and cognitive sciences, visual narratives involve more than the sequences of images and have greater complexity in encoding/decoding than widely assumed.12,13 However, not much research has addressed how to comprehend the structure of the visual images.
Given that the training and acquisition of visual literacy skills for health students and professionals can help them improve visual diagnostic skills, clinical observation skills, and interprofessional communication,14,15 there is a need to teach visual literacy in medical and healthcare education and design instruments to measure visual literacy in the clinical and healthcare settings. However, there is a lack of valid and reliable measures to assess visual literacy in Taiwanese clinical and healthcare settings. Therefore, it is necessary to develop a visual literacy scale to assess the level of visual literacy on health students and professionals; then, teachers can realize their visual literacy and hence design appropriate teaching strategies to help them increase their visual literacy. The objective of the research was to construct a visual literacy scale for health students and professionals in Taiwanese cultural backgrounds, by which teachers can further help them sharpen their visual literacy skills and sensitivity to let them reach effective communication in clinical and healthcare settings.
Methodology
Procedure and Participants
The study was proved by the Institutional Review Board of Chung Shan Medical University Hospital (CSMUH No:CS2-20198, dated March 30, 2021). The time frame was from August 1, 2021 to July 31, 2022. The participants were recruited on site in medical universities and hospitals. Informed consent from the study participants was obtained before the start of the study. The scale was constructed according to Slavec and Drnovšek’s16 three-phase and 10-step scale development process: theoretical significance and existence of the scale construct (Phase 1), representative data collection and appropriate data collection methods (Phase 2), and statistical analysis of data collection and statistical evidence of the scale construct (Phase 3). Phase 1 involved literature review and interviews (Step 1), scale items generation (Step 2), and evaluation of content validity (Step 3). Phase 2 involved scale development and evaluation (Step 4), scale translation and back-translation (Step 5), a pilot study (Step 6), and sampling and data collection (Step 7). Phase 3 involved examinations of dimensionality (Step 8), reliability (Step 9), and construct validity (Step 10). The more detailed description of Slavec and Drnovšek’ scale development process is shown in Figure 1.
 |
Figure 1 Slavec and Drnovšek’ scale development process. |
Following a thorough review of literature, primarily in the following databases: ScienceDirect, PubMed, EBSCO, and ProQuest, with the search terms of visual literacy, visual images, visual literacy skills, observation skills, visual viewing skills, critical viewing skills, visual arts, etc., the researchers collected 76 items related to visual literacy. The researchers then held a panel discussion to examine whether these items addressed the theoretical concept.17 The expert panel included three professors with more than fifteen years of expertise in medical humanities, social sciences, health education, and psychometrics. They reviewed and rated 76 items on a 6-point scale (0–5) for their relevance to the constructs (0 = extremely irrelevant; 5 = extremely relevant). Items rated below 4 were removed, and items on which the experts failed to reach consensus were discarded. Thus, after the panel discussed the items on the visual literacy scale, the 76 items on the 9-point Likert scale were reduced to 45 items (9: always; 1: never). The higher the score, the higher the visual literacy of the participants.
Moreover, as a priori hypothetical model, the 45 items were initially divided into three categories: “explicit meaning”, “symbolic meaning”, and “allegorical meaning”. The term “explicit meaning” referred to the literal or denotative meaning of a text or a discourse. The term “symbolic meaning” referred to an object, a person, or a place that represents an abstract idea that goes beyond its literal meaning. The term “allegorical meaning” referred to a story, fable, drama, or picture in which the characters and events represented moral, religious, historical, or political implications. Afterwards, the researchers translated the 45 scale items into Chinese, and back translated them into English, with two bilingual English instructors checking the semantic equivalence of the scale items to verify content and face validities.18 Following panel discussions, the researchers first performed a pilot study on randomly selected 464 health students and professionals, using exploratory factor analysis (EFA) to derive the hidden factor structure, and then on randomly selected 303 participants, using confirmatory factor analysis (CFA) to validate the derived factor structure. The selection criteria for participants were those health professionals or students studying at medical universities or colleges. However, for those who studied in medical universities or colleges but whose specialization was not related to health or medical disciplines, they were excluded.
Data Analysis
The researchers first conducted an exploratory factor analysis (EFA), using SPSS (version 14.0),19 on 464 participants and later a confirmatory factor analysis (CFA), using AMOS (version 24.00),20 on 303 participants to derive a potential factor structure and validate the factor structure. Also, eigenvalues, principal component analysis (PCA), promax rotation were taken to elicit the factor structure. The researchers also used the Kaiser–Meyer–Olkin test (KMO)21,22 and Bartlett’s sphericity test23,24 to check whether the sample size was big enough for factor analysis.25 Besides, the researchers used various model fit indices to check the goodness-of-fit of the EFA model (30-item scale) and that of CFA model (22-item model), in terms of χ2∕df ratio,26 Tucker Lewis Index (TLI),27 comparative fit index (CFI),27 and root mean square error of approximation (RMSEA).26 Further, the convergent and discriminant validities of the scale and Cronbach’s alphas and composite alphas were also tested.28,29
Results
EFA for the VLS-HSP Scale
To check psychometrical properties of the VLS-HSP scale, the researchers first adopted EFA on 464 participants to derive the potential factor structure of the VLS-HSP scale. Among the 464 valid participants, 298 participants (64.22%) were female, and 166 participants (35.78%) were male. A total of 305 participants (65.73%) were aged between 19 and 25, 32 participants (6.90%) aged between 26 and 32, 72 participants (15.52%) aged between 33 and 39, 46 participants (9.91%) aged between 40 and 46, and 9 participants (1.94%) aged 47 or above. Among these participants, 130 participants (28.02%) were health professionals, and 334 participants (71.98%) were health students. The participants’ demographic characteristics are displayed Table 1.
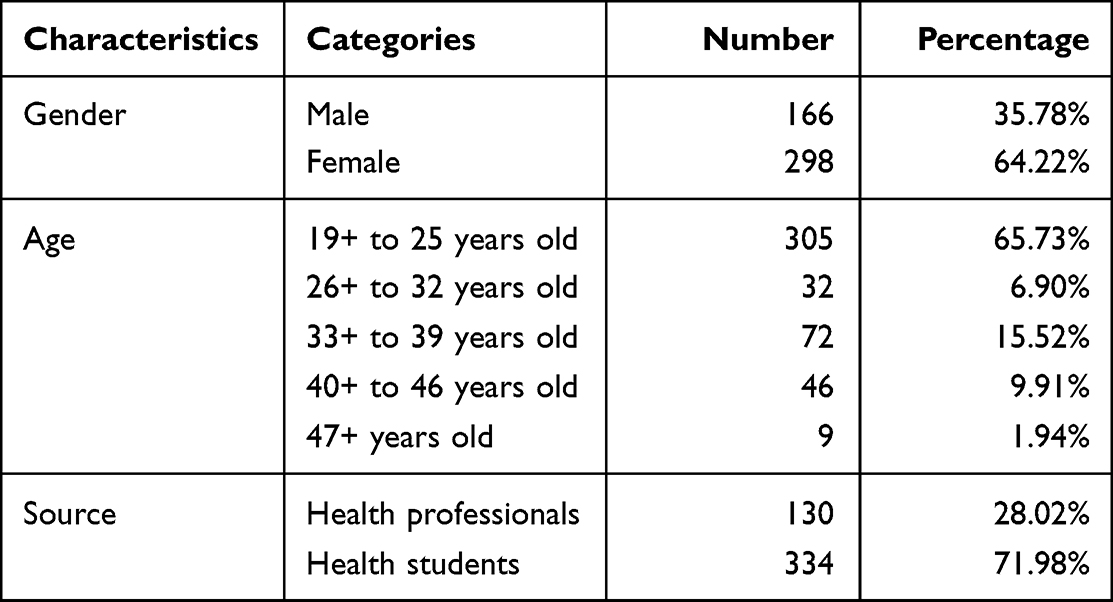 |
Table 1 Participants’ Demographic Characteristics- EFA |
KMO Test and Bartlett’s Test of Sphericity
While using the KMO test21,22 and Bartlett’s test of sphericity23,24 to check whether the sample size was big enough for factor analysis,25 the researcher found that the KMO test and Bartlett’s test of sphericity proved the appropriateness of the sample size for factor analysis,25 with the KMO value (0.976) superior to the critical value 0.630,31 and Bartlett’s test of sphericity being significant (p = 0.000 < 0.05; approx. chi-square = 14,511.104; degree of freedom = 435). The scree-plot graphic (see Figure 2) suggested that there was an optimal three-factor solution for the VLS-HSP scale factors.
 |
Figure 2 Scree plot for factor analysis of the VLS-HSP. |
30-Items EFA Model
As mentioned, the researchers adopted EFA, to derive and validate the consistency of the scale factors. Also, eigenvalues (with values >1.0) and PCA were used to confirm the internal consistency and construct validity of the VLS-HSP scale.32 In addition, to maximize high item loading values and minimize low item loading values, promax rotation (an oblique rotation method) was applied to produce more correlated construct structures.33
Moreover, in accordance with Hair et al’s28 factor structure criteria, an acceptable factor loading value should be higher than 0.5; a value equal to or higher than 0.70 is regarded as good to explain variables. Thus, in the study, if the factor loadings were bigger than 0.50 for the relevant factors, and less than 0. 50 for the non-relevant factors, then the items were kept. After going through the EFA and PCA, three factors with 30 items were identified: “allegorical meaning” (12 items), “explicit meaning” (10 items), and “symbolic meaning” (8 items). The three factors remained in the VLS-HSP accounted for 73.191% of variance, with the eigenvalues all larger than one: 18.248, 2.645, and 1.064 (as shown in Table 2).
 |
Table 2 Factor Loadings, Cronbach’s α, and Eigenvalues of the 30-Items EFA Model |
Validity and Reliability Examination of the 30-Item EFA Model
As mentioned, the researchers translated the initial 45 scale items into Chinese version and back translated into English, with two bilingual English instructors checking the semantic equivalence of the scale items to verify content and face validities.18 Afterwards, the researchers had three college students read and answered the scale item to ensure clarity.
To check the internal consistency of responses in the multi-item VLS-HSP scale, the researchers calculated the Cronbach’s alpha26,27 to check the coherence of the constructs, with Cronbach’s alpha 0.70 as acceptable and 0.8 or greater as preferable.34 After the Cronbach’s alpha examination, the statistic results showed that the Cronbach’s alpha for the VLS-HSP scale was 0.978, with the Cronbach’s alphas 0.969, 0.948, and 0.953 for the subscales “allegorical meaning”, “explicit meaning”, and “symbolic meaning”, respectively (see Table 2).
Descriptive Statistics of the 30-Items EFA Model
The item descriptions, means, and standard deviations of the 30-items EFA model are shown as Table 3.
 |
Table 3 Item Descriptions, Means, and Standard Deviations of the 30-Items EFA Model |
CFA for the VLS-HSP Scale
After the application of EFA, to determine the structure of potential factors of the VLS-HSP scale, the initial 45 items were reduced to 30 items in consideration of three factors. To further examine the derived factor structure, the researchers adopted the CFA to evaluate the structure of potential factors of the VLS-HSP scale from the 303 participants.
Of the 303 valid participants, 197 participants (65.02%) were female and 106 participants (34.98%) were male. A total of 183 participants (60.40%) aged between 19 and 25; 29 participants (9.57%) aged between 26 and 32; 52 participants (17.16%) aged between 33 and 39; 33 participants (10.89%) aged between 40 and 46, and 6 participants (1.98%) aged 47 or above. Among these participants, 64 participants (21.12%) were health professionals, 239 participants (78.88%) were health students. The participants’ demographic characteristics are displayed Table 4.
 |
Table 4 Participants’ Demographic Characteristics- CFA |
Using the AMOS,20 the CFA obtained the same three factors and 22 items, without removing any items in factor 1 (allegorical meaning), but removing 6 items in factor 2 (explicit meaning), and removing 2 items in factor 3 (symbolic meaning). Thus, the shorter CFA model included only 22 items: “allegorical meaning” (12 items; factor loadings: 0.827–0.923), “explicit meaning” (4 items; factor loadings: 0.836–0.885), and “symbolic meaning” (6 items; factor loadings: 0.823–0.911). The three factors accounted for 75.022% of variance. The 22-item CFA model for the VLS-HSP scale is shown in Figure 3 and in Appendix.
 |
Figure 3 The-22-item CFA model for the VLS-HSP. |
Goodness-of-Fit Examination
To further look into the goodness-of-fit of the 30-item EFA model and 22-item CFA model, the researchers used various fit indices to crosscheck the goodness-of-fit. For an acceptable χ2∕df ratio, no agreement has been reached, some suggested an acceptable χ2∕df ratio in the range from 5.0 to 2.0;35,36 others suggested a χ2∕df ratio below 2.0 to be considered as acceptable.37,38 As for TLI, a larger TLI value indicates a better model fit, with a minimum value of 0.90 being acceptable, and a value of 0.95 being excellent.39,40 As for CFI, a CFI value bigger than 0.90 is considered acceptable, and a value of 0.95 or above is regarded as excellent for a model fit.41 As for the RMSEA index which assesses the difference between a hypothesized model and an observed model.42 For MacCallum et al,43 an RMSEA index ranged between 0.08 and 0.10 is regarded only a moderate goodness-of-fit, with an index smaller than 0.02 showing a good model fit. In accordance with Hu and Bentler,41 an RMSEA index below 0.08 is considered as an acceptable goodness-of-fit, while an index less than 0.05 is considered excellent goodness-of-fit.41 Table 5 shows the goodness-of-fit index results of the 30-item EFA model and 22-item CFA model.
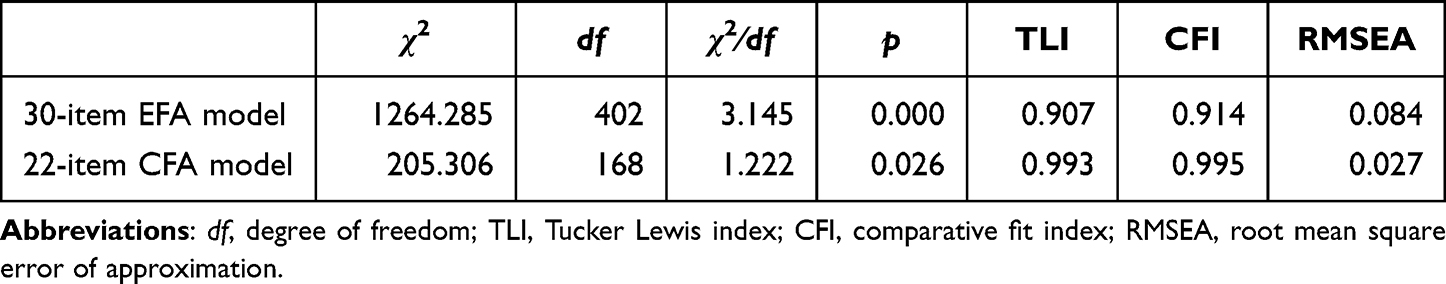 |
Table 5 Goodness-of-Fit Index Results of the 30-Item EFA Model and 22-Item CFA Model |
Reliability
The researchers further checked the stability and internal consistency of the 22-item CFA model, with the Cronbach’s alpha and composite reliability values above 0.70 being acceptable.28,34 After calculation (as in Table 6), it was found that the 22-item CFA model has excellent reliabilities in both the Cronbach’s alphas (0.972, 0.913, 0.950, and 0.977, respectively) and composite reliability (0.973, 0.917, 0.947, and 0.984, respectively) examinations in “allegorical meaning”, “explicit meaning”, and “symbolic meaning” subscales and entire VLS-HSP scale.
 |
Table 6 Cronbach’s Alpha and Composite Reliability Values of the 30 Item EFA Model and the 22-Item CFA Model |
Convergent Validity
To examine whether the scale items in the VLS-HSP scale can converge to represent the underlying construct, the researchers used AVE values and composite reliabilities28,29 to look into the convergent validity of the scale. The convergent validity can be established on condition that the AVE values are bigger than 0.50, but smaller than the composite reliabilities, which should be bigger than 0.6.28,29 After calculation (as shown in Table 6 and Table 7), it was proven that the VLS-HSP scale met the criteria of convergent validity in that the AVE values for “allegorical meaning” (0.753), “explicit meaning” (0.735), and “symbolic meaning” (0.747) were all bigger than 0.5028,30 and also smaller than the corresponding composite reliability values (0.973, 0.917, and 0.947, respectively; >0.6).
 |
Table 7 AVE, |

Discriminant Validity
The discriminant validity can be demonstrated on condition that the  of a factor is higher than its correlation coefficient (r) with other factors.44 After calculation (as in Table 7), it is shown that the criterion is satisfied in terms of the discrimination between “allegorical meaning” and “explicit meaning” (
 =0.868 and 0.857; r=0.668), between “explicit meaning” and “symbolic meaning” (
 =0.857 and 0.864; r= 0.786), and between “symbolic meaning” and “allegorical meaning” (
 =0.868 and 0.864; r= 0.834).
After going through a series of examinations, including sample size test, model fit tests, validity tests, reliability tests, etc., it has been proven that the 30-item EFA model and 22-item CFA model can be taken as an instrument in assessing participants’ visual literacy.
Discussion
This study was to build a comprehensive and psychometric scale applicable to the assessment of visual literacy for health students and professionals. In verifying the psychometrical properties of the VLS-HSP scale, the researchers first used the EFA to check the structure of potential factors in the dataset, followed by CFA to verify the fit of the dataset to the model.44,45 The researchers first applied the EFA to create a preliminary 30-item EFA model, with three factors, for the VLS-HSP scale. The three factors were “allegorical meaning” (12 items), “explicit meaning” (10 items), and “symbolic meaning” (8 items). Further, the researchers employed the promax rotation to achieve the maximum possible variance, always falling at the first factor,26 here “allegorical meaning” (60.825% of variance explained). Moreover, these three factors accounted for 73.191% of the variances.
The researchers further investigated the mean scores of the three subscales, it was found that the participants scored highest on the “explicit meaning” subscale (Mean=6.235 per item: 62.351÷10=6.235), followed by the “symbolic meaning” (Mean=6.182) and “allegorical meaning” (Mean=5.856). These mean scores indicate that the participants think that it was easier to understand the messages which were directly and explicitly expressed in the visual images, rather than the implicit meaning, the message not expressed in the visual images (eg, metaphorical language, symbolic meaning, or allegorical meaning). Additionally, they felt that compared to the allegorical meaning, a hidden meaning, typically a moral or political one, is easier to catch the symbolic meaning of a visual image, which uses a singular symbol or various symbols to represent a concept or ideas. Relatively, it would be difficult to understand the allegorical meaning, which is expressed through abstract ideas and political or historical situations via characters, events, or settings to reveal an underlying message which is not literally represented, with no customary or expected meaning.46
After creating the EFA model for the VLS-HSP scale, the researchers further applied the CFA to confirm the derived factor structure of the 30-item EFA model. After the CFA, the 30 items were reduced to 22, without removing any items in factor 1 (allegorical meaning); but removing items 7, 6, 8, 11, 1, and 10 in factor 2 (explicit meaning), and removing items 18 and 19 in factor 3 (symbolic meaning). Thus, the shorter CFA model included only 22 items: “allegorical” (12 items), “explicit meaning” (4 items), and “symbolic meaning” (6 items). However, with only 22 items in the CFA model, its total explained variance increased to 75.022%, compared to the 73.191% of variance in the 30-item EFA model.
Regarding the change in item factor loadings in the EFA and CFA models, based on Hair et al,28 factor loading values bigger than 0.50 are taken as being sufficient and with values above 0.70 being good. In the EFA Model, the item factor loadings in the “allegorical meaning”, “explicit meaning”, and “symbolic meaning” subscales ranged between 0.510 and 0.983, all satisfying the critical value 0.50,28 which means that these items are appropriate for measuring the factors. In the CFA model, with a removal of 8 items, the item factor loadings for the three subscales were increased and ranged between 0.823 and 0.923. Therefore, it can be implied that although the CFA model had less items, it had better factor loading values.
Regarding the goodness-of-fit of both the EFA and CFA models, it is shown (as in Table 5) that, the indices for the 30-item EFA model indicated acceptable model fits in terms of χ2∕df ratio (3.145), TLI (0. 907), CFI (0.9914), and RMSEA (0.084); the indices for the 22-item CFA model also indicated acceptable or even excellent model fit in terms of χ2∕df ratio (1.222), TFI (0.993), CFI (0.995), and RMSEA (0.027). While the researchers compared the good fit indices in the two models, it can be found that the 22-item CFA had better goodness-of-fit, with an increase in TLI and CFI of 0.086 and 0.081, and a decrease in χ2∕df ratio of 1.923 and a decrease in RMSEA of 0.057.
While looking into the convergent validity of the 22-item CFA model, the AVE values of the “allegorical meaning”, “explicit meaning”, and “symbolic meaning” subscales are higher than the benchmark value 0.5, and the composite reliabilities of these three are higher than the benchmark value of 0.6. Moreover, the AVE values are lower than their corresponding composite reliability values. According to Fornell and Larcker’s set criteria about convergent validity,45 the AVE value and the composite reliability value are required to be bigger than 0.5 and 0.6, respectively. Furthermore, the AVE values are expected to be lower than the corresponding composite reliabilities.28,34 Hence, based on the research findings and Fornell and Larcker’s set criteria about convergent validity, it can be concluded that the 22-item CFA model had passed through the convergent validity examination.
Regarding the discriminant validities, Fornell and Larcker’s set criteria45 indicated that for each factor should be greater than its correlation coefficients (r) with any other factor. Hence, based on Fornell and Larcker’s set criteria, the results also confirmed the discriminant validity between “allegorical meaning” and “explicit meaning”, between “explicit meaning” and “symbolic meaning”, and between “symbolic meaning” and “allegorical meaning”.
As for the reliabilities, in both of the 22-item CFA model and 30-item EFA model, the Cronbach’s alpha and composite reliability values were all above 0.90, superior to the lowest acceptable reliability value of 0.70.28,34 The findings also correspond to Cunha, Almeida Neto, and Stackfleth’s47 set benchmark, indicating that a reliability above 0.70 is considered as a good level of reliability. Therefore, with higher reliabilities,40,41 it can be concluded that both the 22-item CFA and 30-item EFA models for the VLS-HSP scales had high internal consistency reliabilities.28,29,43,47 Compared with Arslan’s visual literacy levels scale,48 a 41-item and 7-dimension scale, with Cronbach’s alphas for the subscales ranging between 0.753 and 0.861, the Cronbach’s alphas for the three subscales of the 22-item and 30-item VLS-HSP were all above 0.90. In addition, the total explained variance value of Arslan’s 41-item visual literacy levels scale was 57,201%; the total explained variance values of the 30-item and 22-item VLS-HSP in the study were 73.191%, and 75.022%, respectively, which are higher than the total explained variance value of Arslan’s visual literacy levels scale. Therefore, it can be concluded that the developed VLS-HSP scale has proved to be a better tool for assessing participants’ visual literacy.
To sum up, after the validity and reliability examinations, given these findings, both the 30-item EFA model and the 22-item CFA model for the VLS-HSP scale can be regarded as formal measures for assessing visual literacy in health students or people with health-related training or expertise. Although both the 30-item EFA and the 22-item CFA models can be taken as formal instruments for assessing visual literacy, there may be some limitations in the study because respondents may not give honest answers in the survey. Besides, the VLS-HSP scale was developed on the basis of Taiwanese cultural backgrounds to realize visual literacy in health students and professionals, for those who are interested in using the scale, they should consider their cultural backgrounds and the backgrounds of the respondents when translating the scale into their mother tongues so that the respondents can fully understand the items.
Conclusion
The results of the study suggested that both the 30-item EFA model and 22-item CFA model for the VLS-HSP scales can serve as reliable and valid tools for measuring visual literacy in health students and professionals. Future research may consider developing teaching strategies and courses to develop visual literacy in medical and health care settings, and using both the long- and short-version scales to assess the outcomes of the courses and strategies, with the goal of facilitating communication among patients, patient families, and health providers.
Acknowledgments
The researchers express appreciation to all study participants.
Disclosure
The authors report no conflicts of interest in this work.
References
1. Singh S, Dhaliwal U, Singh N. Developing humanistic competencies within the competency-based curriculum. Indian Pediatr. 2020;57(11):1060–1066. doi:10.1007/s13312-020-2036-y
2. Debes J. Some foundations for visual literacy. Audiovisual Instr. 1968;13:961–964.
3. IVLA. What is “Visual Literacy?” 2012. Available from: http://ivla.org/new/what-is-visual-literacy-2/.
4. Topiel EG. Experiencing Visual Literacy: How to Use it as a Tool to Impact Comprehension Skills [Master’s thesis]. New Jersey, USA: Rowan University Reading Education; 2006.
5. Metros SE. The educator’s role in preparing visually literate learners. Theory Pract. 2008;47(2):102–109. doi:10.1080/00405840801992264
6. Irwin K Patient deception of doctors: industry view; 2014. Available from: http://www.softwareadvice.com/medical/industryview/patient-deception-report-2014/.
7. Aita VA, Lydiatt WM, Gilbert MA. Portraits of care: medical research through portraiture. Med Humanit. 2010;36(1):5–13. doi:10.1136/jmh.2009.003780
8. Aita V, Lydiatt W, Gilbert M, McGraw H, Masuoka M. Here I am and nowhere else: portraits of care by Mark Gilbert at the intersection of art and medicine. Literature Arts & Medicine Magazine; 2009. Available from: http://medhum.med.nyu.edu/blog/?p=172.
9. Katz JT, Khoshbin S. Can visual arts training improve physician performance? Trans Am Clin Climatol Assoc. 2014;125:331–342.
10. Dalia Y, Milam EC, Rieder EA. Art in medical education: a review. J Grad Med Educ. 2020;12(6):686–695. doi:10.4300/JGME-D-20-00093.1
11. Kress G, van Leeuwen T. Reading Images: The Grammar of Visual Design. London, UK: Routledge; 2006.
12. Cohn N. Visual narrative structure. Cogn Sci. 2013;37(3):413–452. doi:10.1111/cogs.12016
13. Cohn N. Visual narrative comprehension: universal or not? Psychon Bull Rev. 2020;27(2):266–285. doi:10.3758/s13423-019-01670-1
14. Jasani SK, Saks NS. Utilizing visual art to enhance the clinical observation skills of medical students. Med Teach. 2013;35(7):e1327–e1331. doi:10.3109/0142159X.2013.770131
15. Klugman CM, Peel J, Beckmann-Mendez D. Art rounds: teaching interprofessional students visual thinking strategies at one school. Acad Med. 2011;86(10):1266–1271. doi:10.1097/ACM.0b013e31822c1427
16. Slavec A, Drnovšek M. A perspective on scale development in entrepreneurship research. Econ Bus Rev. 2012;14(1):39–62. doi:10.15458/2335-4216.1203
17. Arias MRM, Lloreda MJH, Lloreda MVH. Psicometría. Madrid, Spain: Alianza Editorial; 2014.
18. Maneesriwongul W, Dixon JK. Instrument translation process: a methods review. J Adv Nurs Res. 2004;48(2):175–186. doi:10.1111/j.1365-2648.2004.03185.x
19. IBM Corp. IBM SPSS Statistics for Windows. Version 24.0. Armonk, NY, USA: IBM Corp; 2016.
20. Arbuckle JL. IBM SPSS Amos 24 User’s Guide. Armonk, NY, USA: IBM; 2016.
21. Kaiser HF. A second generation of little jiffy. Psychometrika. 1970;35(4):401–415. doi:10.1007/BF02291817
22. Kaiser HF, Little Jiffy RJ, Mark IV. Little Jiffy, Mark Iv. Educ Psychol Meas. 1974;34(1):111–117. doi:10.1177/001316447403400115
23. Bartlett MS. Tests of significance in factor analysis. Br J Psychol. 1950;3:77–85.
24. Bartlett MS. A further note on tests of significance in factor analysis. Br J Psychol. 1951;4:1–2.
25. Dziuban D, Shirkey EC. When is a correlation matrix appropriate for factor analysis? Some decision rules. Psychol Bull. 1974;81(6):358–361. doi:10.1037/h0036316
26. Hooper D, Coughlan J, Mullen M. Structural equation modelling: guidelines for determining model fit. Electron J Bus Res Methods. 2008;6:53–60.
27. Bentler PM. Comparative fit indexes in structural models. Psychol Bull. 1990;107(2):238–246. doi:10.1037/0033-2909.107.2.238
28. Hair J, Black W, Babin B, Anderson R. Multivariate Data Analysis.
29. Malhotra NK. Pesquisa de Marketing: Uma Orientação Aplicada [Marketing Research: An Applied Orientation].
30. Pallant J. SPSS Survival Manual. A Step by Step Guide to Data Analysis Using SPSS.
31. Kaiser HF. An index of factorial simplicity. Psychometrika. 1974;39(1):31–36. doi:10.1007/BF02291575
32. Kent MG. The importance of window view: using an exploratory factor analysis to uncover the underlying latent dimensions; 2018. Available from: https://escholarship.org/uc/item/4mj1b1vz.
33. Abdi H. Factor rotations in factor analyses. In: Lewis-Beck M, Bryman A, editors. Encyclopedia of Social Sciences Research Methods. Thousand Oaks, CA, USA: Sage; 2003:792–795.
34. Churchill GA. A paradigm for developing better measures of marketing constructs. J Market Res. 1979;16(1):64–73. doi:10.1177/002224377901600110
35. Wheaton B, Muthen B, Alwin DF, Summers G. Assessing reliability and stability in panel models. Sociol Methodol. 1977;8(1):84–136. doi:10.2307/270754
36. Tabachnick BG, Fidell LS. Using Multivariate Statistics.
37. Schumacker RE, Lomax RG. A Beginner’s Guide to Structural Equation Modeling.
38. Koufteros XA. Testing a model of pull production: a paradigm for manufacturing research using structural equation modeling. J Operat Manage. 1999;17(4):467–488. doi:10.1016/S0272-6963(99)00002-9
39. Schermelleh-Engel K, Moosbrugger H. Evaluating the fit of structural equation models: tests of significance and descriptive goodness-of-fit measures. Methods Psychol Res Online. 2003;8:23–74.
40. Tucker LR, Lewis C. A reliability coefficient for maximum likelihood factor analysis. Psychometrika. 1973;38(1):1–10. doi:10.1007/BF02291170
41. Hu L, Bentler PM. Cutoff criteria for fit indexes in covariance structure analysis: conventional criteria versus new alternatives. Struct Equatios Model. 1999;6(1):1–55. doi:10.1080/10705519909540118
42. Chen FF. Sensitivity of goodness of fit indexes to lack of measurement invariance. Struct Equation Model. 2007;14(3):464–504. doi:10.1080/10705510701301834
43. MacCallum RC, Browne MW, Sugawara HM. Power analysis and determination of sample size for Covariance Structure Modeling. Psychol Methods. 1996;1(2):130–149. doi:10.1037/1082-989X.1.2.130
44. Silva RPA, Macêdo LCB, Silva IL. Avaliação das características psicométricas dos questionáriosutilizados nos periódicos da área contábil: um estudo longitudinalcompreendido no período 2003–2012 [Assessment of the psychometric characteristics of questionnaires used in accounting periodicals: a longitudinal study covering the period 2003-2012]. Available from: https://anaiscbc.emnuvens.com.br/anais/article/view/124/124.
45. Fornell C, Larcker DF. Evaluating structural equation models with unobservable variables and measurement error. J Market Res. 1981;18(1):39. doi:10.1177/002224378101800104
46. Dawson D. Allegorical Readers and Cultural Revision in Ancient Alexandria. Berkeley, CA: University of California; 1992.
47. Cunha CM, Almeida Neto OP, Stackfleth R. Main psychometric evaluation methods of measuring instruments reliability. Rev Atenção Saúde. 2016;14:98–103.
48. ArslanR, NalinciGZ. Development of visual literacy levels scale in higher education. Turkish Online J Educ Technol. 2014;13(2):61–70.
 © 2023 The Author(s). This work is published and licensed by Dove Medical Press Limited. The
full terms of this license are available at https://www.dovepress.com/terms
and incorporate the Creative Commons Attribution
- Non Commercial (unported, 3.0) License.
By accessing the work you hereby accept the Terms. Non-commercial uses of the work are permitted
without any further permission from Dove Medical Press Limited, provided the work is properly
attributed. For permission for commercial use of this work, please see paragraphs 4.2 and 5 of our Terms.
© 2023 The Author(s). This work is published and licensed by Dove Medical Press Limited. The
full terms of this license are available at https://www.dovepress.com/terms
and incorporate the Creative Commons Attribution
- Non Commercial (unported, 3.0) License.
By accessing the work you hereby accept the Terms. Non-commercial uses of the work are permitted
without any further permission from Dove Medical Press Limited, provided the work is properly
attributed. For permission for commercial use of this work, please see paragraphs 4.2 and 5 of our Terms.