Back to Journals » International Journal of Women's Health » Volume 17
A Prognostic Nomogram Based on an Immunogenic Cell Death and Endoplasmic Reticulum Stress-Related Gene Signature for Ovarian Cancer
Authors Lu X, Zhu L ![]() , Zhang X, Yang N, Zhu Z, Liu Q
, Zhang X, Yang N, Zhu Z, Liu Q
Received 26 May 2025
Accepted for publication 10 November 2025
Published 27 November 2025 Volume 2025:17 Pages 4891—4903
DOI https://doi.org/10.2147/IJWH.S533676
Checked for plagiarism Yes
Review by Single anonymous peer review
Peer reviewer comments 2
Editor who approved publication: Professor Elie Al-Chaer
Xiaojuan Lu,* Lixia Zhu,* Xuegang Zhang, Ning Yang, Zhiwei Zhu, Qin Liu
Department of Gynecology, Kunshan First People’s Hospital, Kunshan, Jiangsu, 215300, People’s Republic of China
*These authors contributed equally to this work
Correspondence: Qin Liu, Department of Gynecology, Kunshan First People’s Hospital, No. 5 Qingyang Middle Road, Kunshan, Jiangsu, 215300, People’s Republic of China, Tel +86-512-57027134, Email [email protected]
Purpose: Gene signatures offer superior power on prognosis and survival of patients over traditional single-gene biomarker. This study aimed to develop a nomogram based on an immunogenic cell death (ICD) and endoplasmic reticulum (ER) stress–related gene signature to predict the overall survival (OS) of patients with ovarian cancer (OC).
Materials and Methods: ICD- and ER stress–related genes were identified from public datasets and previous publications. Candidate genes were screened through differential expression and survival analyses. A prognostic risk score was established using Cox and LASSO regression. The model’s predictive performance was evaluated by Kaplan–Meier and multivariate analyses, and a nomogram was constructed to estimate individual survival probabilities.
Results: A seven-gene signature related to ICD and ER stress was developed to generate a prognostic risk score. Patients with low risk scores had significantly longer OS compared to high-risk patients. The signature correlated with immune features and remained an independent prognostic factor for OS in multivariate analysis. The prediction performance was good, with AUC values of 0.61, 0.64, and 0.67 for 1-, 2-, and 3-year OS in the training set, and 0.60, 0.61, and 0.60 in the validation set. The calibration curve showed good consistency between predicted and actual results.
Conclusion: We established a clinically applicable nomogram integrating a seven-gene ICD/ER stress signature to provide individualized survival prediction for OC patients. This tool may assist clinicians in risk stratification and personalized treatment planning.
Keywords: ovarian cancer, immunogenic cell death, endoplasmic reticulum stress, prognostic model
Introduction
Ovarian cancer (OC) is one of the leading cause of cancer-related death among women worldwide,1 with an estimated 140,000 deaths per year.2 The standard treatment regimens for OC are highly relied on surgery and chemoradiotherapy. However, many patients develop chemotherapy resistance and relapse, yielding to a 5-year survival rate of less than 35%.3 The traditional FIGO staging system has been adopted as the standard assessment option for estimating the treatment and outcome of OC, but the estimation is hampered by the heterogeneity of OC that is constantly changing. Thus, it is urgent to develop a convenient and effective programmatic screening method for high-risk OC populations.
Molecular biomarkers have been well acknowledged to contribute to predict the prognosis of OC. Compared with traditional single-gene biomarkers, gene signatures comprising several genes provide strong evidence for patient prognosis and survival. In recent years, several prognostic models for OC have been proposed based on clinical characteristics or gene expression profiles;4–6 however, few of them integrate immunogenic cell death (ICD) and endoplasmic reticulum (ER) stress, which are increasingly recognized as key processes in tumor immunity and treatment response.
As a type of regulatory cell death usually elicited by radiotherapy and some chemotherapeutic agents,7 ICD is capable of triggering a fully antigen-specific adaptive immune response by releasing specific molecules belonging to damage-associated molecular patterns (DAMPs) such as calreticulin, ATP, and high mobility group protein Box 1.8,9 This immunogenic process is partly driven by the pre-apoptotic translocation of calreticulin from the ER to the cell surface, which represents a hallmark mechanism of ICD.10 Moreover, ICD based on ER stress has been widely studied as the fundamental mechanism of cancer immunotherapy.11 These lead us to identify a gene signature associated with ICD and ER stress in OC patients. In the present study, we aim to screen gene signatures associated with ICD and ER stress and to develop a nomogram for predicting the prognosis of OC based on a risk score model. Such a nomogram may provide clinicians with a practical tool for individualized risk stratification and potentially guide personalized treatment strategies for OC patients.
Materials and Methods
Data Collection
We first screen the OS status of OC patients from the gene expression omnibus (GEO) database (http://www.ncbi.nlm.nih.gov/geo/). In total, 6 datasets (ie GSE14764, GSE19829, GSE30161, GSE26193, GSE31245 and GSE63885) were initially included in this study (Table 1). The inclusion criteria for datasets were: (1) availability of OS information, and (2) inclusion of OC patients. Datasets that did not meet these criteria or had missing OS data were excluded. In total, 448 OC patients with OS data were used as the training set, which consisted of 80 patients from GSE14764, 70 from GSE19829, 58 from GSE30161, 107 from GSE26193, 58 from GSE31245, and 75 from GSE63885. Batch effects were removed by sva package (R 4.2.1 version) according to the previous description.12 The effectiveness of batch effect removal was visually validated using principal component analysis (PCA) plots to confirm that samples from different datasets were more closely clustered after batch effect removal. The normalization process involved log2 (FPKM+1) transformation, which was applied to the datasets for downstream analysis. The normalization process was further validated by comparing distributions across datasets both visually (via boxplots) and statistically (via Kolmogorov–Smirnov test). Besides, 357 OC patients with OS information downloaded from the Cancer Genome Atlas (TCGA) database (https://gdc-portal.nci.nih.gov/) served as the validation set. Then log2 (FPKM+1) normalization was utilized for the downstream analysis of the selected datasets.
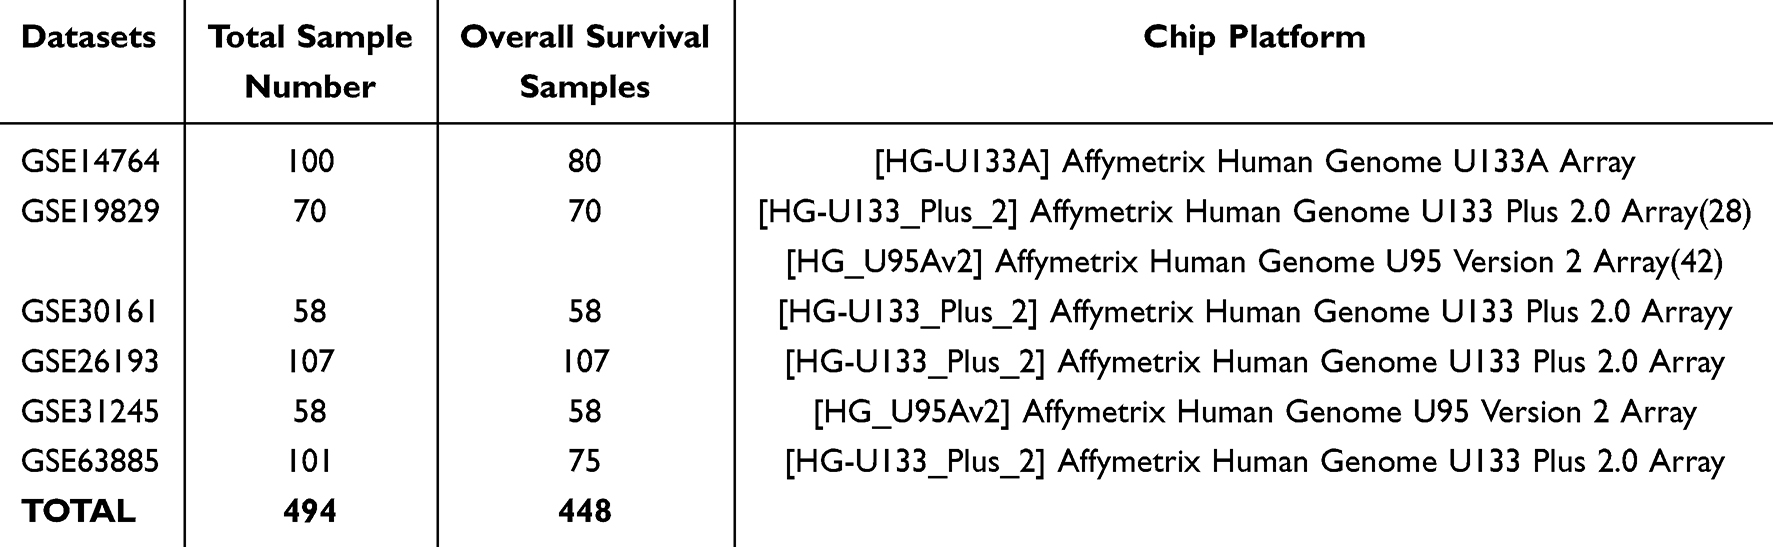 |
Table 1 Information for the Six Datasets |
Identification of ICD Subtypes
Thirty-four human ICD genes were retrieved from a previous study.13 Expression data for 31 of these genes were available. The ICD subtype analysis was performed to assess the correlation between ICD expression and OC survival using the ConsensusClusterPlus package (R 4.21.1 version), as described previously.14 ICD subtypes were classified into two clusters (subtype A and B) based on an optimal subtype K value, defined within a range of 2–6. Chi-square test was performed to assess the differences in ICD subtypes across clinicopathological features, including age, chemotherapy response, histological type, grade, and staging. Kaplan-Meier curve was performed to compare outcomes between patients with different ICD subtypes.
Identification of ICD-Based ER Stress Genes
Differentially expressed ICD genes were visualized using the Volcano plot and heatmaps generated with the Limma package.15 Multiple testing correction was performed using Benjamini & Hochberg method to obtain the adjusted P value. Differential expression was considered significant for genes with an adjusted P value of < 0.05.
ER stress-related genes were retrieved from GeneCards Suite database (https://www.genecards.org/) using the keywords of “Endoplasmic reticulum stress”. Candidate genes were selected with a relevance score of > 7. Candidate ICD-based ER stress genes were finally identified by intersecting the differential expressed ICD genes with the ER stress genes.
Functional and Pathway Analyses
The Molecular Signatures Database gene sets C5.go.mf. V7.4.symbols.gmt was utilized to evaluate the relevant pathways and molecular mechanisms of ICD genes, according to the previous description.16 Gene set enrichment analysis (GSEA) was utilized to screen the significantly related pathways.17 DAVID package18 was performed for the Gene Ontology (GO) and Kyoto Encyclopedia of Genes and Genomes (KEGG) analyses.
Calculation of Prognostic Risk Score Based on ICD-Based ER Stress Genes
Univariate Cox regression analysis was used to identify the ICD-based ER stress genes associated with the prognosis of OC using the survminer package (https://cran.rstudio.com/web/packages/survminer/index.html). Subsequently, the least absolute shrinkage and selection operator (LASSO) regression analysis was performed. The optimal lambda parameter for LASSO was chosen using 10-fold cross-validation with the minimum criteria for the mean squared error. Afterwards, Stepwise Cox regression was further utilized to construct the prognostic risk score model based on the following formula: risk score =β1X1 + β2X2 +… + βnXn, where β represented the regression coefficient and X represented the gene expression, respectively. Then the OC patients were classified into high- and low-risk groups based on the median risk score, followed by Kaplan-Meier curve to compare the survival between the two risk groups.
Comparison of Immune Microenvironment Between Low- and High-Risk Groups
We then evaluate the immune microenvironment between high-risk and low-risk groups with three algorithms. EstimateR was used to calculate the stromal and immune scores in the low-risk and high-risk groups. MCPcounter and GAVA package were used to estimate the infiltration of immune cells. Subsequently, the gene sets obtained from previous study19 were used to mark each immune cell type. As HLA plays an important role in the immune system, the tumor antigens must be presented in an HLA-dependent manner.20,21 Therefore, we compared the expression of HLA genes between low-risk and high-risk groups.
Establishing a Nomogram for Predicting the OS of OC Patients
Univariate and multivariate Cox regression analyses were performed to select the risk factors for predicting the prognosis of OC patients. Then a nomogram was established based on the selected risk factors using the rms package (https://cran.r-project.org/web/packages/rms/). The prediction efficacy of the nomogram was evaluated using the C-index and calibration curve.
Statistical Analysis
The statistical analysis was performed using R software (4.4.2 version). Univariate logistic regression analysis was performed to compare the variables between low- and high-risk groups. Then variables with a P value of < 0.05 were adopted into the multivariate regression analysis. A P value of less than 0.05 was considered to be statistical significance.
Results
ICD Subtypes Were Effective to Distinguish the Survival of OC Patients
Consensus cumulative distribution function (CDF) was shown in Figure 1a with a K value in a range of 2–10. The obtained 31 ICD genes were classified into two subtypes (ie subtype A and subtype B) (Figure 1b), and their expression in different subtypes was shown in Figure 1c. The survival of patients with ICD genes classified into subtype A showed significantly higher OS compared with those with ICD genes classified into B subtype (Figure 1d, P = 0.01). Supplementary Figure 1 summarized the clinical data of the patients with different subtypes, which indicated no statistical differences in the clinical features between the two subtypes, including age (P=0.60), grade (P=0.315), histological type (P=0.632), stage (P=1) and response to chemotherapy (P=0.965).
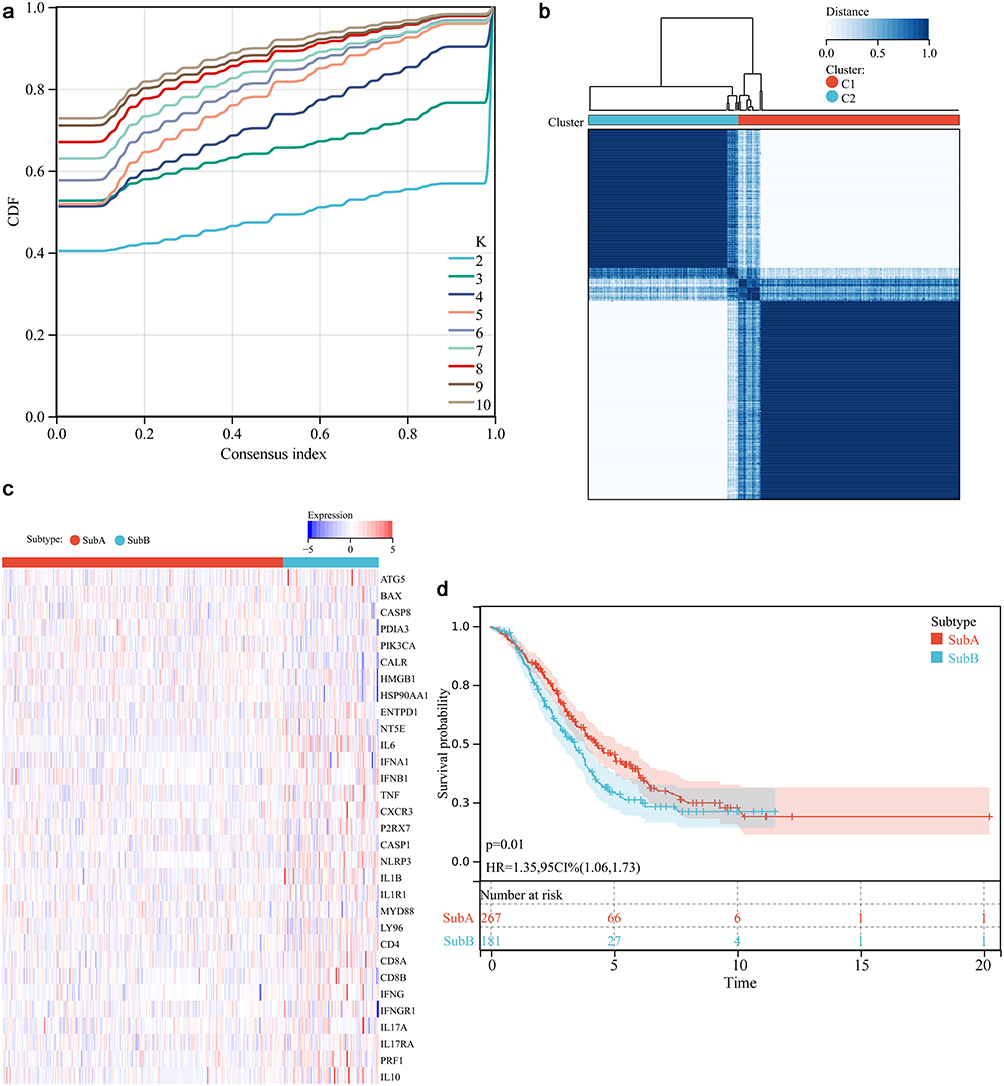 |
Figure 1 Immunogenic cell death (ICD) subtypes (ie up-regulation and down-regulation) analysis. (a) Consensus clustering cumulative distribution function analysis. (b) Optimal consensus clustering matrix with a K value of 2. (c) Heat plot of the expression of 31 ICD genes. Red and blue color represented up-regulation and down-regulation, respectively. (d) Survival curve of different ICD subtypes. |
ICD Subtypes Were Enriched to Immunity and ER Stress
GSEA analysis for the ICD subtypes showed that 74 significant pathways were significantly associated with immunity such as B cell receptor signaling pathway and T cell receptor signaling pathway (Figure 2a and b). GO enrichment analysis showed 2706 significant enriched function, among which three were associated with ER, including calcium ion homeostasis, release of sequestered calcium ion into cytosol, and intrinsic apoptotic signaling pathway in response to ER stress (Figure 2c–e).
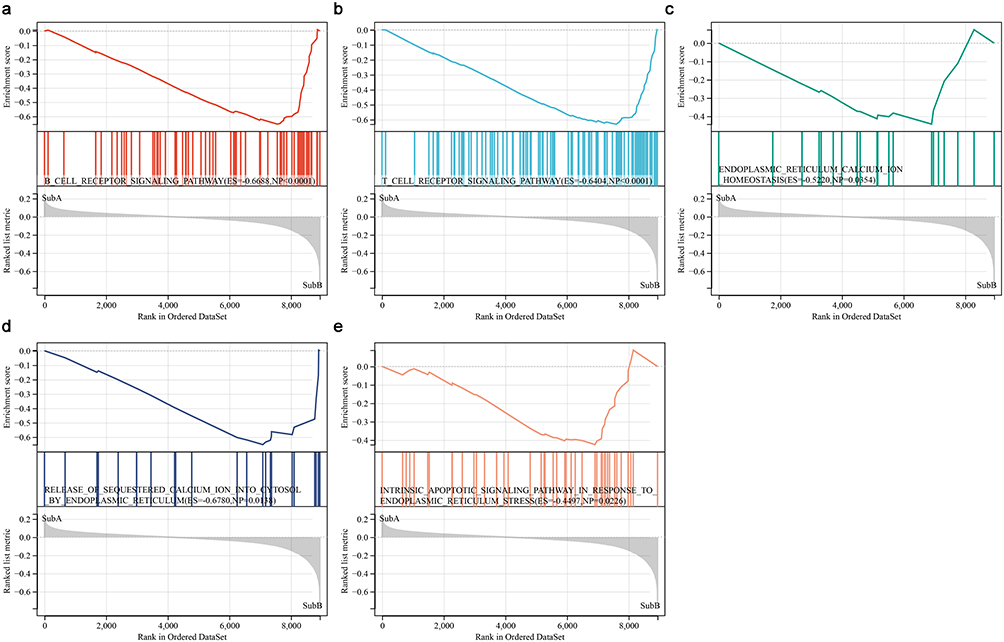 |
Figure 2 Functional pathways between ICD subtypes. (a and b) GSEA indicated the genes were enriched in B cell receptor signaling pathway and T cell receptor signaling pathway. (c–e) GO analysis showed that the genes were enriched in ER calcium ion homeostasis, release of sequestered calcium ion into cytosol by ER, and intrinsic apoptotic signaling pathway in response to ER stress. |
Function Analysis of ICD-Based ER Stress Genes
In total, 3485 DEGs were selected for the functional analysis of ER stress genes based on ICD genes (Figure 3a). The expression of ICD genes was presented in Figure 3b, which showed their expression was different between different subtypes. After intersecting ICD genes with ER stress genes, a total of 245 differentially expressed ICD-based ER stress genes were retrieved (Figure 3c). Functional analysis suggested that these were enriched into 148 KEGG pathways and 4002 GO terms. The most significant pathways and GO terms were visualized in Figure 3d and e.
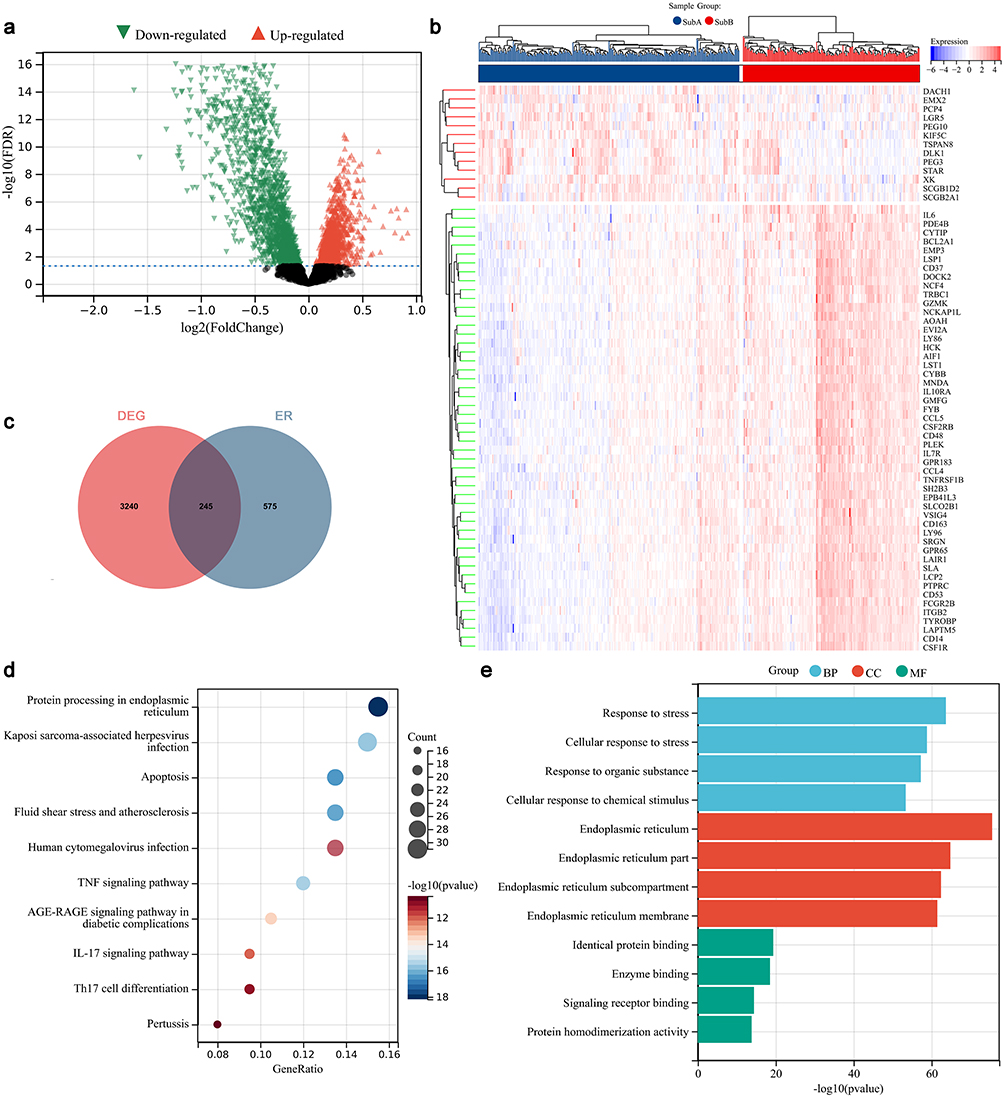 |
Figure 3 Identification and analysis for ER stress genes based on ICD genes. (a) Volcano plot for identification of differential expressed ICD genes. (b) Differential expressed ICD genes in different ICD subtypes. (c) Veen plot for intersecting the differential expressed ICD genes and ER genes. (d) KEGG pathways analysis. (e) GO function analysis. Abbreviations: BP, biological process; CC, cellular component; MF, molecular function. |
Prognostic Analysis Based on Risk Scores of ICD-Based ER Stress Genes
Among the 245 ICD-based ER stress genes, 25 ICD-based ER stress genes were identified to be related to the OC prognosis after univariate Cox analysis (Figure 4a). Then 18 optimal genes were identified after LASSO analysis (Figure 4b). Finally, based on Step-wise Cox regression, 7 genes (ie PTPN2, RPS27A, NR3C1, SERPINA1, CYBA, APOE, and UBXN8) were selected (Figure 4c). OC patients were divided into high- and low-risk subgroups based on the calculated the risk score of each patient. Kaplan-Meier analysis showed that the survival in the patients with high-risk subgroup was significantly lower than the counterparts of a low-risk in the training set (P < 0.01, Figure 4d) and validation set (P<0.01, Figure 4e).
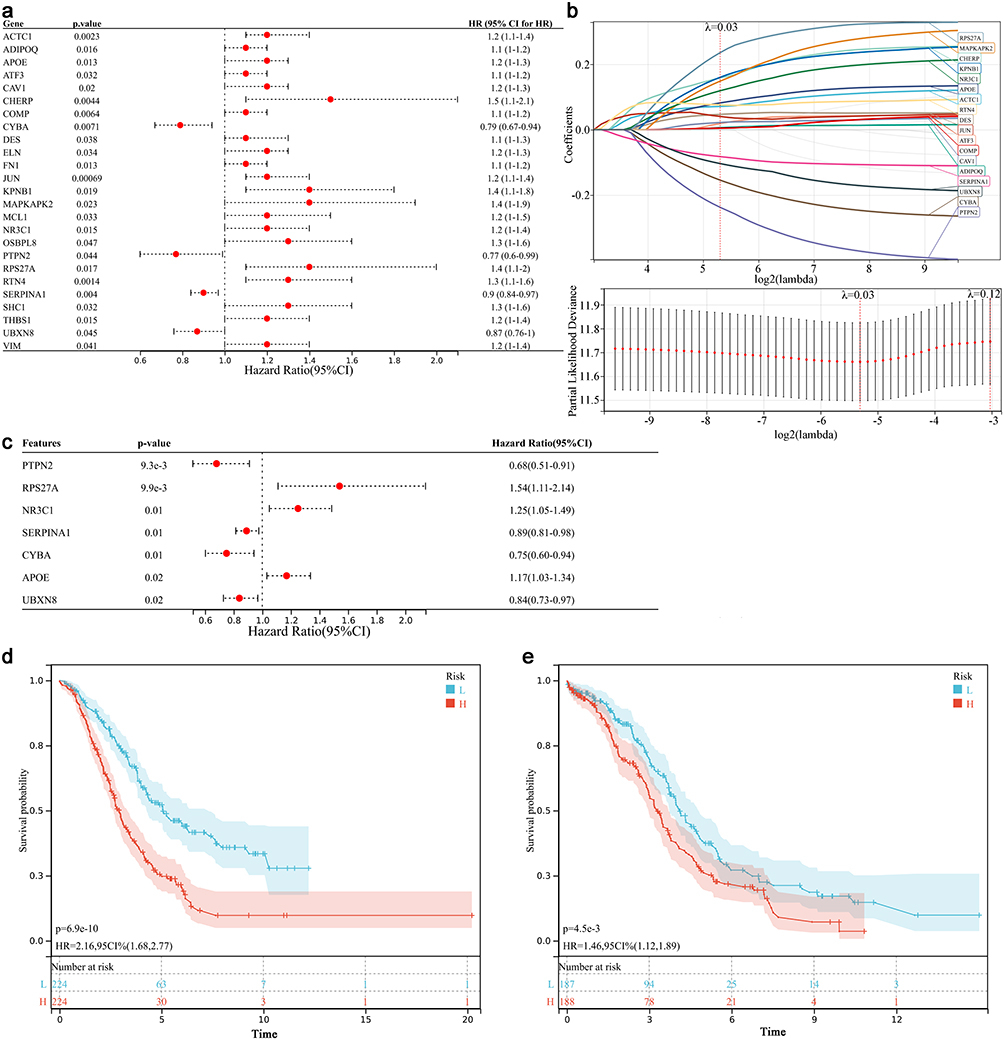 |
Figure 4 Construction and validation of the risk score. (a) Univariate Cox regression analysis for identification of ER stress genes related to the prognosis of OC. (b) LASSO analysis. Left; distribution of LASSO coefficient, right; the likelihood deviation of the LASSO coefficient distribution, the two vertical dashed lines represented lambda.min and Lambda.1SE, respectively. (c) Multivariate Cox analysis results for the ER stress genes related to OC prognosis. (d and e) Survival curve of different risk groups in GEO dataset and TCGA dataset. |
Different Risk Groups Showed Different Immune Features
In this section, we first analyzed the in infiltration between different high- and low-risk groups, which indicated that high-risk group showed higher immune and stromal scores compared with the low-risk group (Figure 5a and b). Then MCPcounter algorithm was used to compare the infiltration of the 10 selected immune cells between low- and high-risk groups including CD8 T cells, NK cells, neutrophils, T cells, B lineage, myeloid dendritic cells, cytotoxic lymphocytes, monocytic lineage, endothelial cells and fibroblasts (Figure 5c). These immune cells were significantly correlated with the genes in risk model (Figure 5d). Subsequently, ssGSEA algorithm was used to compare the enrichment score of 28 immune cells between low- and high-risk groups (Figure 5e). These immune cells were also significantly correlated with the genes in risk model (Figure 5f). Finally, we also found that the HAL-E and HAL-J were significantly correlated with the genes in risk mode (Figure 5g).
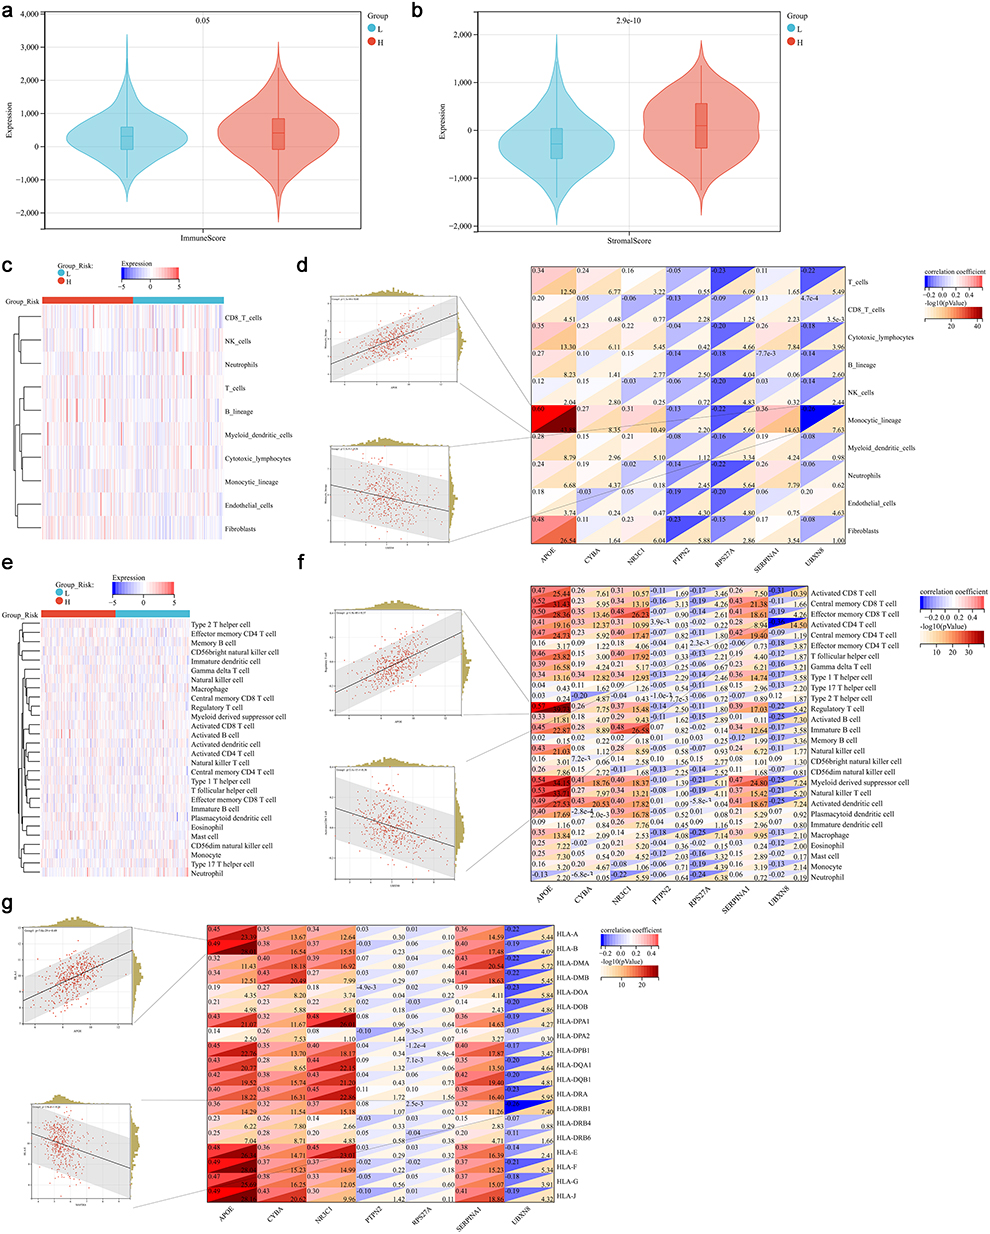 |
Figure 5 Immune status analysis in different risk groups. (a and b) Immune score and stromal score in different risk groups, L, low-risk group; H, high-risk group. (c) Heat plot of immune cells in MCPCounter algorithm. (d) Correlation of immune cells and genes in risk score model. The most positive and negative correlated plot were shown in the left. (e) Heat plot of immune cells in ssGSEA algorithm. (f) Correlation of immune cells and genes in risk score model. The most positive and negative correlated plot were shown in the left. (g) Correlation of human leukocyte antigen (HLA) gens and genes in risk score model. The most positive and negative correlated plot were shown in the left. |
Establishing a Nomogram for Predicting the 1-, 2- and 3-Year Survival of OC Patients
Univariate and multivariate Cox regression analysis were used to screen the independent risk factors associated with the prognosis of OC. Univariate analysis results were shown in Figure 6a. Multivariate analysis further showed that risk score and grade were independent risk factors for reduced OS in OC patients, while chemotherapy response was associated with extended OS (Figure 6b). Then these factors were included into the nomogram model (Figure 6c). The prediction efficacy was acceptable with a AUC of 0.61, 0.64 and 0.67 for the 1-, 2- and 3-year OS in the training set, while that in the test set was 0.60, 0.61 and 0.60, respectively (Figure 6d). It showed a good consistency between the predictive results and the actual results as shown in calibration curve (Figure 6e).
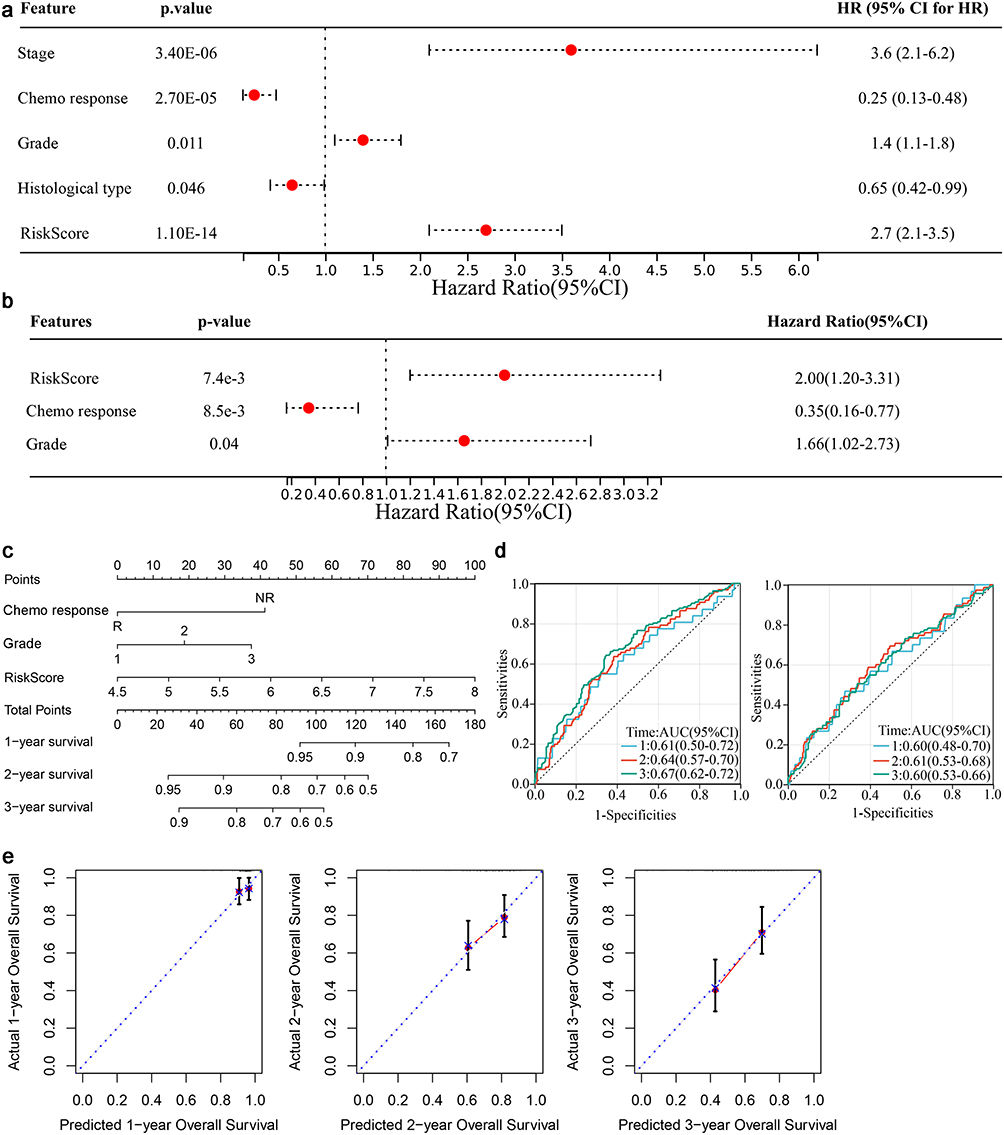 |
Figure 6 Establishing a nomogram for predicting the 1-, 2- and 3-year survival of the OC patients. (a) Univariate Cox regression analysis was performed to select the factors associated with OC prognosis. (b) Multivariate Cox regression analysis for identification of independent risk factors for OC prognosis. (c) Nomogram model. (d) Evaluation of the nomogram based on AUC in the training (left) and test (right) sets. (e) Calibration curve. |
Discussion
ICD driven by ER stress has been widely accepted as the fundamental mechanism of cancer immunotherapy.7 Cancer cells can activate specific signaling pathways to induce ER stress and expose DAMPs, thereby promoting immune responses in the anti-cancer process.22 However, the roles of ICD-related ER stress genes in OC prognosis remain poorly defined. In the present study, we established a prognostic risk score based on seven ICD- and ER stress-associated genes, including PTPN2, RPS27A, NR3C1, SERPINA1, CYBA, APOE, and UBXN8. These genes are involved in protein homeostasis and ER-associated degradation (ERAD) pathway (eg APOE, RPS27A, and UBXN8), inflammatory and immune regulation (eg PTPN2, NR3C1, and SERPINA1) and reactive oxygen species (ROS) generation and oxidative stress (CYBA). Finally, we developed a nomogram based on this seven-gene signature, which effectively predicts the 1-, 2-, and 3-year survival of OC patients.
UBXN8, RPS27A, and APOE play key roles in regulating proteostasis and modulating ER stress responses. Among these, UBXN8 acts as a critical regulator of the ERAD pathway, facilitating the retrotranslocation and degradation of misfolded proteins through its interaction with the p97/VCP complex.23 Dysfunction of UBXN8 triggers sustained ER stress and pro-apoptotic signaling, which in turn promotes ICD. Similarly, RPS27A, which encodes a ubiquitin-ribosomal fusion protein, contributes to protein quality control by promoting proteasomal degradation.24 Its deficiency may impair the clearance of unfolded proteins, activating the UPR. Although APOE is primarily known for its role in lipid transport, it can influence ER stress indirectly by modulating lipid composition and membrane integrity, both essential for ER function.25 Dysregulation of APOE has been linked to increased ER stress and protein aggregation. Collectively, these genes underscore the pivotal role of protein homeostasis in connecting ER stress to cell fate decisions such as apoptosis and ICD.
PTPN2, NR3C1, and SERPINA1 genes are key regulators of inflammation and immune homeostasis, with direct implications for ER stress and ICD. PTPN2 encodes a tyrosine phosphatase that negatively regulates cytokine signaling through pathways such as JAK/STAT and NF-κB.26 Loss of PTPN2 function enhances inflammatory responses and increased susceptibility to ICD.27 Similarly, activation of NR3C1 reduces DAMP release and immune cell recruitment, potentially diminishing the efficacy of ICD.28,29 SERPINA has dual immunomodulatory functions. Under normal conditions, it suppresses the inflammation, whereas the misfolded variants induce ER stress and inflammatory responses.30 Taken together, these genes could modulate both immunosuppressive and immunostimulatory pathways, influencing ER stress outcomes and thereby modulating the ICD process.
Encoding a subunit of the NADPH oxidase complex, CYBA is a key contributor to ROS in immune and epithelial cells.31 Elevated ROS can directly induce ER stress by causing oxidative damage to proteins and disrupting the redox environment. Additionally, CYBA plays a crucial role in enhancing the immunogenicity of dying cells by promoting the release of ICD hallmarks such as calreticulin and ATP. CYBA-mediated oxidative stress has been shown to amplify these effects, linking ROS generation with pro-inflammatory and immunostimulatory outcomes. On this basis, modulating CYBA expression or activity to regulate immunogenic apoptosis and redox balance may offer therapeutic potential in ovarian cancer.
Gene signatures have been recently utilized in developing nomograms for predicting the prognosis of OC. For instance, Wang et al developed a nomogram using a seven-gene signature based on tumor stem cell-related genes to predict the OC prognosis, which showed that the nomogram combining the gene signature demonstrated strong predictive ability.32 Similarly, Pan and Ma proposed a six-gene epithelial–mesenchymal transition–related signature for prognostic prediction in OC.33 However, few studies have integrated ICD and ER stress signatures, which are increasingly recognized as critical processes in tumor immunity and therapy response. In our study, an optimal seven-gene signature associated with ICD and ER stress was identified, and the generated risk scores effectively predicted the OC prognosis. Notably, both the signature and the risk score model were significantly correlated with the immune statues, suggesting potential utility in predicting immune response to immunotherapy. We further constructed a nomogram incorporating the risk score, tumor grade, and chemotherapy response, which demonstrated good predictive performance for 1-, 2-, and 3-year survival in OC patients. Importantly, by integrating molecular, pathological, and treatment-related factors, this model complements existing clinical tools and may facilitate individualized risk stratification. Given its association with immune features, it also has potential to guide patient selection for immunotherapies or more intensive follow-up strategies, thereby supporting precision oncology in OC.
Although this study constructed a nomogram related to ICD and ER stress for predicting the prognosis of OC, several limitations should be acknowledged. First, the model lacks external clinical validation, which is necessary to confirm its robustness and generalizability. Second, the specific roles of the identified genes in ICD and ER stress remain unclear, and further studies are needed to elucidate their functional roles. Finally, large-scale datasets and prospective clinical studies are required to validate the predictive efficiency of the model.
Conclusion
In this study, a risk score was established by seven-genes related to ICD and ER stress for predicting prognosis of OC. The risk score effectively stratified patients according to survival outcomes. A nomogram integrating the risk score, tumor grade, and chemotherapy response was then constructed, showing good predictive performance for 1-, 2-, and 3-year survival. This nomogram may serve as a practical tool in clinical practice to facilitate individualized risk assessment and support personalized treatment decisions for OC patients.
Abbreviations
CDF: cumulative distribution function; DAMPs: damage-associated molecular patterns; DEGs: differential expressed genes; ER: endoplasmic reticulum; GEO: gene expression omnibus; GO: Gene Ontology; GSEA: Gene set enrichment analysis; HCC: hepatocellular carcinoma; ICD: Immunogenic cell death; KEGG: Kyoto Encyclopedia of Genes and Genomes; LASSO: least absolute shrinkage and selection operator; OC: Ovarian cancer; TCGA: the Cancer Genome Atlas.
Data Sharing Statement
The datasets used and/or analysed during the current study are available from the corresponding author on reasonable request.
Ethics Approval and Informed Consent
Based on the items Article 32 of the Measures for Ethical Review of Life Science and Medical Research Involving Human Subjects (dated February 18, 2023), along with the publicly available nature of the data, this study is exempt from requiring separate IRB approval.
Author Contributions
All authors contributed to data analysis, drafting or revising the article, have agreed on the journal to which the article will be submitted, gave final approval of the version to be published, and agree to be accountable for all aspects of the work.
Funding
This study was supported by the Suzhou Health Committee Science and Technology Project (No. LCZX202228).
Disclosure
The authors declare that they have no competing interests.
References
1. Webb PM, Jordan SJ. Epidemiology of epithelial ovarian cancer. Best Pract Res Clin Obstet Gynaecol. 2017;41:3–14. doi:10.1016/j.bpobgyn.2016.08.006
2. Penny SM. Ovarian Cancer: an Overview. Radiologic Technol. 2020;91(6):561–575.
3. Kossaï M, Leary A, Scoazec JY, Genestie C. Ovarian cancer: a heterogeneous disease. Pathobiology. 2018;85(1–2):41–49. doi:10.1159/000479006
4. Sun H, Yan L, Chen H, Zheng T, Zhang Y, Wang H. Development of a nomogram to predict prognosis in ovarian cancer: a SEER-based study. Transl Cancer Res. 2020;9(10):5829–5842. doi:10.21037/tcr-20-1238
5. Li J, Cao D. Prognostic nomogram that predicts progression-free survival and overall survival of patients with ovarian clear cell carcinoma. Front Oncol. 2022;12:956380. doi:10.3389/fonc.2022.956380
6. Zheng H, Chen J, Huang J, Yi H, Zhang S, Zheng X. A novel clinical nomogram for predicting cancer-specific survival in patients with non-serous epithelial ovarian cancer: a real-world analysis based on the surveillance, epidemiology, and end results database and external validation in a tertiary center. Transl Oncol. 2024;42:101898. doi:10.1016/j.tranon.2024.101898
7. Ahmed A, Tait SWG. Targeting immunogenic cell death in cancer. Mol oncol. 2020;14(12):2994–3006. doi:10.1002/1878-0261.12851
8. Kroemer G, Galluzzi L, Kepp O, Zitvogel L. Immunogenic cell death in cancer therapy. Ann Rev Immunol. 2013;31:51–72. doi:10.1146/annurev-immunol-032712-100008
9. Krysko DV, Garg AD, Kaczmarek A, Krysko O, Agostinis P, Vandenabeele P. Immunogenic cell death and DAMPs in cancer therapy. Nat Rev Cancer. 2012;12(12):860–875. doi:10.1038/nrc3380
10. Kepp O, Menger L, Vacchelli E, et al. Crosstalk between ER stress and immunogenic cell death. Cytokine Growth Factor Rev. 2013;24(4):311–318. doi:10.1016/j.cytogfr.2013.05.001
11. Jiang H, Fu H, Guo Y, Hu P, Shi J. Evoking tumor associated macrophages by mitochondria-targeted magnetothermal immunogenic cell death for cancer immunotherapy. Biomaterials. 2022;289:121799. doi:10.1016/j.biomaterials.2022.121799
12. Leek JT, Johnson WE, Parker HS, Jaffe AE, Storey JD. The sva package for removing batch effects and other unwanted variation in high-throughput experiments. Bioinformatics. 2012;28(6):882–883. doi:10.1093/bioinformatics/bts034
13. Garg AD, De Ruysscher D, Agostinis P. Immunological metagene signatures derived from immunogenic cancer cell death associate with improved survival of patients with lung, breast or ovarian malignancies: a large-scale meta-analysis. Oncoimmunology. 2016;5(2):e1069938. doi:10.1080/2162402x.2015.1069938
14. Wilkerson MD, Hayes DN. ConsensusClusterPlus: a class discovery tool with confidence assessments and item tracking. Bioinformatics. 2010;26(12):1572–1573. doi:10.1093/bioinformatics/btq170
15. Smyth GK, Ritchie M, Thorne N, Wettenhall J. LIMMA: linear models for microarray data. In: Bioinformatics and Computational Biology Solutions Using R and Bioconductor. Statistics for Biology and Health. 2005.
16. Liberzon A, Subramanian A, Pinchback R, Thorvaldsdóttir H, Tamayo P, Mesirov JP. Molecular signatures database (MSigDB) 3.0. Bioinformatics. 2011;27(12):1739–1740. doi:10.1093/bioinformatics/btr260
17. Subramanian A, Tamayo P, Mootha VK, et al. Gene set enrichment analysis: a knowledge-based approach for interpreting genome-wide expression profiles. Proc Natl Acad Sci USA. 2005;102(43):15545–15550. doi:10.1073/pnas.0506580102
18. Huang da W, Sherman BT, Lempicki RA. Systematic and integrative analysis of large gene lists using DAVID bioinformatics resources. Nature Protocols. 2009;4(1):44–57. doi:10.1038/nprot.2008.211
19. Jia Q, Wu W, Wang Y, et al. Local mutational diversity drives intratumoral immune heterogeneity in non-small cell lung cancer. Nat Commun. 2018;9(1):5361. doi:10.1038/s41467-018-07767-w
20. Marcu A, Bichmann L, Kuchenbecker L, et al. HLA Ligand Atlas: a benign reference of HLA-presented peptides to improve T-cell-based cancer immunotherapy. J Immunother Cancer. 2021;9(4):e002071. doi:10.1136/jitc-2020-002071
21. Schaafsma E, Fugle CM, Wang X, Cheng C. Pan-cancer association of HLA gene expression with cancer prognosis and immunotherapy efficacy. Br J Cancer. 2021;125(3):422–432. doi:10.1038/s41416-021-01400-2
22. Xie D, Wang Q, Wu G. Research progress in inducing immunogenic cell death of tumor cells. Front Immunol. 2022;13:1017400. doi:10.3389/fimmu.2022.1017400
23. Madsen L, Kriegenburg F, Vala A, et al. The tissue-specific Rep8/UBXD6 tethers p97 to the endoplasmic reticulum membrane for degradation of misfolded proteins. PLoS One. 2011;6(9):e25061. doi:10.1371/journal.pone.0025061
24. Eastham MJ, Pelava A, Wells GR, Watkins NJ, Schneider C. RPS27a and RPL40, which are produced as ubiquitin fusion proteins, are not essential for p53 signalling. Biomolecules. 2023;13(6):898. doi:10.3390/biom13060898
25. Martínez-Martínez AB, Torres-Perez E, Devanney N, Del Moral R, Johnson LA, Arbones-Mainar JM. Beyond the CNS: the many peripheral roles of APOE. Neurobiol Dis. 2020;138:104809. doi:10.1016/j.nbd.2020.104809
26. Elvira B, Vandenbempt V, Bauzá-Martinez J, et al. PTPN2 regulates the interferon signaling and endoplasmic reticulum stress response in pancreatic β-Cells in autoimmune diabetes. Diabetes. 2022;71(4):653–668. doi:10.2337/db21-0443
27. Flosbach M, Oberle SG, Scherer S, et al. PTPN2 deficiency enhances programmed T cell expansion and survival capacity of activated T cells. Cell Rep. 2020;32(4):107957. doi:10.1016/j.celrep.2020.107957
28. Thompson DA, Wabara YB, Duran S, et al. Single cell analysis identifies distinct CD4 + T cells associated with the pathobiology of pediatric obesity related asthma. Sci Rep. 2025;15(1):6844. doi:10.1038/s41598-025-88423-4
29. Zhu Y, Su Y, Guo Y, et al. Current state of cancer immunity cycle: new strategies and challenges of using precision hydrogels to treat breast cancer. Front Immunol. 2025;16:1535464. doi:10.3389/fimmu.2025.1535464
30. Xiang S, Yang L, He Y, et al. Alpha-1 antitrypsin as a regulatory protease inhibitor modulating inflammation and shaping the tumor microenvironment in cancer. Cells. 2025;14(2):88. doi:10.3390/cells14020088
31. Bedard K, Attar H, Bonnefont J, et al. Three common polymorphisms in the CYBA gene form a haplotype associated with decreased ROS generation. Hum Mutat. 2009;30(7):1123–1133. doi:10.1002/humu.21029
32. Wang G, Liu X, You Y, Chen S, Chang X, Yang Q. Development and clinical validation of a seven-gene signature based on tumor stem cell-related genes to predict ovarian cancer prognosis. J Ovarian Res. 2024;17(1):58. doi:10.1186/s13048-023-01326-8
33. Pan X, Ma X. A novel six-gene signature for prognosis prediction in ovarian cancer. Front Genet. 2020;11:1006. doi:10.3389/fgene.2020.01006
 © 2025 The Author(s). This work is published and licensed by Dove Medical Press Limited. The
full terms of this license are available at https://www.dovepress.com/terms
and incorporate the Creative Commons Attribution
- Non Commercial (unported, 4.0) License.
By accessing the work you hereby accept the Terms. Non-commercial uses of the work are permitted
without any further permission from Dove Medical Press Limited, provided the work is properly
attributed. For permission for commercial use of this work, please see paragraphs 4.2 and 5 of our Terms.
© 2025 The Author(s). This work is published and licensed by Dove Medical Press Limited. The
full terms of this license are available at https://www.dovepress.com/terms
and incorporate the Creative Commons Attribution
- Non Commercial (unported, 4.0) License.
By accessing the work you hereby accept the Terms. Non-commercial uses of the work are permitted
without any further permission from Dove Medical Press Limited, provided the work is properly
attributed. For permission for commercial use of this work, please see paragraphs 4.2 and 5 of our Terms.
Recommended articles
Integration of Single-Cell RNA Sequencing and Bulk RNA Sequencing to Identify an Immunogenic Cell Death-Related 5-Gene Prognostic Signature in Hepatocellular Carcinoma
Peng L, Xu S, Xu JL
Journal of Hepatocellular Carcinoma 2024, 11:879-900
Published Date: 16 May 2024